Abstract
Double skin facade systems are known to be capable of preventing overheating in curtain wall buildings to a certain degree. The system induces the efficient blocking of sunlight using a center blind during the summer season. Moreover, it enables overheated air in the cavity layer to be sent outdoors, resulting in a reduction of the use of energy for cooling. However, double skin facade systems can be problematic, in that they must be opened according to seasonal conditions to achieve greater energy consumption efficiencies. In current double skin facade systems, the width of the cavity layer was too wide for residents to easily operate the system. When considering this, research on an easy-to-open 270 mm slim-type double skin window (SDSW) was undertaken in order to confirm its energy efficient performance. First, official testing based on the KS L 9107 Standard was undertaken to analyze solar heat gain coefficients (SHGC) and the cavity air temperatures, according to the open and close conditions of the SDSW’s external windows, enabling an analysis of the effect that the opening of windows had on reducing cooling energy needs. Next, SHGCs and cavity air temperatures were studied according to the different opening conditions of the SDSW’s external window to analyze the most optimal effects on cooling energy reductions by Computational Fluid Dynamics (CFD).
1. Introduction
Aluminum curtain wall systems offer aesthetic advantages based on the visual properties of glass and aluminum, as well as a sense of space that is provided by such systems. Because of this, they have been widely applied in many commercial-purpose buildings. However, curtain wall windows, which are composed of aluminum frames, have poor thermal performance during the winter, and also have the problem of excessive acquisition of sunlight though the light permeating glass area during the summer. This may lead to reduced comfort levels for building residents. In particular, the problem of the excessive indoor heat of curtain wall buildings (due to the acquisition of solar heat during the summer season) has led to such buildings being infamously dubbed ‘Steam Cooker Buildings’ [1]. But, depending on the physical properties that are determined through its compositional materials, the performance of a window as an envelope can vary [2]. Double skin facade systems are known to be capable of overcoming some of the disadvantages of such existing curtain wall systems [3]. For example, when blinds are raised during the winter season, the sunlight passing the cavity layer of a double skin facade system produces a thermal resistance that can further be utilized to reduce the load on the heating system. In addition, the system induces the efficient blocking of sunlight using a blind during the summer season, and arranges for overheated air in the cavity layer to be sent outdoors, resulting in a reduction in the energy consumption needed for cooling [4,5,6]. As this might suggest, the opening conditions of windows and blinds of double skin facade systems are different in each season in order to reduce the energy consumption. Although the operation of program-based automated controls could provide the greatest effectiveness in terms of reduction of energy consumption, cost considerations, and several other practical problems make it difficult for automated control systems to be adopted across all the curtain wall systems. For these reasons, in reality, actual applications of double skin facades in buildings are not only often incapable of producing the optimal results, but lead to a greater consumption of energy for cooling due to excessive heat. When considering this, a double skin window system, in which building residents can easily open the inner and external windows, is needed; for this to be possible, the system must have a slim thickness. Nevertheless, in most double skin facades that are applied to buildings thus far, this distance between the internal window and external window is quite significant, creating extreme inconvenience for users who wish to open the external window and a subsequent lack of management. The Slim-Type Double Skin Window System (SDSW) studied in this research has a thickness of 270 mm and is composed of horizontally sliding interior windows and project windows on the outdoor side. In addition, a blind is installed in the space between the indoor and outdoor facing the windows. When compared to the double skin facade systems generally in use, this system is relatively thin, and thus provides convenience for users in opening the windows from indoors. However, for this SDSW to be applied to actual buildings, further quantitative performance evaluations must be considered, in addition to its usability. To analyze the effects of windows on the energy consumption needed to heat and cool buildings, two main concepts—U-Value and Solar Heat Gain Coefficient (SHGC)—were applied. SHGC is stated to be ‘The total solar energy transmittance’ in ISO 15099, and the ratio of solar heat gain through window to incident solar heat, containing transmitted, absorbed and radiated heat [2]. The solar heat gain is mentioned as a key parameter for minimizing the building’s energy consumption in summer [7]. To study the methods of overcoming excessive heat during the summer season, SHGC, a numeric value representing the degree of sunlight acquisition, is considered to be more important as compared to U-Value [8]. This is because the U-Value deals with heat loss according to the difference between the indoor and outdoor temperatures. In consideration of this, SHGC analysis was needed to undertake a further quantitative performance analysis regarding the reduction effects of summer cooling loads. Although a variety of international standards exist to calculate SHGC according to window compositions, until recently there were no international standards on the measurement methods for experiments (ISO 19467 [9] was registered as an international standard in April, 2017). In the Republic of Korea, a standard on this was first registered as a Korean Standard (KS) in 2014, and, as a result, there is not much experiment data. This research first performed official testing of the SDSW according to KS L 9107 [10] to identify the effects of opening windows through calculating the SHGCs, and the optimal method of opening windows to achieve effective reductions in energy consumption for cooling was analyzed.
2. Literature Review on SHGC Studies
International standards that are used to calculate SHGC vary according to the composition of windows. The international standard, ISO 15099, is regarded as the representative standard for evaluating the SHGC of an entire window consisting of its glass, shading devices, and frame. Apart from the method of calculating SHGC, until very recently, there had been no international standards concerning the criteria for experiments, as mentioned above. As a result, a variety of standards and research exist with regard to the devices and experimental conditions of real model tests [11,12,13,14]. Marinoski et al., devised a calorimeter for solar heat gain calculation of fenestrations [11], and Platzer analyzed the testing procedure with the comparison between calorimetric measurements and modeling [12]. Chen et al., presented not only a calorimetric box complying with international standards, but also how to measure SHGC of semi-transparent photovoltaic modules with the calorimetric box [13,14]. Research regarding SHGC performance analysis can be broadly divided into real model tests and simulation evaluations. There are a variety of real tests to measure SHGC [15,16,17], concerning which Kuhn proposed measurement methods and theoretical methodologies to measure total heat volumes of SHGC, according to various permeable materials, transparent insulation materials, sunlight adjusting systems, and solar heat systems [17]. In addition to this, the effects of sunlight adjusting systems on cooling system loads have been investigated through a number of research efforts to quantitatively analyze SHGC according to blind conditions (such as venetian [18], horizontal [19], curved venetian blinds [20], and the blind slat angles). Following the development of KS L 9107 in the Republic of Korea in 2014, a number of real model tests applying KS L 9107 were conducted [21,22]. Kim et al., applied the KS L 9107 Standard to measure the SHGC of different types of indoor/outdoor blinds and types of glass, and thereafter, when compared the findings with the results of a simulation that was performed using the Window 7.2 program [23], and found that there was a significant degree of conformity [21,22]. However, cavity layer heat transfers that are caused by external window opening of double skin facade systems vary according to the differences between the outer air temperature and the air temperature in the cavity layer, and the pressure differences between the upper and lower areas of the cavity. In other words, a three-dimensional heat flow simulation is needed for a more in-depth analysis of thermal performance in the cavity. In particular, Parra et al., stated the difficulty of the predicting the thermal performance of the double skin façade, and the usefulness of Computational Fluid Dynamics (CFD) when analyzing the heat transfer of it [24]. They mentioned that CFD was suitable for modeling heat transfer phenomena such as conduction, convection, and radiation heat transfer. When considering this, many researchers have attempted to use Computational Fluid Dynamics (CFD) to assess the behavior of such thermal activity [24,25,26,27,28]. In addition, research concerning the use of heat in the cavity has been implemented to identify the effect on building energy consumption. Carlos and Corvacho analyzed differences in temperature, ventilation, and heat flow, according to solar radiation heat through a double window capable of ventilation [28]. In the research, they identified the characteristics in terms of changes in SHGC that is associated with the type of glass and window area ratios. Moreover, Bueno et al., pursued a means of reducing energy consumption by directly linking the HVAC system and the heated or cooled air in the cavity layer [29]. As can be found through the work above, blind conditions and air cavity heat treatment of the double skin have an effect on SHGC values. This affects the ability to reduce energy consumption for cooling purposes. For this reason, further research is continuously being undertaken to study the behaviors of such thermal activity or the use of such air cavity heat of the double skin. However, as can be noted from what has been mentioned above, studies concerning slim type double skin facade systems have been rare, in spite of the energy saving effects that are related to building resident convenience. To address this need, this research conducted KS L 9107 testing of the SDSW with 270 mm slim thickness and, analyzed the effects that the opening of external windows had on the reduction of energy consumption for cooling. As the next step, CFD was carried out to calculate SHGC according to external window operational methods. Using the results, cavity air temperatures were then analyzed to study the optimal method of opening the external windows for cooling-energy reduction. There are three reasons for the use of CFD instead of performing certified tests for all scenarios.
- Despite of the credibility of the results obtained by the certified tests, the testing condition is not same as actual climate.
- The certified tests are time-consuming work because these should be carried out in certified laboratories.
- The window sample size for the testing is limited due to the limitation of the test rig size. The size is not suitable for tests with various conditions.
Accordingly, CFD with various external window open/close conditions were performed to identify SHGCs and cavity air temperatures in real climate.
3. Experimental and Computational Method for SHGC Analysis
3.1. Experimental Method by KS L 9107
Depending on the configuration of the window, there are various international standards for SHGC calculation. Representative examples include ISO 9050 [30], which is an SHGC calculation method for glass without frame and a blind, and EN 13363-1 [31] and 13363-2 [32], which calculate the SHGC of the entire window, including a blind and frame. For SHGC measurement through an experiment, an international standard has very recently been established, and thus various measurement devices and test conditions are being applied. The principle of the test is to minimize the quantity of heat other than solar heat gain through the window by controlling the temperature within an indoor chamber so that it can be identical to the outdoor air temperature. The measurement device with a sunlight tracking function has the problem of availability, regardless of the degree of research progress. For this reason, studies have been actively performed on an indoor SHGC measurement device using an artificial light source. Representative examples include NFRC from the United States, IFT and ISE from Germany, and BRI from Japan. NFRC suggested NFRC 200 and 201 in relation to SHGC, and these are actively applied in North America [33]. In Korea, KS L 9107 is currently being applied, and the analysis method is as follows.
KS L 9107 defines test methods for the SHGC measurement of window and glass using an artificial light source. Based on this method, the SHGCs of various fenestration products can be analyzed, such as diverse kinds of glass and blinds for the adjustment of solar heat introduction, a door with a blind, a translucent panel, and a window with the installation of a glass film. According to KS L 9107, SHGC is determined by: (1) the total solar heat gain (Qtotal, the net density of heat flow rate through the test specimen with irradiance); (2) the heat transmission (Qsp, the net density of heat flow rate through the test specimen due to thermal transmission, without irradiance when the temperature difference between internal side and external side is the specified condition); and (3) the solar radiation heat quantity (Qsolar, the net density of heat flow rate of incident radiation). The net solar heat gain transferred to the interior after passing through the test specimen is as shown in Equation (1). Also, the heat transmission can be calculated using Equation (2).
- Qtotal: The net density of heat flow rate through the test specimen with irradiance (W/m2);
- Qsolar: The net density of heat flow rate of incident radiation (W/m2);
- Qsp: The net density of heat flow rate through the test specimen due to thermal transmission without irradiance when the temperature difference between internal side and external side is the specified condition (Tcc − Tmb) (W/m2).
- U: U-factor (W/m2·K);
- Asp: Area gained solar heat (m2);
- Tcc: Air temperature of the Climate Chamber (°C);
- Tmb: Air temperature of the Metering Box (°C).
Figure 1 shows the test measurement device for measuring SHGC, and a diagram that summarizes the relationships between the metering box and the variables in Equations (1) and (2). As shown in Figure 1, the test device is equipped with a solar simulator, a climatic chamber, a metering box, and a fan that can adjust the indoor/outdoor surface heat transfer rate.
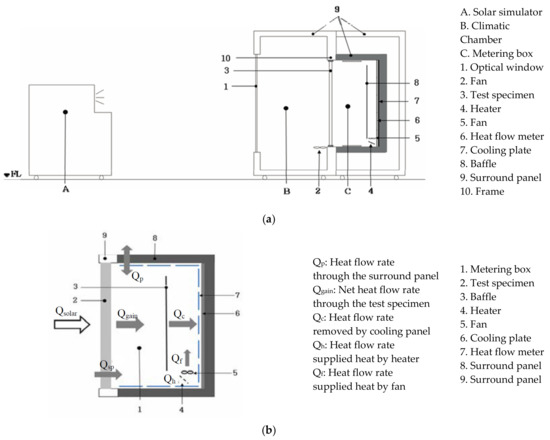
Figure 1.
Solar Heat Gain Coefficient (SHGC) test rig [10]. (a) SHGC measurement apparatus; (b) Principle of solar heat gain measurement.
Table 1 summarizes the test conditions of the solar simulator and climatic chamber for implementing the external environment. A steady state needs to be maintained, in which the test conditions in Table 1 do not decrease or increase with time. In addition, the rates of change for the heat flow meter, calorimeter, and heater are less than ±3% during 10 min.

Table 1.
Testing conditions for the Climatic chamber and the Metering box.
In order to ensure the reliability of the results, calibration certificates of the main apparatus have been checked such as climatic chamber, metering box, and the temperature controllers.
The measurement uncertainties of the apparatuses were investigated in the confidence level p = 95%. As indicated in Table 2, the measurement uncertainty of each apparatus was analyzed as less than 2 °C for climatic chamber and metering box. In addition, 0.2 °C of uncertainty was measured for the temperature controllers in the confidential level p = 95% as well.
Table 2.
Measurement uncertainties of climatic chamber and metering box.
3.2. Computational Fluid Dynamics (CFD)
Heat flow analysis of SDSW caused by solar heat was carried out using STAR-CCM+ [34], a three-dimensional (3D) thermal fluid dynamics analysis program. In this analysis, the following partial differential equations are adopted as a governing equation deduced from the law of conservation of mass and the law of conservation of momentum.
- Equation (3): Continuity equation;
- Equation (4): Momentum equation;
- Equation (5): Energy equation.
Buoyancy due to density change is applied in Equation (5) as a form of body force (fb). It is because calculations by CFD in this article include natural convection heat transfer by radiation. In addition, mass (Su) and energy (SE) source term are not specified, and angular momentum (ω) is not applicable to this calculation.
A radiation model was applied to analyze heat gain due to solar heat. In addition, a solar load model was used for the consideration of solar incidence angles and window opening effects. The CFD model to which the radiation model was applied presents a three-dimensional shape, as shown in Figure 2. This separates the window front and back side adjacent spaces into indoor and outdoor spaces with a rectangular polyhedron shape.
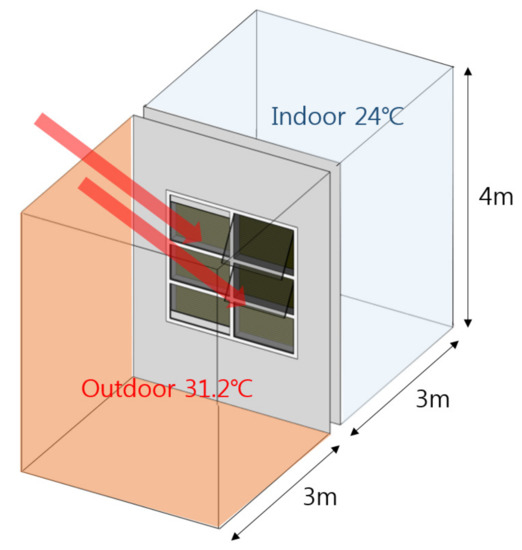
Figure 2.
Space layout of fluid domain.
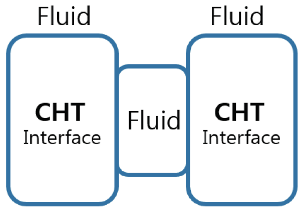
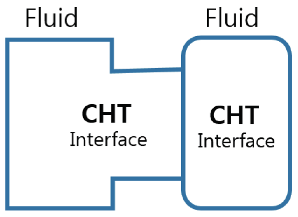
For cases in which the cavity layer is enclosed, despite each fluid space being composed of the same gases, the mutual transfer of substances does not occur but the heat transfers through convection from the surface of solids, such as the frame or the glass. Conjugated Heat Transfer Interface (CHT Interface) is a boundary condition presenting heat transfer without substance transfers. In this study, depending on the operational methods of the window, two types of CHT Interface configurations were applied, as shown in Table 3.
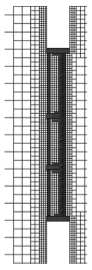
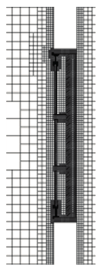
Table 3.
Domain Layouts.
As indicated in Table 3A, the space is enclosed and heat transfer occurs due to convection and surface conduction without any mutual substance transfers, with the exception of radiation. In the table B scenario, substance transfer occurs due to the outdoor air and cavity layer being connected. According to the method in which the above analyzed space was formulated, a 3D finite volume element grid network was developed. Moreover, a trimmed mesher of Star-CCM+ was applied to develop rectangular polyhedron shaped cells as the space for analysis.
4. KS L 9107 Test for SDSW
4.1. Simulation Model for KS L 9107 Test
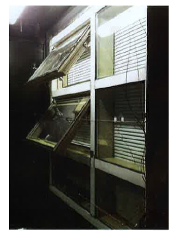
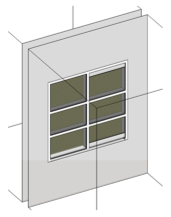
A specimen of SDSW was manufactured for a KS L 9107 test. As shown in Figure 3, the test specimen is a double-skin curtain wall aluminum window, which has a width of 1.5 m, a length of 1.5 m (due to the limit of the chamber size), an area of 2.25 m2, and a breadth of 270 mm.
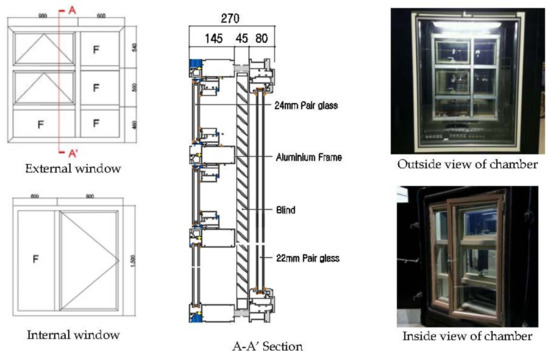
Figure 3.
Slim-Type Double Skin Window System (SDSW) system for SHGC test.
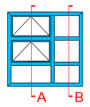
The SHGC test of SDSW was conducted at the Korea Environment & Merchandise Testing Institute, based on the test method specified in KS L 9107. Openings were placed at the center part and upper part of the external window, and a white aluminum blind with 25 mm slats was installed between the windows. For the internal windows, a casement window was installed. Tests for three cases were conducted to identify SHGCs of the SDSW, as indicated in Table 4.
Table 4.
Setting conditions for blind and external opening.
In KS Case 1, all of the windows are closed with a sealed structure. The blind in KS Case 1 is pulled up, and thus solar radiation is introduced to the interior with little hindrance. In KS Case 2, all of the windows are closed with a sealed structure, as in KS Case 1.
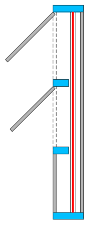
However, the blind is pulled down within the SDSW cavity, which blocks the irradiation from reaching the interior. In KS Case 3, the external window is opened so that the heated air within the cavity can be discharged to the exterior, and the blind within the air cavity is pulled down, as in KS Case 2.
The test was conducted in summer conditions, as indicated in Table 1. To examine the cavity air temperatures of the SDSW, thermocouples were installed at each height of the air space, and the temperatures for each part were measured.
Then, the temperature distributions for each part were measured, and the performance was evaluated for the three cases, as summarized in the next section.
4.2. Test Results
First, the test for measuring the heat transmission in Equation (1) that was mentioned earlier was carried out. According to the test method specified in KS L 9107, the solar heat gain is measured by the solar radiation with an irradiation intensity of 500 W/m2 at a Climate Chamber air temperature of 30 °C and a Metering Box air temperature of 25 °C. Table 5 summarizes the test results for each measurement item in KS Cases 1, 2, and 3.
Table 5.
Test items and results.
When a steady state was reached for each case, the three test conditions showed an irradiation intensity of 481–487 W, a Metering Box air temperature of 25.74–26.21 °C, and a Climate Box air temperature of 30.27–32.52 °C. The solar heat gains transmitted to the interior, from highest to lowest, were KS Case 1 (333.24 W), KS Case 2 (195.55 W), and KS Case 3 (73.17 W). The SHGCs were 0.302 in KS Case 1, 0.180 in KS Case 2, and 0.07 in KS Case 3. When compared to the solar heat gain of KS Case 1, the solar heat gain of KS Case 2 and KS Case 3 were decreased by 41.4% and 77.8%, respectively.
Table 6 shows the temperature distributions for each case when a steady state has been reached.
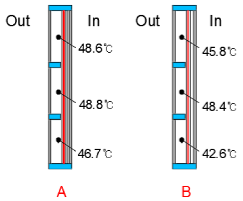
Table 6.
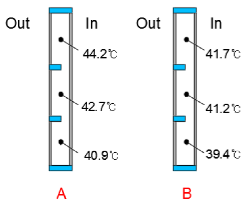
Cavity air temperature distributions of KS Cases 1, 2, 3 in SHGC test.
In KS Case 1, the temperatures of the left window cavity air were 44.2 °C at the upper part, 42.7 °C at the center part, and 40.9 °C at the lower part; and the temperatures of the right window air space were 41.7 °C at the upper part, 41.2 °C at the center part, and 39.4 °C at the lower part. Temperature stratification generally occurs in a sealed air space. In KS Case 1, the temperature differences between the upper and lower parts were 3.3 K for the left window and 2.3 K for the right window. The average temperature of the left window air space was 42.6 °C, which was approximately 1.8 K higher than that of the right window air space (40.8 °C). This could be because the left window has a relatively larger glass area than the right window. In KS Case 1, the air space is heated by part of the irradiated solar radiation heat quantity (1095.90 W), and the remaining solar radiation heat quantity (333.24 W) is transmitted to the interior.
Table 6 KS Case 2 shows the cavity air temperature distribution for KS Case 2 when a steady state has been reached. In KS Case 2, the temperature of the cavity air was the highest at the center part, and the temperature differences were 2.1 K for the left window and 5.8 K for the right window. The average temperature of the left window air space was 48.0 °C, which was approximately 2.4 K higher than that of the right window air space (45.6 °C). The air space is heated by a substantial part of the irradiated solar radiation heat quantity (1090.20 W) due to the blind in the air space, and the remaining solar radiation heat quantity (195.55 W) is transmitted to the interior. Interestingly, the average temperature of the air space was 5.1 K higher in KS Case 2 (46.8 °C) than in KS Case 1 (41.7 °C). It is thought that the heat gain that is transmitted to the interior in KS Case 2 was decreased by 190.2 W when compared to that in KS Case 1, but the temperature of the cavity air is increased accordingly.
Table 6 KS Case 3 shows the temperature distribution for KS Case 3 when a steady state has been reached. In KS Case 3, the temperature of the air space was high at the lower part, and the temperature differences were 5.1 K for the right window and 4.9 K for the left window.
The measurement results demonstrated that the installation of the blind and the external window opening (i.e., KS Case 3) was the most appropriate setting for cooling load reduction in the summer, as it blocked the introduction of solar heat to the interior and decreased the temperature of the air space.
5. Computational Fluid Dynamics (CFD) Simulation for SDSW
5.1. Simulation Model for CFD
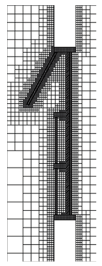
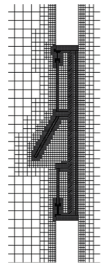
As indicated in the KS L 9107 test, there were significant differences in the SHGC of the SDSW based on whether the external windows were open or closed. As the next step, CFD with various external window open/close conditions were performed to identify the conditions that provide the optimal effects. Through the application of the trimmed mesh that was indicated in the previous section, the double skin window frame in the form of a rectangular polyhedron and the cavity layer were efficiently discretized to develop an analysis space appropriate for natural convection fluid dynamic analysis. Table 7 and Table 8 illustrate details of the CFD approach.
Table 7.
Numerical method details.
Table 8.
Computational grid around the cavity.
The blinds were set to have heat resistance through being set a baffle structure without thickness. In the radiation model that is used in this research, the reflection and scattering of radiant heat hitting the surface occurred in the same direction, omitting the scattering and absorption of the radiation heat in the air.
A validation study for reliability of CFD results was performed before case studies. The setup for KS Case 2 scenario (closed blinds with closed openings) was applied to CFD Case V with testing conditions in KS L 9107. As indicated in Table 9, internal heat gains of CFD Case V were measured as 95 W/m2 when the irradiation intensity was 500 W/m2, which is the value according to the KS L 9107. In addition, the SHGC of CFD Case V showed 5.6% of difference between KS Case 2. It means that the computational setup for CFD scenarios is appropriate for the analysis and the results with the setup are sufficiently reliable.
Table 9.
A validation study on Computational Fluid Dynamics (CFD) Case 1.
The SDSW model for the CFD is composed of internal windows, cavity layer, and external windows as the specimen for the KS L 9017 test. Unlike the KS cases, there are two external windows in the middle part in order to create different alternatives that are suitable for comparison of the ventilation effects.
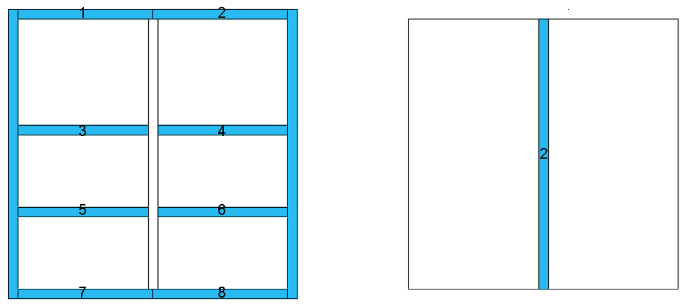
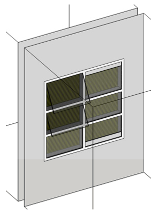
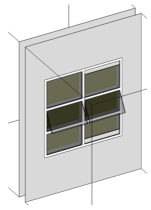
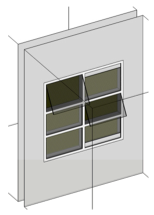
As presented in Figure 4, the SDSW model for CFD has a window area of 4.08 m2 at a horizontal length of 2.02 m, a vertical length of 2.02 m, and a width of 270 mm. The external window consists of Low-E pair glass (transparent glass 5 mm + air space 14 mm + low-E glass 5 mm), and the internal window consists of pair glass (transparent glass 5 mm + air space 12 mm + transparent glass 5 mm). As shown in Table 10, the model was configured according to Seoul coordinates. The summer solstice was used as the point of reference to calculate cooling loads for the summer season.
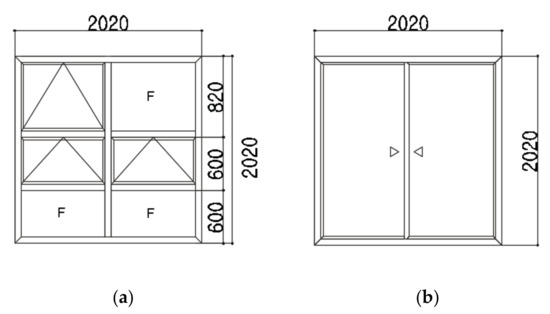
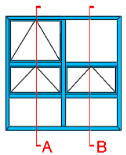
Figure 4.
SDSW model for CFD. (a) External window; (b) Internal Window.
Table 10.
Solar model input data.
According to the ISO 15099 standard, simulations were undertaken to reflect the heat transfer performance of each part of the model. For the window frame analysis, the frames were separated in cross section forms in accordance with NFRC (National Fenestration Rating Council) standards [35]. The heat transfer rates regarding the frame sections were calculated using THERM 6, the official calculation tool of NFRC. As boundary conditions, the test conditions of the KS standard KS F 2278 [36] ‘Standard test method for thermal resistance for windows and doors’ were applied, and the results of U-value conversion to thermal conductivity are as shown in Table 11.
Table 11.
Frame Conductivities of SDSW calculated by LBNL THERM 6.
To perform the simulations, input conditions were adjusted to allow for optical characteristics, such as heat conductivity, permeation rate, absorption rates, reflectance rates of the glass, and frame. The optical characteristics were calculated using WINDOW 6, a software program developed by the Lawrence Berkeley National Laboratory. The calculation results are indicated in Table 12.
Table 12.
Glass Properties of SDSW model.
Under the conditions established above, this research aimed to understand the heat flow indoors during the summer season according to the open/closed condition of the external windows. The slat angle was set to 45 degrees, which was a condition capable of blocking direct sunlight and allowing the entry of scattered sunlight caused by the reflections of the blind surfaces.
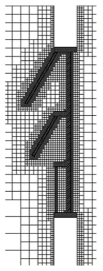
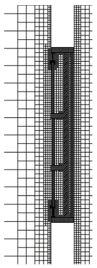
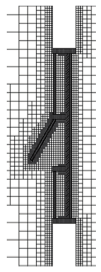
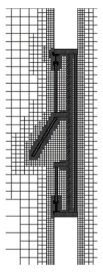
Four types of simulations were undertaken, including CFD Case 1, which was set as the baseline with all the windows closed, as shown in Table 13.
Table 13.
Cases for CFD.
The case of CFD Case 1 involved conditions in which the external window was closed; CFD Case 2 involved conditions in which the middle left window and upper windows were open; CFD Case 3 involved conditions in which both middle windows were open; and, CFD Case 4 involved conditions in which the upper and lower windows were open diagonally.
5.2. Simulation Results
The incidence angle of the sunlight was directed at an altitude of approximately 76° with a strength of 1283 W/m2. When this is converted to a vertical unit of the wall surface, it amounts to 309.29 W/m2, and the total heat radiation on the window area can be calculated as 1261.94 W.
This sunlight volume first heats the glass surface and frame surface exposed outdoors. The solar heat transmission passes through the glass and heats the cavity air, inner frame, and the blind. The sunlight acquisition of indoors was found to be 167 W for CFD Case 1, 108.7 W for CFD Case 2, 109.6 W for CFD Case 3, and 96.7 W for CFD Case 4 (Table 14).
Table 14.
CFD conditions and results.
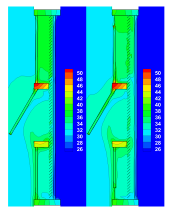
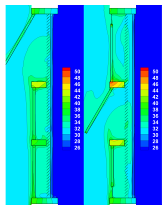
SHGC for CFD Cases 1, 2, 3 and 4 was measured as 0.132, 0.086, 0.087, and 0.077, respectively. When compared to CFD Case 1, CFD Case 2 and Case 3 acquired approximately 35% less solar heat, while CFD Case 4 acquired approximately 42% less solar heat. CFD Case 2 and CFD Case 3 did not present any notable differences. However, the case of CFD Case 3, in which both middle windows were opened, presented slightly larger indoor flow volumes. For CFD Case 4, in which the upper and lower windows were opened diagonally, the indoor solar heat inflow rate was approximately 7% lower than CFD Case 2 and Case 3. Based on the results above, the opening of the upper and lower windows in a diagonal direction was considered to be the most effective means of disposal of the heated cavity air. Table 15 presents a diagram comparing the cavity layer temperatures in each case.
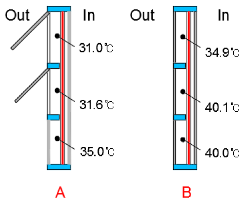
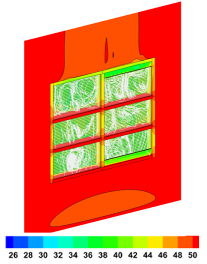
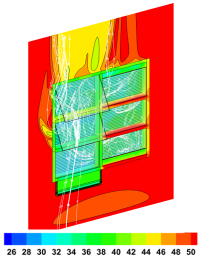
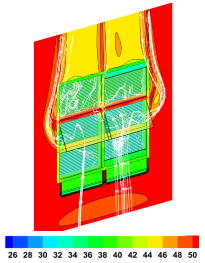
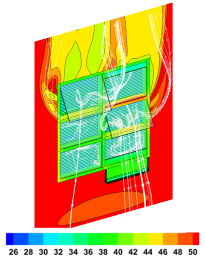
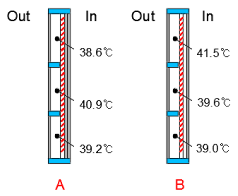
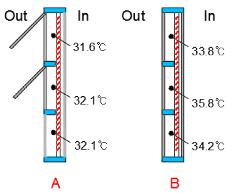
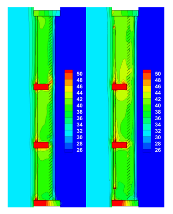
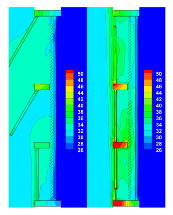
Table 15.
Temperature distributions of CFD Cases.
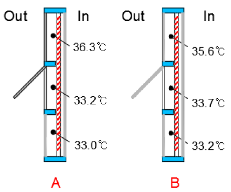
In CFD Case 1, left window cavity air temperatures were calculated as 38.6 °C, 40.9 °C, and 39.2 °C for the upper area, the middle area, and the lower area, respectively. Right window cavity air temperatures were recorded as 41.5 °C, 39.6 °C, and 39.0 °C for the upper area, the middle area, and the lower area, respectively. Average temperature of the cavity air was recorded as 39.8 °C, and the right window cavity layer had an average temperature that was 0.4 K higher than that of the air in the left window cavity, in which the difference between the maximum and minimum value was 2.9 K.
In CFD Case 2, average temperature of the cavity layer was recorded as 33.3 °C, which was 6.5 K lower than in CFD Case 1. The average temperature difference between the left and right window cavity layer temperatures was 2.7 K when the right window did not have an open window. The left window average was 31.9 °C and the right window average was 34.6 °C. The difference between maximum and minimum values was 4.2 K, when the right side middle area without an open window presented the highest values.
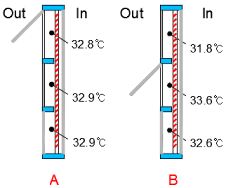
In CFD Case 3, average temperature of the cavity layer was recorded as 34.2 °C, which was the same for both left and right cavity air space. The lower cavity air presented a temperature difference within 0.5 K and the middle cavity air presented a similar temperature, which indicated that the ventilation was effective in the lower part. The difference between maximum and minimum values was 3.3 K, which was lower than the 4.2 K difference in CFD Case 2. However, the maximum value was 36.3 °C, which was 0.5 K higher than the maximum of value 35.8 °C for CFD Case 2. In the case of the upper parts of CFD Case 3, the upper cavity air presented temperatures that were 1.9–3.1 K higher than the middle cavity air temperatures, which indicated that the ventilation was not sufficiently effective.
In CFD Case 4, a cavity layer average temperature of 32.8 °C was recorded, which was almost the same as the left window average of 32.9 K and right window average of 32.7 K. The difference between maximum and minimum values was also within 1 K, and of the four test conditions, CFD Case 4 was found to be most effective in terms of the cooling load reduction.
6. Discussion
This study aimed to investigate the possibility of achieving a reduction in cooling energy use by studying various external window opening conditions in an SDSW. To this end, official testing, as per KS L 9107, was first undertaken to study the possibility of energy saving based on the opening of the SDSW. Next, SHGCs and cavity air temperatures were measured and analyzed in the various conditions of the blind and external window opening. KS Case 1 was the baseline for the testing with no blind and all of the windows closed. The results of the analyses performed according to the KS L 9107 testing are as follows.
- Based on the adjusted test conditions, SHGCs of 0.3, 0.18, and 0.07 were measured for KS Cases 1, 2 and 3, respectively. The SHGC of KS Case 3, in which blinds were lowered and external windows were opened, was 77% lower when compared to KS Case 1, and 40% lower when as compared to KS Case 2.
- The cavity air temperatures of KS Case 2 reached a maximum of 48.8 °C. This value was 4.6 K higher than the maximum cavity air temperature of KS Case 1, and average cavity air temperature was found to be 5.1 K higher as well. This was analyzed to have been caused by the rise in cavity air temperature due to sunlight reflected from the blinds. This indicates that the cavity air in double skin facade systems could obtain excessive heat unless the middle blind appropriately incorporates a ventilation function.
- Looking at the cavity air temperature of KS Case 3, the average was found to be 11.4 K lower than KS Case 2 and 6.3 K lower than KS Case 1. Despite KS Case 2 presenting cavity air temperature differences of 12.6–18.8 K when compared to outdoor temperatures, in KS Case 3, the temperature difference with the outdoors was only 0–8.1 K, showing an effect of preventing excessive heating of the cavity air.
Next, CFD was performed to investigate reductions in required cooling energy depending on a variety of window opening conditions. The solar solstice was set as the test condition for the CFD. CFD Case 1 was the baseline for the CFD with all of the windows closed. To undertake a comparative analysis, the blind condition of CFD Case 1 was same as other CFD Cases. The results of analyses according to the CFD are as follows.
- Based on the adjusted CFD conditions, SHGCs were calculated as 0.132, 0.086, 0.087, and 0.077 for CFD Cases 1, 2, 3, and 4, respectively. The SHGCs of CFD Cases 2 and 3, in which the two-left windows (upper and lower) were open and the two-middle windows were open, respectively, were approximately 35% lower when compared to CFD Case 1. In CFD Case 4, the scenario in which the upper left and right middle window were open in a diagonal direction, heat gains of the interior space were mitigated by approximately 43% as compared to CFD Case 1. This was the highest reduction in the interior heat gain, and resulted in the lowest cooling-energy consumption of the four CFD Cases that are described above.
- Solar heat gain of the interior space was found to be almost the same in CFD Cases 2 and 3. However, in CFD Case 3, the maximum cavity air temperature rose to 36.3 °C, which was found to be slightly higher than the 35.8 °C maximum temperature of CFD Case 2.
- In the case of the cavity air temperature of CFD Case 4, the temperatures were on average 7.03 K lower than in CFD Case 1, and 0.5–1.5 K lower on average than CFD Cases 2 and 3. The difference between maximum and minimum temperature of the cavity air for CFD Case 4 were found to be within 1 K, which varied significantly less when compared to CFD Case 2 (4.2 K) and CFD Case 3 (3.3 K).
These results demonstrate that the diagonal opening of CFD Case 4 was more effective than the other CFD Cases.
7. Conclusions
The scenario of KS Case 3, in which the blind was lowered and the external window was opened, showed an SHGC value that was 61% lower than KS Case 2, in which the external windows were closed. What was especially interesting to note was that KS Case 3 demonstrated an SHGC value that was as much as 77% lower than the KS Case 1, which had no blind and an external window that was closed. However, in KS Case 2, the cavity layer temperature rose to a maximum of 48.8 °C, which was 4.6 K higher than the 44.2 °C maximum temperature of KS Case 1. This indicated that if the double skin system and middle blinds did not appropriately incorporate a ventilation function, excessive heating of the cavity air would occur.
In the CFD Cases, there was 42% difference between the baseline CFD Case 1 and the CFD Case 4, a scenario in which the upper left and right middle window were opened in a diagonal direction. Up to a 7% difference was found in the SHGCs of CFD Cases 2, 3, and 4, depending on the different external window openings. In particular, CFD Case 4 showed a 7 K lower cavity air temperature on average when compared to the baseline, which was analyzed as being due to its effective ventilation performance. In addition, these analyses indicated the possibility that even when openings are in the same area, effects may differ depending on the location of the opening. Moreover, the SDSW could demonstrate sufficient cooling-energy reduction performance through the appropriate design of opening sizes and locations.
Acknowledgments
This study is a part of the research result conducted with research fund supporting in 2016 of Korea Institute of Energy Technology Evaluation and Planning. The project code: 20150687-001.
Author Contributions
Kyung-joo Cho and Dong-woo Cho analyzed the data and wrote the paper. All authors contributed substantially to all aspects of this article.
Conflicts of Interest
The authors declare no conflict of interest.
Nomenclature
| v | continuum velocity |
| vr | relative velocity |
| V | volume |
| a | area |
| t | time |
| ⊗ | kronecker product |
| p | pressure |
| I | unit vector |
| T | viscous stress tensor |
| fb | resultant body forces, such as gravity |
| heat flux vector | |
| SE | energy source, such as radiation sources |
| E | Total energy |
| H | enthalpy |
References
- Glass Curtainwall Buildings Are Giant Steamers … Be Wounded in Various Lawsuits. Available online: http://news.jtbc.joins.com/article/article.aspx?news_id=NB10153364 (accessed on 9 October 2017).
- International Organization for Standardization (ISO). Standard 15099. Thermal Performance of Windows, Doors and Shading Devices—Detailed Calculations; International Organization for Standardization (ISO): Geneva, Switzerland, 2003. [Google Scholar]
- Yilmaz, Z.; Çetintas, F. Double skin façade’s effects on heat losses of office buildings in Istanbul. Energy Build. 2005, 37, 691–697. [Google Scholar]
- Fallahi, A.; Haghighat, F.; Elsadi, H. Energy performance assessment of double-skin facade with thermal mass. Energy Build. 2010, 42, 1499–1509. [Google Scholar]
- Huckemann, V.; Kuchen, E.; Leão, M. Empirical thermal comfort evaluation of single and double skin facades. Build. Environ. 2010, 45, 976–982. [Google Scholar]
- Zhou, J.; Chen, Y. A review on applying ventilated double-skin facade to buildings in hot-summer and cold-winter zone in China. Renew. Sustain. Energy Rev. 2010, 14, 1321–1328. [Google Scholar]
- Kuhn, T.E. Calorimetric determination of the solar heat gain coefficient g with steady-state laboratory measurements. Energy Build. 2014, 84, 388–402. [Google Scholar]
- Dariush, A.; Howdy, G.; Joe, H.; Christian, K.; Robin, M. Performance Criteria for Residential Zero Energy Windows. ASHRAE Trans. 2006, 103, 176–185. [Google Scholar]
- International Organization for Standardization (ISO). Standard 19467; Thermal Performance of Windows and Doors-Determination of Solar Heat Gain Coefficient Using Solar Simulator; International Organization for Standardization (ISO): Geneva, Switzerland, 2017. [Google Scholar]
- Korean Standard. KS L 9107; Testing Method for the Determination of Solar Heat Gain Coefficient of Fenestration Product Using Solar Simulator; Korean Standard: Seoul, Korea, 2014. [Google Scholar]
- Marinoski, D.L.; Güths, S.; Lamberts, R. Development of a calorimeter for determination of the solar factor of architectural glass and fenestrations. Build. Environ. 2012, 47, 232–242. [Google Scholar]
- Platzer, W.J. Measurement of angular properties for complex glazings. In Proceedings of the Third International ISES Europe Solar Congress, Copenhagen, Denmark, 19–22 June 2000; pp. 19–22. [Google Scholar]
- Chen, F.; Wittkopf, S.K. Summer condition thermal transmittance measurement of fenestration systems using calorimetric hot box. Energy Build. 2012, 53, 47–56. [Google Scholar]
- Chen, F.; Wittkopf, S.K.; Ng, P.K.; Du, H. Solar heat gain coefficient measurement of semi-transparent photovoltaic modules with indoor calorimetric hot box and solar simulator. Energy Build. 2012, 53, 74–84. [Google Scholar]
- Deivis, L.; Marinoski, S.G.; Fernando, O.R.; Pereira, R.L. Improvement of a measurement system for solar heat gain through fenestrations. Energy Build. 2007, 39, 478–487. [Google Scholar]
- Lim, J.; Song, S. Evaluation on the Solar Heat Gain Coefficient of Glazing System installed in internal shading device by experiments according to the NFRC 201. J. Korean Solar Energy Soc. 2010, 30, 47–54. [Google Scholar]
- Kuhn, T.E. Solar control: A general evaluation method for facades with venetian blinds or other solar control systems to be used ‘stand-alone’ or within building simulation programs. Energy Build. 2006, 38, 648–660. [Google Scholar]
- Kim, C.; Kim, K. Evaluation of Thermal and Visual Environment for the Glazing and Shading Device in an Office Building with Installed of Venetian Blind. J. KIEAE 2015, 15, 101–109. [Google Scholar]
- Kim, S.H.; Shin, K.J.; Choi, B.M.; Jo, J.H.; Cho, S.; Cho, Y.H. A Study on the Variation of Heating and Cooling Load According to the Use of Horizontal Shading and Venetian Blinds in Office Buildings in Korea. Energies 2015, 8, 1487–1504. [Google Scholar]
- Chaiyapinunt, S.; Khamporn, N. Heat transmission through a glass window with a curved venetian blind installed. Sol. Energy 2014, 110, 71–82. [Google Scholar]
- Kim, T.; Choi, H.; Kang, J.; Park, J. Development and Evaluation of an Apparatus to Measure the Solar Heat Gain Coefficient of a Fenestration System According to KS L 9107. Korean J. Air-Cond. Refrig. Eng. 2014, 26, 512–521. [Google Scholar]
- Kim, T.; Kang, J.; Park, J. An Experiment Study on Performance Evaluation of Solar Heat Gain Coefficient in Glazing with Shading Device. J. Korean Sol. Energy Soc. 2014, 34, 89–99. [Google Scholar]
- Lawrence Berkeley National Laboratory (LBNL), WINDOW&THERM. Available online: windows.lbl.gov/software/ (accessed on 9 September 2016).
- Parra, J.; Guardo, A.; Equsquiza, E.; Alavedra, P. Thermal Performance of Ventilated Double Skin Facades with Venetian Blinds. Energies 2015, 8, 4882–4898. [Google Scholar]
- Manz, H.; Schaelin, A.; Simmler, H. Airflow patterns and thermal behavior of mechanically ventilated glass facades. Build. Environ. 2004, 39, 1023–1033. [Google Scholar]
- Gratia, E.; De Herde, A. Natural ventilation in a double—Skin facade. Energy Build. 2004, 36, 137–146. [Google Scholar]
- Colombo, E.; Zwahlen, M.; Frey, M.; Loux, J. Design of a glazed double-façade by means of coupled CFD and building performance simulation. Energy Procedia 2017, 122, 355–360. [Google Scholar]
- Carlos, J.S.; Corvacho, H. Evaluation of the performance indices of a ventilated double window through experimental and analytical procedures: SHGC-values. Energy Build. 2015, 86, 886–897. [Google Scholar]
- Bueno, B.; Street, M.; Pflug, T.; Braesch, C. A co-simulation modelling approach for the assessment of a ventilated double-skin complex fenestration system coupled with a compact fan-coil unit. Energy Build. 2017, 151, 18–27. [Google Scholar]
- International Organization for Standardization (ISO). Standard 9050; Glass in Building-Determination of Light Transmittance, Solar Direct Transmittance, Total Solar Energy Transmittance, Ultraviolet Transmittance and Related Glazing Factors; International Organization for Standardization (ISO): Geneva, Switzerland, 2003. [Google Scholar]
- European Standard. Standard 13363-1; Solar Protection Devices Combined with Glazing-Calculation of Solar and Light Transmittance. Part 1: Simplified Method; European Committee for Standardization: Brussels, Belgium, 2003. [Google Scholar]
- European Standard. Standard 13363-2; Solar Protection Devices Combined with Glazing-Calculation of Solar and Light Transmittance. Detailed Calculation Method; European Committee for Standardization: Brussels, Belgium, 2005. [Google Scholar]
- Jang, H.; Kim, H. SHGC Measurement system technology and patent trend. Build. Environ. Facil. 2013, 7, 34–39. [Google Scholar]
- Star-CCM+, 3D Thermal Fluid Dynamic Software Developed by SIEMENS. Available online: https://mdx.plm.automation.siemens.com/star-ccm-plus (accessed on 9 September 2016).
- National Fenestration Rating Council (NFRC). ANSI/NFRC 200-2014; Determination Fenestration Product Solar Heat Gain Coefficient and Visible Transmittance at Normal Incidence; National Fenestration Rating Council: Greenbelt, MD, USA, 2014. [Google Scholar]
- Korean Standard. KS F 2278; Standard Test Method for Thermal Resistance for Windows and Doors; Korean Standard: Seoul, Korea, 2017. [Google Scholar]


© 2018 by the authors. Licensee MDPI, Basel, Switzerland. This article is an open access article distributed under the terms and conditions of the Creative Commons Attribution (CC BY) license (http://creativecommons.org/licenses/by/4.0/).