Article

Impacts of Water Flow Rate on Freezing Prevention of Air-Cooled Heat Exchangers in Power Plants

Key Laboratory of Condition Monitoring and Control for Power Plant Equipments of Ministry of Education, School of Energy Power and Mechanical Engineering, North China Electric Power University, Beijing 102206, China
*
Author to whom correspondence should be addressed.
Energies 2018, 11(1), 112; https://doi.org/10.3390/en11010112
Submission received: 13 November 2017 / Revised: 13 December 2017 / Accepted: 25 December 2017 / Published: 3 January 2018

Abstract

:
Under cold ambient conditions, the freezing risk of air-cooled heat exchangers, especially the frontal finned tube bundles, has been a critical concern in power plants. Based on the freezing conditions of the cooling deltas under windy conditions, the flow and heat transfer characteristics of natural draft dry cooling system (NDDCS) with 30%, 40% and 50% increased water flow rates are investigated in this work, and the outlet circulating water temperatures of the easily freezing cooling deltas and sectors are obtained. The results show that the deltas in the middle front and rear sectors become free from freezing at all wind speeds when the circulating water flow rate is increased. For the frontal sector with increased water flow rate, the outlet water temperatures of deltas increase conspicuously at 4 m/s and 8 m/s, while as the wind speed rises to 16 m/s, these deltas still face serious freezing risks due to the huge heat rejection to ambient air. Therefore, freezing prevention of air-cooled NDDCS heat exchangers can be achieved by increasing the water flow rates at small wind speeds, while as the wind speed becomes high, the water flow redistribution is suggested for the frontal and middle sectors due to their big performance difference.

1. Introduction

With almost no additional consumption of water resource, NDDCS (Natural Draft Dry Cooling System) has been widely employed by power generating units in arid regions [1]. However, during cold winters, the circumferentially arranged aluminum delta-form heat exchangers under the tower shell may experience serious damage due to freezing [2], because the heat load of the circulating water can be easily removed by the cold ambient air. In fact, the freezing prevention issue has become the most critical bottleneck for the engineering application of NDDCS, especially in North China [3].
Recently, the anti-freezing water flow rates of sectors [4], switching off sectors [5], louver control [6], as well as simultaneous adjustment principle of circulating water and louver [7] which can all substantially contribute to the preventing freezing of NDDCS, have been numerically investigated. Besides, the pre-heating/peak cooler installation was also proposed for NDDCS [8]. These studies imply that the freezing risk of NDDCS is deeply related to the crosswinds and circulating water, which cause the heat transfer variations among all sectors. In such a case, it can be seen the outlet water temperatures of sectors will vary from each other.
As for the crosswind effects, many specific studies have been conducted. By introducing a non-dimensional parameter to present the heat rejection differences of various sectors under ambient winds, Ma et al. [9] found performance differences among the sectors, especially for the frontal and middle ones. Lu et al. [10] explored the wind effects by experiment with a 1:12.5 scaled cooling tower equipped with an electric heater as the horizontal heat exchanger based on a 15 m-tall small cylindrical prototype, and the experimental and numerical results showed good agreement. According to Yang et al. [11,12], the heat rejections of the upwind cooling deltas are higher than the rear ones, which accordingly results in lower outlet water temperatures, while the upwind and leeward deltas both present higher air-side cooling capacities than lateral ones. Zhao et al. [13] obtained the degree of deviation of inlet air for each cooling column under a designed crosswind of 4 m/s, clarifying the extremely large aerodynamic differences between the frontal and middle front deltas. Furthermore, Zhao et al. [14] enclosed the local air-side variable fields for each air-cooled sector at wind speeds of 4 m/s and 12 m/s, concluding that the lateral heat exchanger bundles have much more deteriorated flow fields, thus causing much higher outlet water temperatures. In order to restrain such adverse wind effects, wind breakers [15,16,17], pre-cooling [18], changed tower height and diameter [19,20], innovative combination [21], and heat exchanger deployment [22,23] have all been proposed in recent years, and were all proved effective to improve the cooling efficiency of NDDCS.
However, it must be pointed out that, for NDDCS operating in cold winter, how the heat transfer characteristics of various sectors vary versus water flow rate has not been disclosed yet, so this work concerns the flexible adjustment of water flow rates and the heat loads of sectors and the outlet water temperature of each delta are investigated for NDDCS with three cases with increasing water flow. The anti-freezing effects on various sectors are specifically analyzed and compared. What’s more, comparing the detailed outlet water temperature of each cooling delta, the water distribution [24,25,26] for air-cooled sectors may be recommended in order to achieve the anti-freezing protection and energetic operation of NDDCS.

2. Models

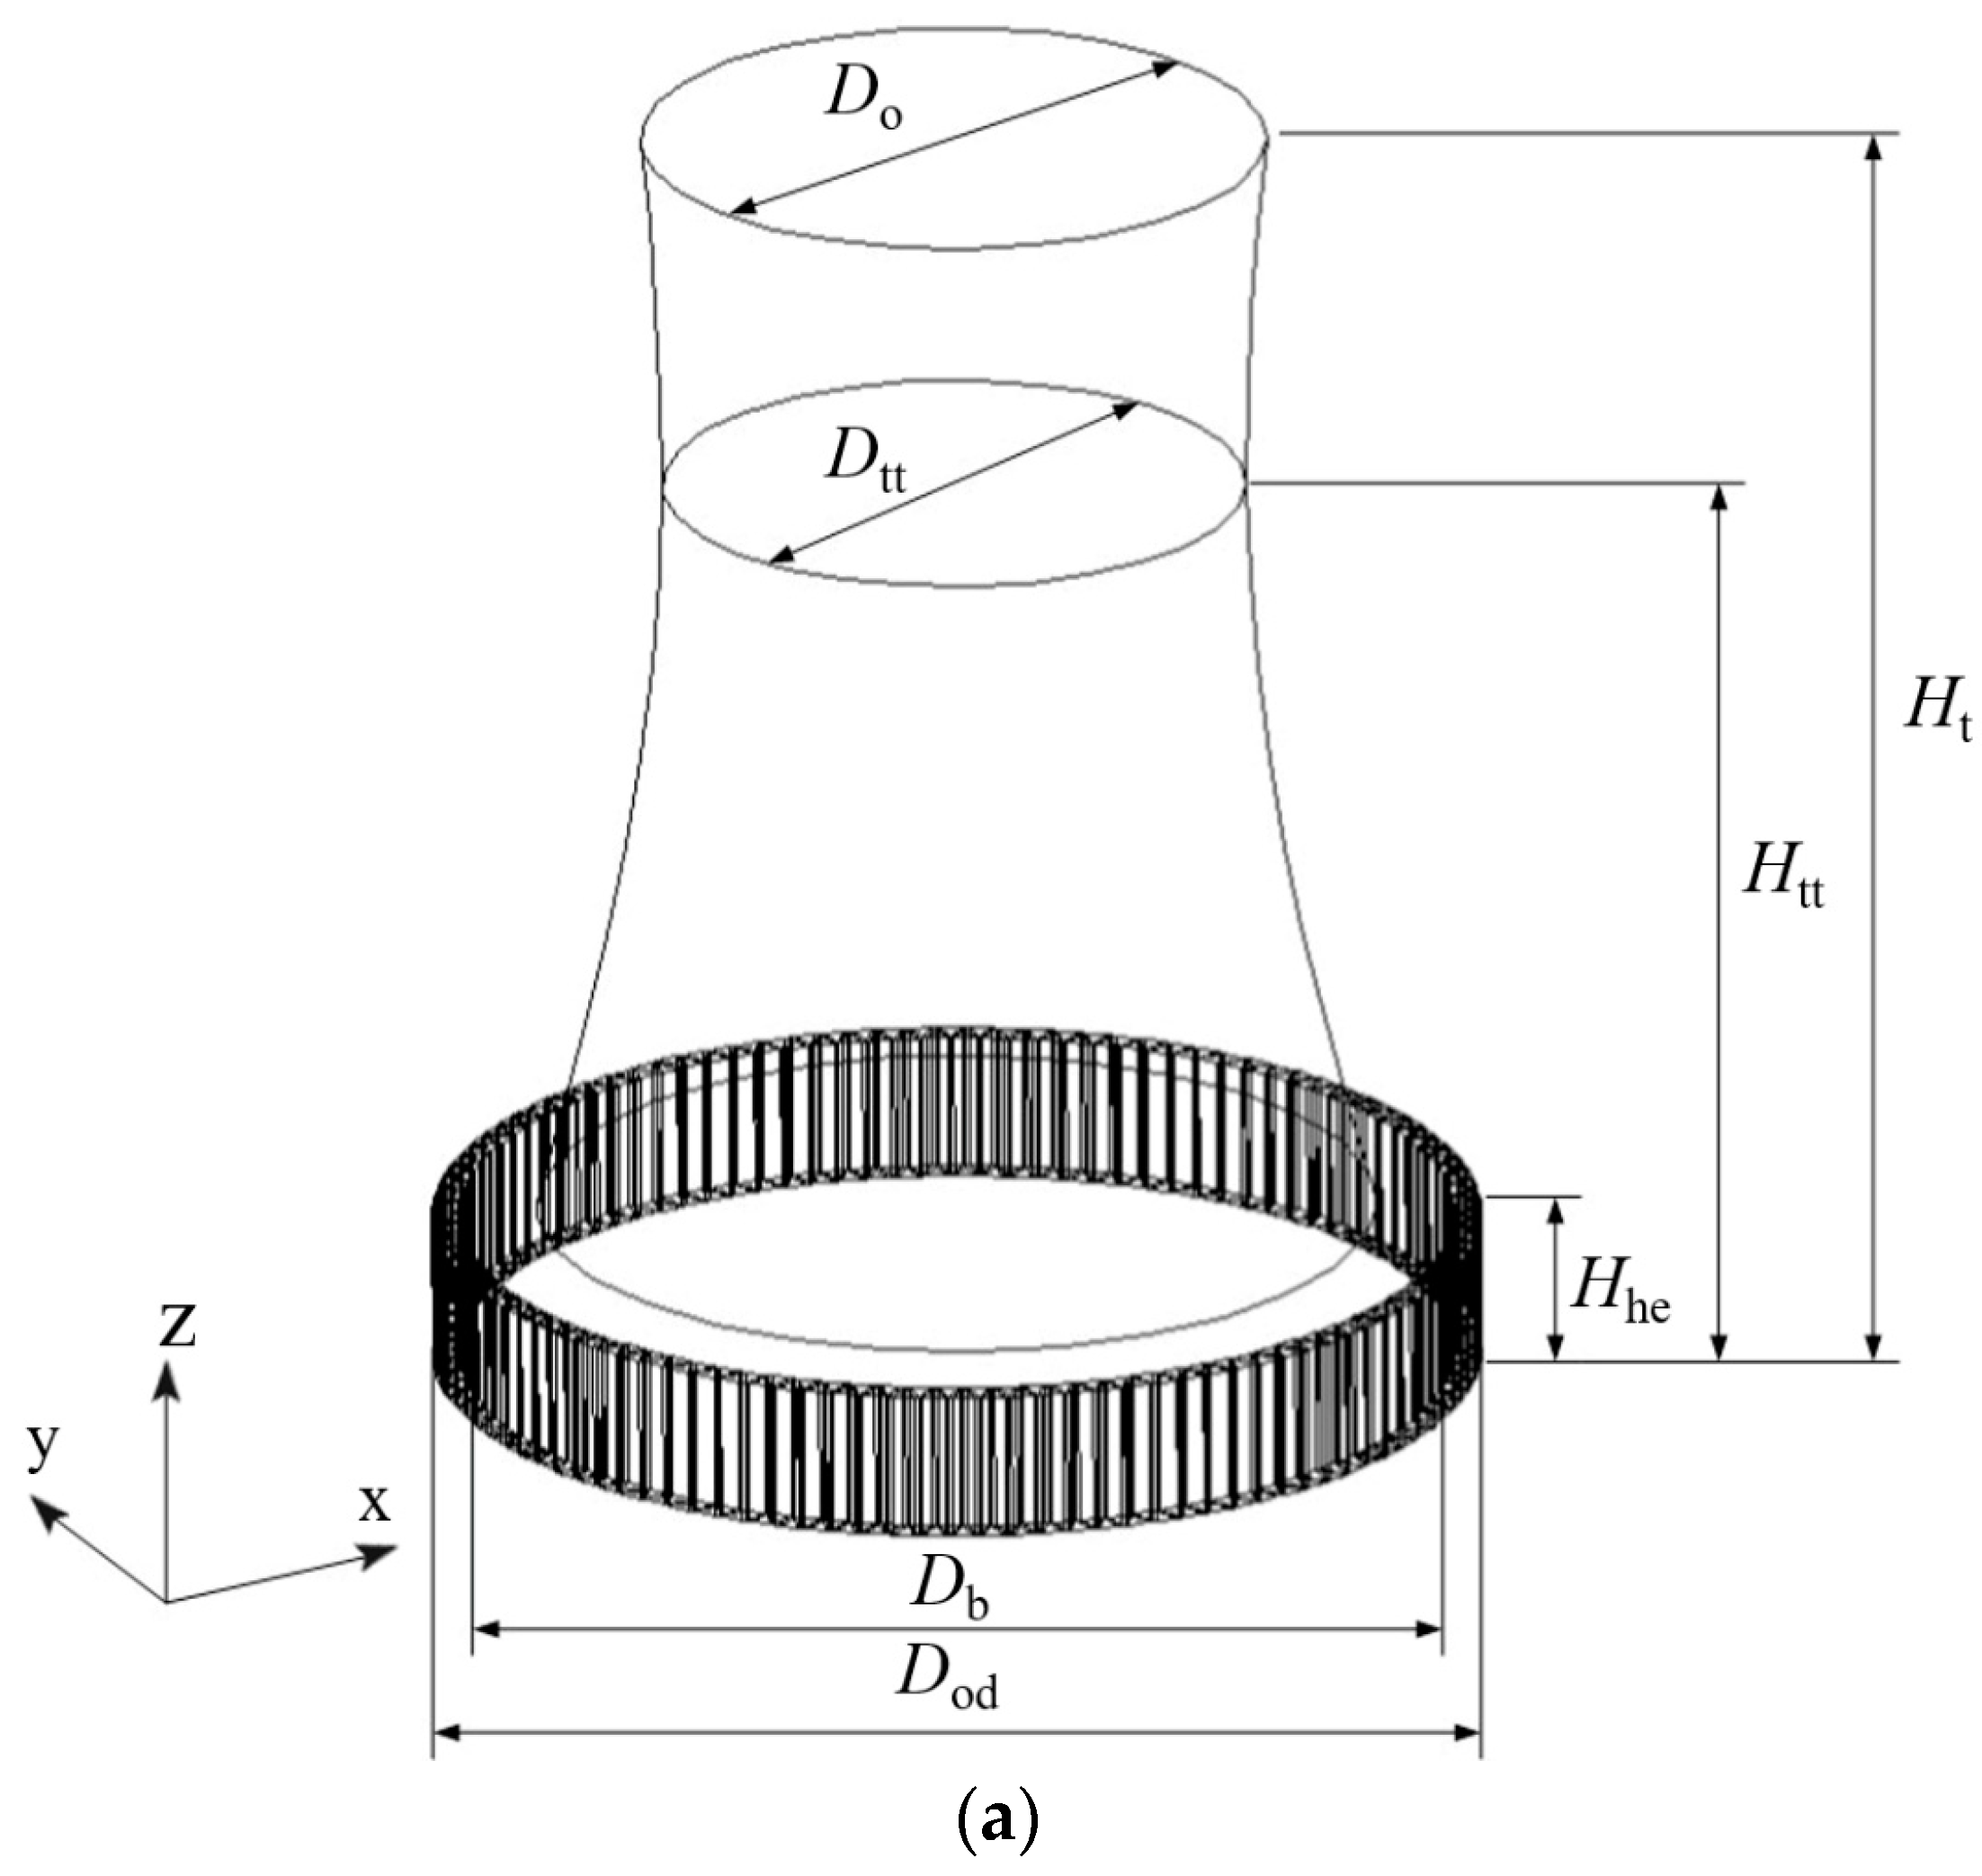
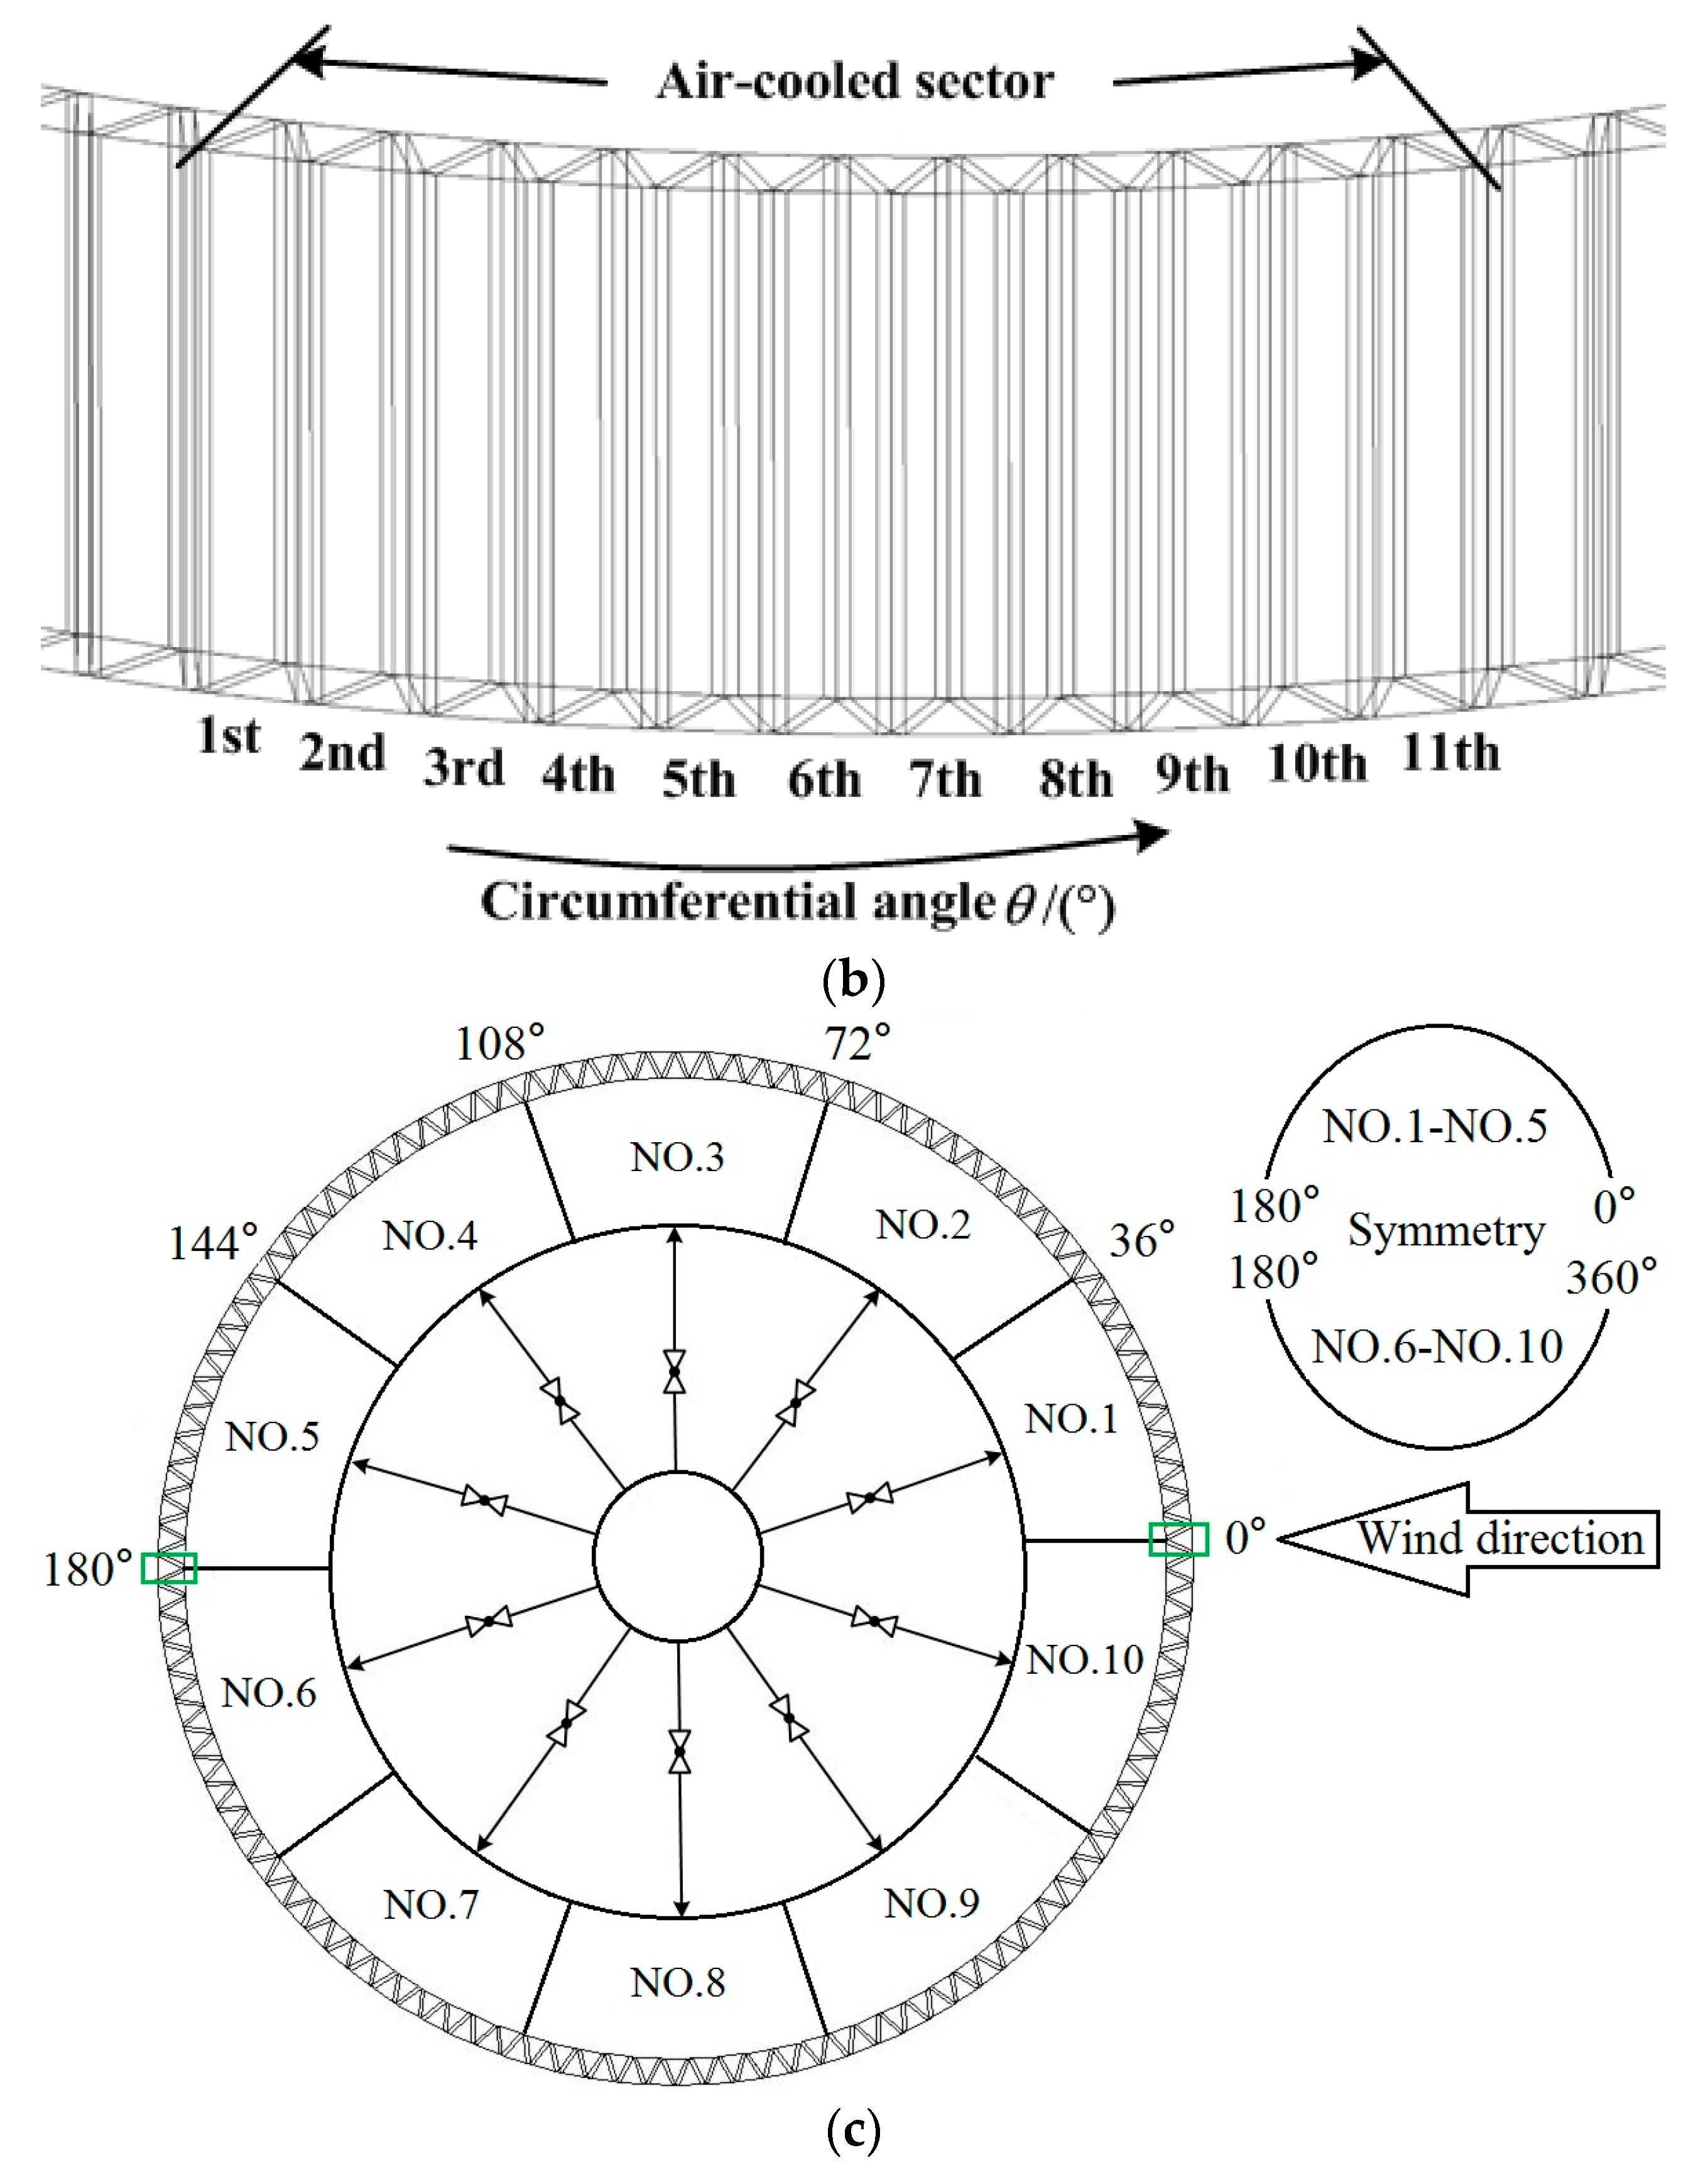
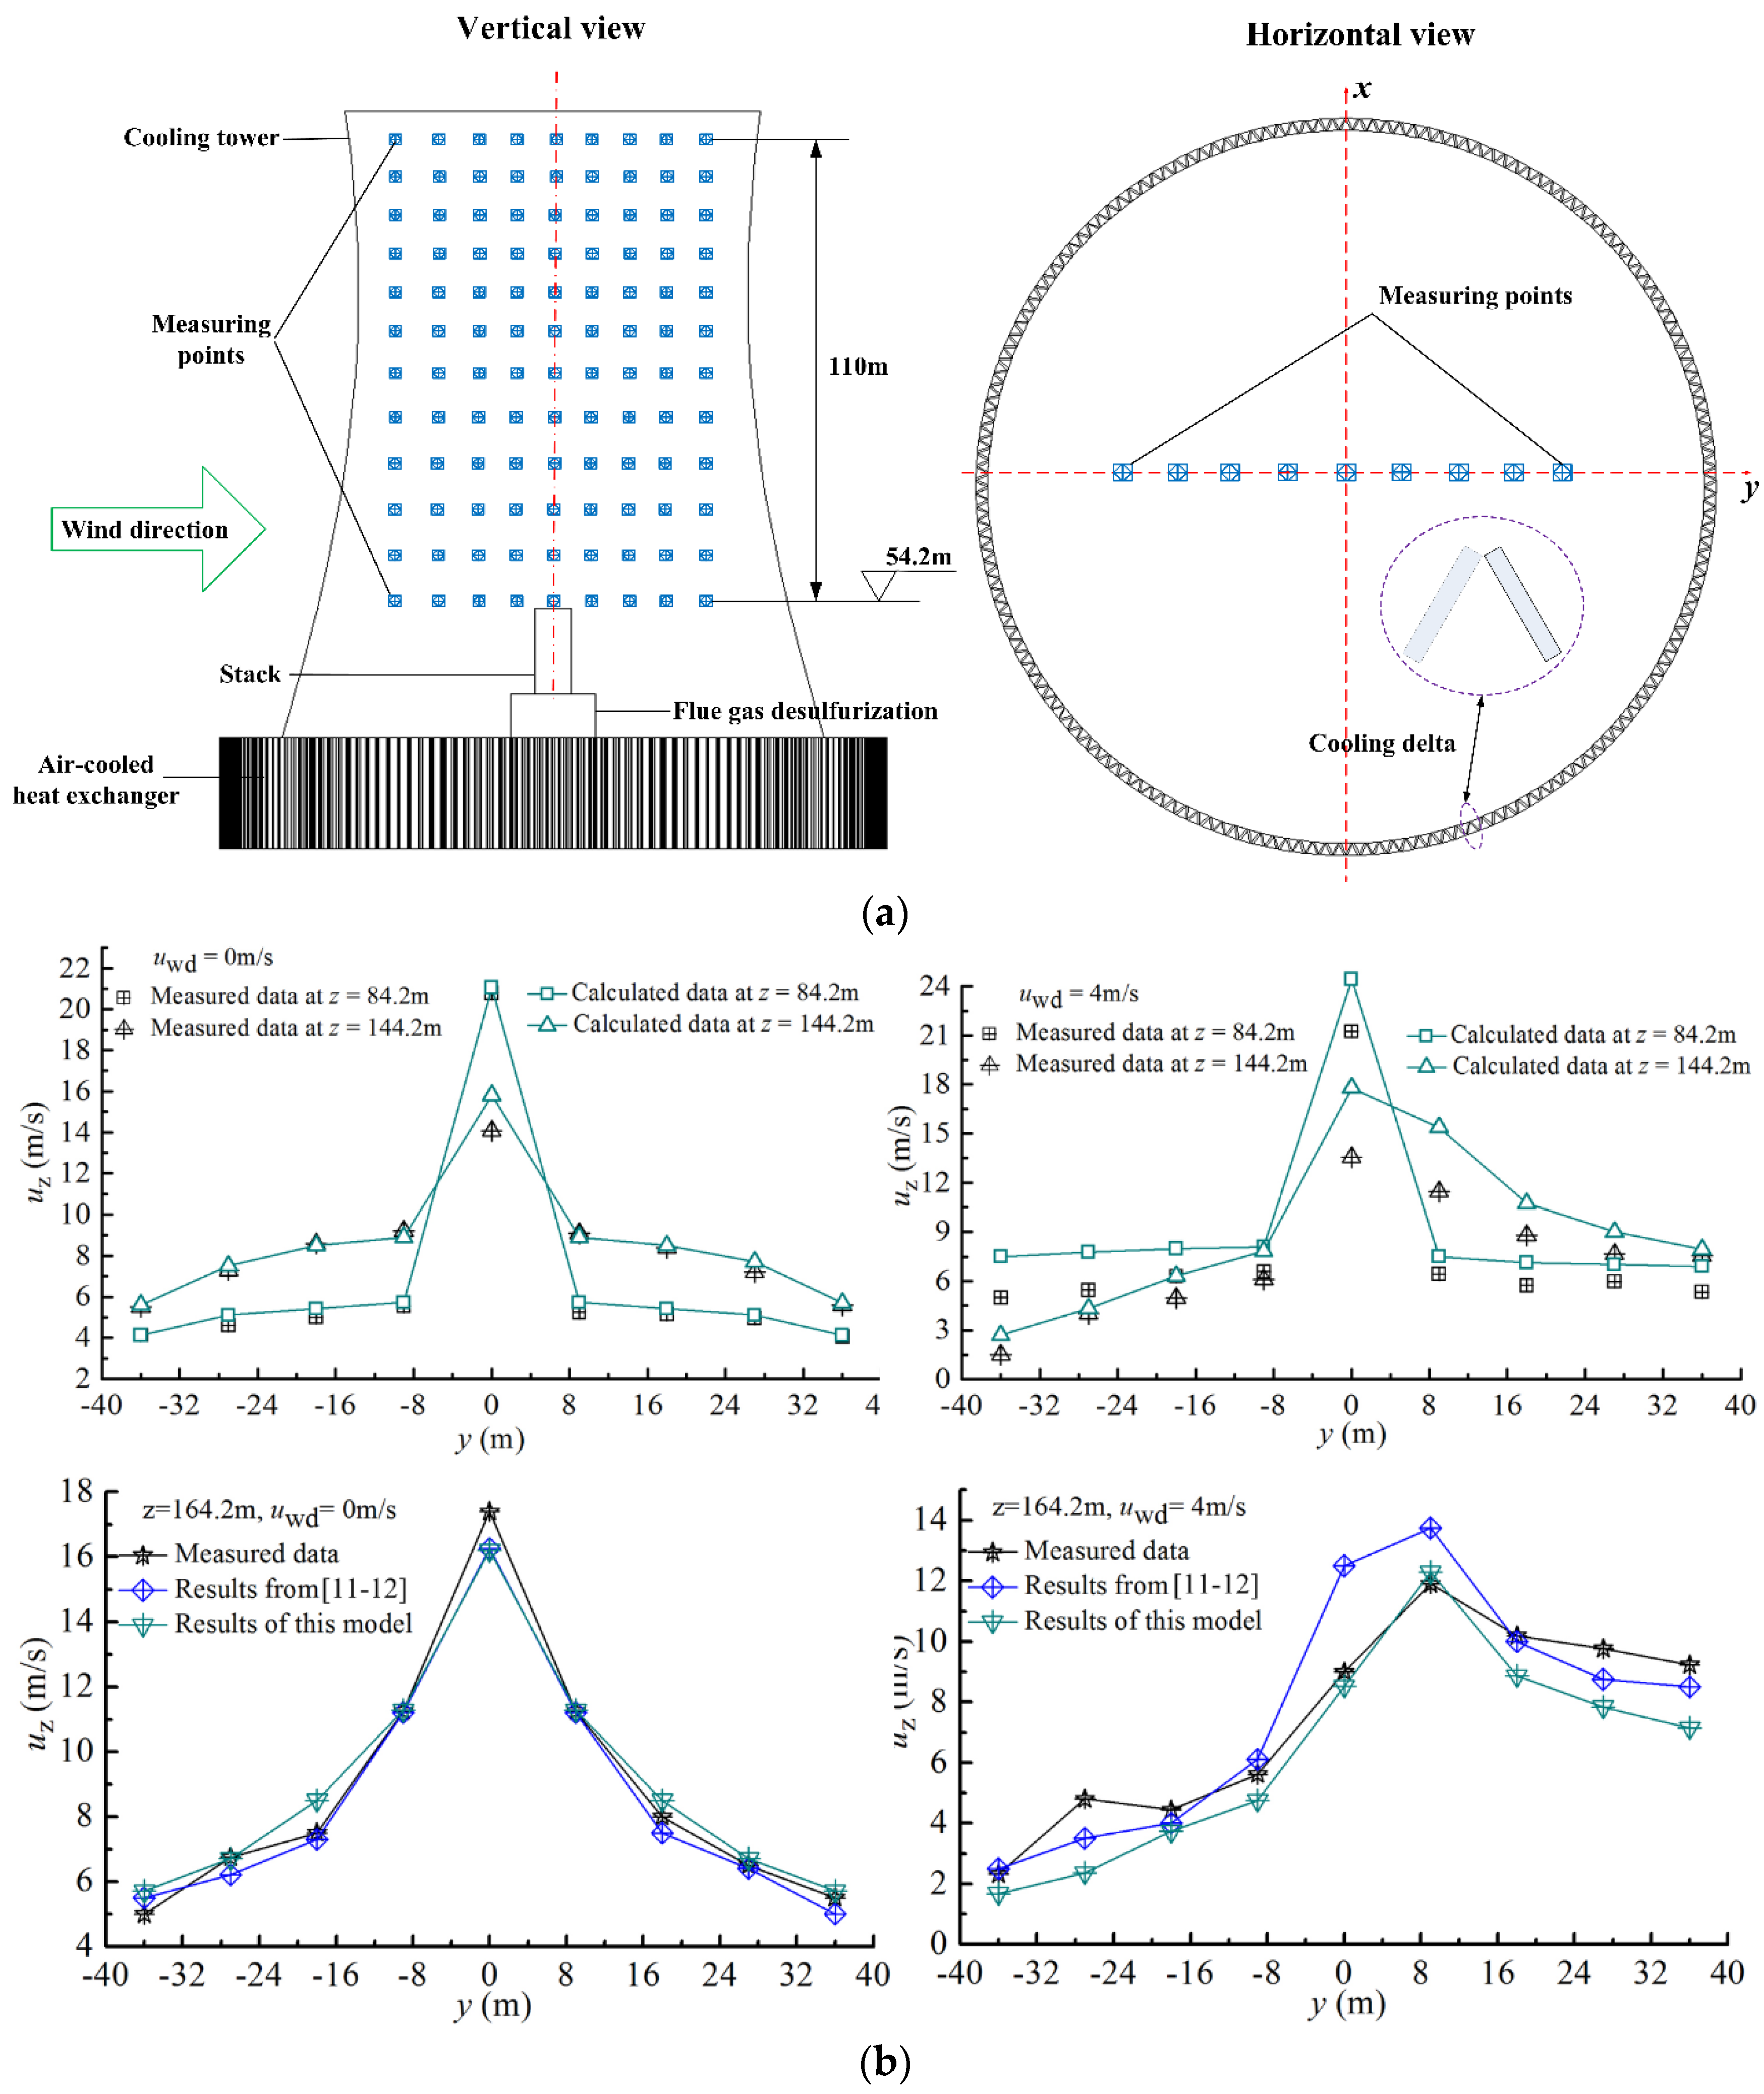
2.1. Geometric Model

Figure 1a,b show the geometric schematics of a natural draft dry cooling system and the 11 cooling deltas in each sector [4,5]. The large-scale air-cooled heat exchanger is generally divided into ten sectors, so as to distribute the circulating water flexibly. In this research, only the half domain incorporating sectors No. 1–5 is studied owing to the symmetric configuration, as presented in Figure 1c.

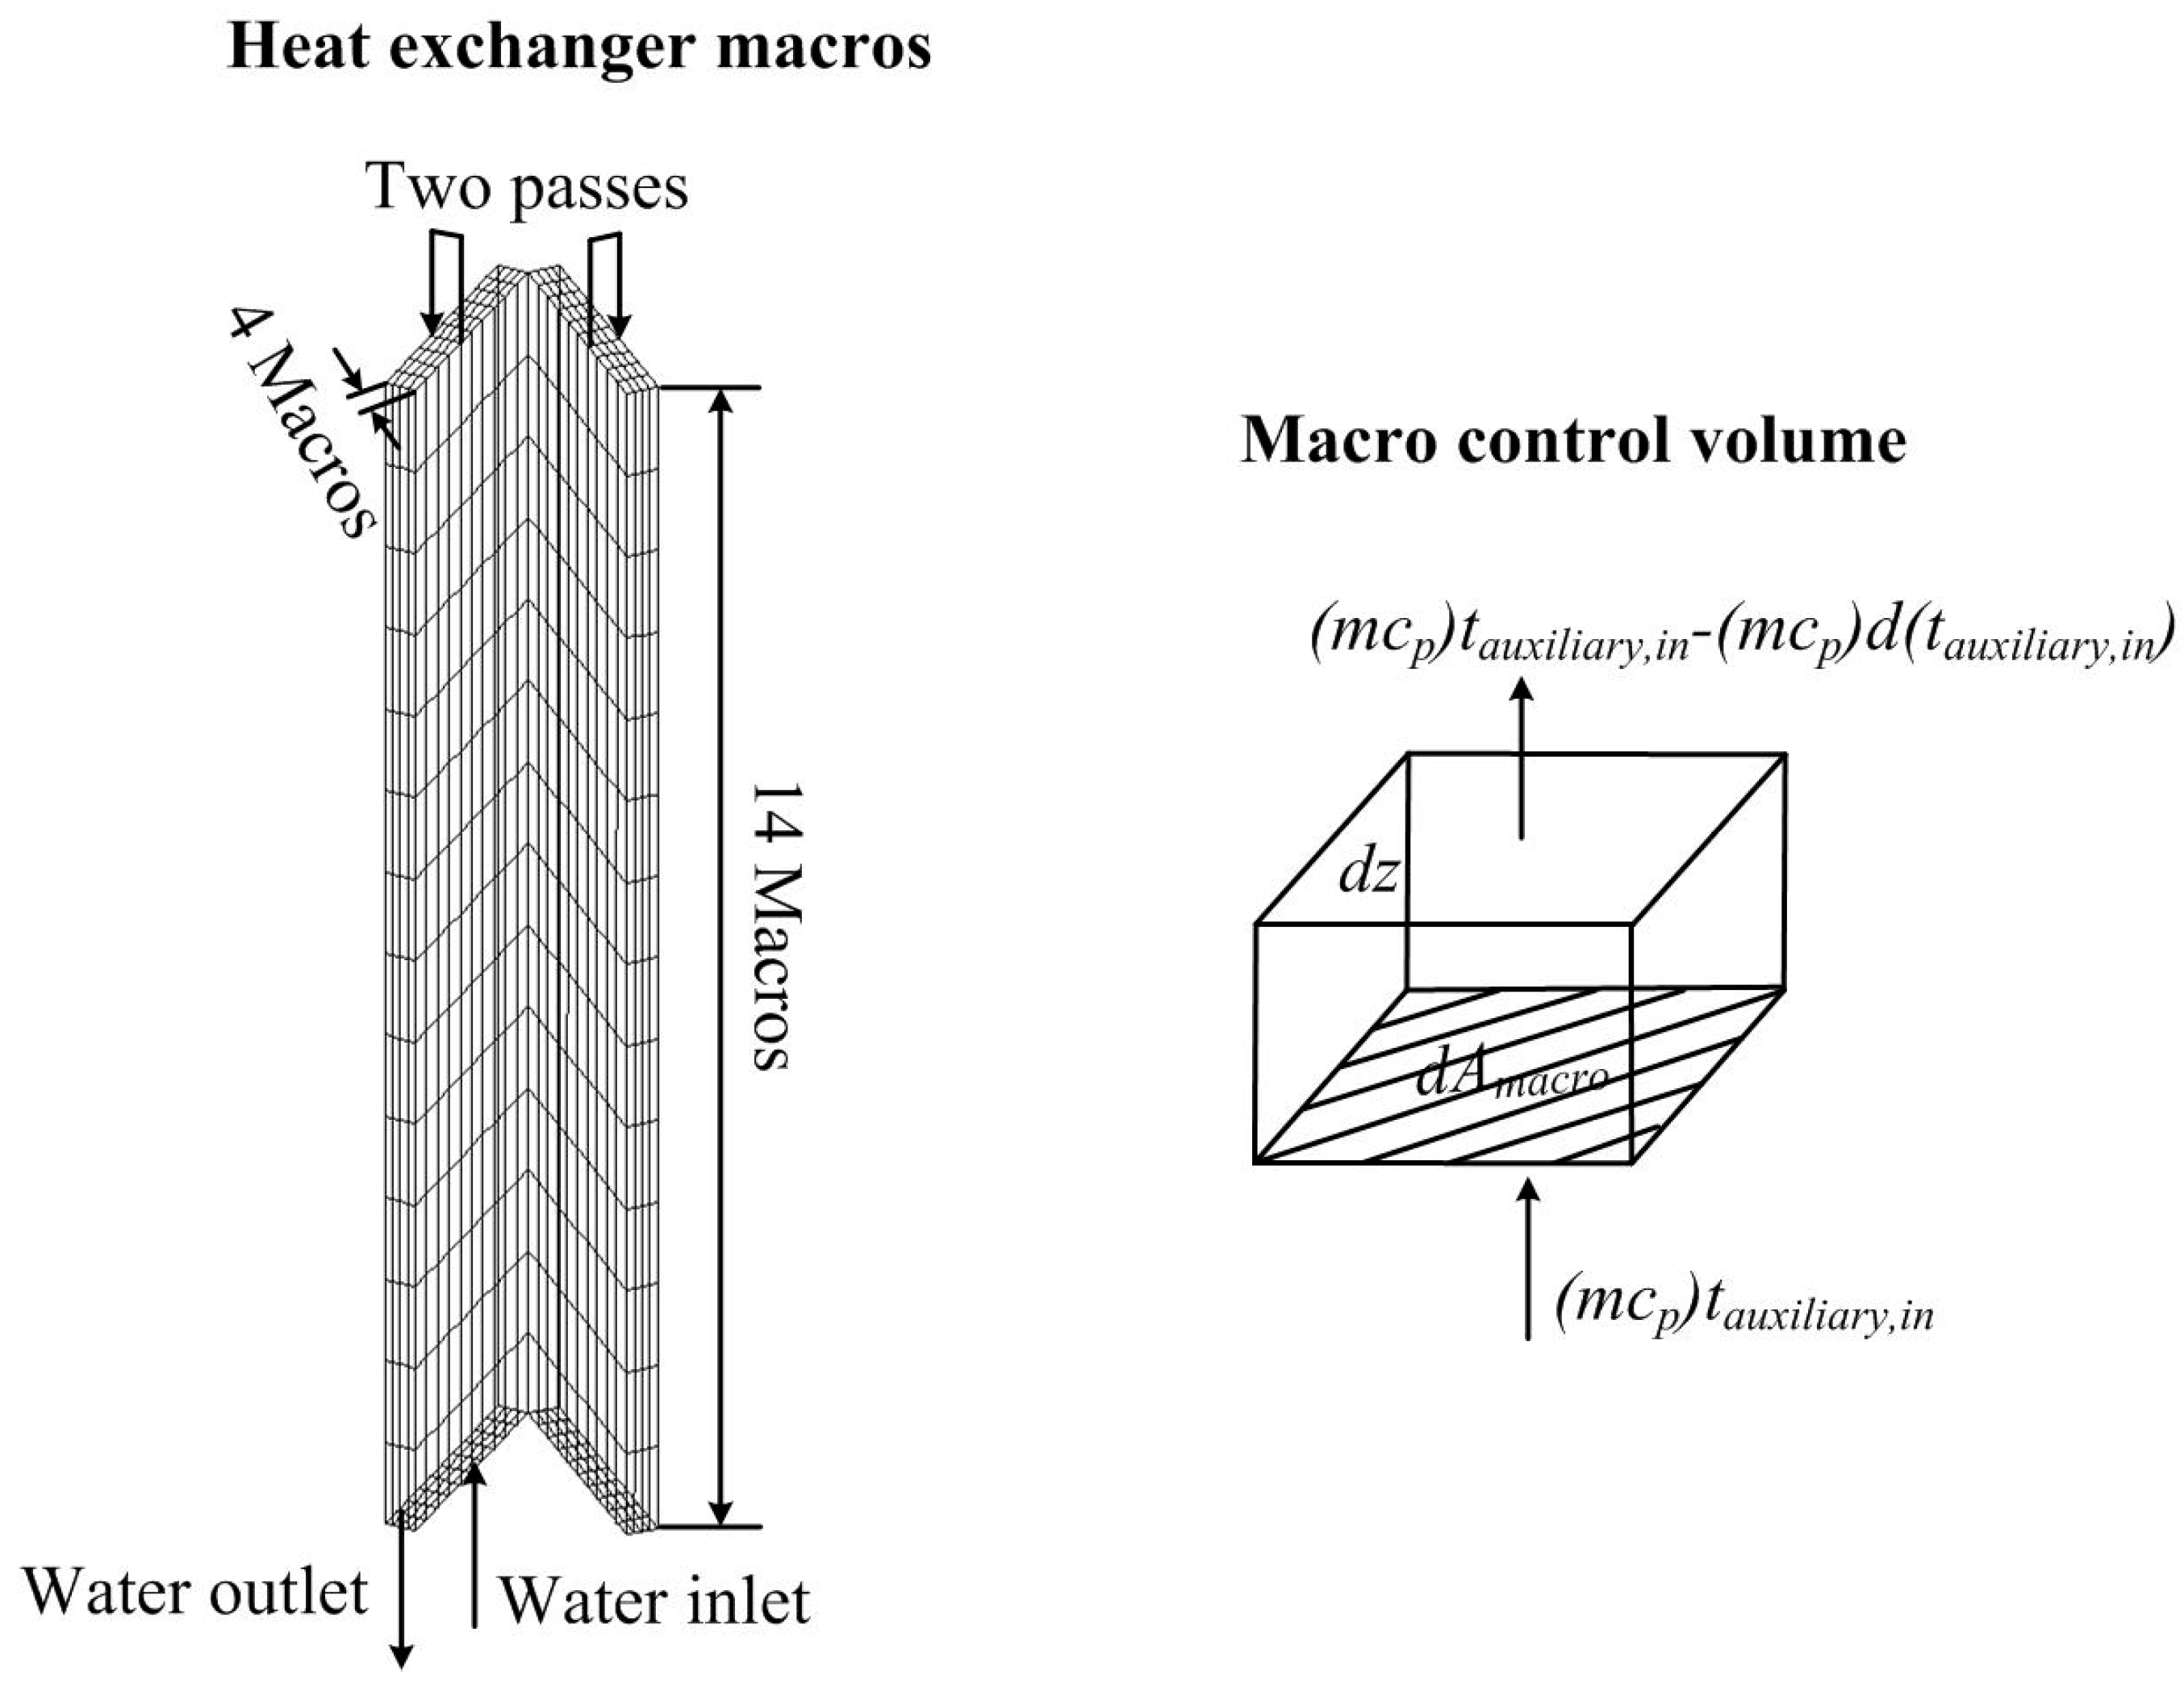
2.2. Numerical Model

For the flow and heat transfer performance of NDDCS, the genetic conservation equations are given as follows. Furthermore, the realizable k-ε model is introduced to simulate the turbulent flows. With the closed numerical equations, the flows incorporating boundary layer with high adverse pressure gradient, rotation, flow recirculation and separation, can be predicted accurately [4,5,6,7,13,14,25,26,27,28]:
ρ u j φ x j = x j ( Γ φ φ x j ) + S φ + S φ
Moreover, the following assumptions are simplified to achieve the simulation of the heat exchangers:
(1)
Flow acceleration effects are neglected in calculating the pressure loss coefficient;
(2)
Auxiliary fluid flow is assumed to be 1D.
In this work, the heat exchanger model is introduced which generates the pressure drop of cooling air and heat transfer from circulating water. The pressure drop Δp of cooling air is as follows [28]:
Δ p = 1 2 f ρ u A min 2
Along the water flow path, the heat exchanger bundle is basically subdivided into multiple cells or macros. There are 14 and four macros along the tube height and thickness, as shown in Figure 2. The heat rejections of the cell, macro, and heat exchanger bundle are expressed as:
Q cell = ε Q ( m c p ) primary ( t auxiliary , in t cell )
Q macro = all cells Q cell
Q total = all macros Q macro
As pointed out, for a NDDCS air-cooled heat exchanger, alternating slotted finned tube bundles in staggered configuration are used in practical engineering [29]. By means of wind tunnel tests, the air side pressure drop and heat transfer coefficients can be measured [30].

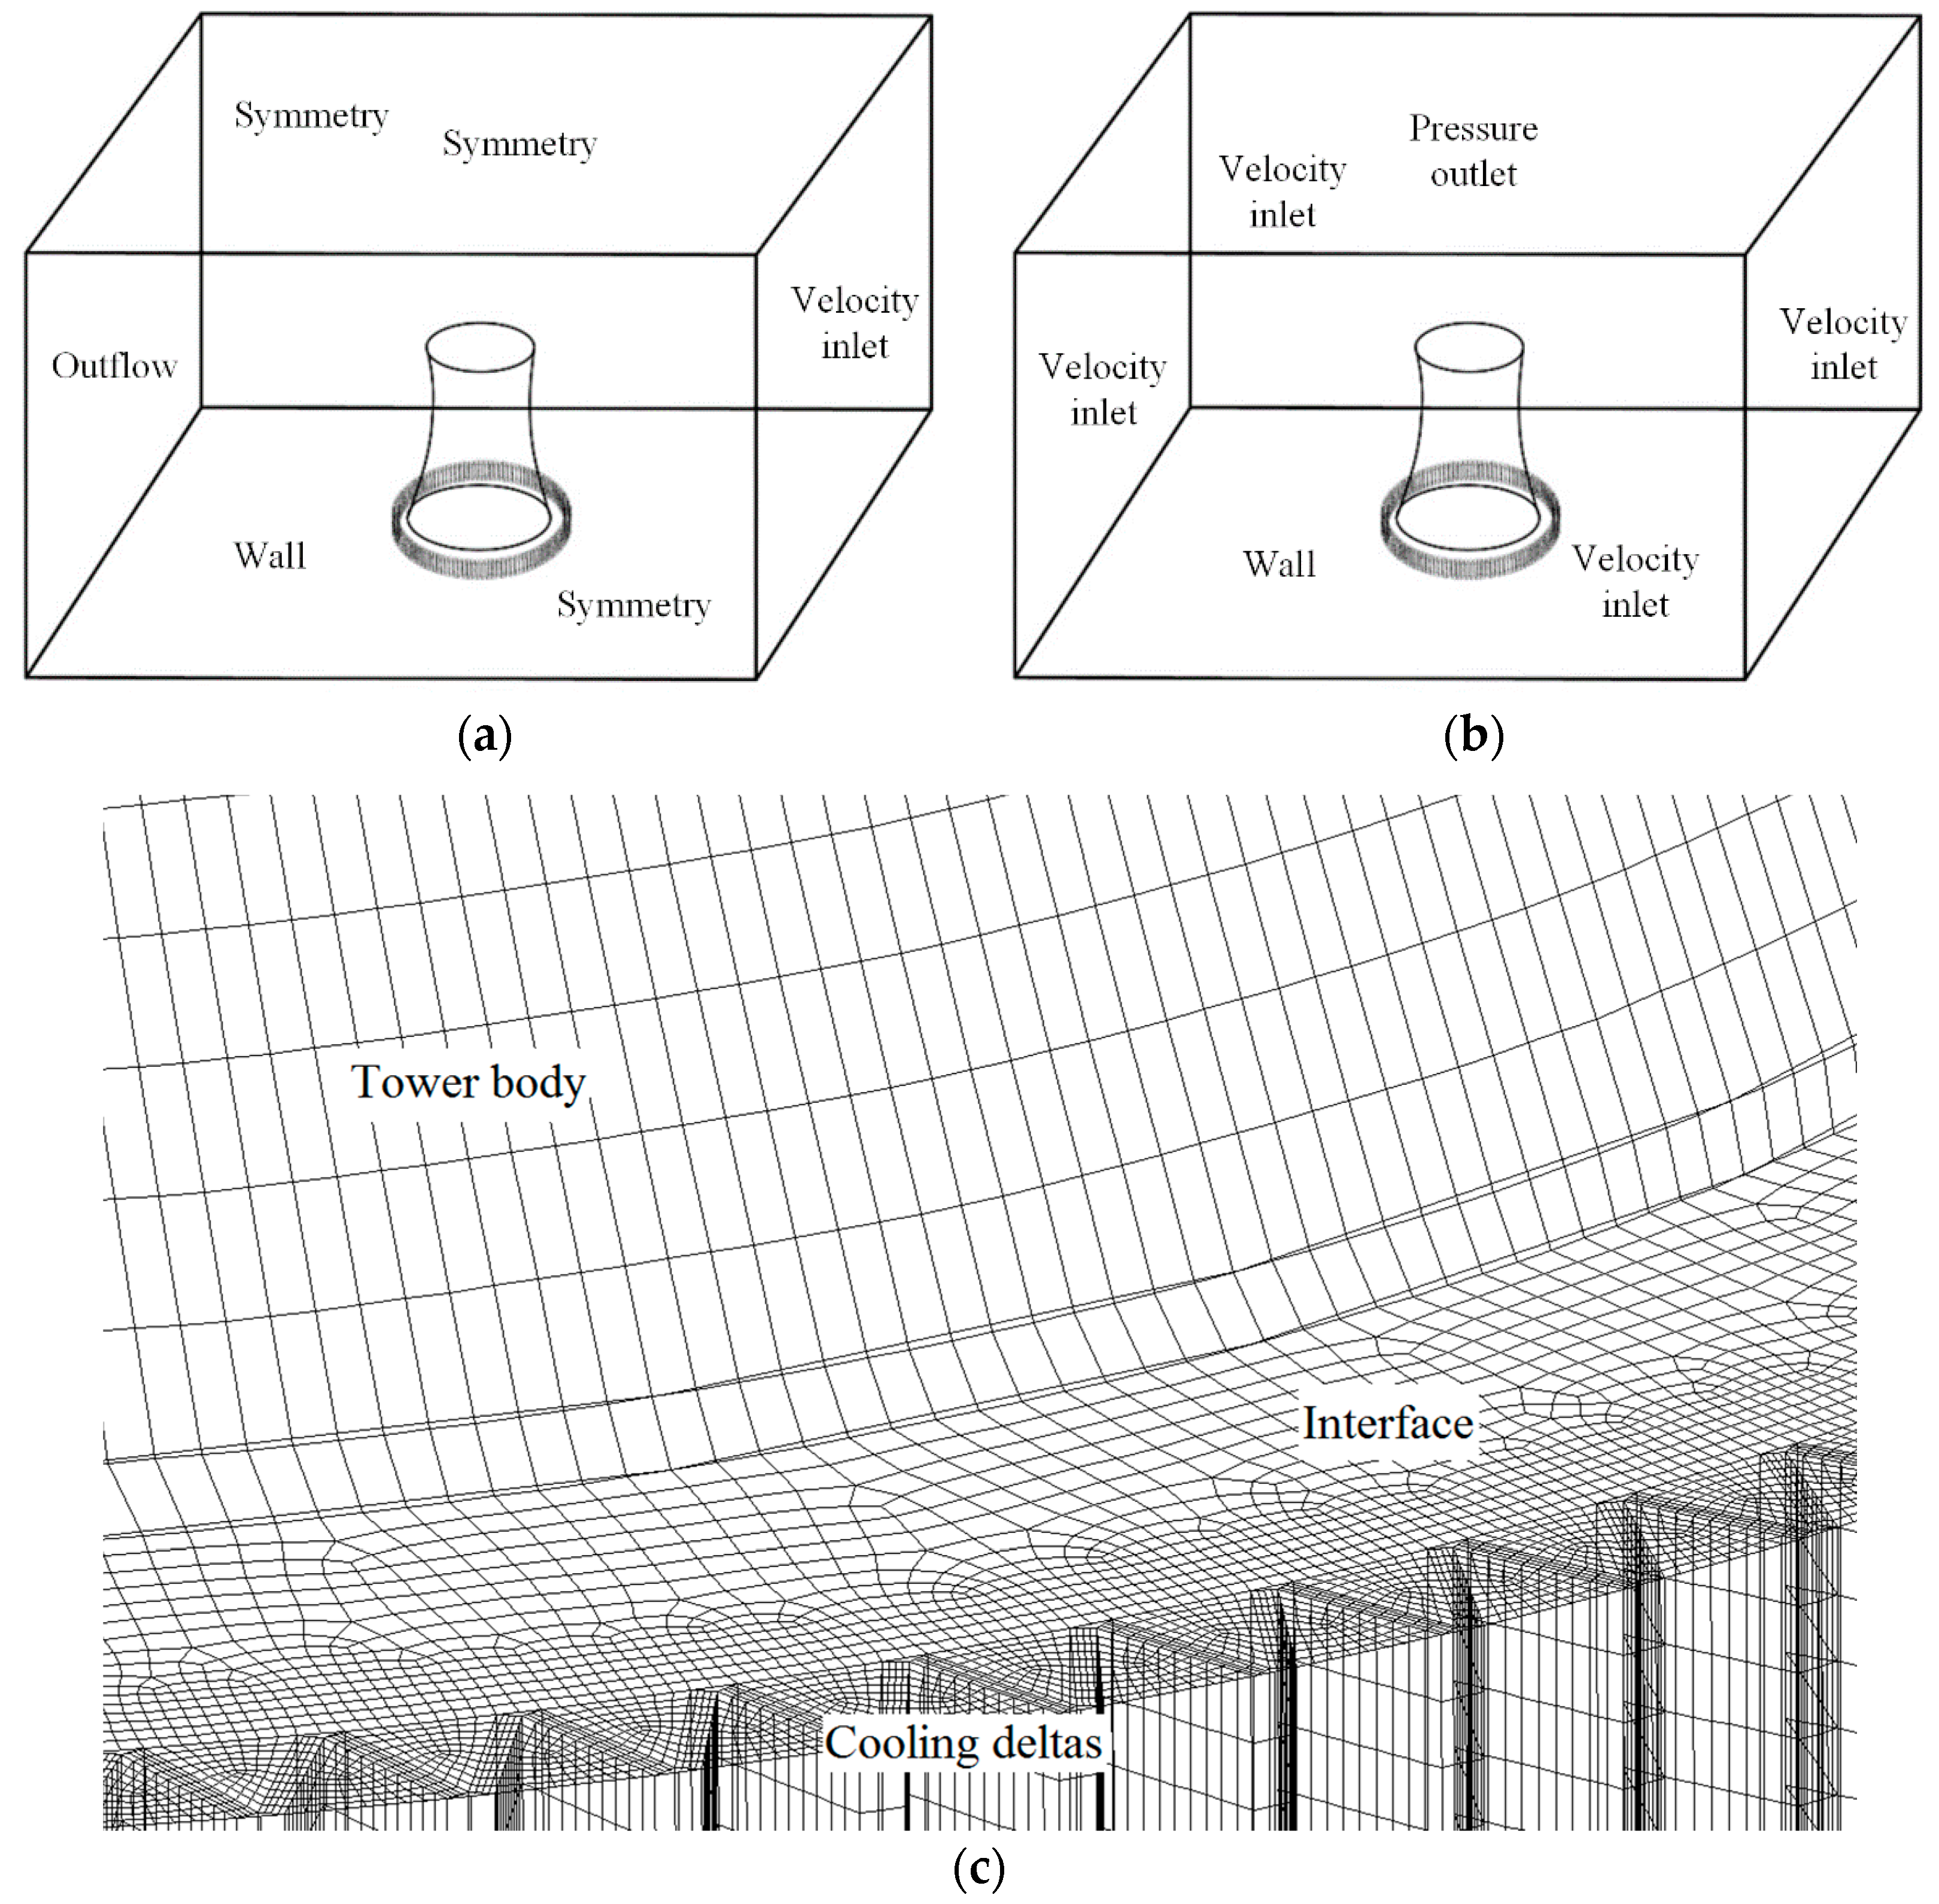
2.3. Mesh Approach and Boundary

Figure 3a shows the large-scale numerical domain with a natural draft dry cooling system in center [4,5]. The corresponding grids of the cooling columns as well as the tower shell are described in Figure 3b, where the mesh interval sizes are set as 0.2 m and 2 m for these two sections [11,12,20]. Hexahedron-shaped grids are employed for the heat exchangers and dry-cooling tower, while the hybrid hexahedron/tetrahedron ones are generated for the interval block. As for the boundaries with crosswinds, the windward surface is set as the velocity inlet, with uwind at the height of z (m) calculated as follows [13,14]:
u wind = u wd ( z 10 ) e
where uwd represents the crosswind value at the reference height of 10 m. e means the wind speed profile index, with the typical value of 0.2. The leeward surface is appointed as the outflow boundary, while other planes as the symmetry boundaries. With no ambient winds, the velocity inlet is assigned for all side surfaces, while the top pressure outlet boundary for the top plane.

2.4. Validation of Numerical Model

The numerical model is validated by wind tunnel experiments [11,12]. The ascending air velocities inside the tower are both numerically and experimentally measured and compared, as shown in Figure 4a,b. When without winds or under a crosswind of 4 m/s, both the numerical and experimental results at the centers of horizontal planes 84.2 m and 144.2 m are obviously higher than at other locations, which results from the discharge effects of the flue gas. Besides, in the absence of winds, the central ascending velocity at the cross-section of 144.2 m presents smaller than that at the 84.2 m plane. At the horizontal plane of 144.2 m, winds can impede the up-flow of outlet air at the frontal side of the tower. Consequently, the ascending velocity is reduced compared with that at the tower back. At the height of 164.2 m, the numerical results from the heat exchanger model match well with the experimental data and the modelling results by the radiator model [11,12]. Conclusively, the numerical method with the heat exchanger model proves reliable and accurate enough to predict the thermo-flow characteristics of a NDDCS.

3. Results and Discussion

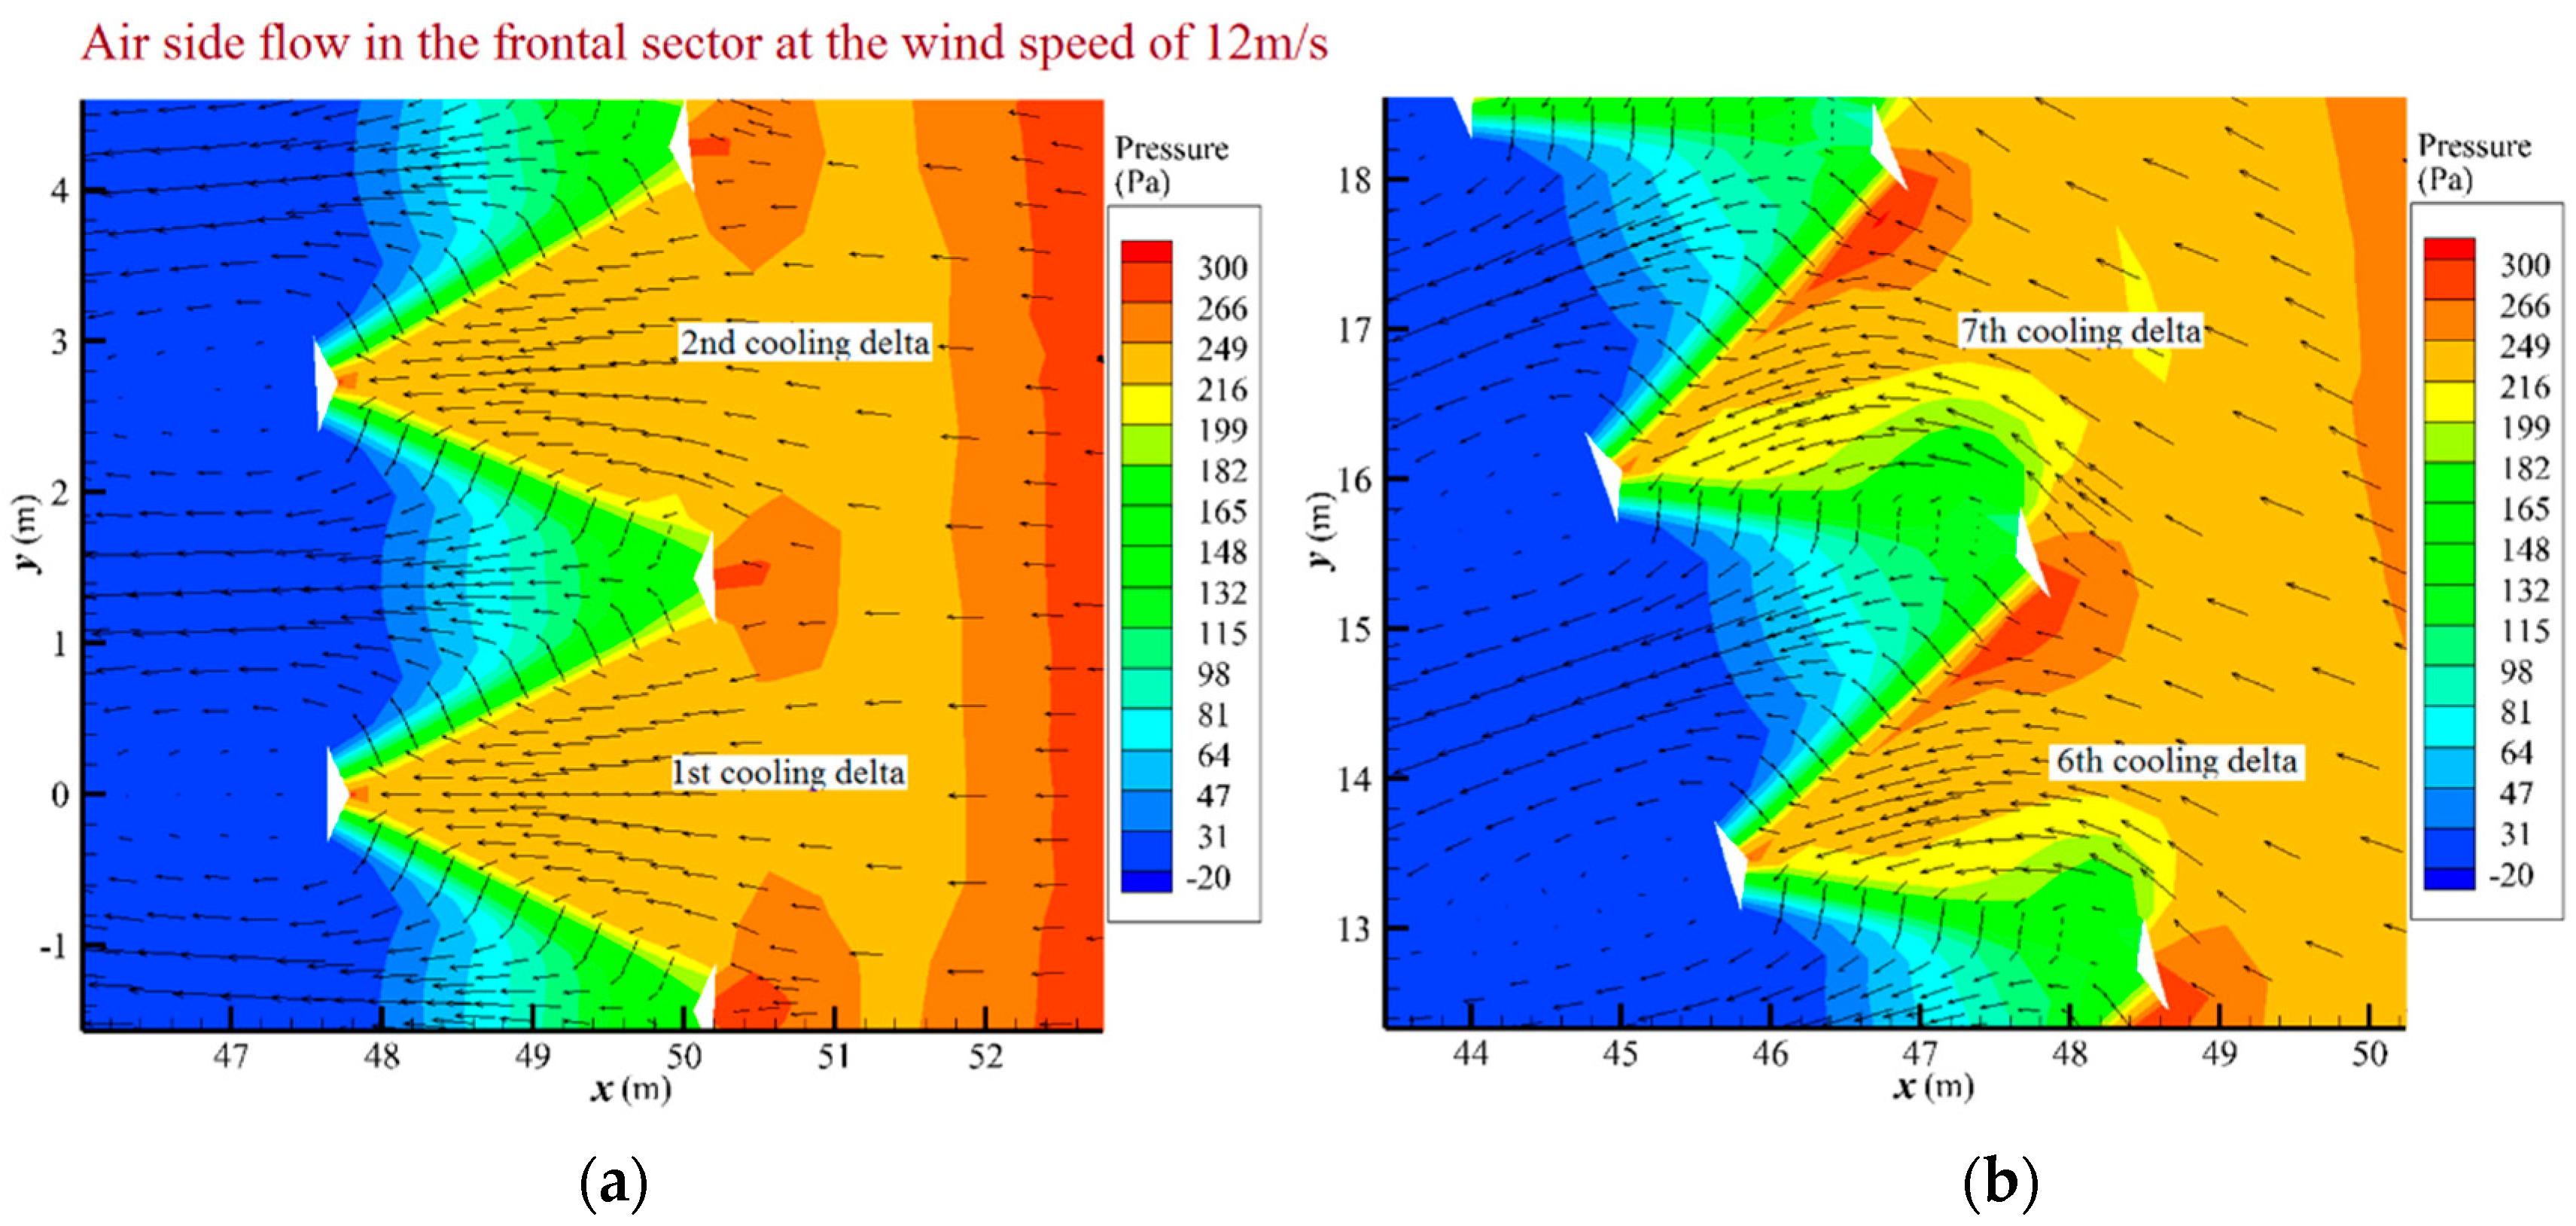
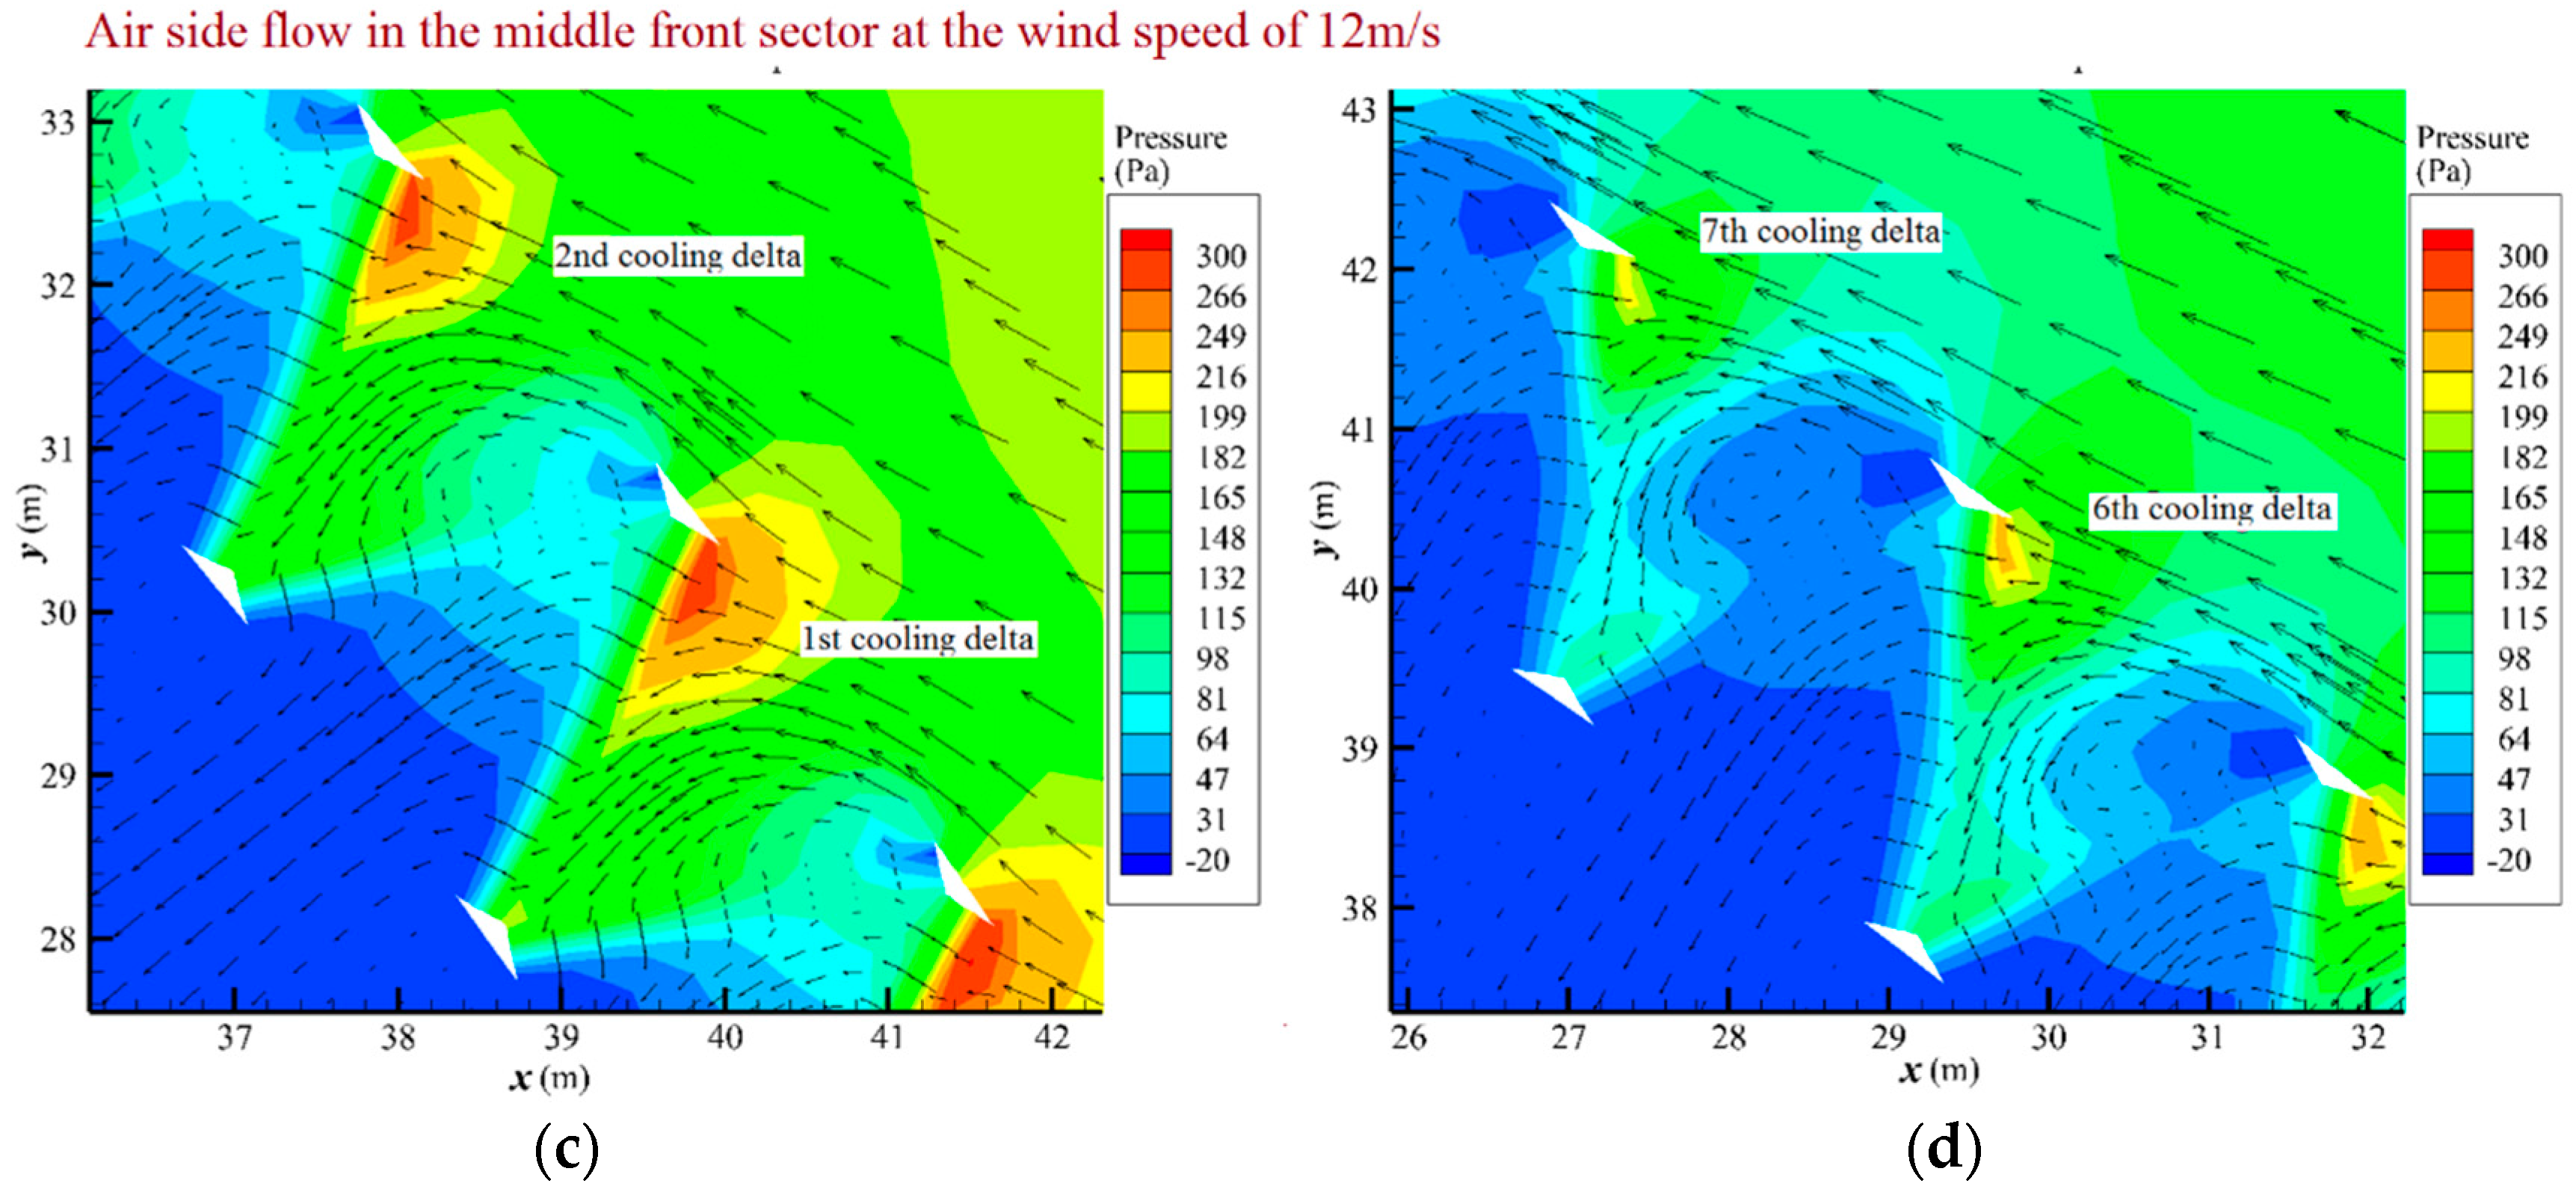
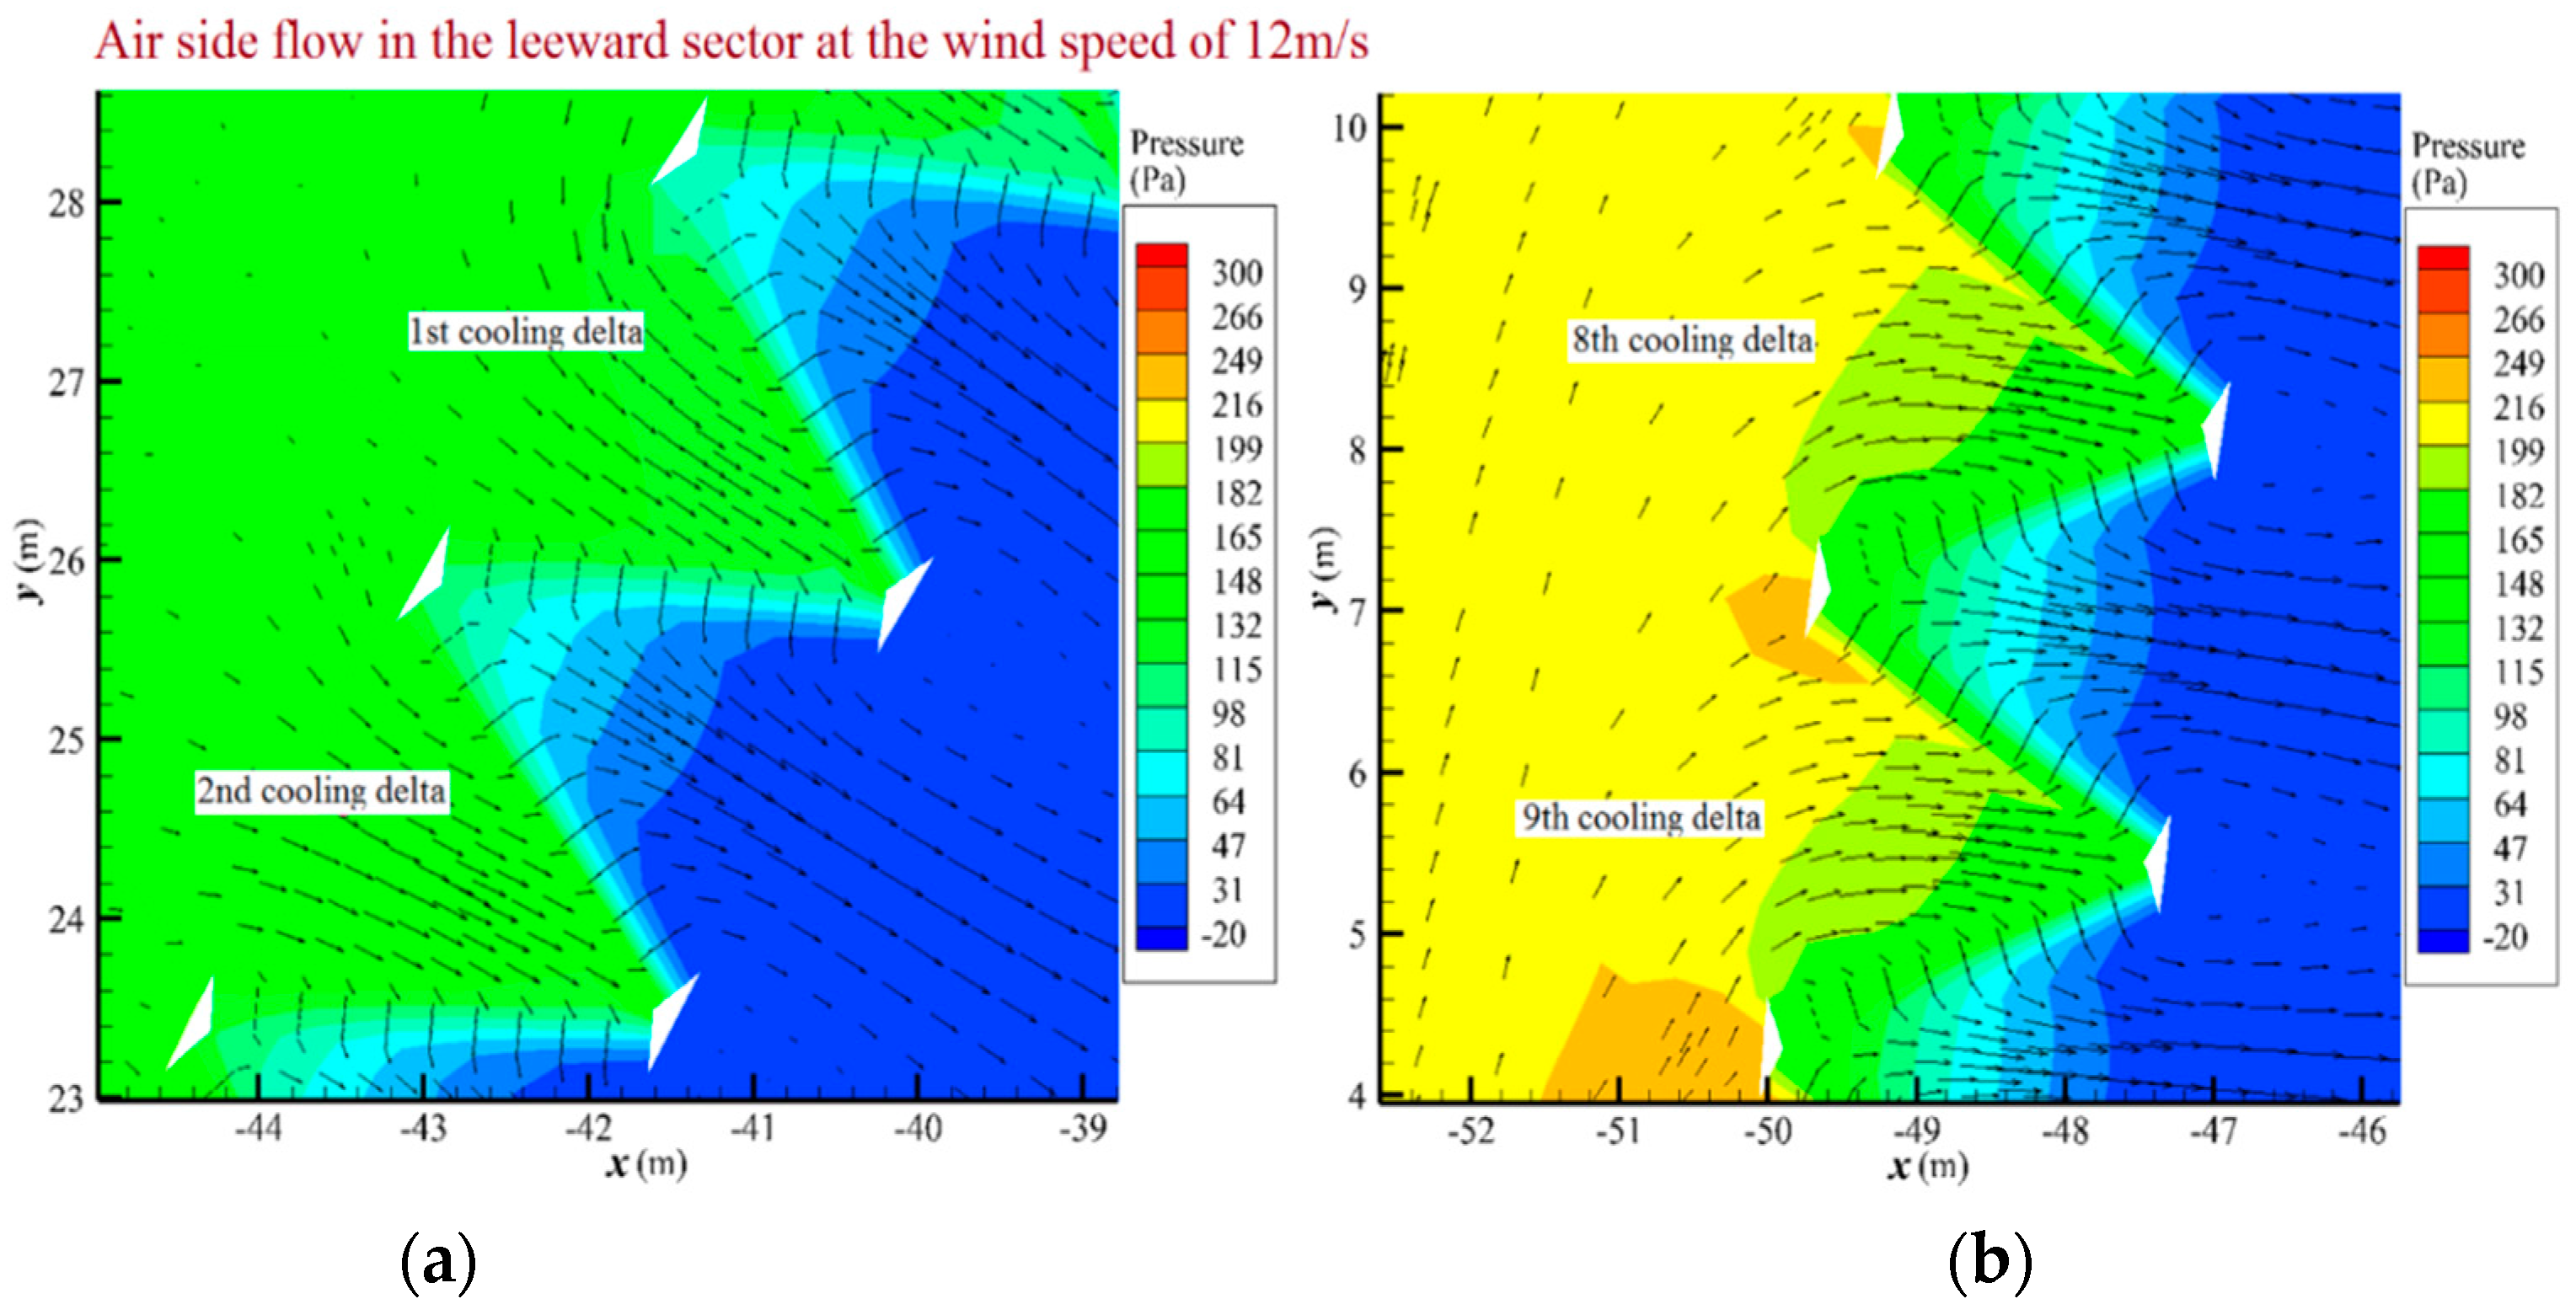
3.1. Freezing Analysis

The cooling deltas will face more freezing risks under wind conditions than in the absence of crosswinds, so with the numerical process shown in Figure 5, the freezing potential of the cooling deltas is presented at all wind speeds with the original water flow rate of 12.5 kg/s as an illustrative case so as to study the potential for avoiding freezing issues by increasing the water flow rate.
The freezing risks are most likely to occur in the cooling deltas of the frontal, middle front as well as leeward sectors due to high heat rejection from these sectors. Figure 6 shows the cold air can flow directly through the first two deltas in frontal sector with the big pressure gradient, while it deviates at the inlets of the 6th and 7th deltas.
Therefore deltas in frontal sector will encounter the most likely freezing risks, and the freezing risk becomes weak with increasing the circumferential angle θ, as shown in Figure 7. Additionally, the freezing risk gets critically serious with increasing the wind speed, resulting from the increased heat capacity of air. As for deltas in middle front sector, the air flow deviation presents more serious than the frontal sector, and as the circumferential angle increases, the vortices even appear in the 6th and 7th cooling deltas as shown in Figure 6. As a result, the cooling deltas of the middle front sector face much lower freezing risks than the frontal sector, and under the gale wind with speed of 16 m/s, the freezing risks only stretch to the second delta in this sector, as shown in Figure 7.
For the rear sector under crosswinds from 4 m/s to 12 m/s, the first two cooling deltas present much worse air flows than the 8th and 9th deltas, as shown in Figure 8, implying that the frontal deltas in this sector face minor freezing risks compared with the leeward ones as shown in Figure 9.
Meanwhile, as the wind speed increases, the freezing risk also becomes more serious. However, with a crosswind of 16 m/s, the first two deltas have higher pressure differences than the middle ones, and the last 10th and 11th deltas display much recovered air flow fields than the 5th and 6th deltas even with smaller pressure differences, as shown in Figure 10. In consequence, the bilateral deltas of the leeward sector show more serious freezing risks than the middle cooling deltas, which differs from the freezing issues at other wind speeds, as shown in Figure 9.

3.2. Impacts of Water Flow Rate

With increased circulating water in the heat exchanger, the freezing risks of cooling deltas may be reduced. The outlet water temperature of each delta in the three easily freezing sectors, namely, the frontal, middle front and rear sectors, are obtained for 30%, 40% and 50% water flow increases, and the 50% increasing case with the water flow rate of 18.75 kg/s is specially presented in Figure 11.
Figure 11a shows that, under crosswinds of 4 m/s and 8 m/s, the freezing risks disappear for all the deltas in the frontal and middle front sectors, while under high crosswinds of 12 m/s and 16 m/s, the freezing risks cannot be totally resolved for several frontal cooling deltas in the frontal sector, resulting from the extremely high heat rejection potential to the cold air. For the rear sector as shown in Figure 11b, all deltas are free from freezing at each wind speed, which differs from those in frontal sector with the smaller heat loads.
For the other two water flow rate cases, the outlet water temperature of each delta in the three sectors are presented in Table 1. As can be seen clearly, deltas in the middle front and rear sectors are free from freezing risk, while for those in the frontal sector, the freezing risks can only be completely removed at 4 m/s. At the wind speed of 8 m/s, the freezing risks can be partially reduced by a water flow rate increase, but with high crosswinds of 12 m/s and 16 m/s, there are little anti-freezing rewards because the extremely high freezing potential is quite large with the high cooling capacity of ambient air.
It’s worth noting that, since the middle front and rear sectors obtain little anti-freezing effects by further increasing the circulating water flow, which differs significantly from the condition of the frontal sector where the freezing risk is conspicuously restrained, the water flow redistribution among various sectors may be a valid way to address the anti-freezing issues of NDDCS.
Figure 12 shows the air-side variable fields of the representing deltas in frontal and middle sectors under high crosswind of 16 m/s. An air flow discrepancy clearly exists between the two sectors, so the deltas will present big outlet water temperature differences, as shown in Figure 13. Besides, for the eleven deltas in the lateral sector, Figure 13b shows little outlet water temperature differences among the three water flow increase cases. Therefore, it can be predicted that no freezing risks will occur in these lateral deltas by directing their circulating water to the frontal sector so as to strengthen its water-side heat load.

4. Conclusions

Flexible adjustment of water flow rates and how the outlet water temperature varies with such an operating way is explored via CFD (Computational Fluid Dynamics) are the concerns in this paper. For an air-cooled NDDCS heat exchanger, the frontal, middle front and rear sectors will face freezing risks under crosswinds on cold days. The freezing risks can be resolved by increasing the water flow rate for the middle front and rear sectors, while for frontal sector, the freezing risks can only be settled at the small wind speed of 4 m/s, whereas at 8 m/s, the freezing risks will disappear if water flow rate increases by 50%. However, under gale winds, deltas in frontal sector still face severe freezing risks, even with increased water flow, while the lateral deltas always have high outlet water temperatures because of the extremely adverse air flow fields, so a water flow redistribution between the middle and frontal sectors, which may benefit the freezing protection of NDDCS is recommended.
The adjustment direction is explored in the above work, but the optimal mass flow rates of each sector have not been obtained yet. The optimal way of operating in winter will be investigated as the next step in our studies.

Acknowledgments

The financial supports for this research, from the National Natural Science Foundation of China (Grant No. 51476055), the National Basic Research Program of China (Grant No. 2015CB251503) and the Fundamental Research Funds for the Central Universities (Grant No. 2016YQ03), are gratefully acknowledged.

Author Contributions

Xiaoze Du provided the main idea of the study; Yonghong Guo and Huimin Wei developed the model; Xiaoru Yang and Weijia Wang analyzed the data; Lijun Yang provided language support and revised the paper.

Conflicts of Interest

The authors declare no conflict of interest

Nomenclature

cpspecific heat (J·Kg−1·K−1)
eexponent in the power-law equation of wind speed
fpressure loss coefficient
mmass flow rate (kg·s−1)
ppressure (Pa)
Qheat rejection (W)
Ssource term in generic equation
ttemperature (K)
uvelocity (m·s−1)
vspecific volume (m3·kg−1)
xjcoordinate in j direction (m)
zheight above the ground (m)
Greek symbols
εQheat exchanger effectiveness
Гdiffusion coefficient (m2·s−1)
φscalar variable
ρdensity (kg·m−3)
Subscripts
aair
Aminminimum flow area
wwater
wdwind

References

  1. Kroger, D.G. Air-Cooled Heat Exchangers and Cooling Towers: Thermal-Flow Performance Evaluation and Design; Penn Well Corporation: Tulsa, OK, USA, 2004. [Google Scholar]
  2. Kong, Y.Q.; Xi, X.M.; Dong, Z.W.; Du, X.Z.; Yang, L.J. Thermal-hydraulic and anti-freezing performances of heat exchanger of 600 MW indirect dry cooling systems. J. Eng. Thermophys. 2015, 36, 1785–1789. [Google Scholar]
  3. Li, Y.J.; Wu, X.L.; An, J.X.; Liu, J.; Luo, Y. Study on anti-freezing technology of indirect air cooling condenser system in cold and high altitude region. North China Electr. Power 2013, 14, 22–26. [Google Scholar]
  4. Wang, W.J.; Yang, L.J.; Du, X.Z.; Yang, Y.P. Anti-freezing water flow rates of various sectors for natural draft dry cooling system under wind conditions. Int. J. Heat Mass Transf. 2016, 102, 186–200. [Google Scholar] [CrossRef]
  5. Wang, W.J.; Kong, Y.Q.; Huang, X.W.; Yang, L.J.; Du, X.Z.; Yang, Y.P. Anti-freezing of air-cooled heat exchanger by switching off sectors. Appl. Therm. Eng. 2017, 120, 327–339. [Google Scholar] [CrossRef]
  6. Chen, L.; Yang, L.J.; Du, X.Z.; Yang, Y.P. Anti-freezing of air-cooled heat exchanger by air flow control of louver in power plants. Appl. Therm. Eng. 2016, 106, 537–550. [Google Scholar] [CrossRef]
  7. Wang, W.J.; Huang, X.W.; Yang, L.J.; Du, X.Z.; Yang, Y.P. Anti-freezing operation strategies of natural draft dry cooling system. Int. J. Heat Mass Transf. 2018, 118, 165–170. [Google Scholar] [CrossRef]
  8. Liu, P.Z.; Yang, Z.J. Anti-freezing and pre-heating measures for radiators in indirect air-cooling units in cold areas. Electr. Power 2013, 46, 18–22. [Google Scholar]
  9. Ma, H.; Si, F.Q.; Li, L.; Yan, W.S.; Zhu, K.P. Effects of ambient temperature and crosswind on thermo-flow performance of the tower under energy balance of the indirect dry cooling system. Appl. Therm. Eng. 2015, 78, 90–100. [Google Scholar] [CrossRef]
  10. Lu, Y.; Guan, Z.; Gurgenci, H.; Hooman, K.; He, S.; Bharathan, D. Experimental study of crosswind effects on the performance of small cylindrical natural draft dry cooling towers. Energy Convers. Manag. 2015, 91, 238–248. [Google Scholar] [CrossRef]
  11. Yang, L.J.; Chen, L.; Du, X.Z.; Yang, Y.P. Effects of ambient winds on the thermo-flow performances of indirect dry cooling system in a power plant. Int. J. Therm. Sci. 2013, 64, 178–187. [Google Scholar] [CrossRef]
  12. Yang, L.J.; Wu, X.P.; Du, X.Z.; Yang, Y.P. Dimensional characteristics of wind effects on the performance of indirect dry cooling system with vertically arranged heat exchanger bundles. Int. J. Heat Mass Transf. 2013, 67, 853–866. [Google Scholar] [CrossRef]
  13. Zhao, Y.B.; Long, G.Q.; Sun, F.Z.; Li, Y.; Zhang, C.J. Numerical study on the cooling performance of dry cooling tower with vertical two-pass column radiators under crosswind. Appl. Therm. Eng. 2015, 75, 1106–1117. [Google Scholar] [CrossRef]
  14. Zhao, Y.B.; Sun, F.Z.; Li, Y.; Long, G.Q.; Yang, Z. Numerical study on the cooling performance of natural draft dry cooling tower with vertical delta radiators under constant heat load. Appl. Energy 2015, 149, 225–237. [Google Scholar] [CrossRef]
  15. Goodarzi, M.; Keimanesh, R. Heat rejection enhancement in natural draft cooling tower using radiator-type windbreakers. Energy Convers. Manag. 2013, 71, 120–125. [Google Scholar] [CrossRef]
  16. Chen, L.; Yang, L.J.; Du, X.Z.; Yang, Y.P. Performance improvement of natural draft dry cooling system by interior and exterior windbreaker configurations. Int. J. Heat Mass Transf. 2016, 96, 42–63. [Google Scholar] [CrossRef]
  17. Gu, H.F.; Wang, H.J.; Gu, Y.Q.; Yao, J.N. A numerical study on the mechanism and optimization of wind-break structures for indirect air-cooling towers. Energy Convers. Manag. 2016, 108, 43–49. [Google Scholar] [CrossRef]
  18. He, S.Y.; Gurgenci, H.; Guan, Z.Q.; Alkhedhair, A.M. Pre-cooling with Munters media to improve the performance of natural draft dry cooling towers. Appl. Therm. Eng. 2013, 53, 67–77. [Google Scholar] [CrossRef]
  19. Goodarzi, M. Proposing a new technique to enhance thermal performance and reduce structural design wind loads for natural drought cooling tower. Energy 2013, 62, 164–172. [Google Scholar] [CrossRef]
  20. Liao, H.T.; Yang, L.J.; Du, X.Z.; Yang, Y.P. Influences of height to diameter ratios of dry-cooling tower upon thermo-flow characteristics of indirect dry cooling system. Int. J. Therm. Sci. 2015, 94, 178–192. [Google Scholar] [CrossRef]
  21. Goodarzi, M.; Keimanesh, R. Numerical analysis on overall performance of Savonius turbines adjacent to a natural draft cooling tower. Energy Convers. Manag. 2015, 99, 41–49. [Google Scholar] [CrossRef]
  22. Liao, H.T.; Yang, L.J.; Du, X.Z.; Yang, Y.P. Triangularly arranged heat exchanger bundles to restrain wind effects on natural draft dry cooling system. Appl. Therm. Eng. 2016, 9, 313–324. [Google Scholar] [CrossRef]
  23. Chen, L.; Yang, L.; Du, X.; Yang, Y. A novel layout of air-cooled condensers to improve thermo-flow performances. Appl. Eng. 2016, 165, 244–259. [Google Scholar] [CrossRef]
  24. Goodarzi, M.; Amooie, H. Heat transfer enhancement in a natural draft dry cooling tower under crosswind operation with heterogeneous water distribution. Int. J. Nucl. Power 2016, 61, 252–259. [Google Scholar]
  25. Wang, X.B.; Yang, L.J.; Du, X.Z.; Yang, Y.P. Performance improvement of natural draft dry cooling system by water flow distribution under crosswinds. Int. J. Heat Mass Transf. 2017, 108, 1924–1940. [Google Scholar] [CrossRef]
  26. Li, X.X.; Xia, L.; Gurgenci, H.; Guan, Z.Q. Performance enhancement for the natural draft dry cooling tower under crosswind condition by optimizing the water distribution. Int. J. Heat Mass Transf. 2017, 107, 271–280. [Google Scholar] [CrossRef]
  27. Launder, B.E.; Spalding, D.B. Lectures in Mathematical Models of Turbulence; Academic Press: London, UK, 1972. [Google Scholar]
  28. Kays, W.M.; London, A.L. Compact Heat Exchanger; McGraw Hill Co.: New York, NY, USA, 1984. [Google Scholar]
  29. Navarro, H.A.; Cabezas-Gómez, L. A new approach for thermal performance calculation of cross-flow heat exchangers. Int. J. Heat Mass Transf. 2005, 48, 3880–3888. [Google Scholar] [CrossRef]
  30. Kong, Y.Q.; Yang, L.J.; Du, X.Z.; Yang, Y.P. Effects of continuous and alternant rectangular slots on thermo-flow performances of plain finned tube bundles in in-line and staggered configurations. Int. J. Heat Mass Transf. 2016, 93, 97–107. [Google Scholar] [CrossRef]
Figure 1. Geometric schematics. (a) Natural draft dry cooling system (NDDCS); (b) 11 deltas in each sector; (c) sectors and wind direction.
Energies 11 00112 g001aEnergies 11 00112 g001b
Figure 2. Heat exchanger macros and macro control volume.
Energies 11 00112 g002
Figure 3. Computational domain, boundary, and meshes. (a) Computational domain and boundaries with crosswinds; (b) Computational domain and boundaries no crosswinds; (c) multi-block meshes.
Energies 11 00112 g003
Figure 4. Comparisons of experimental and numerical ascending air velocities inside cooling tower. (a) Measuring points; (b) comparisons.
Energies 11 00112 g004
Figure 5. Flowchart for the numerical process.
Energies 11 00112 g005
Figure 6. Air flows of representing deltas in frontal and middle front sectors under crosswind of 12 m/s, (a) 1st and 2nd delta in frontal section; (b) 6th and 7th delta in frontal section; (c) 1st and 2nd delta in middle front section; (d) 6th and 7th delta in middle front section.
Energies 11 00112 g006aEnergies 11 00112 g006b
Figure 7. Outlet water temperature of each delta in frontal and middle front sectors with original flow rate of circulating water.
Energies 11 00112 g007
Figure 8. Air flows of representing deltas in rear sector under a crosswind of 12 m/s, (a) 1st and 2nd delta in leeward section; (b) 8th and 9th delta in leeward section.
Energies 11 00112 g008
Figure 9. Outlet water temperature of each delta in rear sector with original flow rate of circulating water.
Energies 11 00112 g009
Figure 10. Air flows of representing deltas in rear sector under crosswind of 16 m/s, (a) 1st and 2nd delta in rear section; (b) 5th and 6th delta in rear section; (c) 10th and 11th delta in rear section.
Energies 11 00112 g010
Figure 11. Outlet water temperature of each delta with 50% water flow rate increase. (a) In frontal and middle front sectors; (b) in rear sector.
Energies 11 00112 g011
Figure 12. Air flows of representing deltas in frontal and lateral sectors under crosswind of 16 m/s, (a) frontal section; (b) middle section.
Energies 11 00112 g012
Figure 13. Outlet water temperature of each delta in frontal and lateral sectors under crosswind of 16 m/s for three cases of water flow increase. (a) Frontal sector; (b) lateral sector.
Energies 11 00112 g013
Table 1. Outlet water temperature (unit in K) of each cooling delta with water flow rate increases of 30% and 40%.
Delta No.1234567891011
frontal sector with 30% water flow rate increase
4 m/s276.0276.3276.7277.1277.5277.9278.2278.9279.3279.8280.3
8 m/s270.1270.7271.3272.2272.9273.9274.8275.8276.7277.4278.6
12 m/s265.4266.3267.3268.6269.8271.0272.2273.6275.1276.2278.2
16 m/s259.4260.5261.6263.3264.7266.0267.6269.3271.3272.6275.1
middle front sector with 30% water flow rate increase. Free from freezing
4 m/s280.7281.2281.6282.1282.4282.9283.2283.8284.0284.6284.9
8 m/s279.4280.8281.6282.8283.6284.8285.6286.8287.7288.8290.1
12 m/s279.4281.2282.5284.3286.0287.8290.1292.2295.3297.8301.6
16 m/s276.7278.9280.7283.0285.3287.5290.4293.1297.2300.7305.9
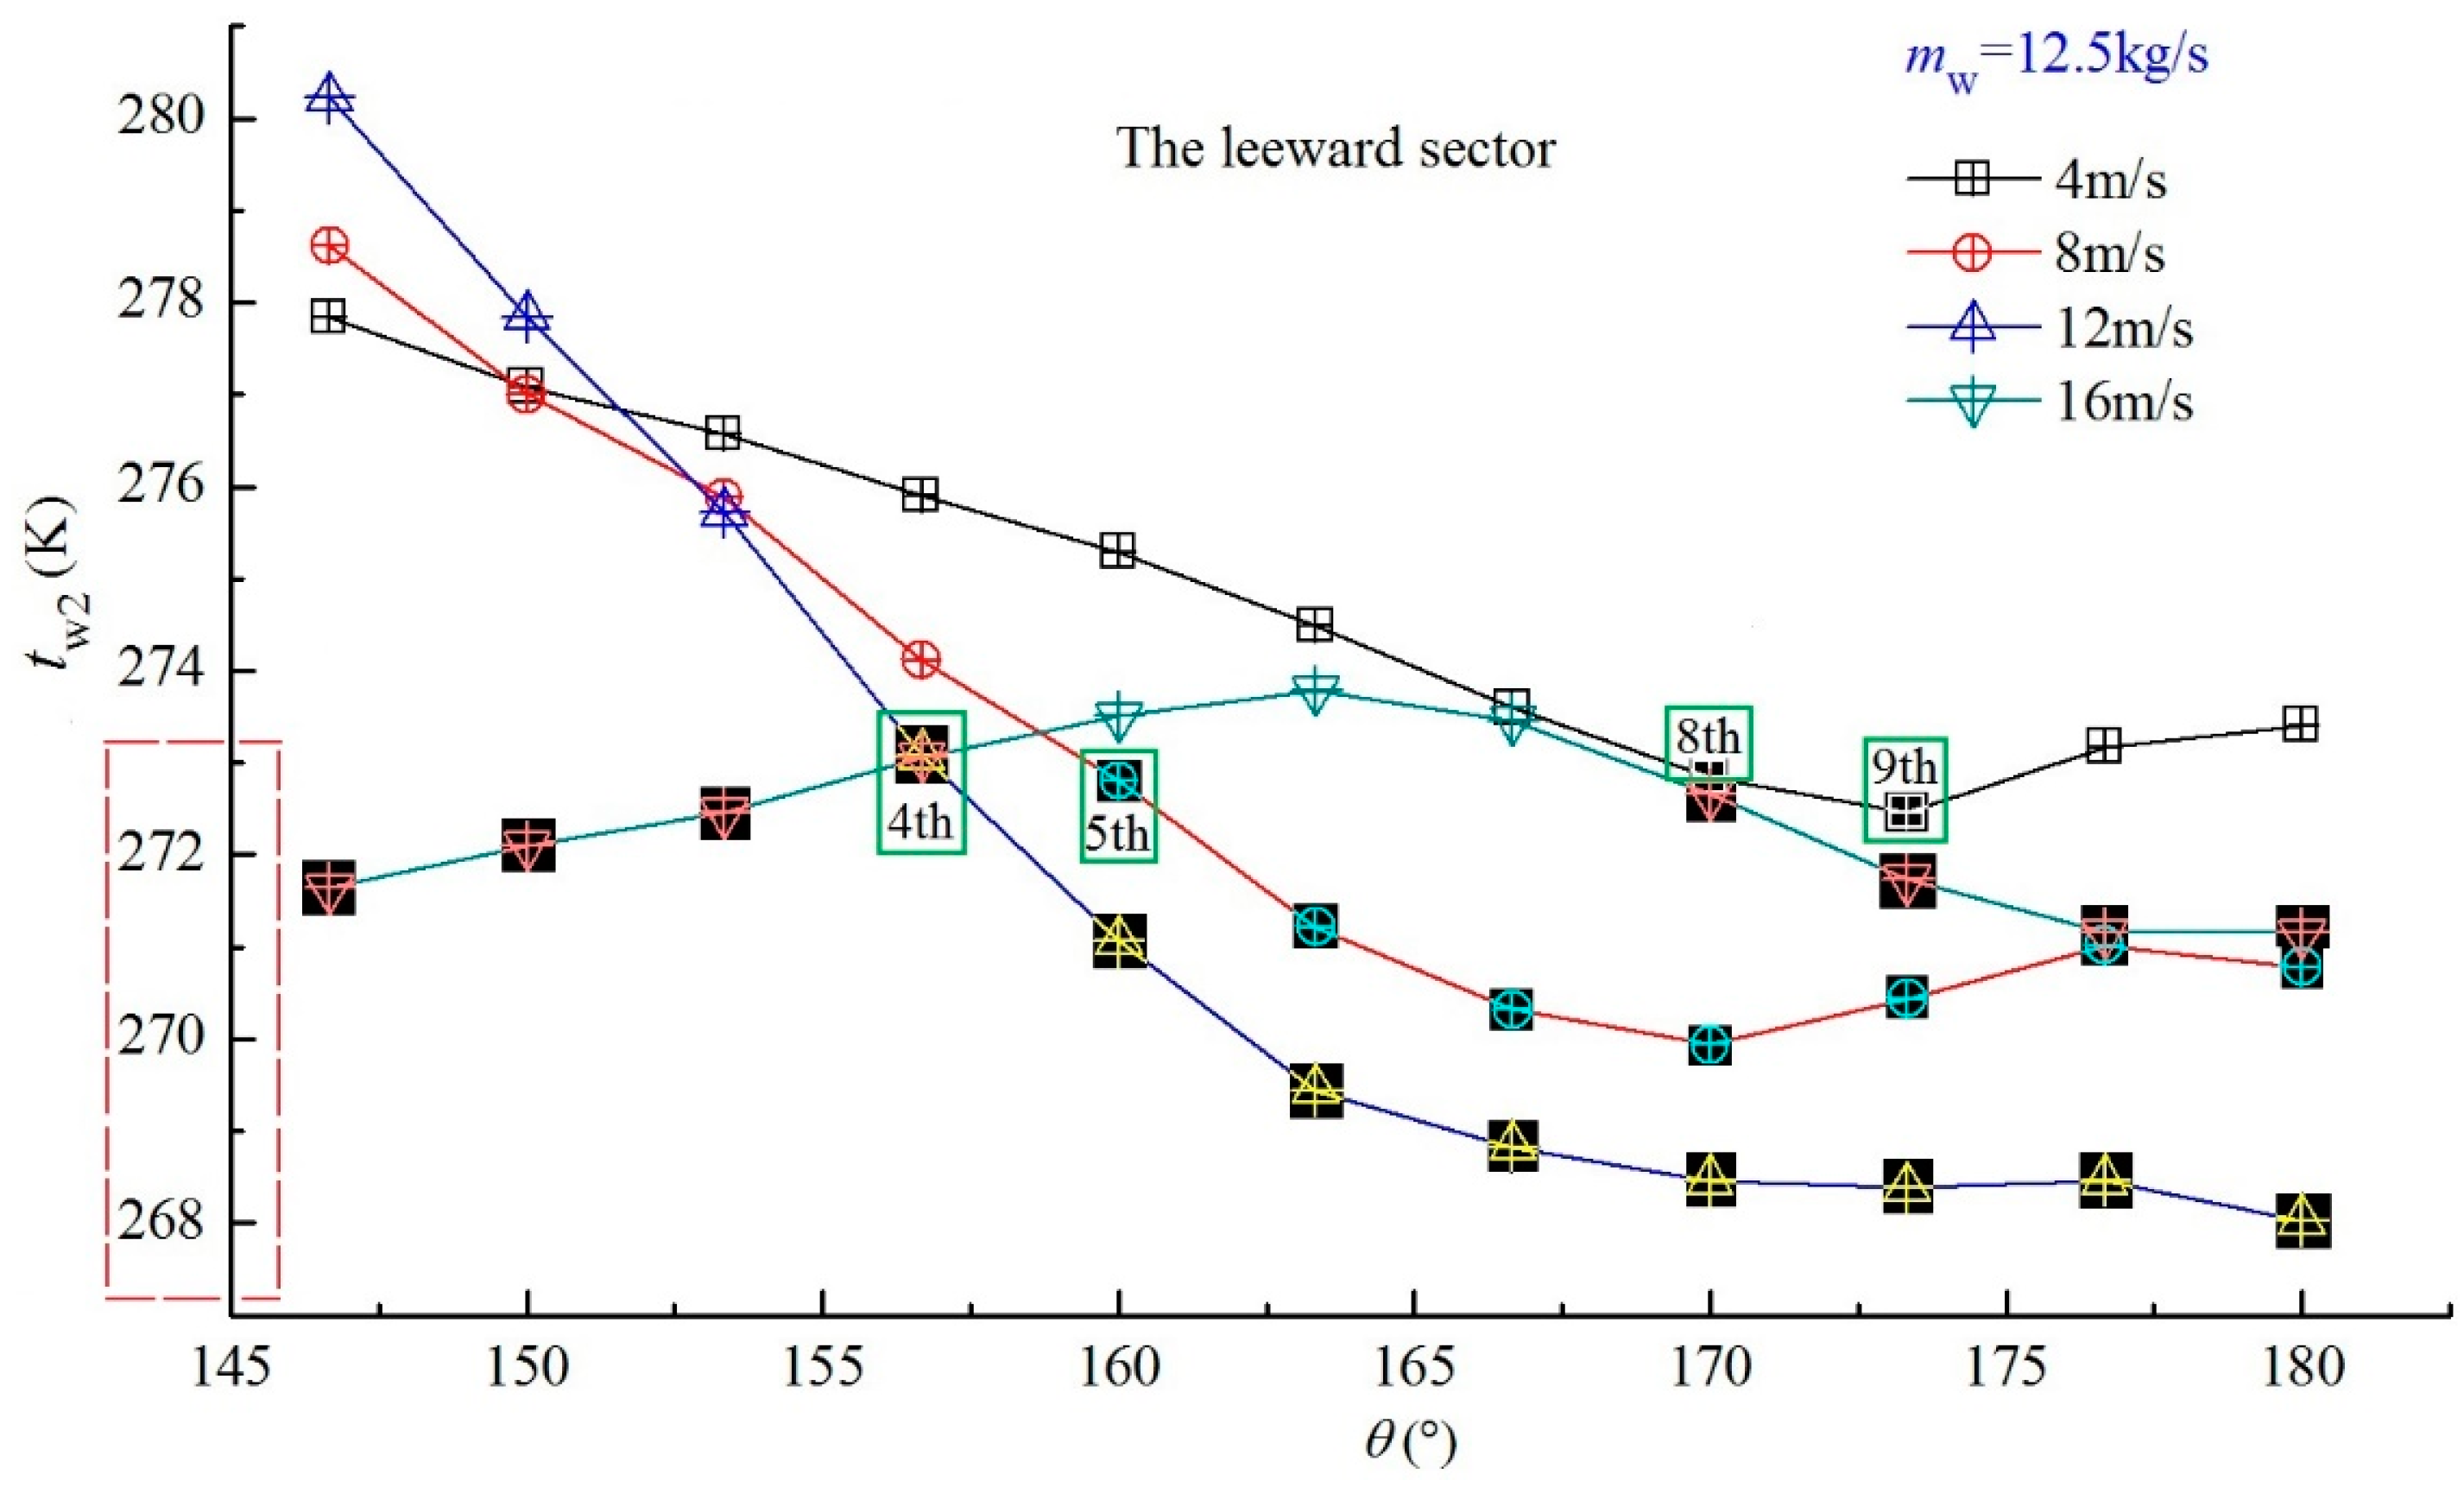
leeward sector with 30% water flow rate increase. Free from freezing
4 m/s282.7282.1281.7281.1280.6279.9279.1278.4277.9278.3278.4
8 m/s284.1282.8281.9280.3279.2277.9277.0276.5276.8277.3276.9
12 m/s285.8283.8282.6280.6278.8277.0276.4276.3276.4276.5275.9
16 m/s278.6278.2278.2278.8279.1279.4279.2278.2277.3277.1277.9
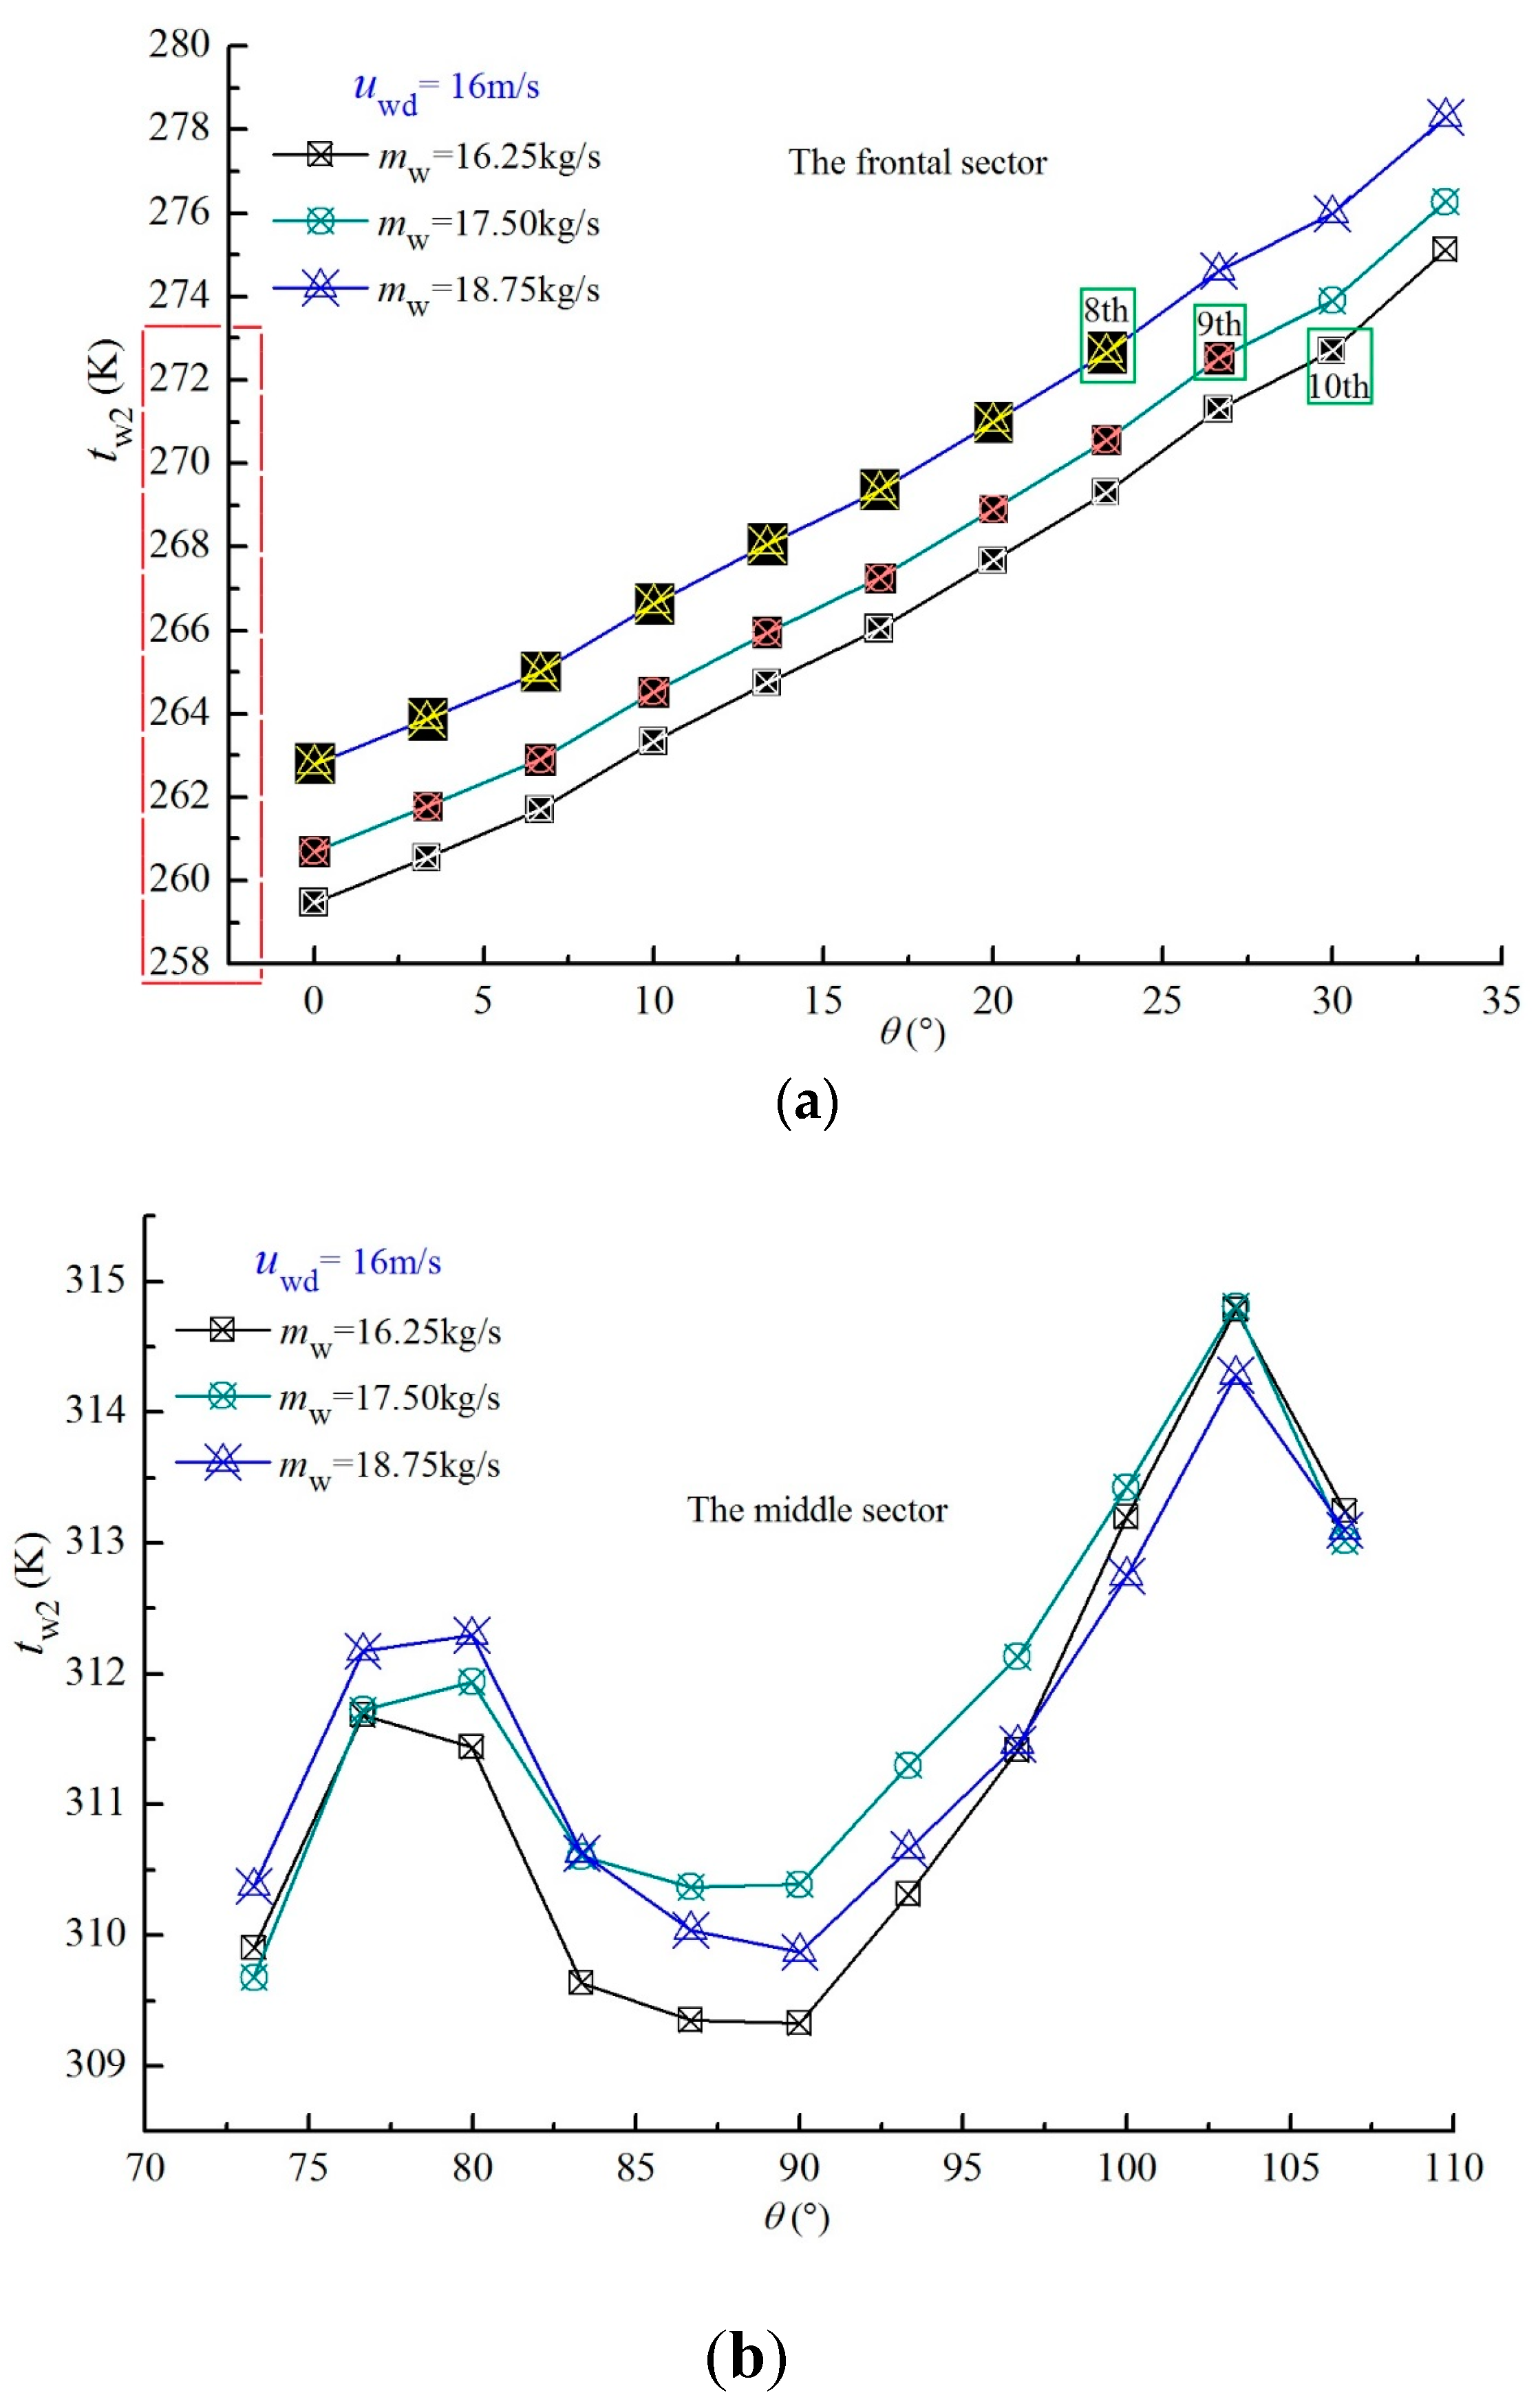
frontal sector with 40% water flow rate increase
4 m/s277.7278.0278.4278.8279.1279.5279.9280.5280.9281.4281.8
8 m/s272.2272.8273.5274.3275.1276.0276.9277.8278.7279.4280.5
12 m/s266.7267.6268.6270.0271.2272.4273.6275.0276.5277.6279.5
16 m/s260.7261.7262.8264.5265.9267.2268.9270.5272.5273.9276.2
middle front sector with 40% water flow rate increase. Free from freezing
4 m/s282.2282.7283.1283.6283.8284.3284.6285.1285.3285.9286.2
8 m/s281.3282.6283.3284.4285.1286.2287.0288.1288.9290.0291.1
12 m/s280.7282.4283.7285.4287.1288.9291.2293.2296.2298.6302.0
16 m/s277.8280.0281.8284.0286.2288.3291.2293.8297.6300.9305.7
leeward sector with 40% water flow rate increase. Free from freezing
4 m/s284.1283.6283.2282.7282.2281.5280.7280.0279.5279.6279.8
8 m/s285.6284.3283.5282.0280.9279.6278.8278.1278.4279.0278.8
12 m/s286.9285.0283.6282.1280.4278.5277.8277.6277.7277.7277.2
16 m/s280.2280.2280.1280.4280.6280.7279.9278.5277.4277.0277.2

