1. Introduction
The recent concern about global warming has produced a series of international policies and agreements aimed at reducing greenhouses gas concentration in the atmosphere. In several sectors, therefore, limits on CO
2 emissions have been imposed. For instance, in transportation sector, EU set a target of 95 gCO
2/km by 2021 for passenger vehicle and 170 g CO
2/km for light duty vehicles, for new registrations [
1]. Moreover, primary pollutant emissions (HC, CO, NO
x, and PM) have to be kept regulated and limited at the same time [
2].
Experimental and theoretical studies have shown that a large portion of vehicles emissions (both CO
2 and harmful pollutants) are largely induced during cold engine [
3,
4] in the early phase of a driving cycle [
5]. This is mainly due to higher engine internal frictional losses [
6], ineffective combustion, and the low efficiency of catalytic converters [
7].
The investigation of the engine transient operation has become an important objective to engine manufacturers, intensified by the fact that significant deviations are experienced when comparing instantaneous transient emissions with their quasi-steady values, [
8,
9]. This increases the importance of the reduction of the engine warm up phase [
10,
11], and, furthermore, it rebounds on interventions on the cooling and lubricating circuits [
12,
13], as well as in the combustion progression. Under misfiring conditions, in fact, combustion cannot supply sufficient power to drive the engine and to overcome the increased friction losses. It is interesting that, unlike acceleration or load acceptance, during cold starting, naturally aspirated engines suffer equally to their turbocharged counterparts [
14]. For example, it has been found that a diesel engine may emit up to seven times more particulate matter during cold operation than under warm conditions [
15]; this represents a serious drawback of these engines when they are used in typical urban trips.
Concentrating on frictional losses, engine components are lubricated with lubricant oils, whose performances are related to its density and viscosity, that, in turn, depend on its temperature [
16]. The viscosity of engine oil is designed to operate efficiently at warmed-up temperatures [
17]; therefore, the high viscosity at cold start-up leads to higher frictional losses [
18]. It is demonstrated that low lubricant temperature (as in cold start-up phase) increases the friction mean effective pressure (FMEP) of the engine by 400% [
19]. Moreover, the majority of vehicles operate at an oil temperature lower than the designed one because of the short lengths of journeys [
20]. Therefore, most part of vehicles generates an excessive quantity of pollutant emissions and consumes more fuel than is expected. Several studies [
21,
22,
23] have indicated that the interaction between ring pack and cylinder liner is the major source of mechanical energy loss of internal combustion engines [
24], but also crankshaft main bearings account for a substantial portion of friction losses during cold engine phases [
25,
26].
Hence, there are several options for improving the lubricant viscosity during the warm up phase: reducing the oil viscosity grade is the more simple option with assured benefits [
27]; insulating the oil sump is interesting, but it has smaller effects on fuel consumption [
28]; reducing the oil thermal mass [
29] surely brings positive effects on warm up time, but concerns remain regarding the oil lifetime and maintenance [
30]. The most effective way to reduce frictional losses is to increase more quickly the lubricant temperature during a drive cycle by pre-heating it or using an active heat input [
31]. Experiments and theoretical studies have been done using external inputs, like electrical heating components [
32] or thermal energy storage [
33] (which can be charged thanks to an external energy source or by thermal sources available on board during normal trips). It is clear, therefore, that the use of an internal heat source is suitable in order to avoid external energy sources, and representing a kind of thermal energy recovery.
Among the thermal sources within the operation of the engine, the most ready and available is the waste heat of the exhaust gases. Although it seems to be a smart way to recover this waste energy to speed up the oil temperature, in literature only few studies are present [
34,
35]. Very high benefits have been demonstrated in terms of fuel consumption saving and harmful emission reduction [
36], but an assessment of the technology when exhaust gases are used is not yet available. Moreover, the interactions of the modified oil and gas circuits with the dynamics of the coolant circuit, with the engine warm up and, finally, with the gas exhaust line (engine backpressure) have not been investigated yet.
Therefore, this paper presents an experimental activity aimed at evaluating the benefits related to the reduction of the oil warm up time in an Iveco F1C (3 L) turbodiesel engine used both for light duty and heavy duty applications. The engine is run on a dynamometer test bench and transient homologation cycles have been implemented. Oil warm up has been accelerated by heating up the oil thanks to the exhaust gases, and the behavior of the lubrication circuit has been reconstructed and compared with the engine reference case without this so-called Waste Heat Recovery (WHR) section. The paper focuses also on the interactions produced in engine by this heating process. Exhaust gases, in fact, reach high temperatures almost immediately [
37,
38], but the additional gases/oil heat exchanger introduces pressure drops on the engine exhaust line that must be considered [
39,
40]. Some modifications in the cooling fluid dynamics have been also observed.
The fuel consumption reduction obtained with a warmer oil is measured in the range of 2–3% (and, therefore, CO2 emissions). Primary pollutants (CO, HC, NOx, and particulate matter) display significant reduction, mainly due to the modified engine temperature dynamics.
2. Novel Oil Lubrication Circuit Design and Experimental System
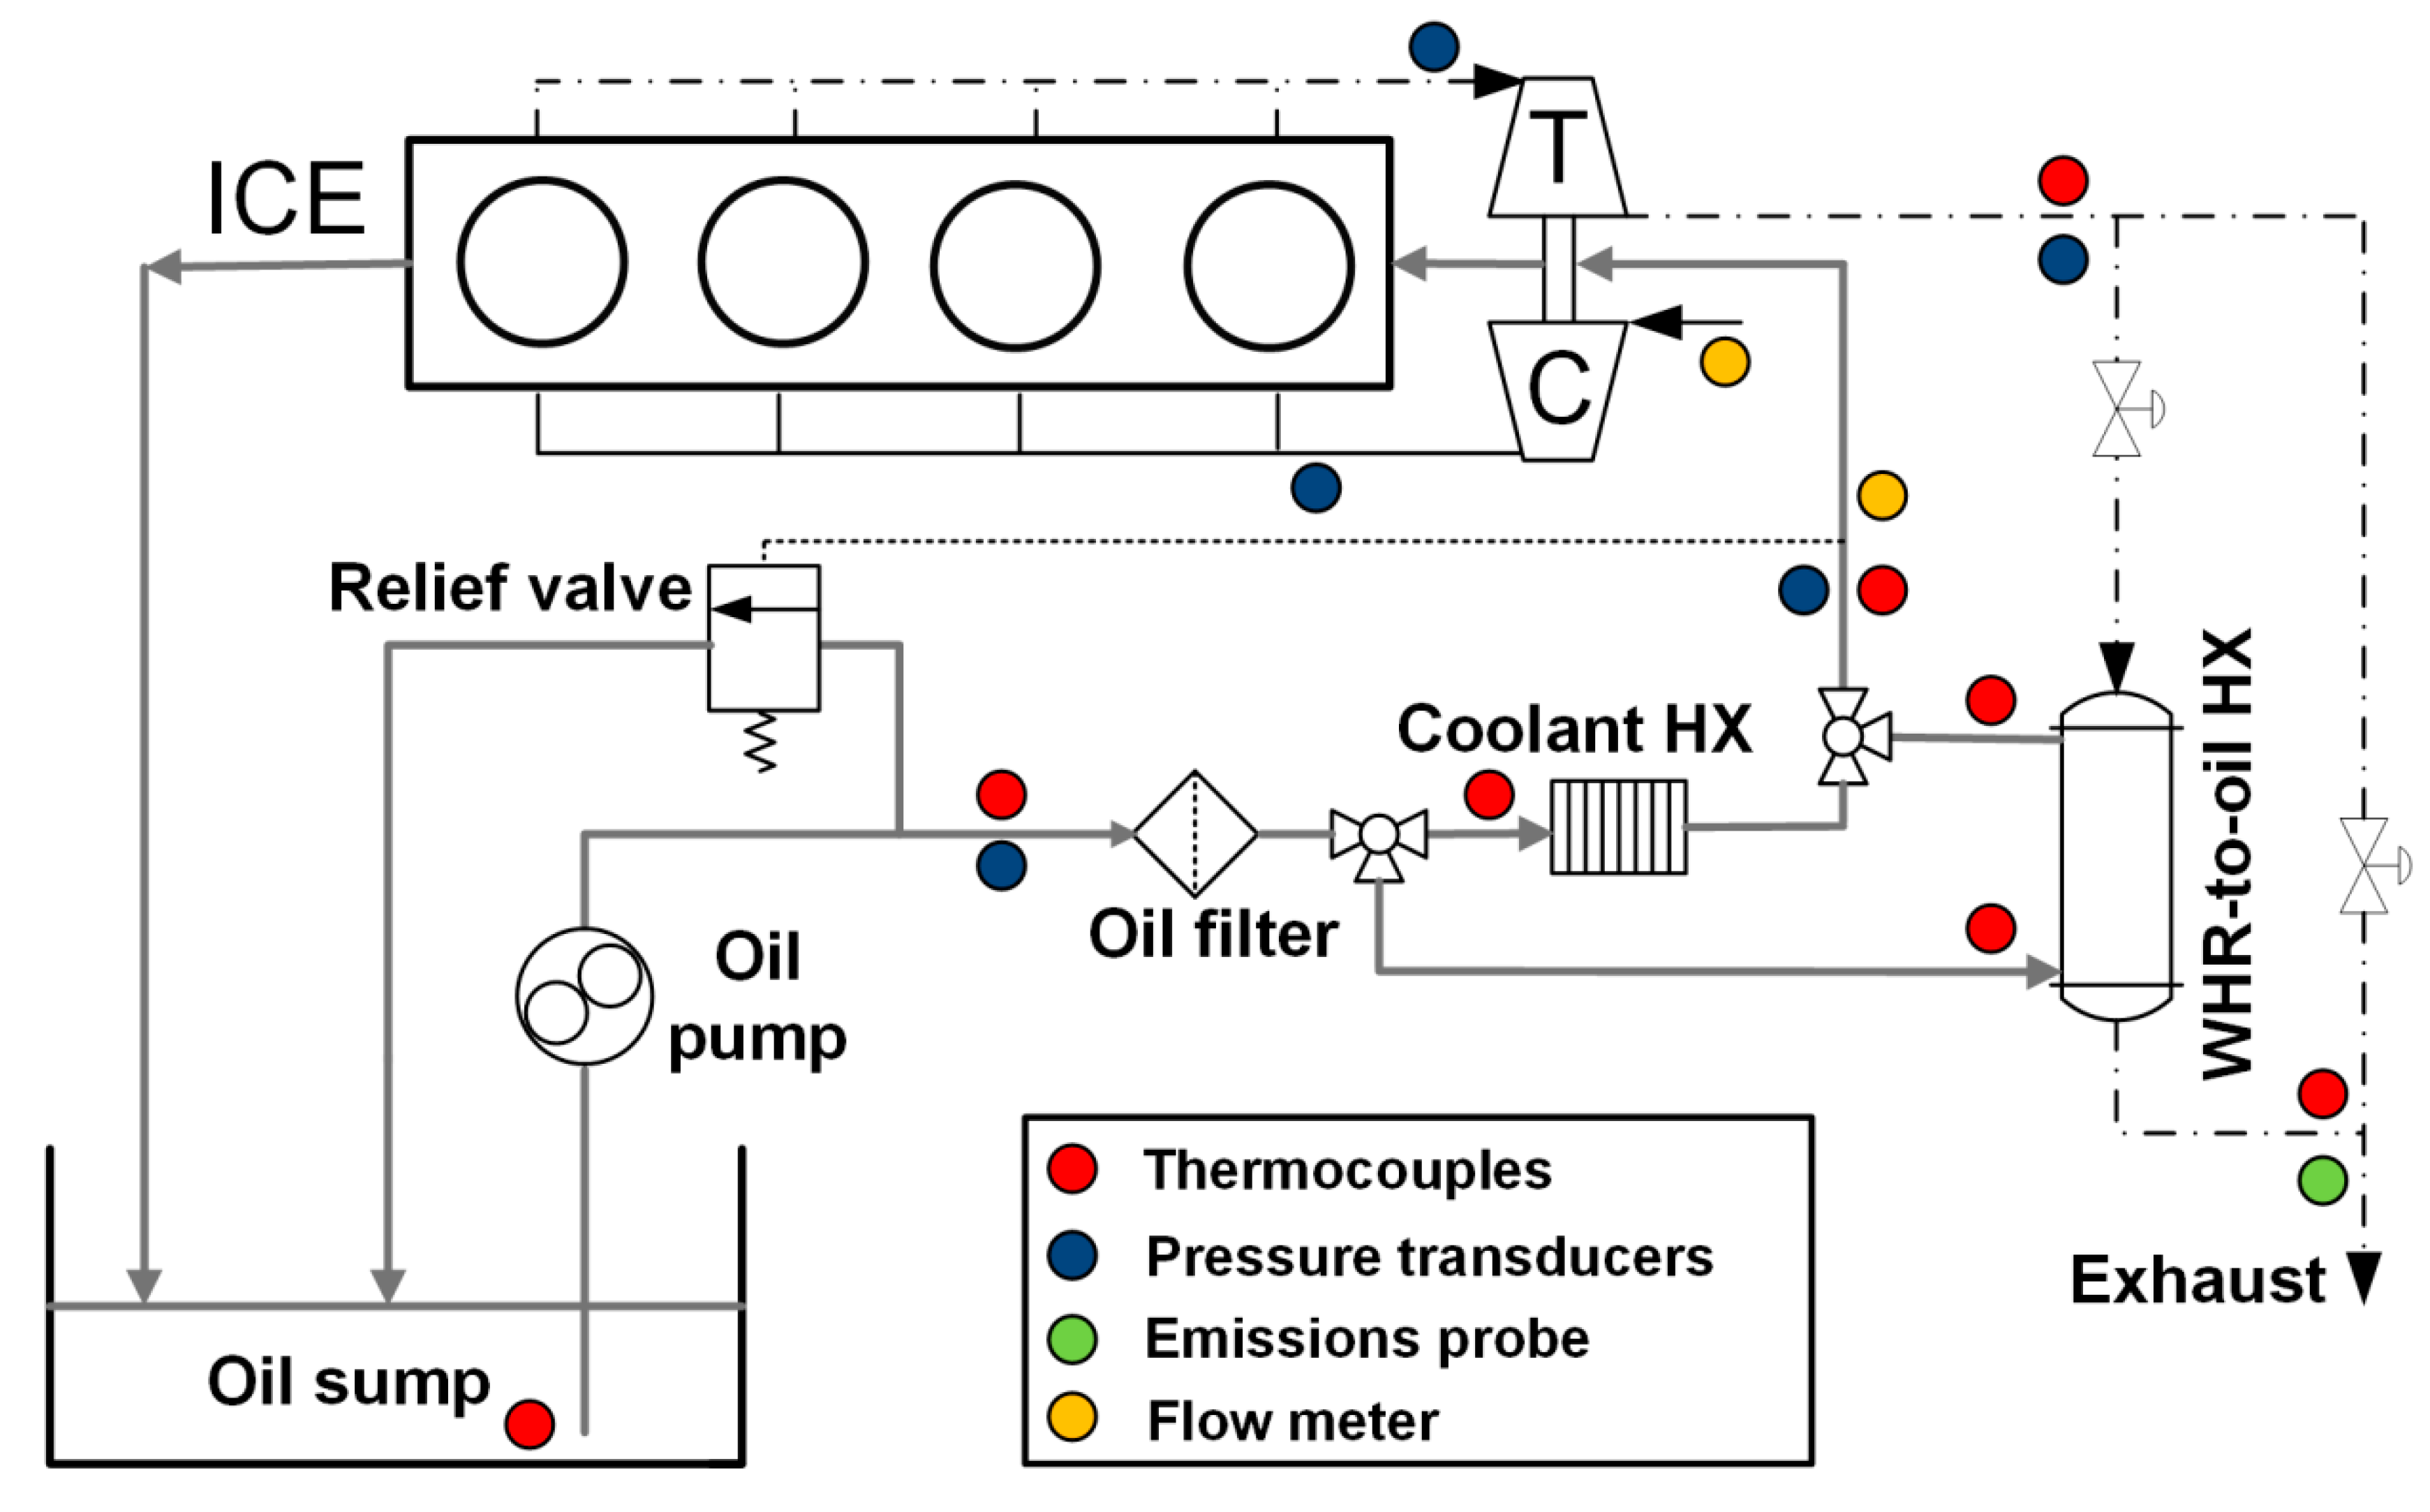
The reference engine is an IVECO F1C 3.0 L turbocharged diesel engine. Its lubricant oil circuit is constituted by a gear pump, equipped with a relief valve, an oil filter, and a coolant-to-oil heat exchanger. The oil is taken from the sump, energized by the pump, and sent to the oil filter and the coolant heat exchanger. This is fundamental in order to keep under control the oil temperature during the engine operation, in particular when thermal regime is reached. The oil in IVECO F1C engine is not only used to lubricate the crankshaft bearings, pistons, and the two camshafts, but it plays an important role in the engine timing: hydraulic tappets, in fact, are used to control the valves openings and two hydraulic tensioners are present in the timing chain. Moreover, oil is used to lubricate also the turbocharger shaft. Finally, the oil falls back down to the sump, after having completed its circuit.
Therefore, in order to avoid overpressures within the engine paths and lubricated components (valves, tappets, tensioners, etc.), the relief valve limits the oil pressure that flow towards the engine by recirculating a certain part of the oil flow rate back to the sump (
Figure 1). Oil gear pump is mechanically linked to the engine crankshaft and it has a flow rate which ranges from 15 to 55 L/min, between 800 and 4000 RPM of the engine.
The new system conceived is composed by a heat exchanger, placed on the exhaust line of the engine, where the lubricant oil is heated up by the waste gases. Therefore, the lubricant circuit of the F1C has been modified and a shell and tube heat exchanger has been designed in order to be used for the Waste Heat Recovery to the oil. This WHR-to-oil heat exchanger is positioned in a derivate branch of the lubricant circuit, in parallel with the coolant-to-oil heat exchanger. In this layout, in fact, WHR-to-oil HX can be crossed by the oil when oil is cold and engine is warming up, while, at thermal regime, when oil is already hot, the coolant heat exchanger permits the thermal regulation of the oil, and WHR-to-oil HX is bypassed. In this case, also, pressure drops on the oil circuit are limited with respect to a series layout of the two heat exchangers. Two thermostatic three-way valves could be used to control the flows through the two parallel branches. Furthermore, a bypass line has been realized also on the exhaust gases: when oil (and engine) is hot, the WHR-to-oil should be bypassed in order to avoid to cook the oil left in the WHR-to-HX and to reduce the eventual exhaust particles deposition on the exhaust side of the heat exchanger, which in turn would reduce heat transfer efficiency.
Engine test bench has been fully equipped in order to measure all the relevant quantities of the lubricant circuit. AVL APA 100 dynamometer is used to drive the engine according to the homologation cycle. Air mass flow rate is measured at the intake duct, while fuel consumption through a fuel balance, allowing the calculation of the exhaust gas mass flow rate. Pollutants and CO
2 emissions are measured at the exhaust, without considering the after-treatment devices. Pressure transducers are placed in intake manifold, exhaust manifold (upstream turbine), and in the exhaust line in order to evaluate the effect of the additional heat exchanger on the engine performances. Thermocouples are used to measure the exhaust temperature and, so, the thermal power on the WHR-to-oil heat exchanger. Also, the lubricating circuit has been properly instrumented: flow meter, thermocouples, and pressure sensors are used to evaluate the thermal and fluid dynamics of the oil during a transient cycle. The exact position of the sensors is also shown in
Figure 1, and their uncertainties are shown in
Table 1.
A very important component is the heat exchanger that has to transfer the thermal power from the exhaust gases to the lubricant oil. Among the technological options, the shell-tube one has been chosen for its good performance (in particular in off-design conditions) and its applicability on-board. Gases can pass through the tubes, and the oil, on the other hand, passes in the shell.
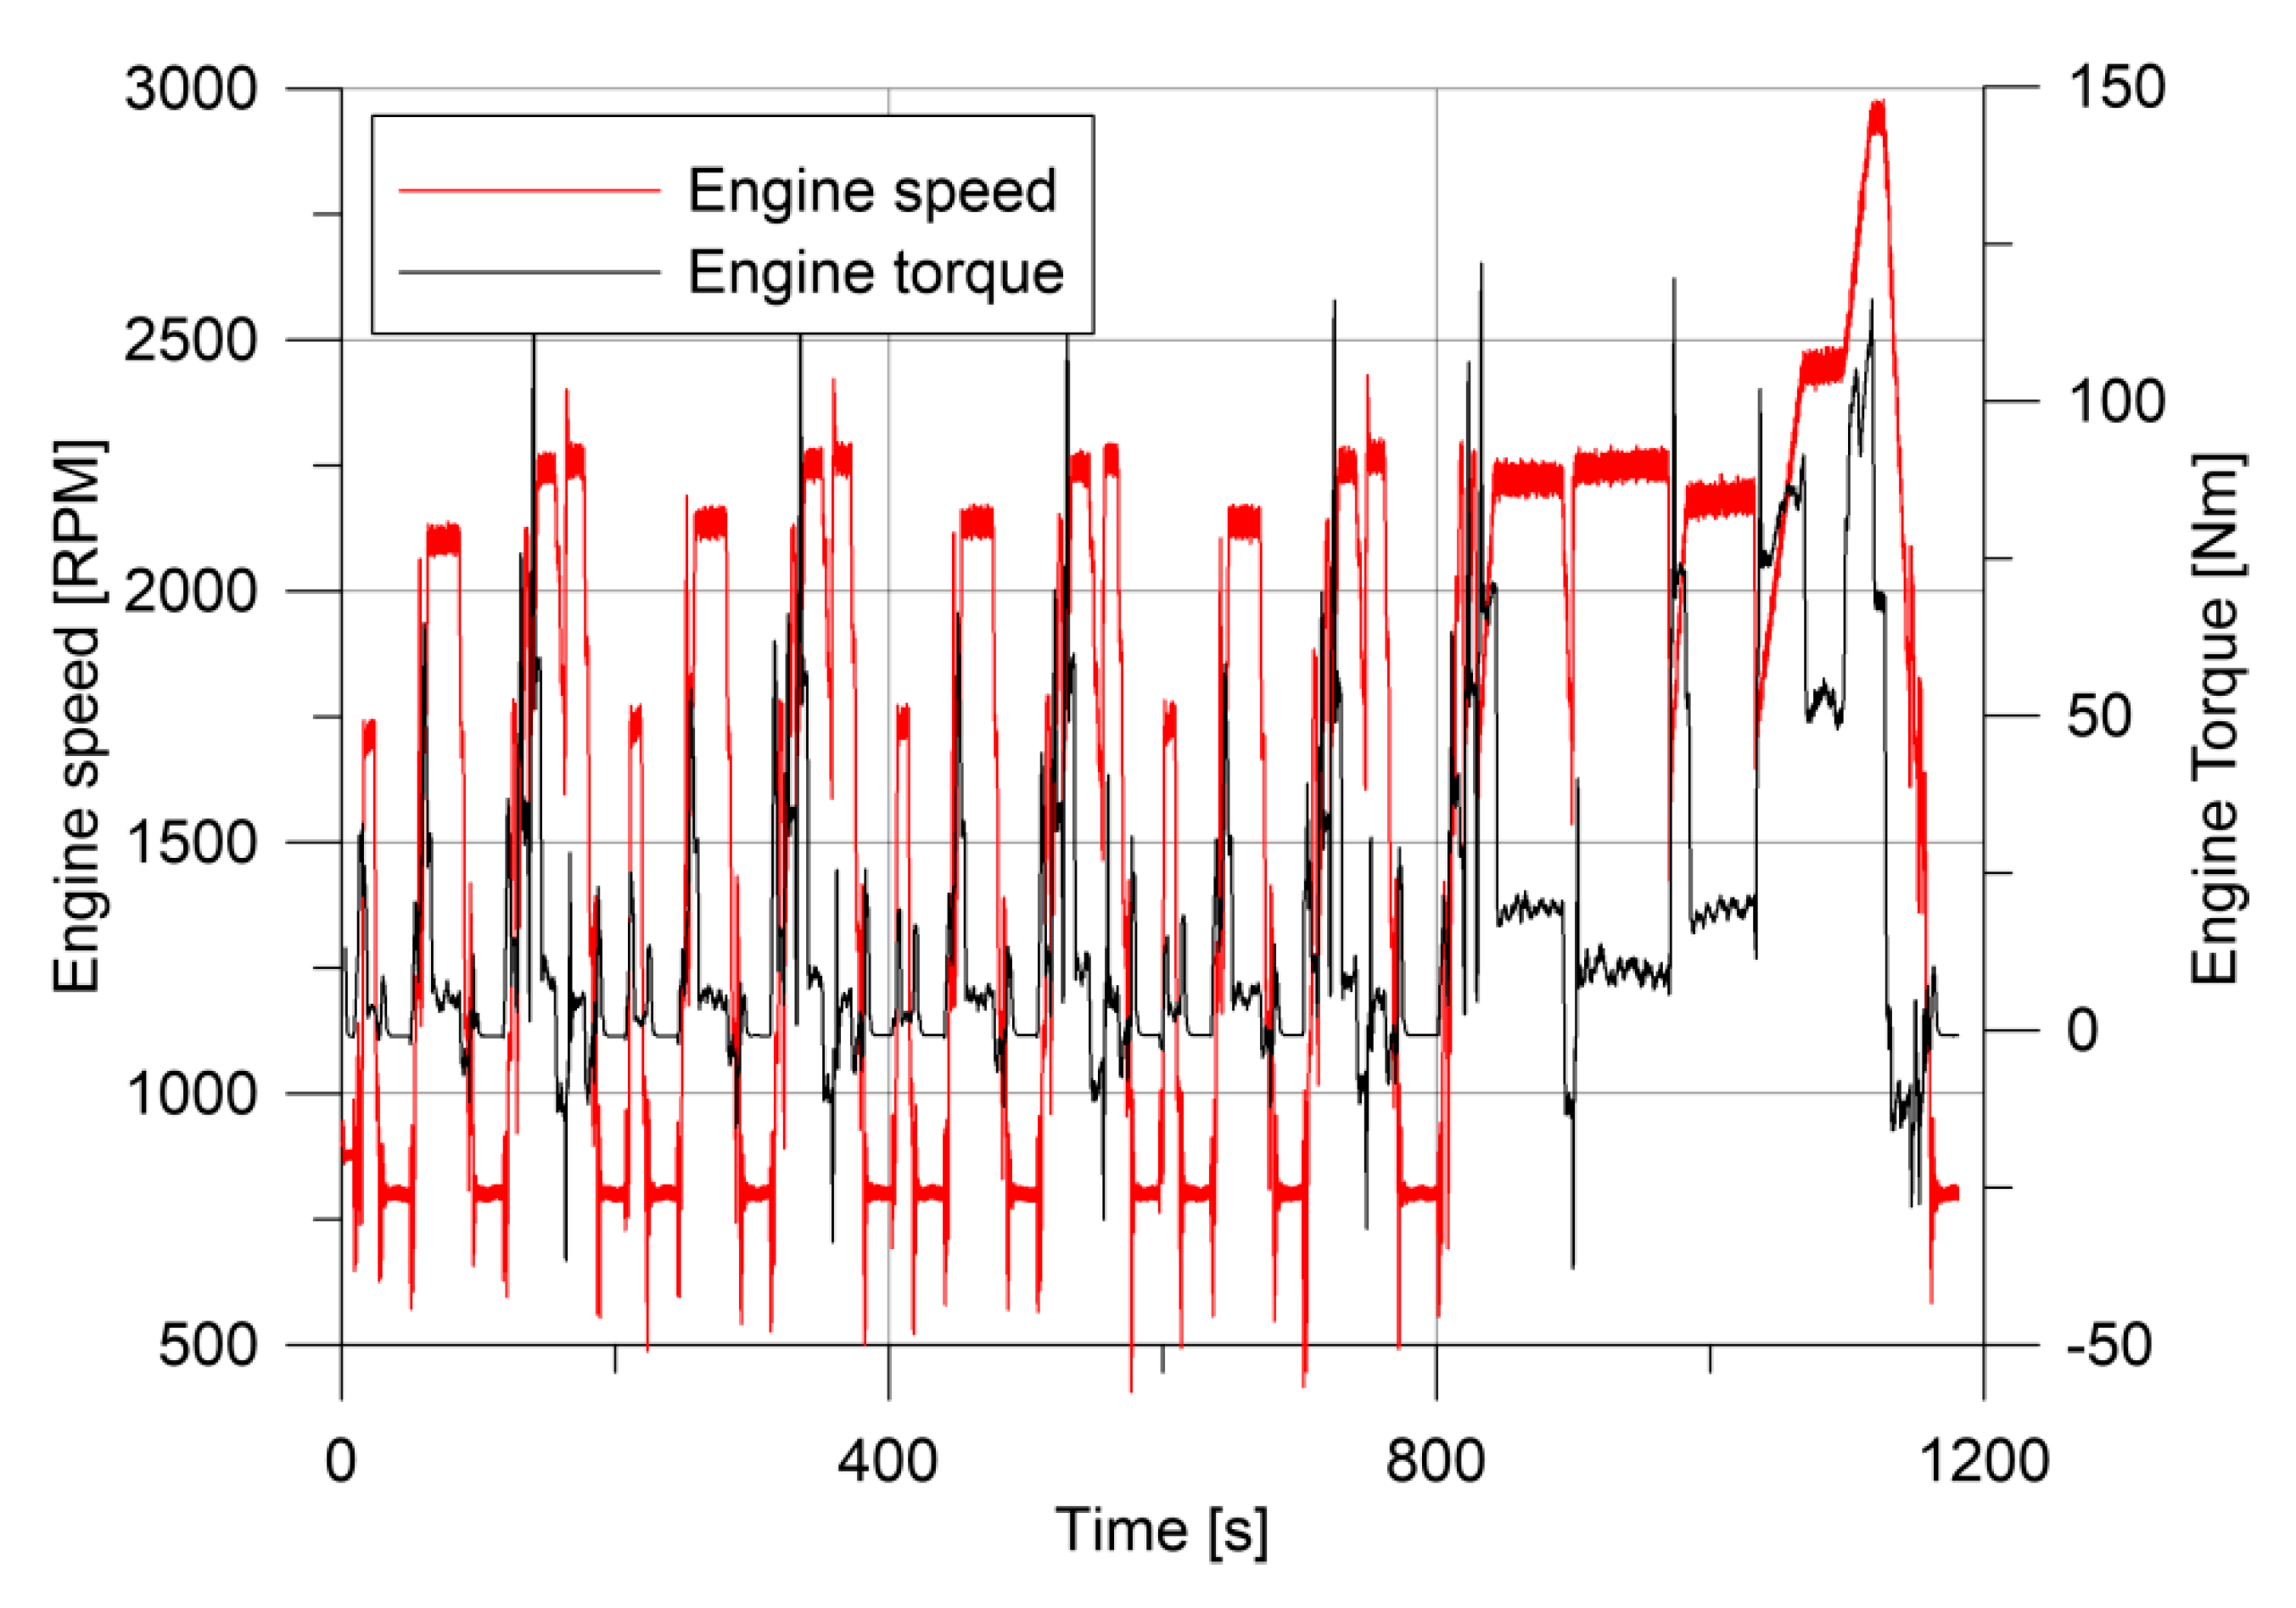
The sizing of such a heat exchanger should consider the real operation in transient conditions. In fact, it has to work only when engine and oil are cold, during the initial phase of a driving cycle. The reference one is still the NEDC (New European Driving Cycle), used for the homologation of the passenger cars and light duty vehicle. It is composed by a sequence of four ECE (urban) cycles and a last extra-urban part (EUDC). Therefore, NEDC has been reproduced on the test bench, considering a commercial light duty vehicle (IVECO Daily) as reference, on which the F1C engine is mounted. Tests have been repeated with the same engine calibration and in different seasonal environmental conditions.
Figure 2 shows the sequence of engine speed and engine torque applied to the engine through the dynamic test bench.
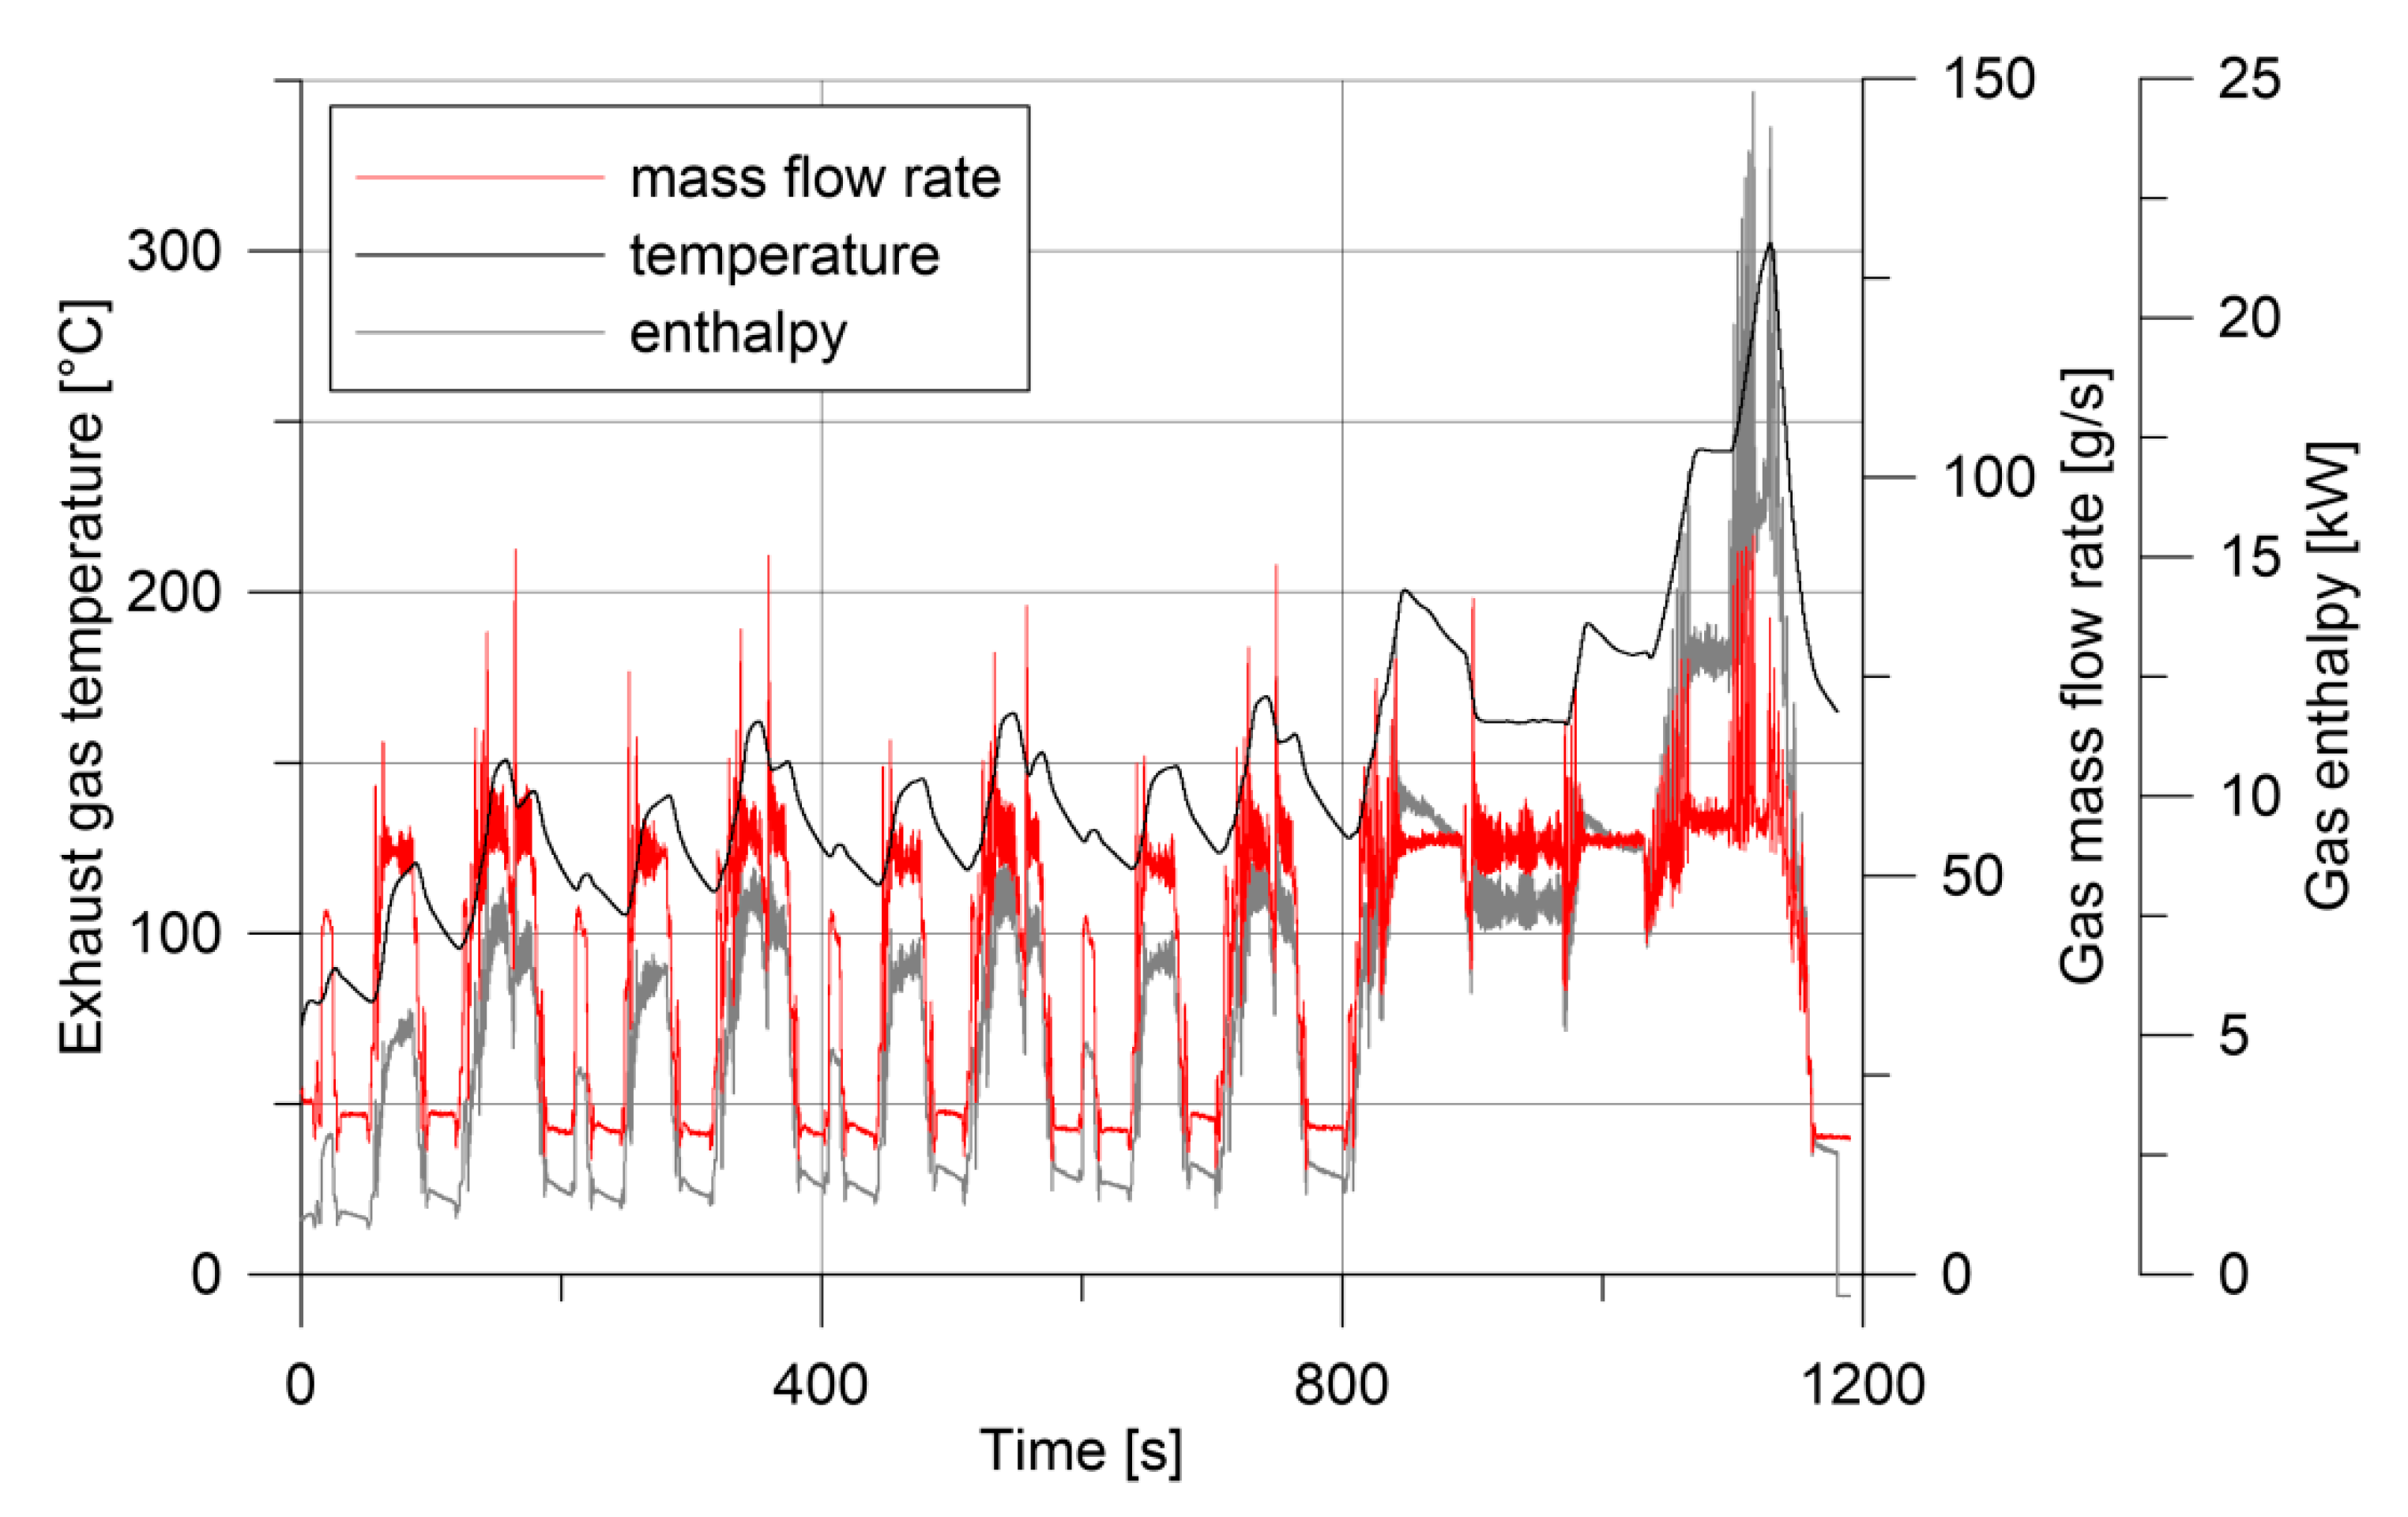
Exhaust gases have variable flow rate and temperature during the instantaneous engine speed and torque variations. Their temperature has a fast dynamics: a suitable value for heat recovery above 150 °C is reached after 200 s (
Figure 3). Although these values are not so high during initial phases, exhaust gases are the most ready thermal source available on board for heating purposes.
The purpose of the work is to accelerate the warm up of the oil by using the thermal energy available on the exhaust gases wasted in the atmosphere. Therefore, the heat exchanger used should maximize the thermal power transferred from the gases to the oil and should raise, as much as possible, the oil temperature. This has to be done in the early 800 s of the NEDC cycle, when the oil is still at low temperature. The maximum thermal power available from the gas is represented by its enthalpy and reported in
Figure 3; in the first 800 s, when the WHR-to-oil is applicable, the average value is about 5 kW. This value has been considered when designing the WHR-to-oil heat exchanger. Noticeably, this heat exchanger is placed after the catalyst/DPF section, in order to not undercool the exhaust after-treatment components and to preserve their functionality. Therefore, the eventual particles deposition on the tubes side of the heat exchanger would be limited. In any case, the eventual clogging of the tubes of the heat exchanger could be measured on board by differential pressure transducers, and the heat exchanger exhaust branch could be bypassed till to a maintenance action. The dimensions of the tubes, inside which exhaust gases pass, could be also considered in the design of the component, in order to make a longer maintenance time.
At the same time, oil flow rate depends on oil pump speed (fixed by the engine speed), but it also depends on oil temperature, with the oil density having a significant range of variation during oil warm up. When oil is cold, in fact, oil flow rate is lower than when oil is hotter (last part of the NEDC cycle): during the first four urban phases of the cycle, the sequence of engine speeds repeats, but the oil circulation rate changes from 10 L/min to 30 L/min, thereby reporting the effect of the oil temperature on the density.
The first constraint taken into account in the heat exchanger design is its outer shell diameter: it should be fitted for convenience within the exhaust line, which has an external diameter of 54.2 mm. The number of tubes and their diameter, on the other hand, should minimize the pressure drop of the gases across the heat exchanger, in order to avoid excessive backpressure on the engine. Also in this case, the average value of the exhaust thermal and fluid dynamics conditions (in the first 800 s of the NEDC) has been taken as a design value, comprising 50 g/s and 125 °C at the heat exchanger tubes inlet side. Pressure drops Δ
P have been initially designed to be under 80 mbar at the design gas flow rate (Equation (1)).
where the first right hand side term represents the distributed pressure drop along tubes, and the second (Δ
Pc) takes into account concentrated pressure drops due to headers.
f represents the friction factor,
ρ is the density of the gas, and
v is the fluid velocity (evaluated while knowing the design mass flow rate).
D is the tubes diameter, while
L represents the length of the heat exchanger and
Nt the number of tubes.
Logarithmic Mean Difference Temperature (LMDT) method has been used to size the heat exchanger (Equation (2)).
Correction factor
F is considered equal to 0.8 for safety design reasons. Knowing the inlet and outlet temperatures, the logarithmic mean temperatures can be evaluated.
Q is the thermal power transferred. The overall heat transfer coefficient
U is calculated according to Equation (3):
where
kwall is the thermal conductivity of the heat exchanger’s walls. During the operation of the heat exchanger, the conductive resistance can be increased by the particles deposition, but it is very small and, anyway, it can be still neglected if compared to the convective ones. Moreover, thermal power owned by the exhaust gases is so much higher than the one of the oil that also a reduction of the heat transfer overall coefficient of the heat exchanger would not significantly affect the oil temperature warming up. Convective heat transfer coefficients
h are calculated according to Dittus-Boelter correlation (Equation (4)), which is the most used one in literature. Fluid properties have been evaluated thanks to proper databases relating thermodynamic properties with temperature and pressure. In particular, thermal conductivity of the oil has been considered only temperature dependent, interpolating the specific value between 0.144 W/m·K at 25 °C and 0.136 at 100 °C W/m·K [
41]; thermal properties of the exhaust gases (so, also the thermal conductivity), on the other hand, have been evaluated considering a suitable composition of the gases coming from diesel engine combustion, using NIST databases.
where
D is the reference diameter for each fluid. The heat exchanger design needs an iterative procedure in order to verify all the constraints.
Table 2 shows the characteristics of the heat exchanger tested.
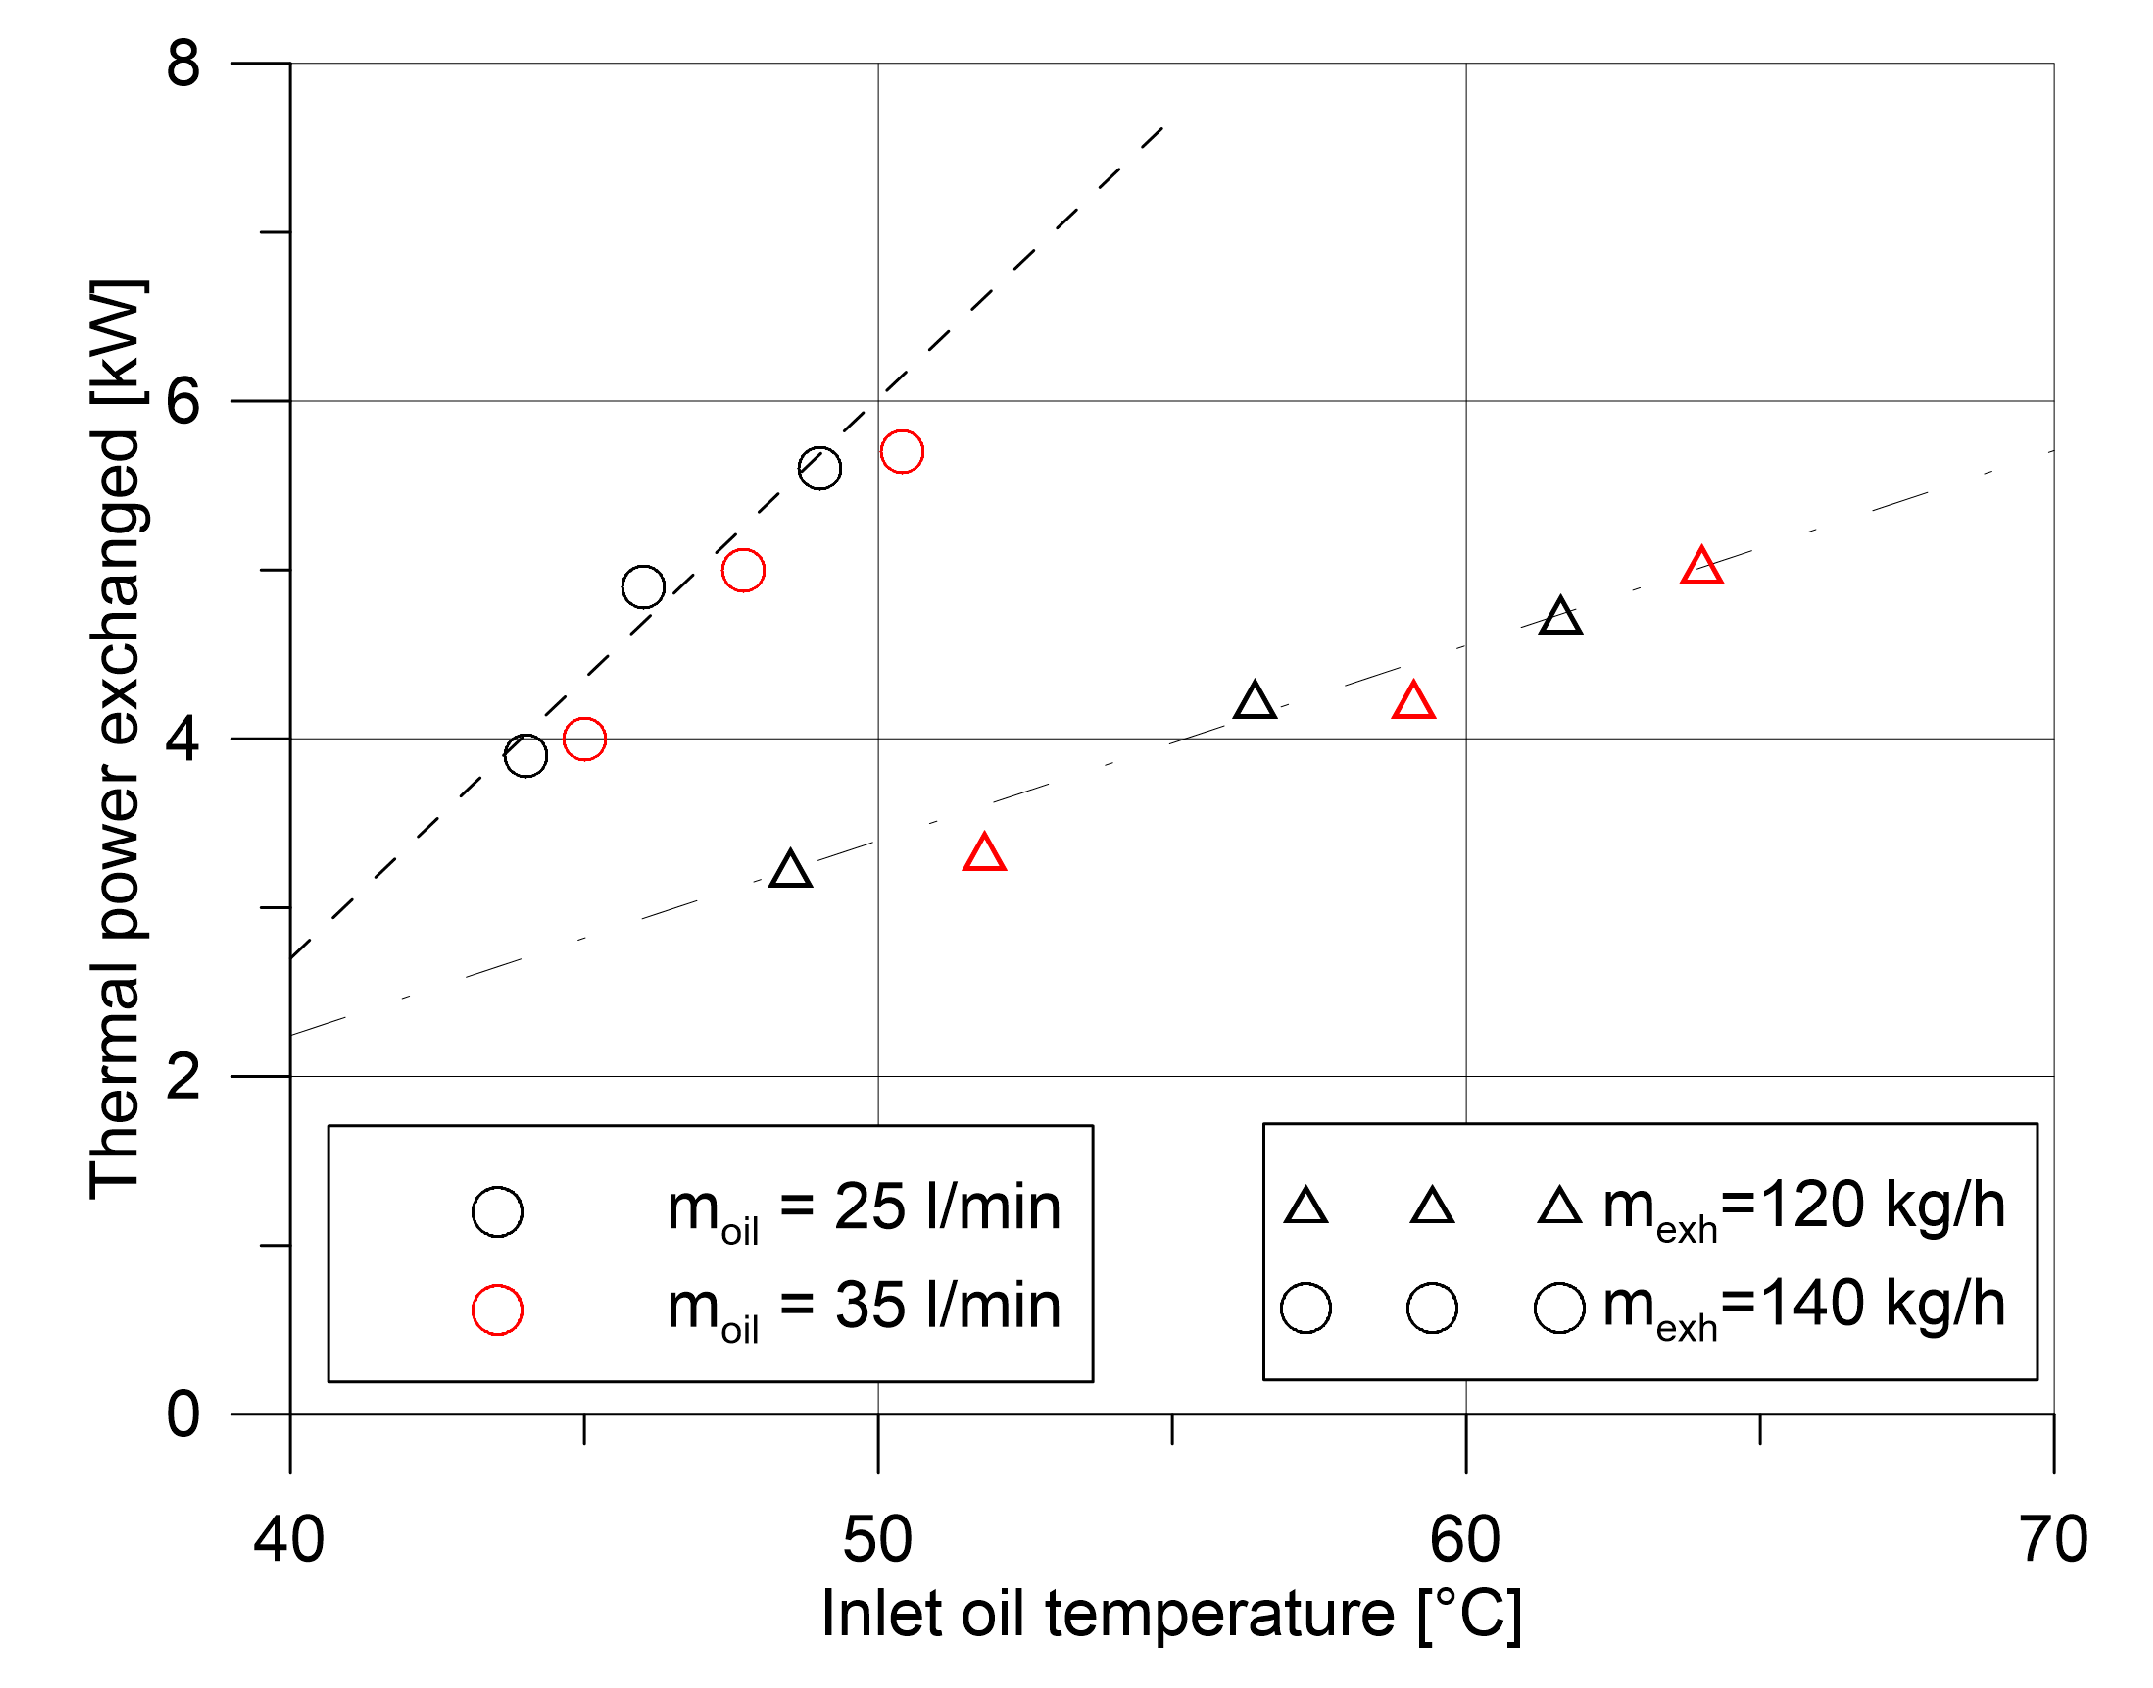
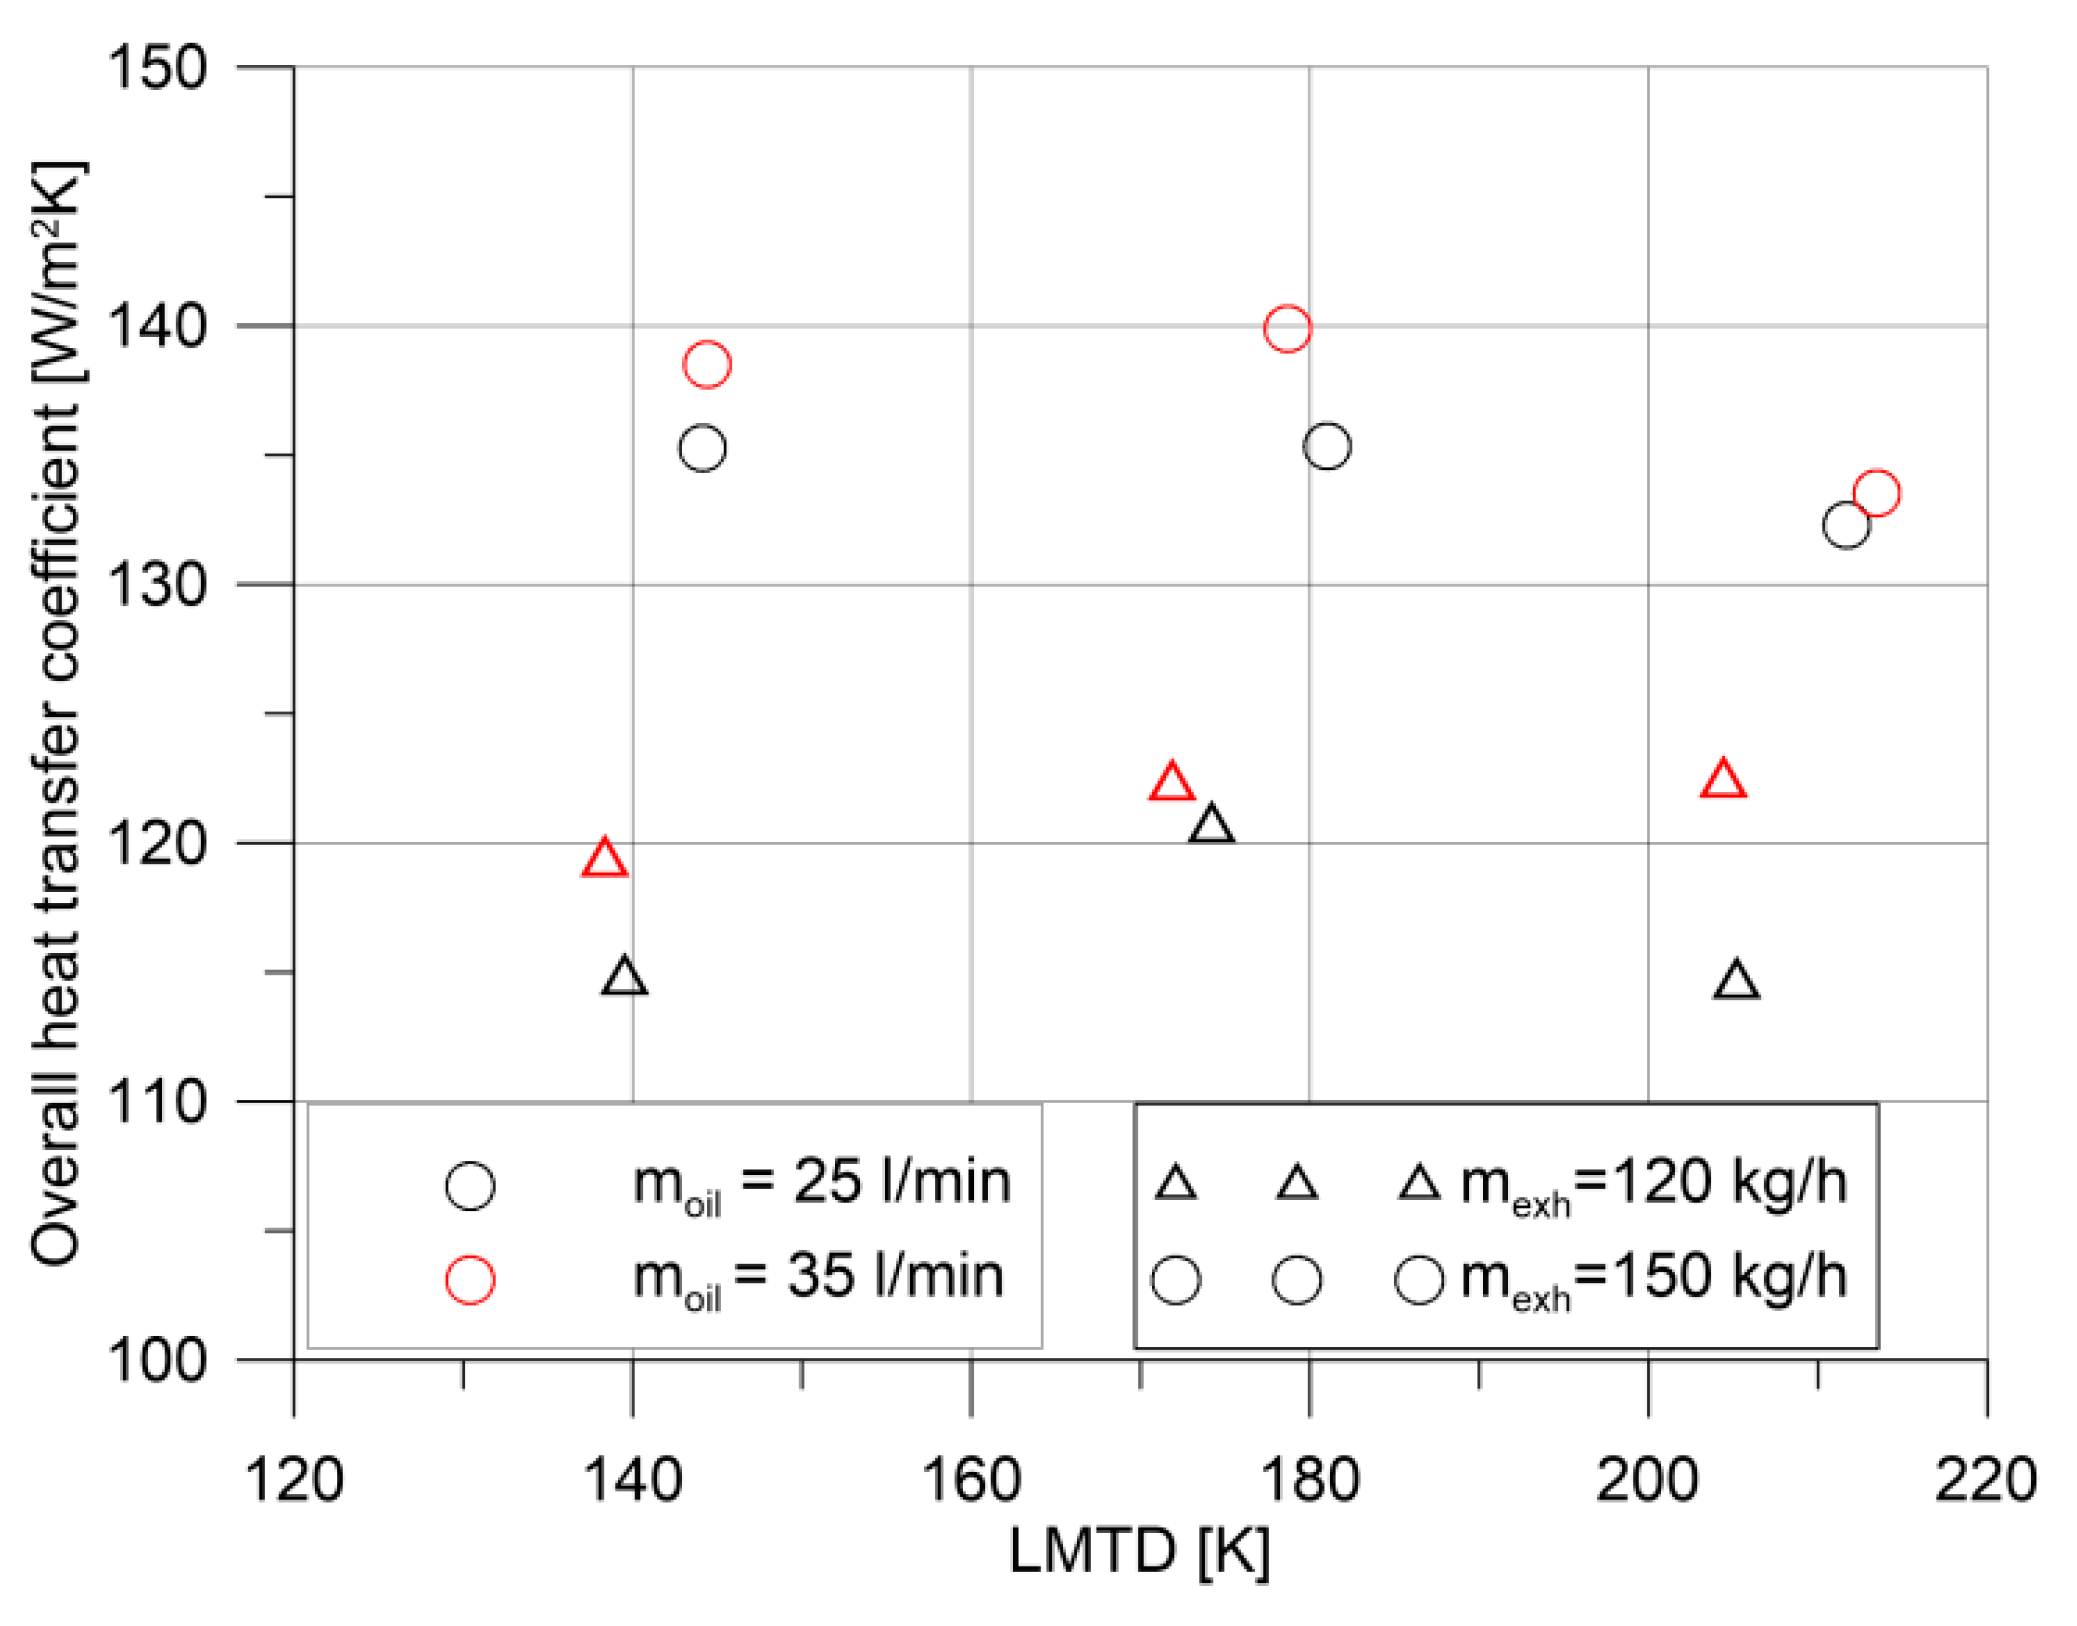
The results of preliminary tests done on the heat exchanger are shown in
Figure 4 and
Figure 5. Two different exhaust gas mass flow rates have been applied to different temperature and flow rates of the oil flowing in the shell; black points represent tests with oil flow rate equal to 25 L/min, while red ones are for 35 L/min; triangles represent, instead, exhaust flow rate equal to 120 kg/h, and circles 150 kg/h. Thermal power exchanged is in the range of 3–6 kW, and the calculated heat transfer coefficients range from 200 to 250 W/m
2·K for the exhaust gases, while it is about 250–300 W/m
2·K on the oil side. This results in an overall heat transfer coefficient between 115 and 140 W/m
2·K. In
Figure 4 and
Figure 5, it is demonstrated that it more strongly depends on the exhaust gas flow rate (flowing in the tubes), while the oil flow rate does not show significant influence on the heat exchanger performances.
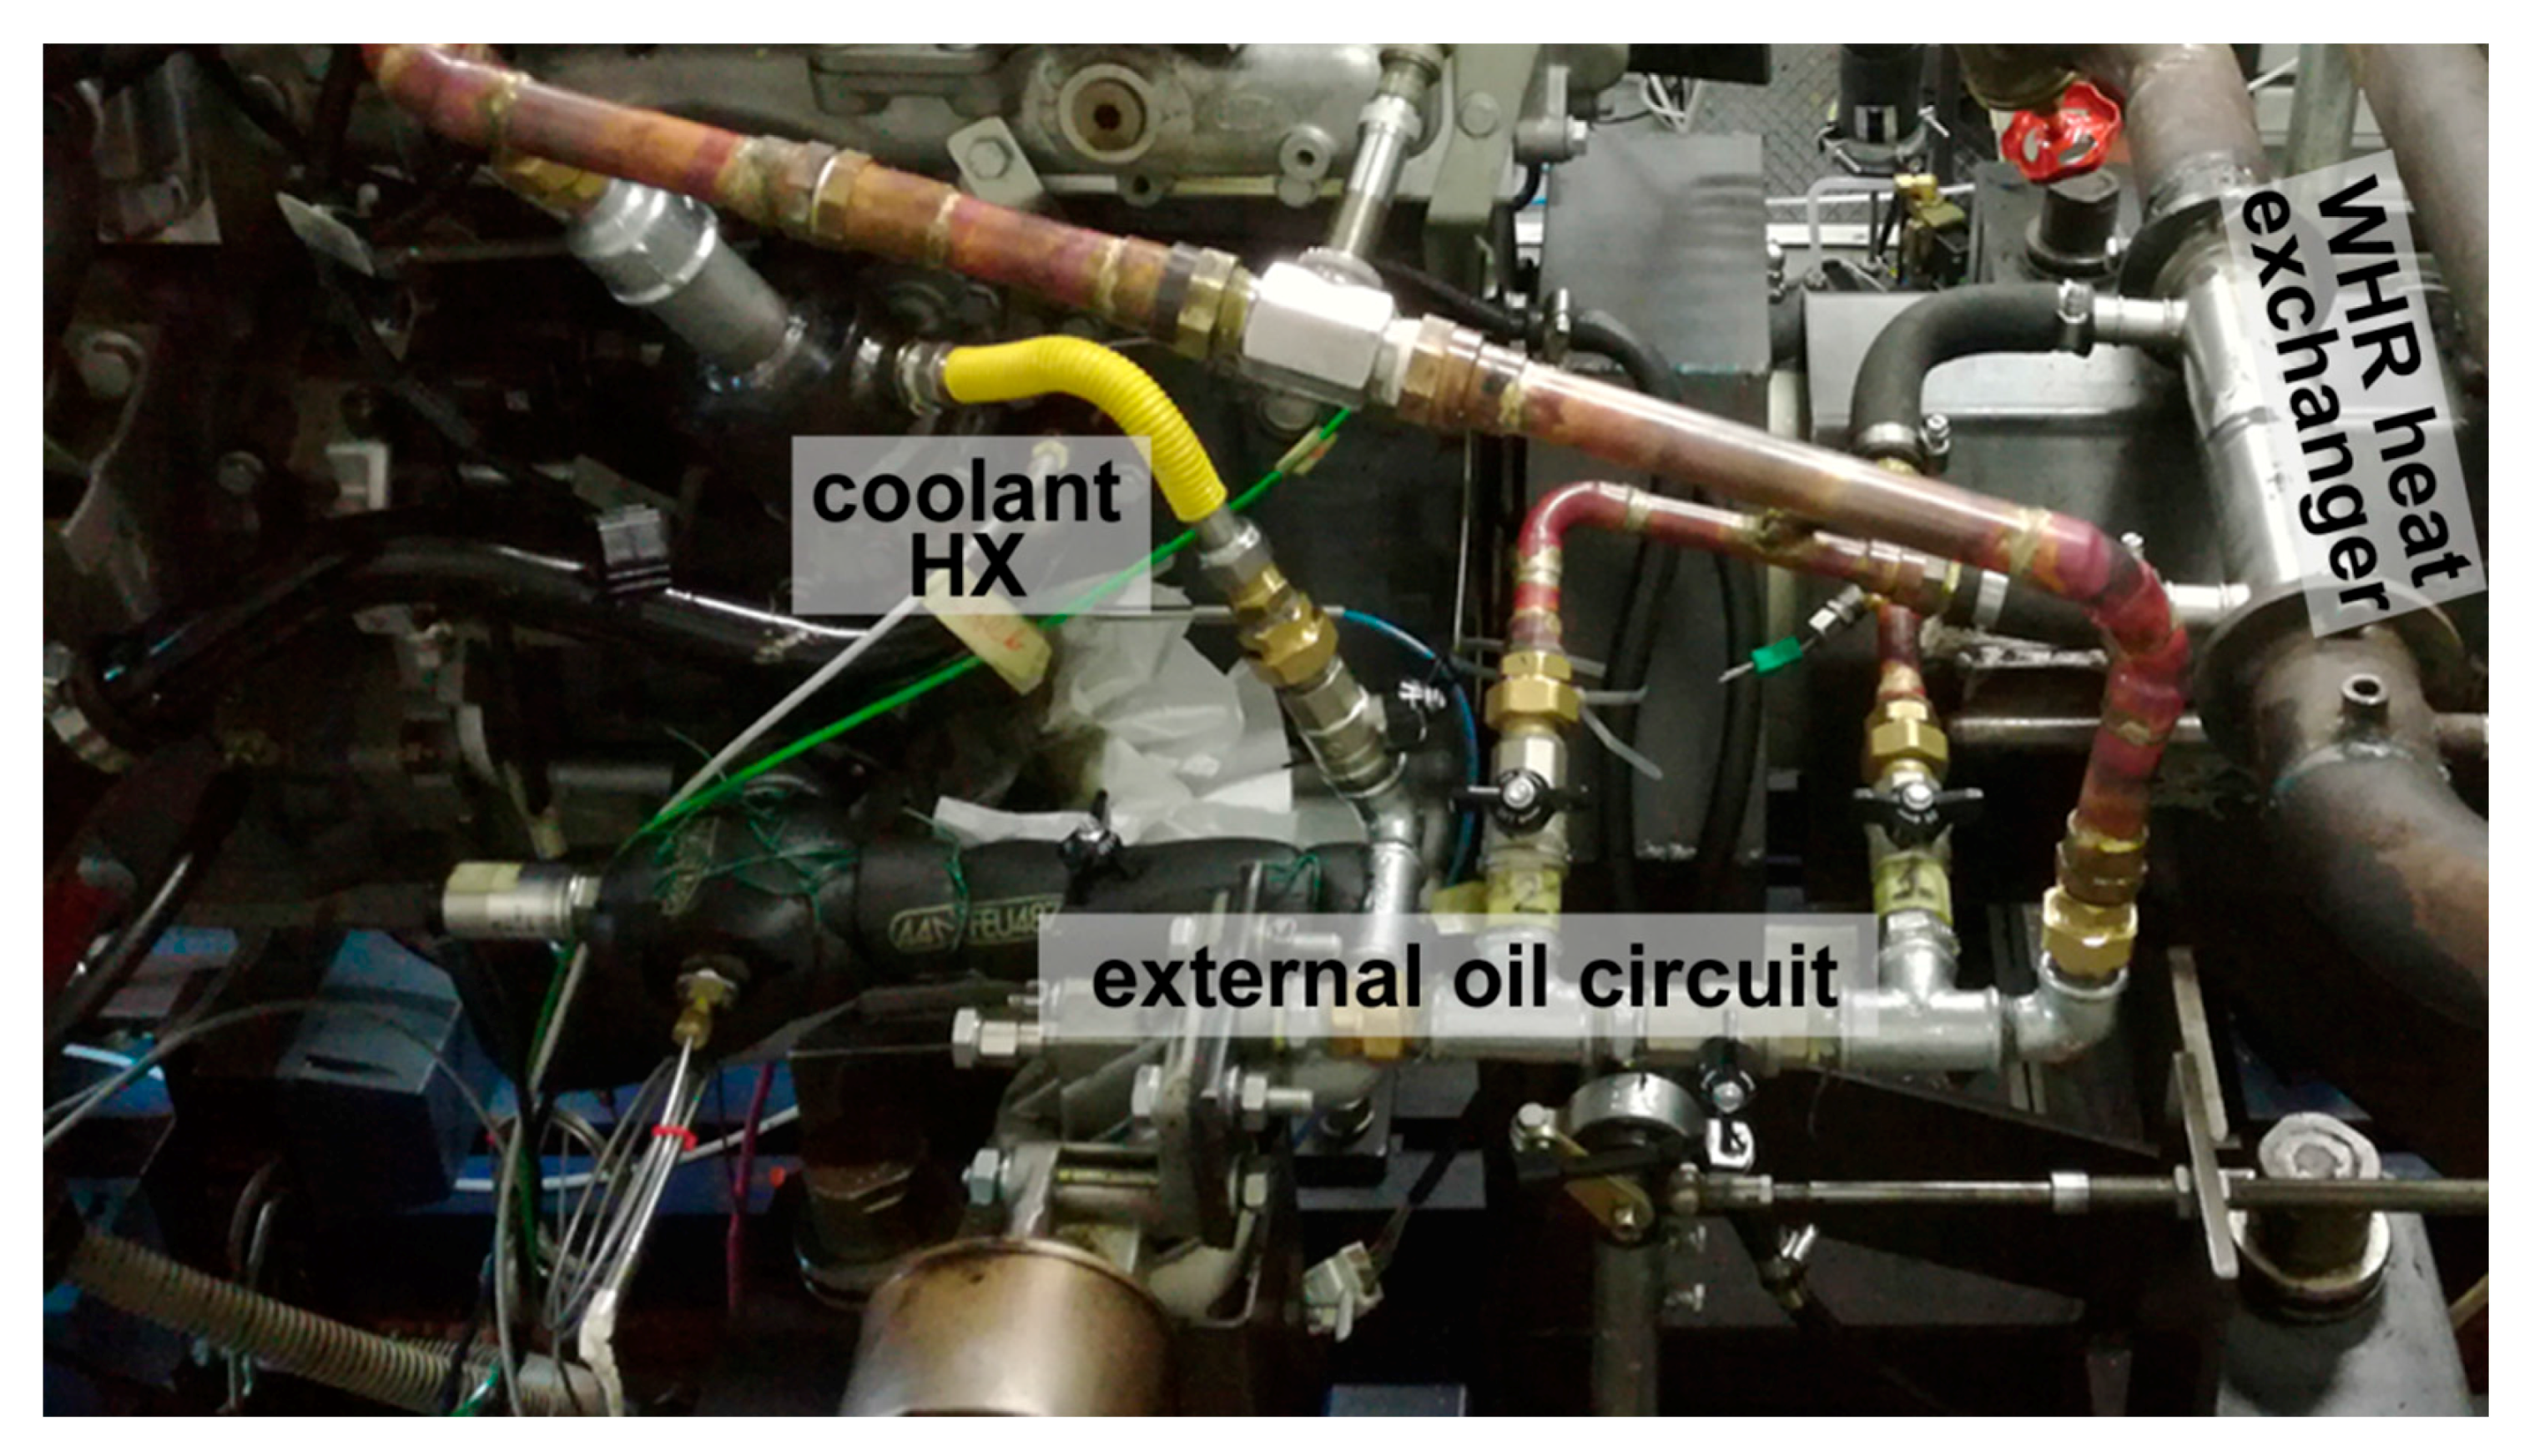
The experimental arrangement of the external engine oil circuit and the position of the heat exchanger on the exhaust gas are shown in
Figure 6, where, also, some measurement equipment is placed.
3. WHR-to-Oil Heat Exchanger Experiment
The WHR-to-oil heat exchanger has been placed in the exhaust line, as in
Figure 1, and the F1C engine has been run to reproduce the torque-speed working point of a NEDC homologation cycle. The WHR section is active only during the cold phase. In fact, until the temperature of the oil in the sump reaches a suitable hot temperature of 80 °C, the WHR-to-oil heat exchanger is crossed by the exhaust gases on tubes side and lubricant oil on the shell side. After the reaching of this suitable temperature, the WHR-to-oil heat exchanger has been bypassed in the exhaust line and, in the lubricant circuit, the coolant-to-oil heat exchanger branch is opened, excluding the WHR (
Figure 1). In this way, the lubricant oil can be thermal-regulated by the coolant and, on the exhaust side, backpressure effect is reduced and reported to the original configuration. The WHR-to-oil performance has been compared to the one without it (i.e., WHR heat exchanger bypassed in the both sides) and is considered as reference case.
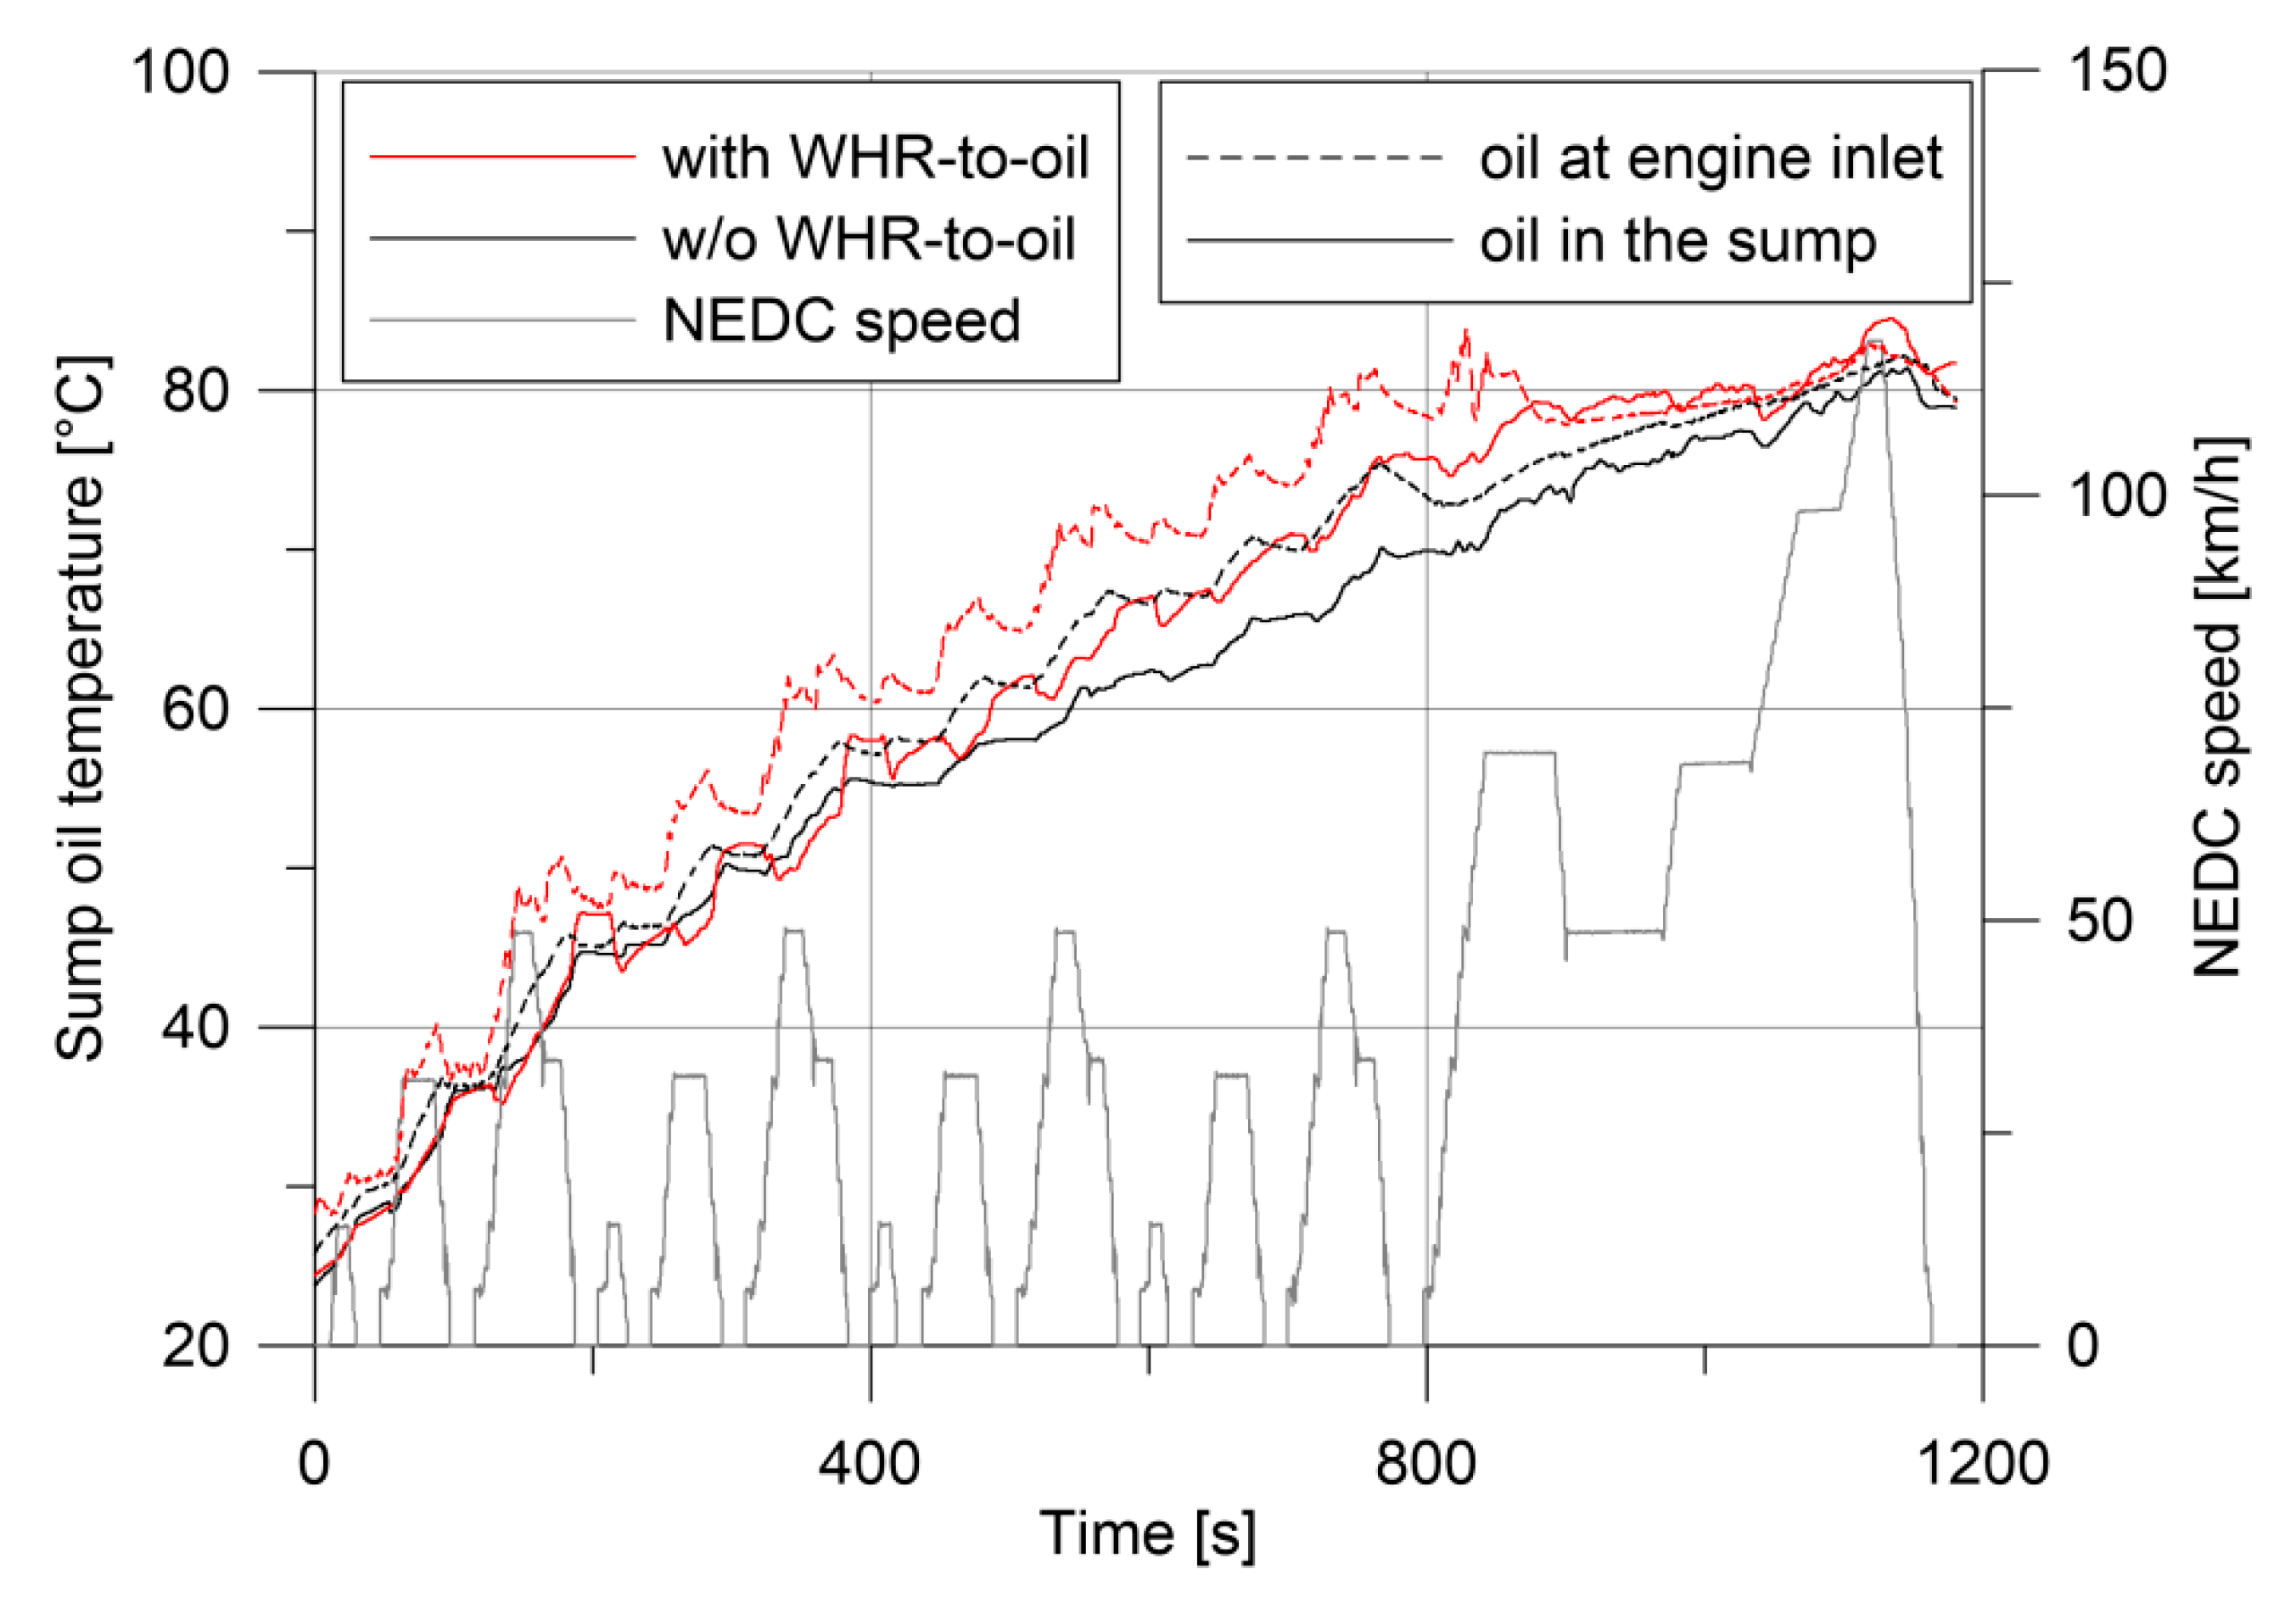
In
Figure 7, the temperature of the oil in the sump is registered in the two test cases performed (straight lines). In the reference case (without WHR-to-oil), the oil reaches 80 °C only in the very last part of the NEDC cycle. When WHR-to-oil is active, instead, temperature reaches values about 7–8 °C higher, and it is close to the suitable value of 80 °C after 1000 s. From this point on, WHR is deactivated (i.e., heat exchanger bypassed) and oil temperature in the sump remains about 5 °C higher than the reference case one.
Figure 7 shows also the temperature of the oil at the engine inlet (dashed lines), just after the WHR heat exchanger section. In this case, the temperature difference with respect to the reference case one is more evident (10–12 °C). It is also clear the instant in which the WHR is deactivated (about 900 s): in this point, in fact, the oil temperature falls down immediately, because the heating on the WHR-to-oil section is replaced by the cooling in the coolant-to-oil heat exchanger. From this point on, the coolant-to-oil heat exchanger acts to control the oil temperature.
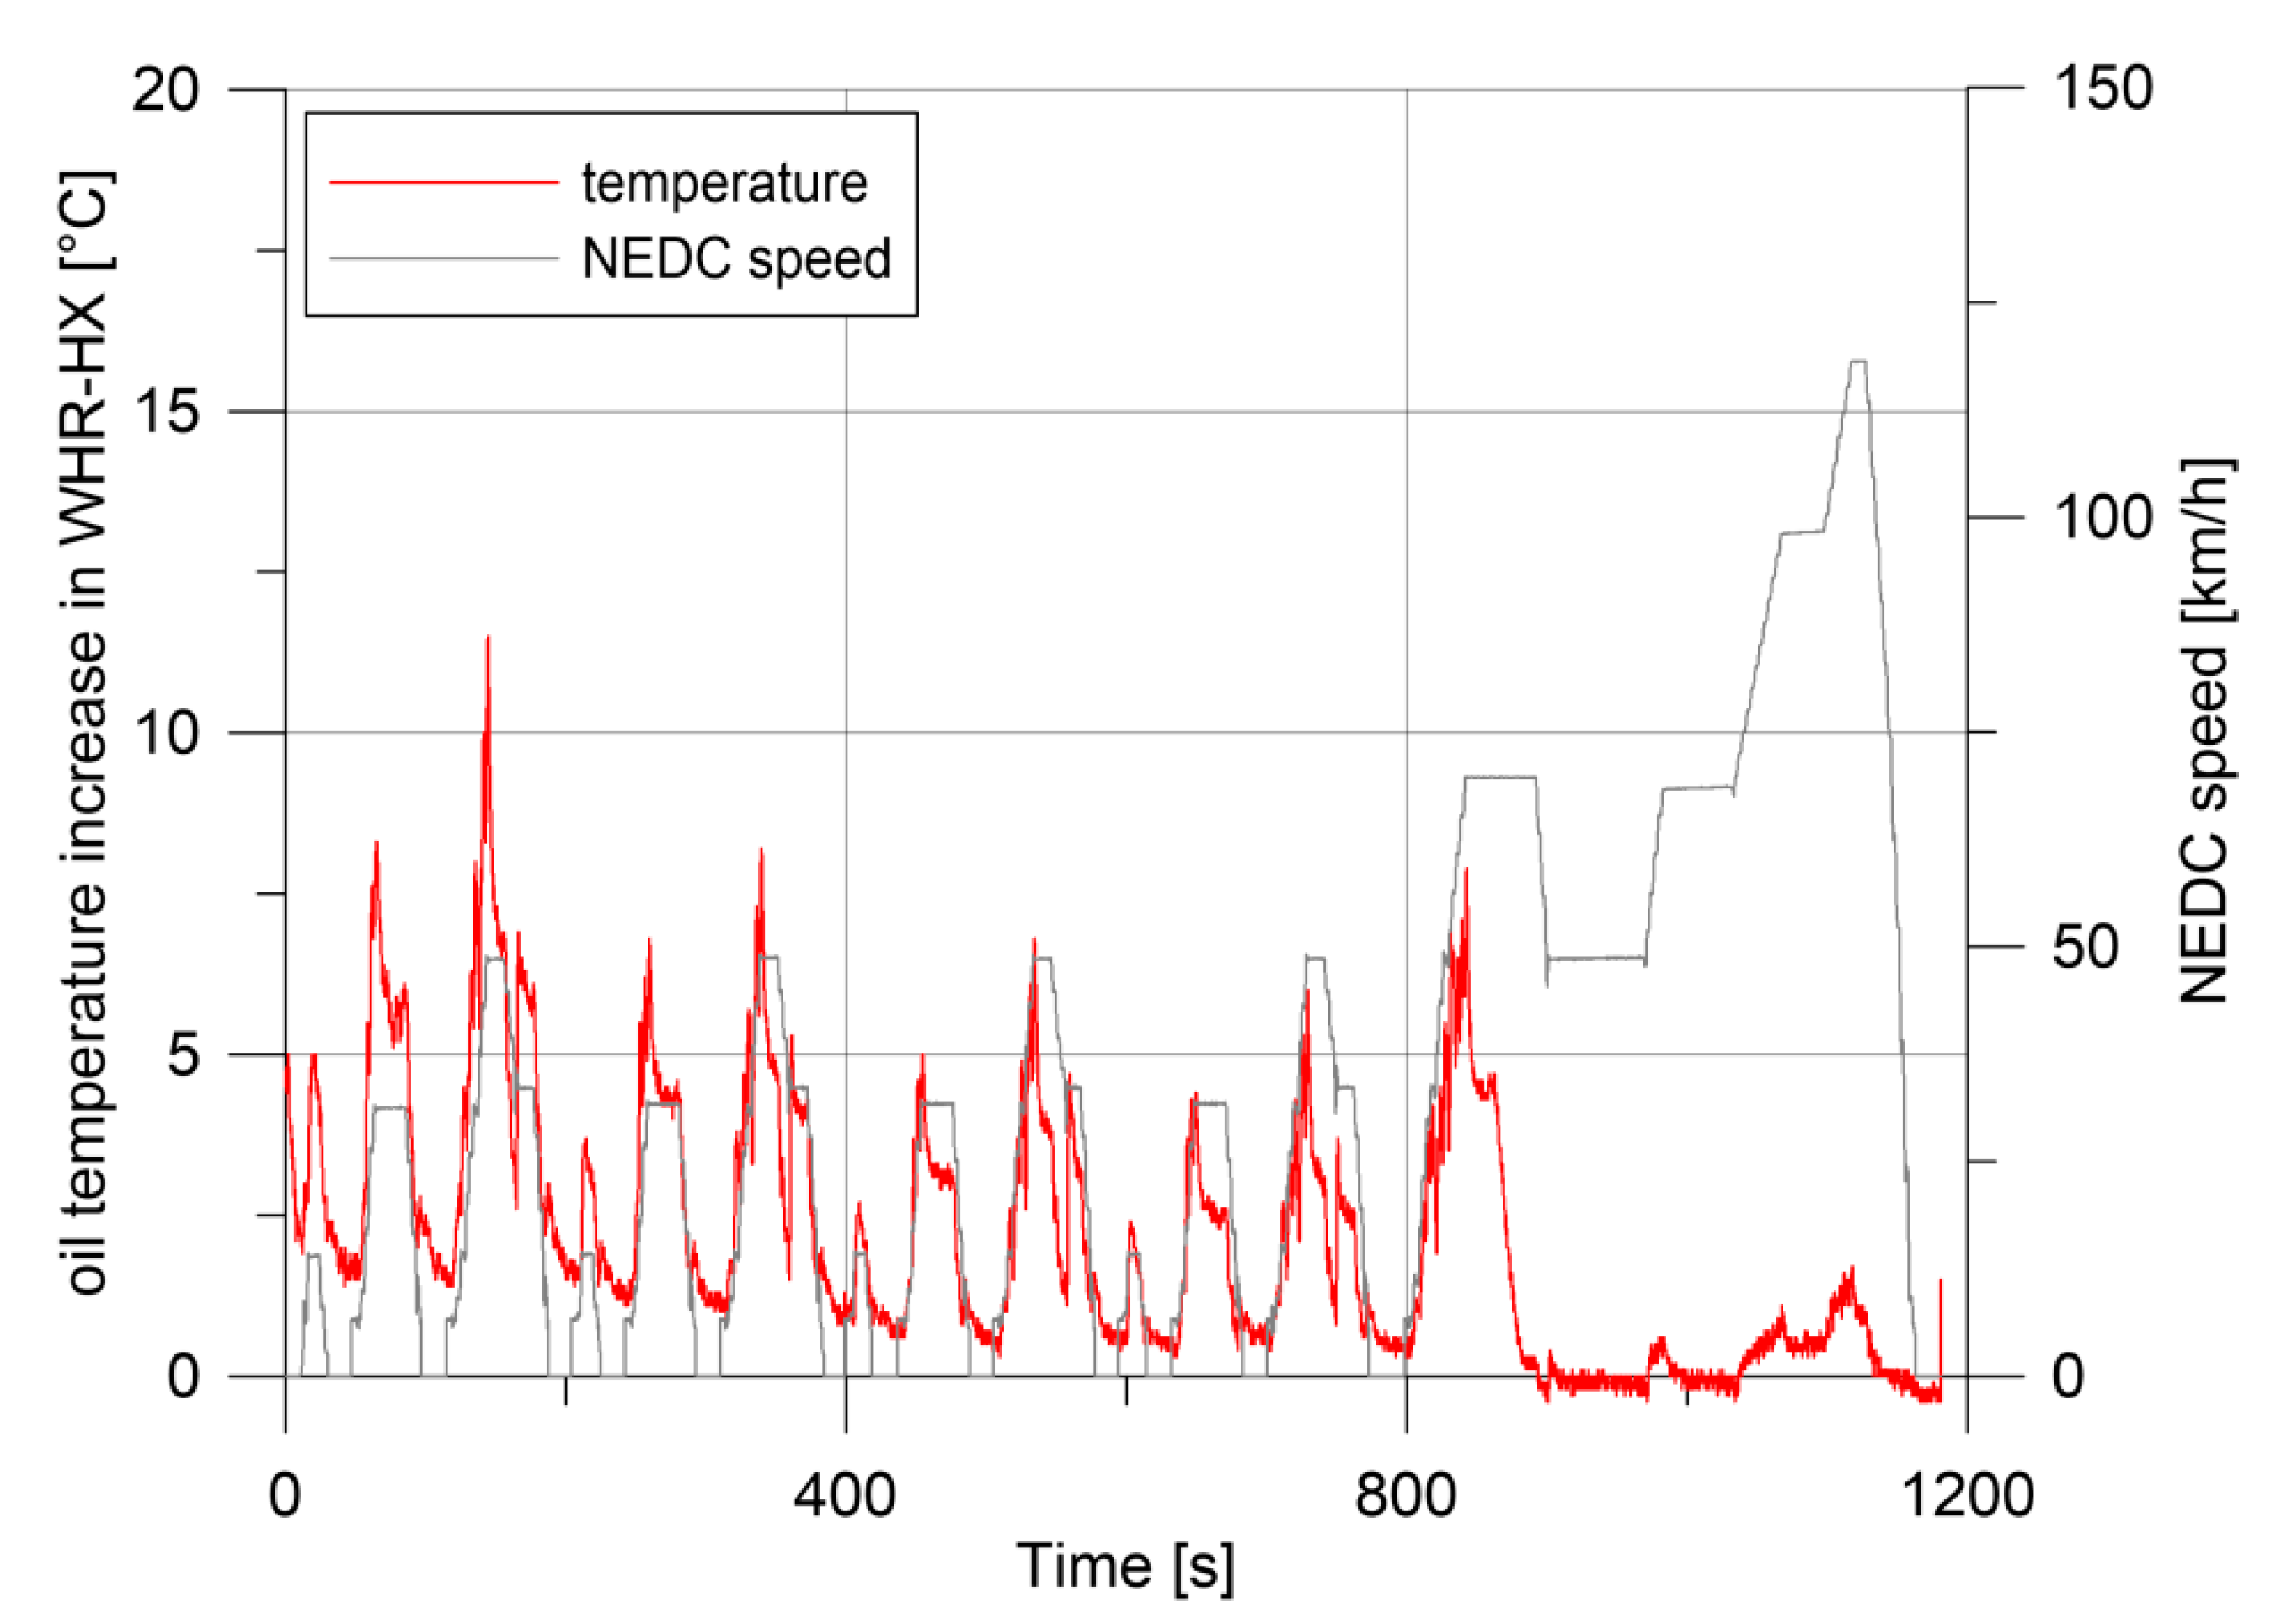
Figure 8 shows the oil temperature increase inside the WHR-to-oil heat exchanger: an average increase of about 2–5 °C is obtained in the first 900 s of the NEDC, with peak of 7–11 °C related to the acceleration phases of the four ECE cycles. This performance can be enhanced by reducing the quantity of the active oil, which passes inside the heat exchanger and then is remixed inside the oil sump during the warm up phase. This can be done by a sump repartition into two chambers: one operating during warming up and a second one which enters in operation when the oil is warmed, ensuring correct life and maintenance time [
30]. From 900 s onwards, the WHR heat exchanger is bypassed, and the temperature fluctuations are related only to the temperature of the residual oil on the ducts.
The thermal power recovered in WHR section is shown in
Figure 9. An average value of 3 kW is assured with peak power of 5 kW, as the heat exchanger has been sized.
Particular care must be taken in the operation of the oil pump and oil circuit: flow rates of the oil increase (with respect to engine OEM), and the pressure of the oil line increases too. On the contrary, density decreases, and this tends to reduce the pressure. The oil pump working points during the whole NEDC cycle are shown in
Figure 10: in all the cases, maximum pressure is 6 bar, which is still compatible with the operation of the lubricating of the engine. At this value, it corresponds to an oil flow rate of about 35 L/min. In the WHR-to-oil case, slightly lower pressures are realized, showing that the oil passage through the WHR heat exchanger has lower pressure drop than the one on the coolant-to-oil heat exchanger (plate type). In any case, the oil pressure at the engine inlet is guaranteed by the control of the relief valve.
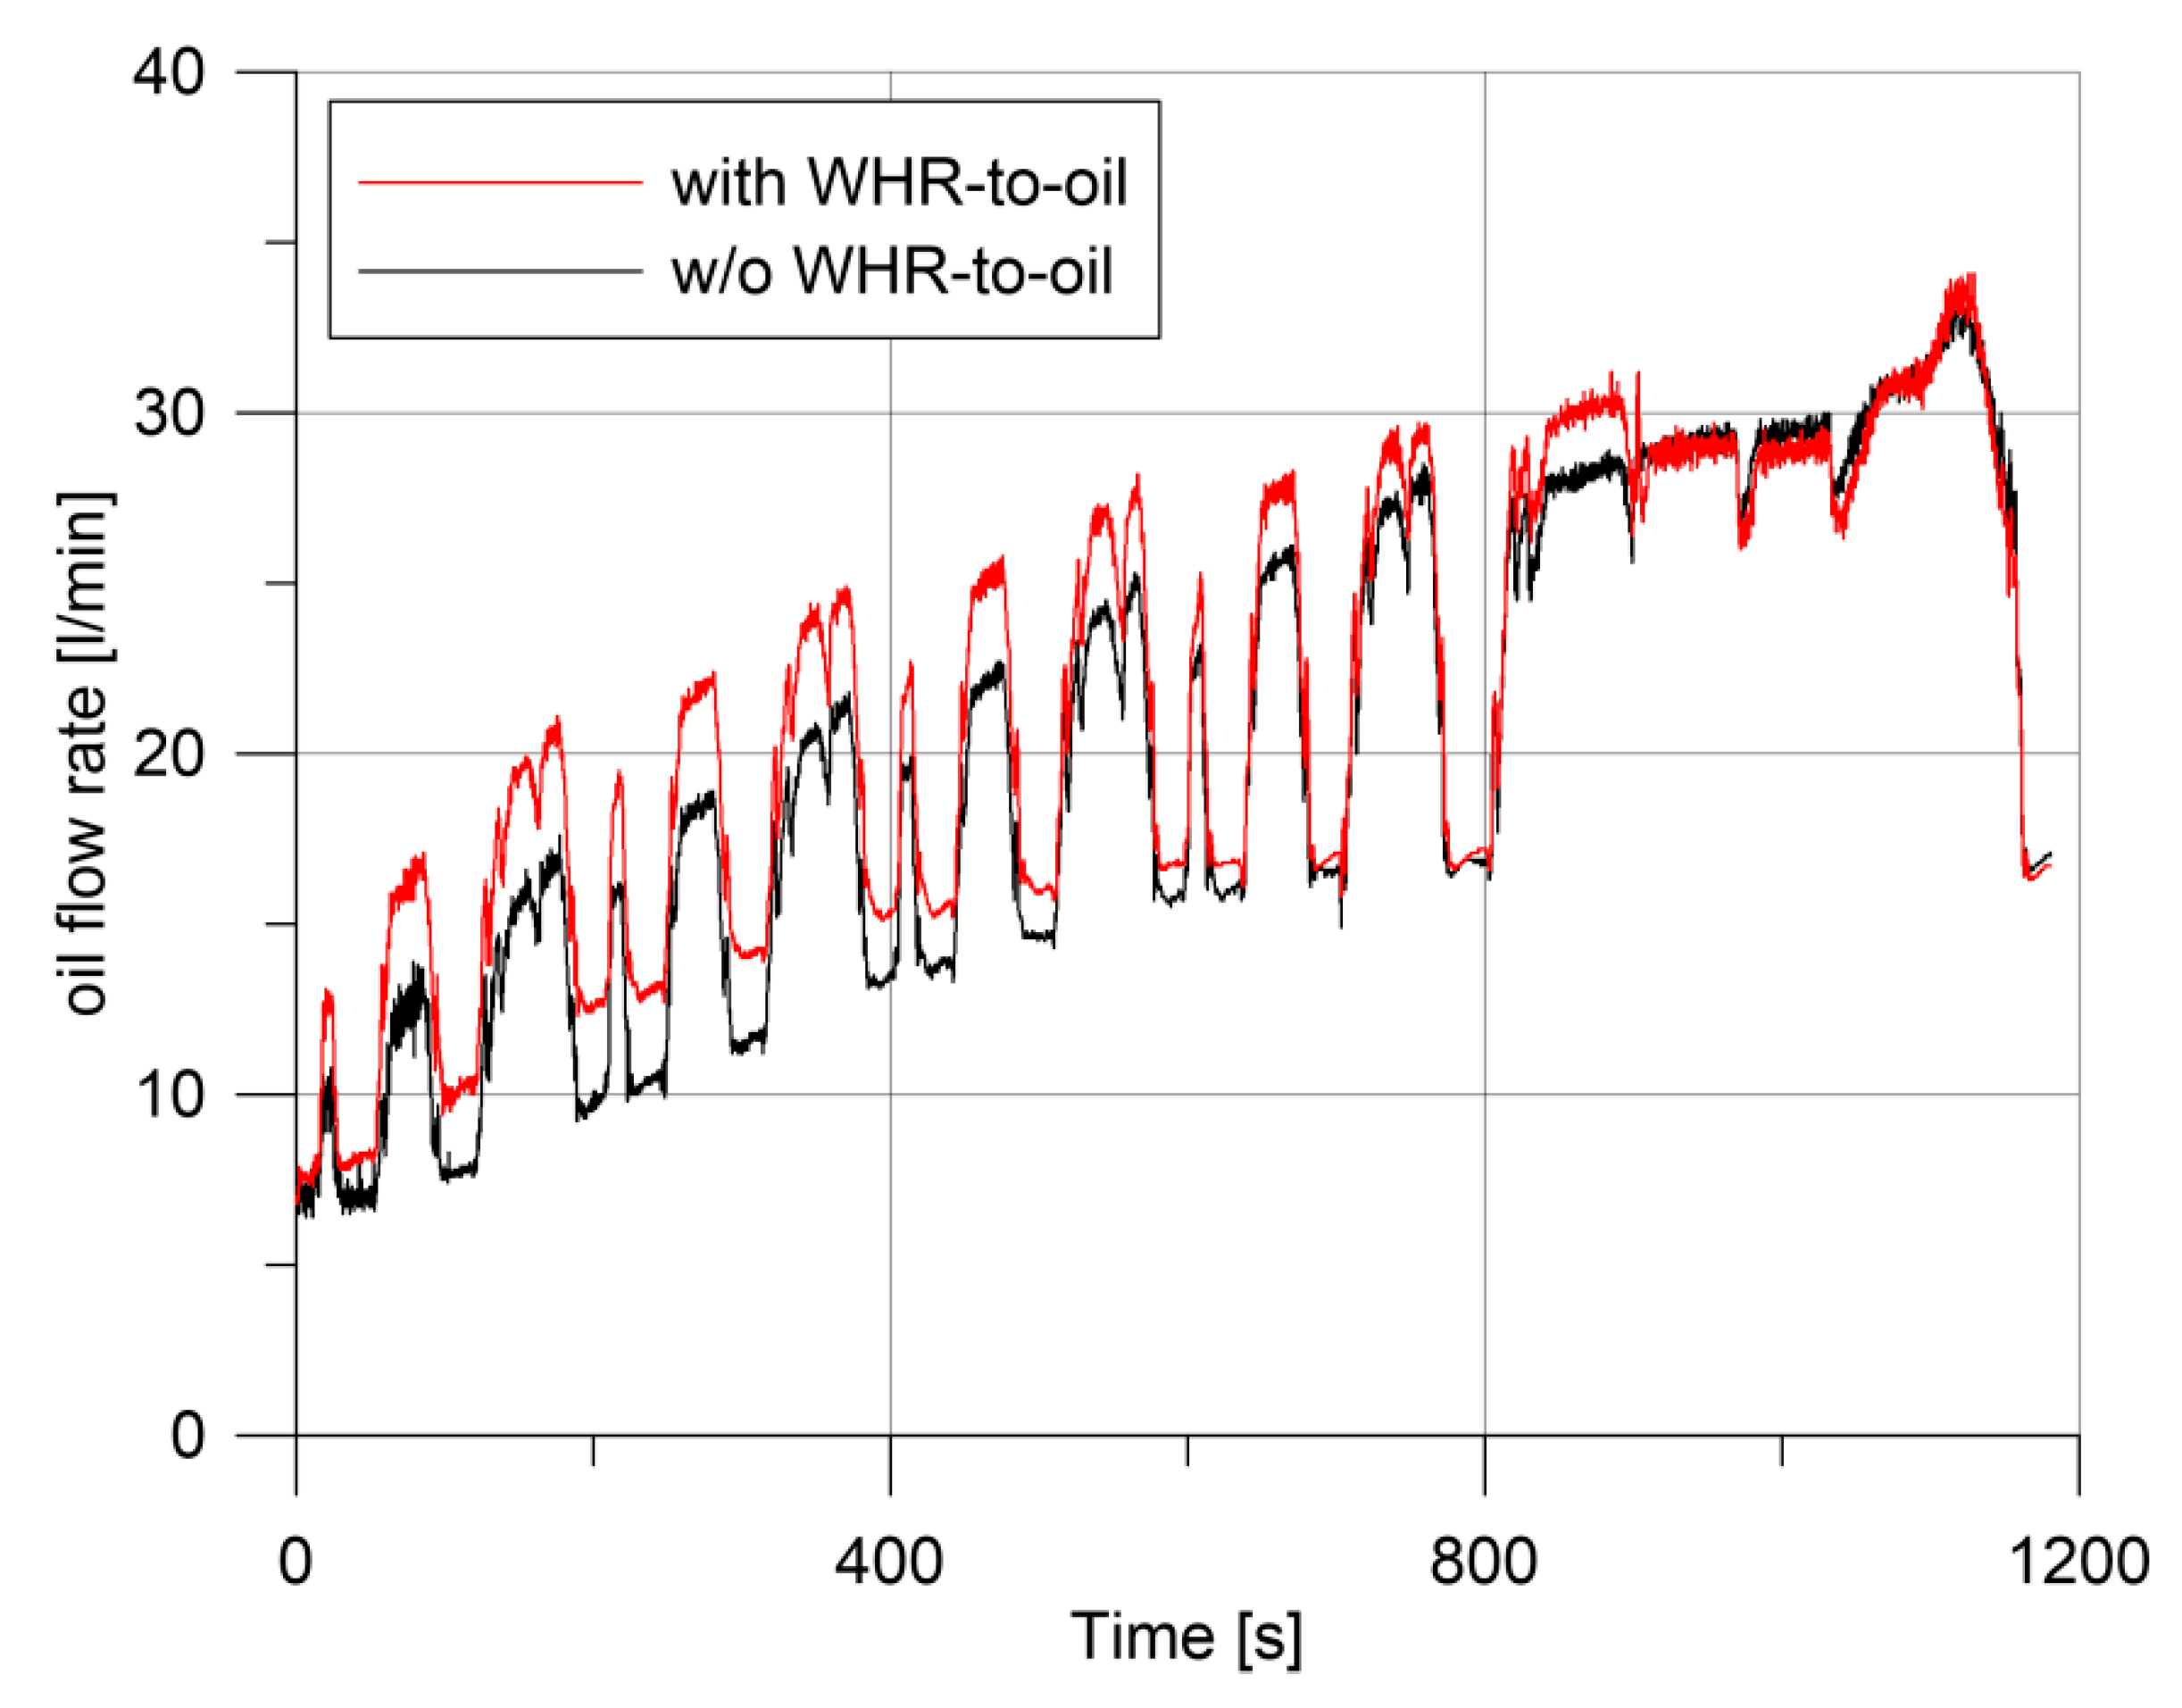
The lower pressure drop, on the lubricant circuit of the WHR-to-oil case, leads to a higher oil flow rate, being the pump of a volumetric type. In fact, in ideal case, the flow rate imposed by pump is linked only to its revolution speed, and it would be the same in the two test cases. In real operation, however, higher discharge pressure of the pump brings lower volumetric efficiency and, therefore, a slightly lower flow rate (
Figure 11). In
Figure 11, the instant in which the WHR is deactivated and the lubricant circuit is switched to the coolant-to-oil heat exchanger branch is evident also.
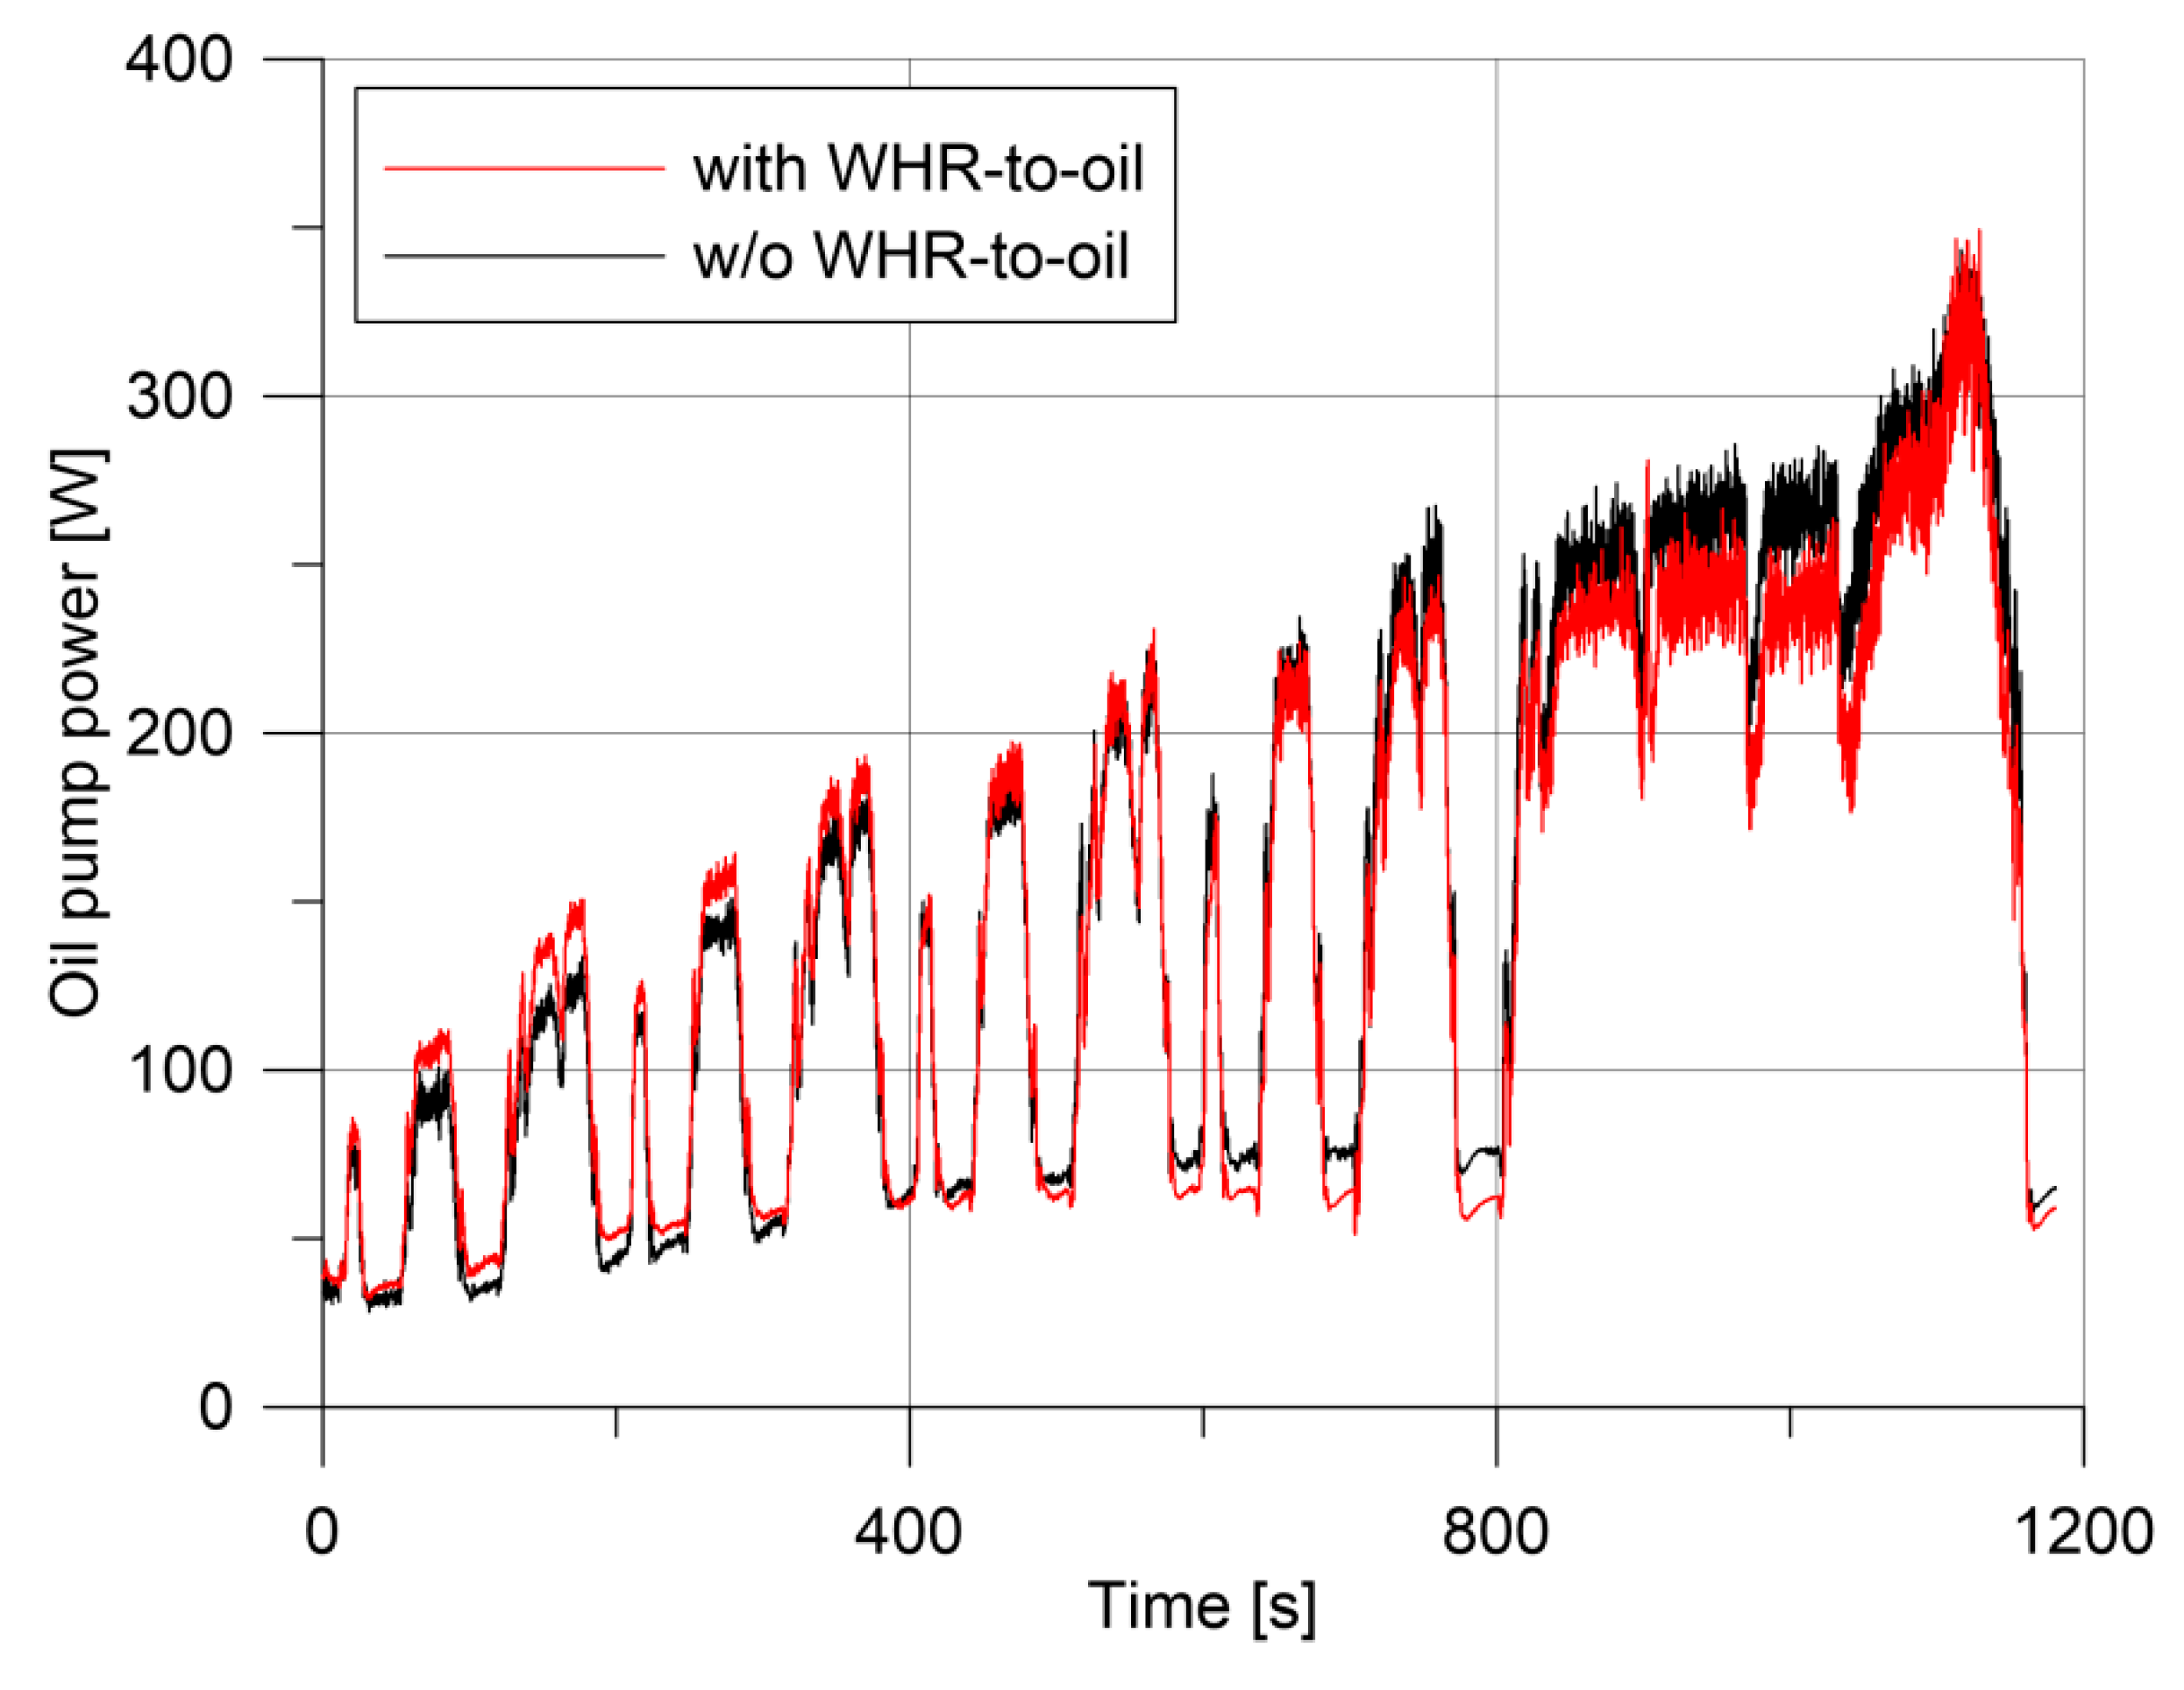
To summarize, in WHR-to-oil case, oil flow rate is higher and pressure drops are lower. The oil pump power requested, therefore, is quite the same in the two test cases performed, as it is shown in
Figure 12. A whole energy reduction of 5 kJ is calculated in favor of the WHR case, which represents 2.5% of the energy absorbed by the oil pump in the traditional configuration, but it is negligible if it is reported in terms of engine fuel saved.
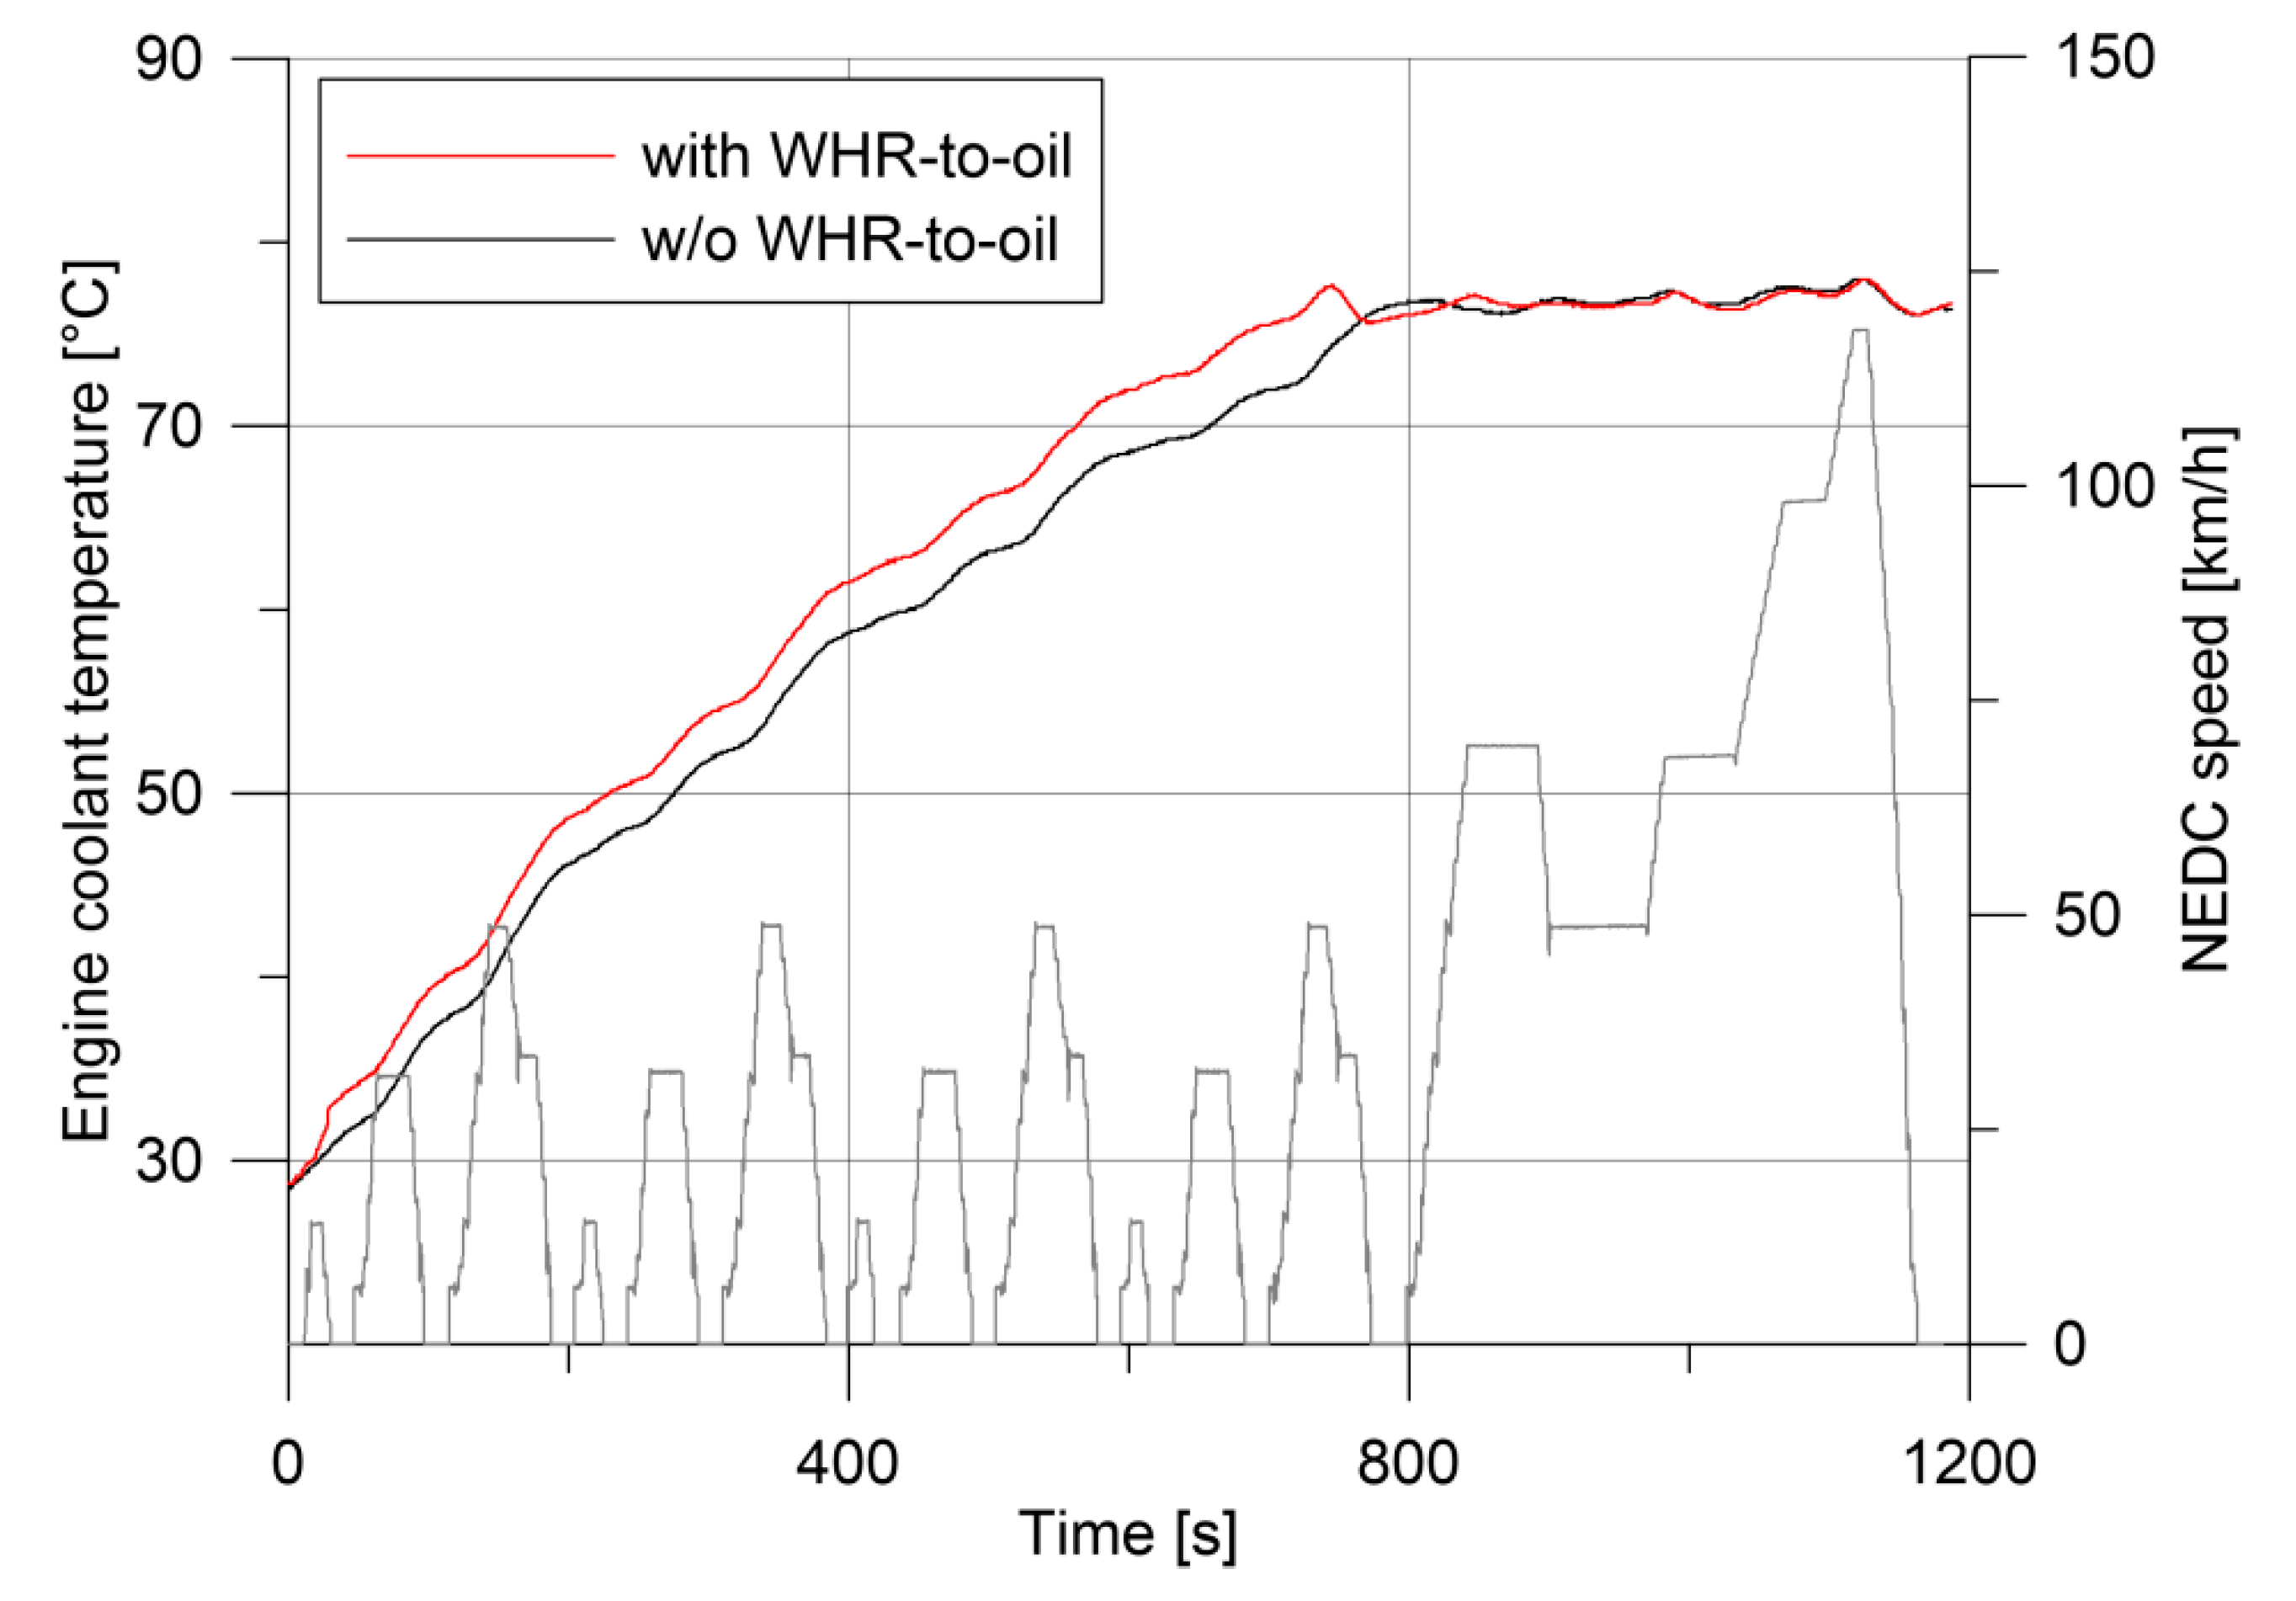
The first important result obtained by the WHR-to-oil technology is the engine warm up time reduction. In
Figure 13, the temperature of the coolant at the thermostat is shown, which is representative of the temperature of the engine. A slight reduction (about 60 s) of the time for which the thermostat is open has been demonstrated. In fact, a hotter oil, when it flows inside the engine path, heats up also the engine walls and components (camshafts, valves, tappets, turbocharger, etc.) and, definitively, this thermal energy is reversed to the engine coolant. The benefit is present, but it is low because of the reduced thermal energy reversed toward the cooling fluid.
4. Results and Discussion
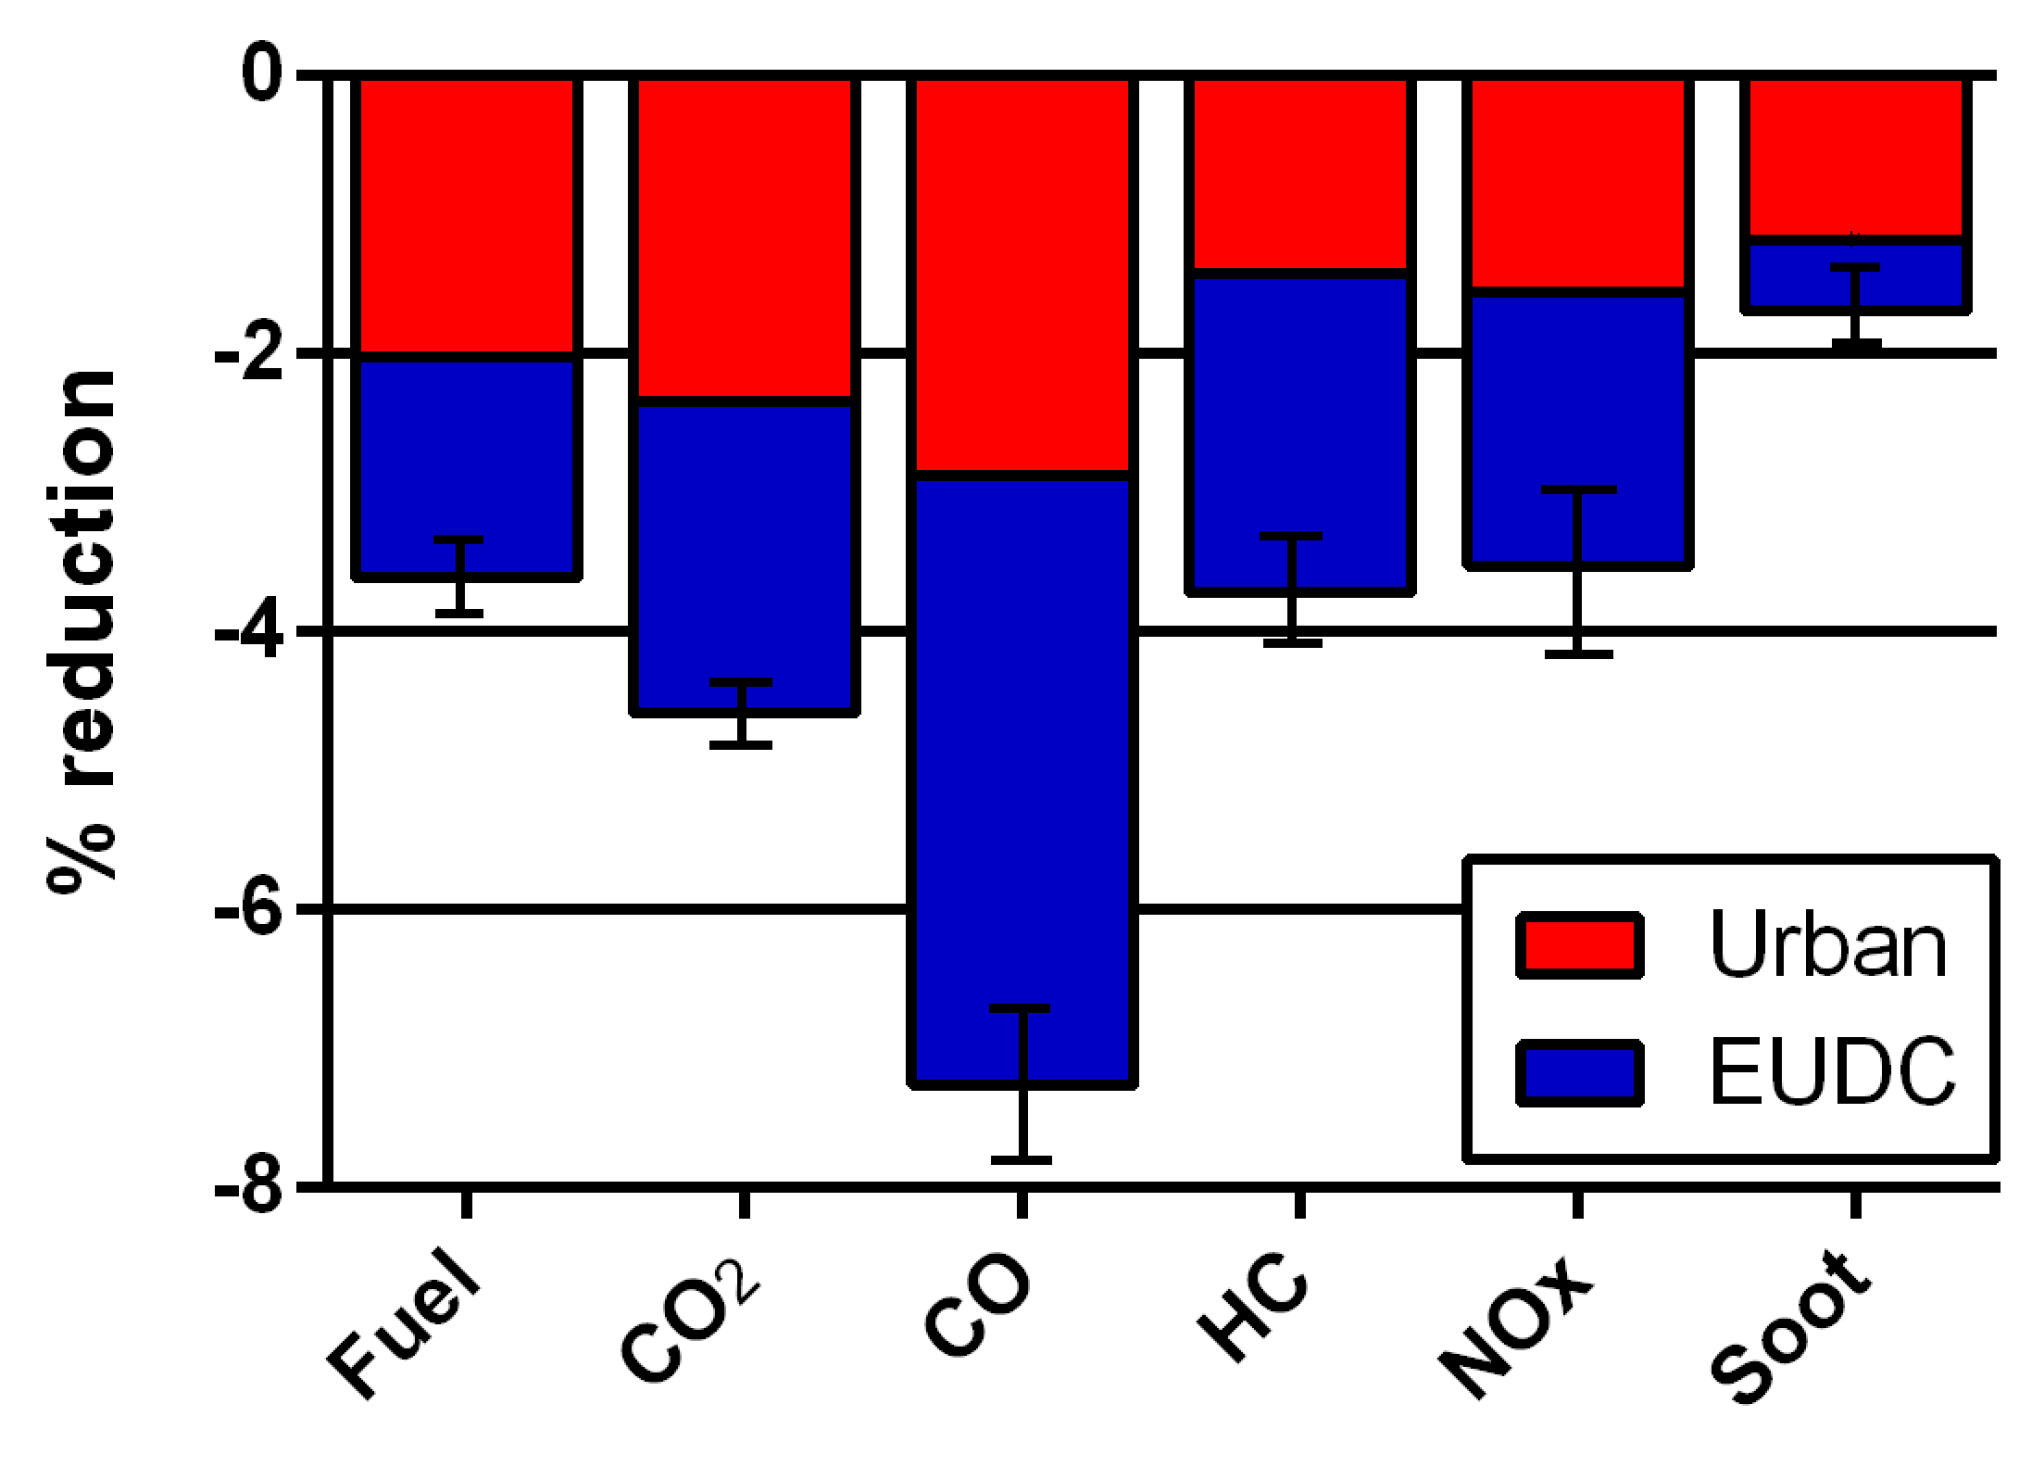
The hotter oil during the initial phase of the driving cycle brings benefits in terms of fuel consumption and pollutant emissions.
Table 3 shows a comparison between the two test cases performed, highlighting the great reductions achieved. Fuel consumption is reduced of about 3.6%, mostly due to the hotter oil, which reduces also the engine warmup time. This leads also to a CO
2 saving of 4.6%. All primary emissions have been reduced: hydrocarbon and NO
x reductions are close to 3.5 %, while particulate matter one is 1.7%. Great reduction is demonstrated in CO (−7.2%), because the highest part of its emissions is related to the cold phase of the driving cycle (
Figure 14). HC, CO, and Soot reductions are mainly due to the lower fuel burned during the drive cycle and, therefore, the higher air/fuel ratio, which leads to a better and more complete combustion (improving CO oxidation). This explains, also, the lower NO
x formation: higher excess of air, in fact, lowers the peak combustion temperature, reducing the formation of NO
x. The higher oil temperature, moreover, increases the temperature of the engine walls facing combustion gases (pistons, valves, and head in particular), reducing the quenching probability and better justifying the lower unburned hydrocarbons in the exhaust.
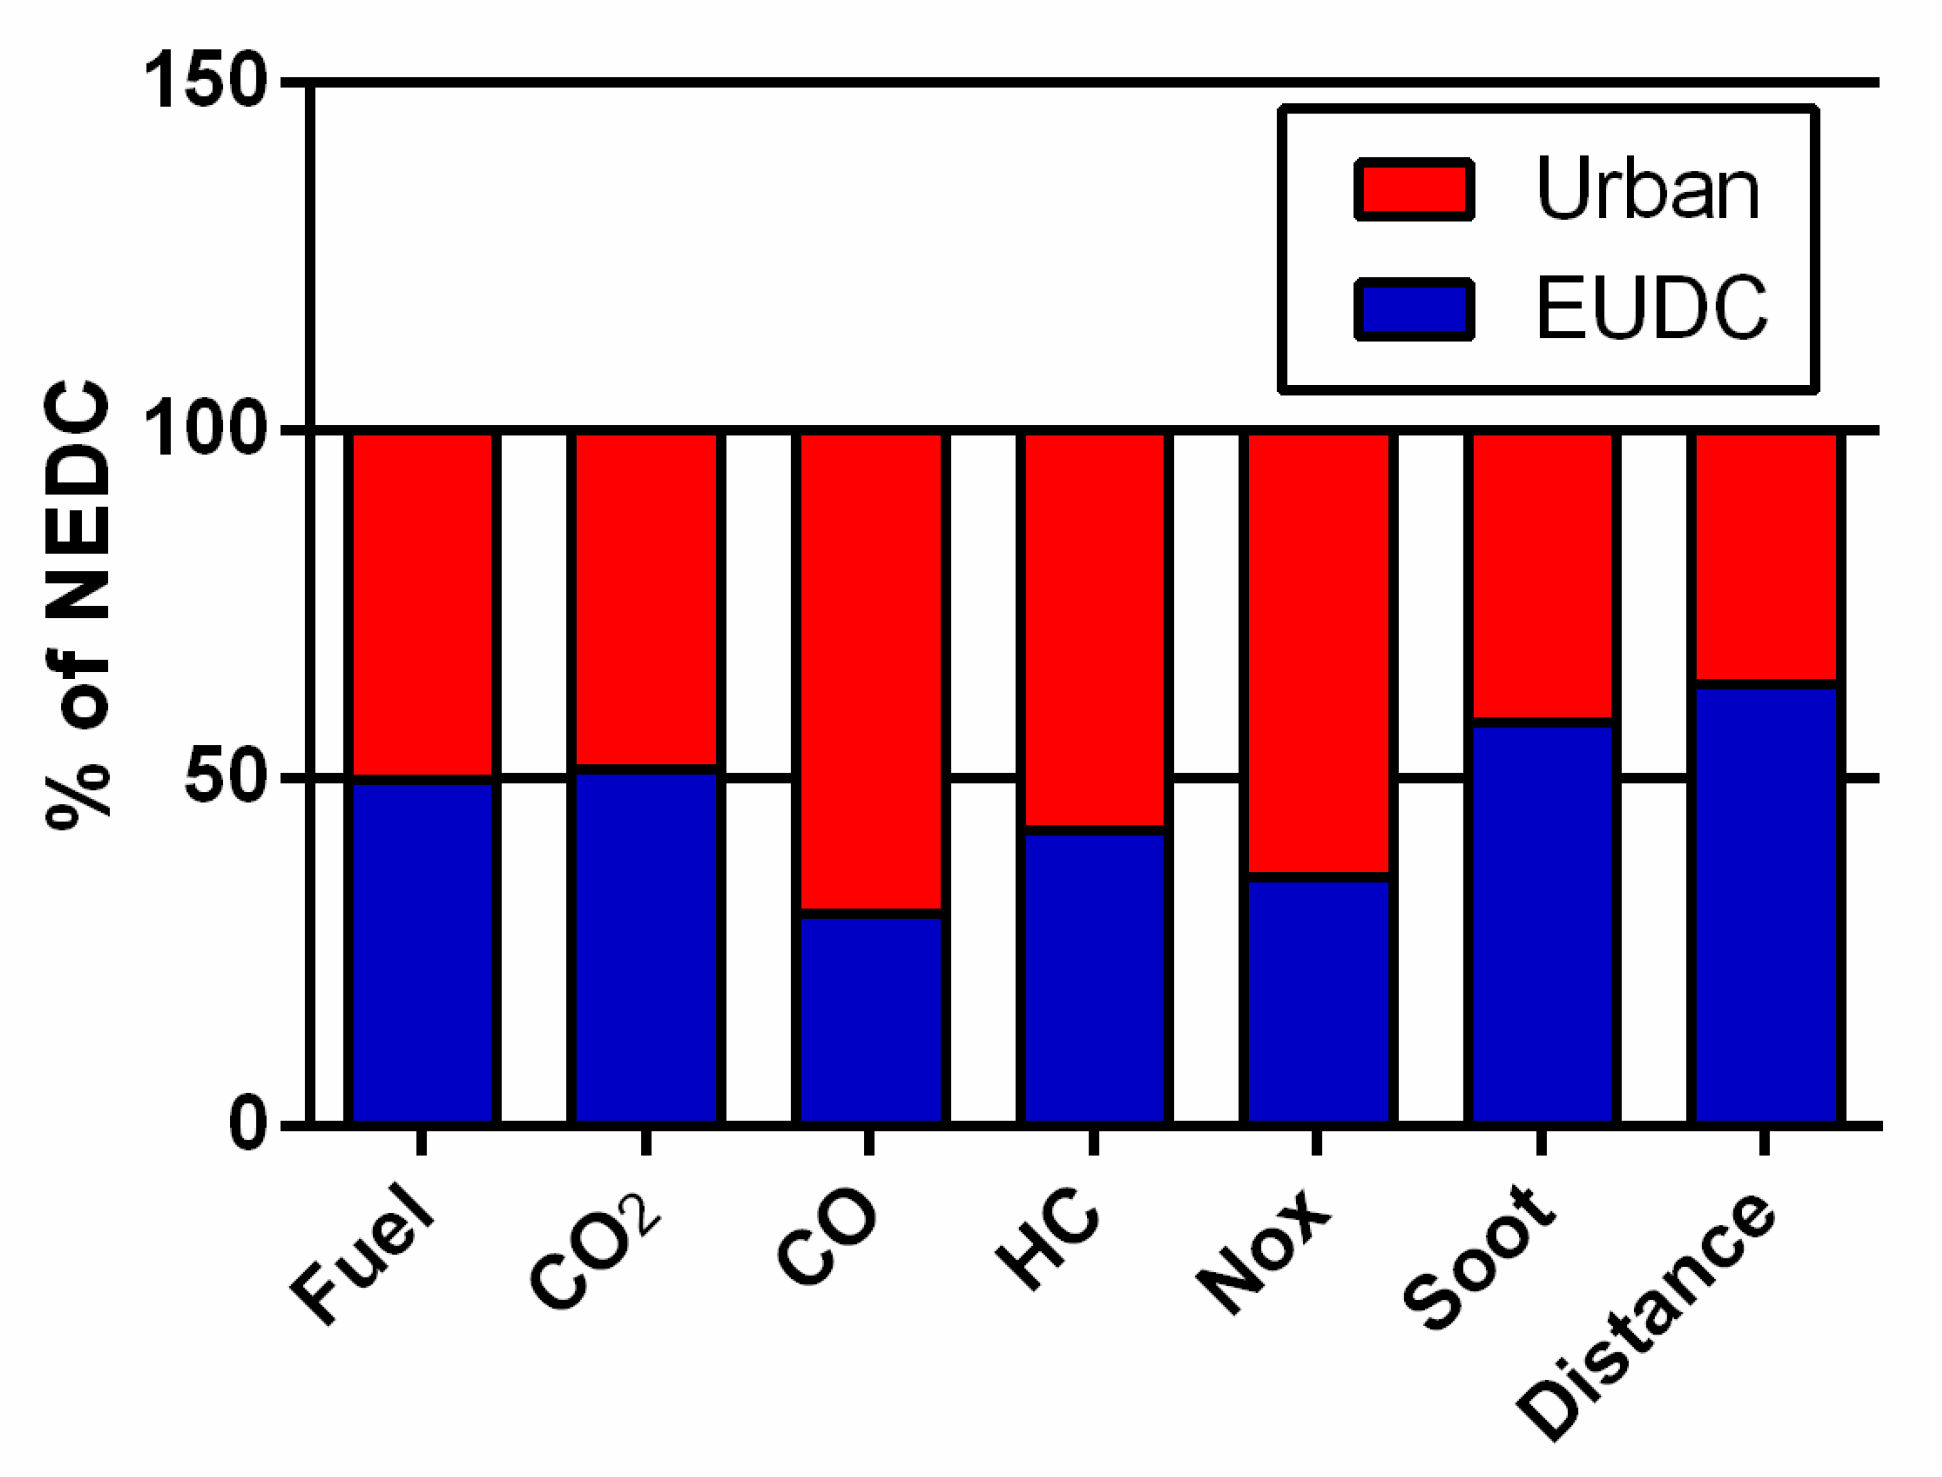
Figure 14 shows the repartition of the measured quantities split in the urban and extra-urban (EUDC) parts of the driving cycle. The urban part is composed of four ECE cycles, for a whole duration of about 800 s, with a length of 4 km. The EUDC part, on the other hand, lasts 380 s and about 7 km. Fuel consumption and carbon dioxide emissions are about half and half in the two parts of the NEDC, while NO
x, HC, and, in particular, CO are emitted principally in the urban part of the drive cycle (when the engine and lubricant are colder). Particulate matter (Soot), instead, is mainly produced in the extra-urban part of the cycle.
The influence of the WHR-to-oil section on the energetic and environmental performances of the two parts of the NEDC is shown in
Figure 15. In the WHR-to-oil case, the hotter oil produces the benefits of
Table 3 during the NEDC. For fuel consumption and CO
2 emissions, these benefits are realized principally in the urban part of the cycle, while for the other pollutants the major reduction is imputable to the EUDC part.
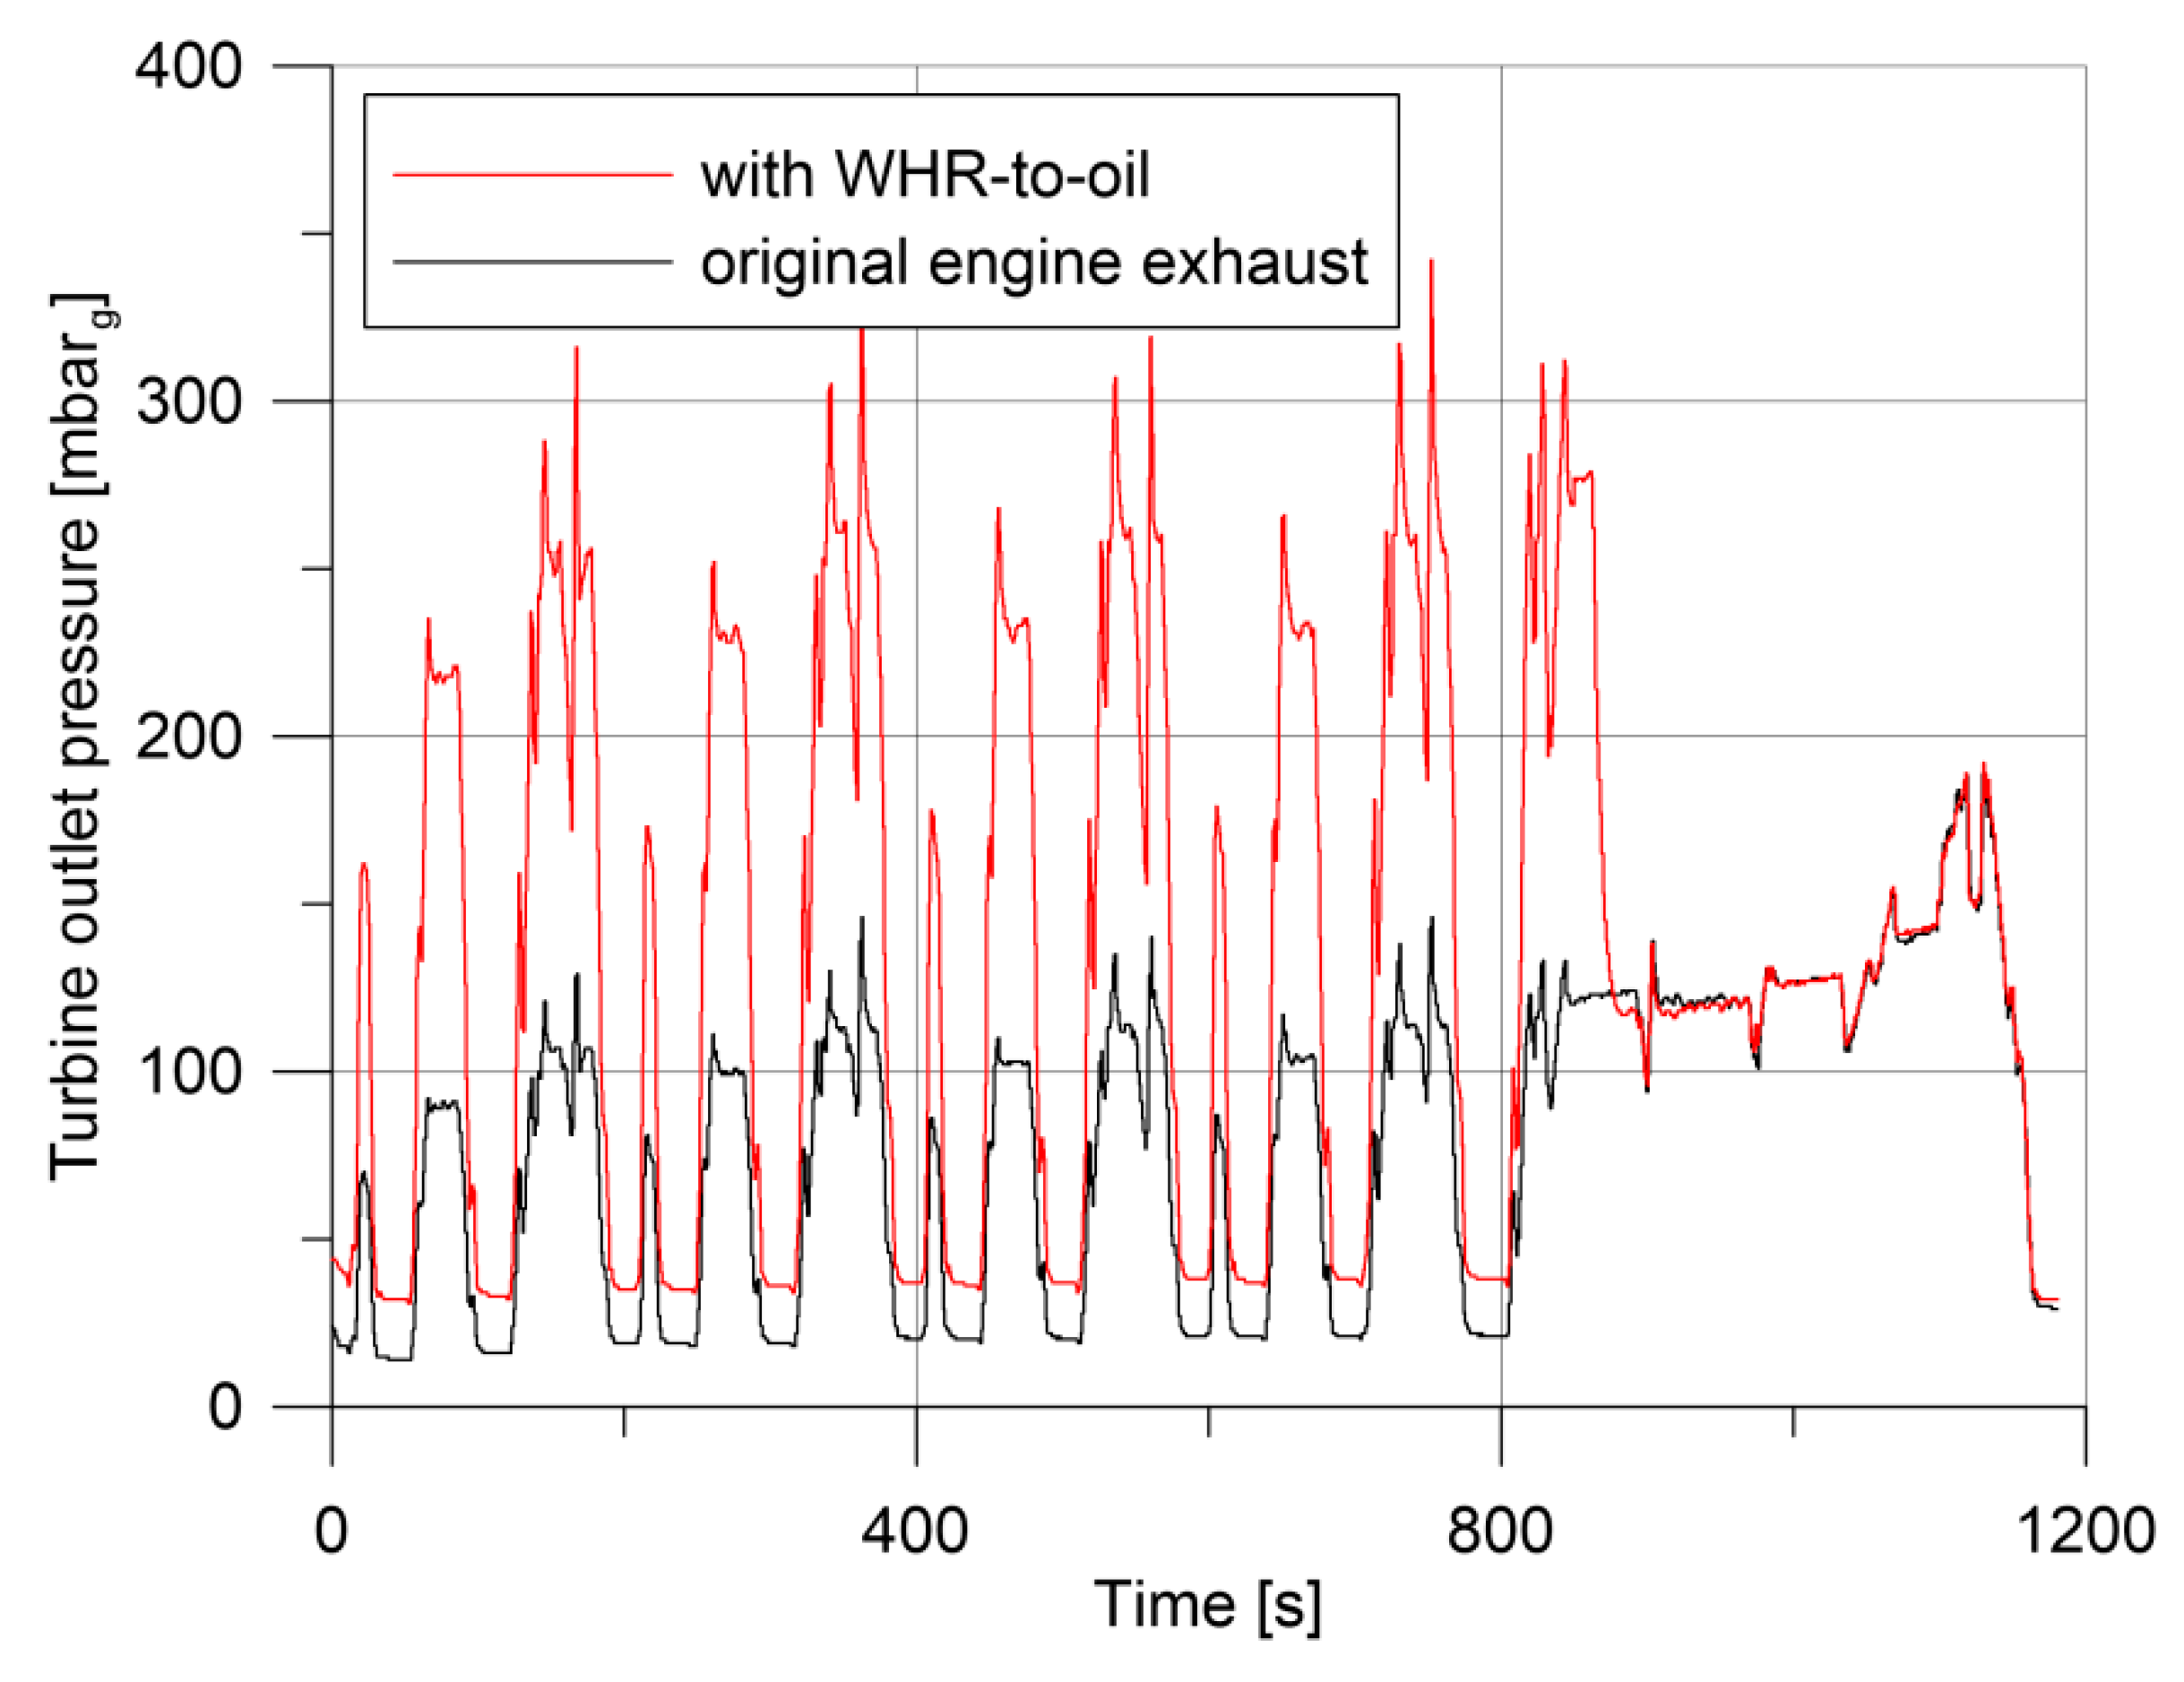
The greater constraint of the WHR section is the pressure drop increase realized in the exhaust line and, therefore, the backpressure effect on the engine itself. In
Figure 16, the gauge pressure at the turbine outlet is shown. The pressure increase due to the presence of the WHR heat exchanger presents peaks in the range of 100–200 mbar depending on gas flow rate, with an average value of 75 mbar. When WHR section is deactivated (bypass branch is opened at 900 s), the turbine backpressure comes back to the original value as
Figure 16 shows.
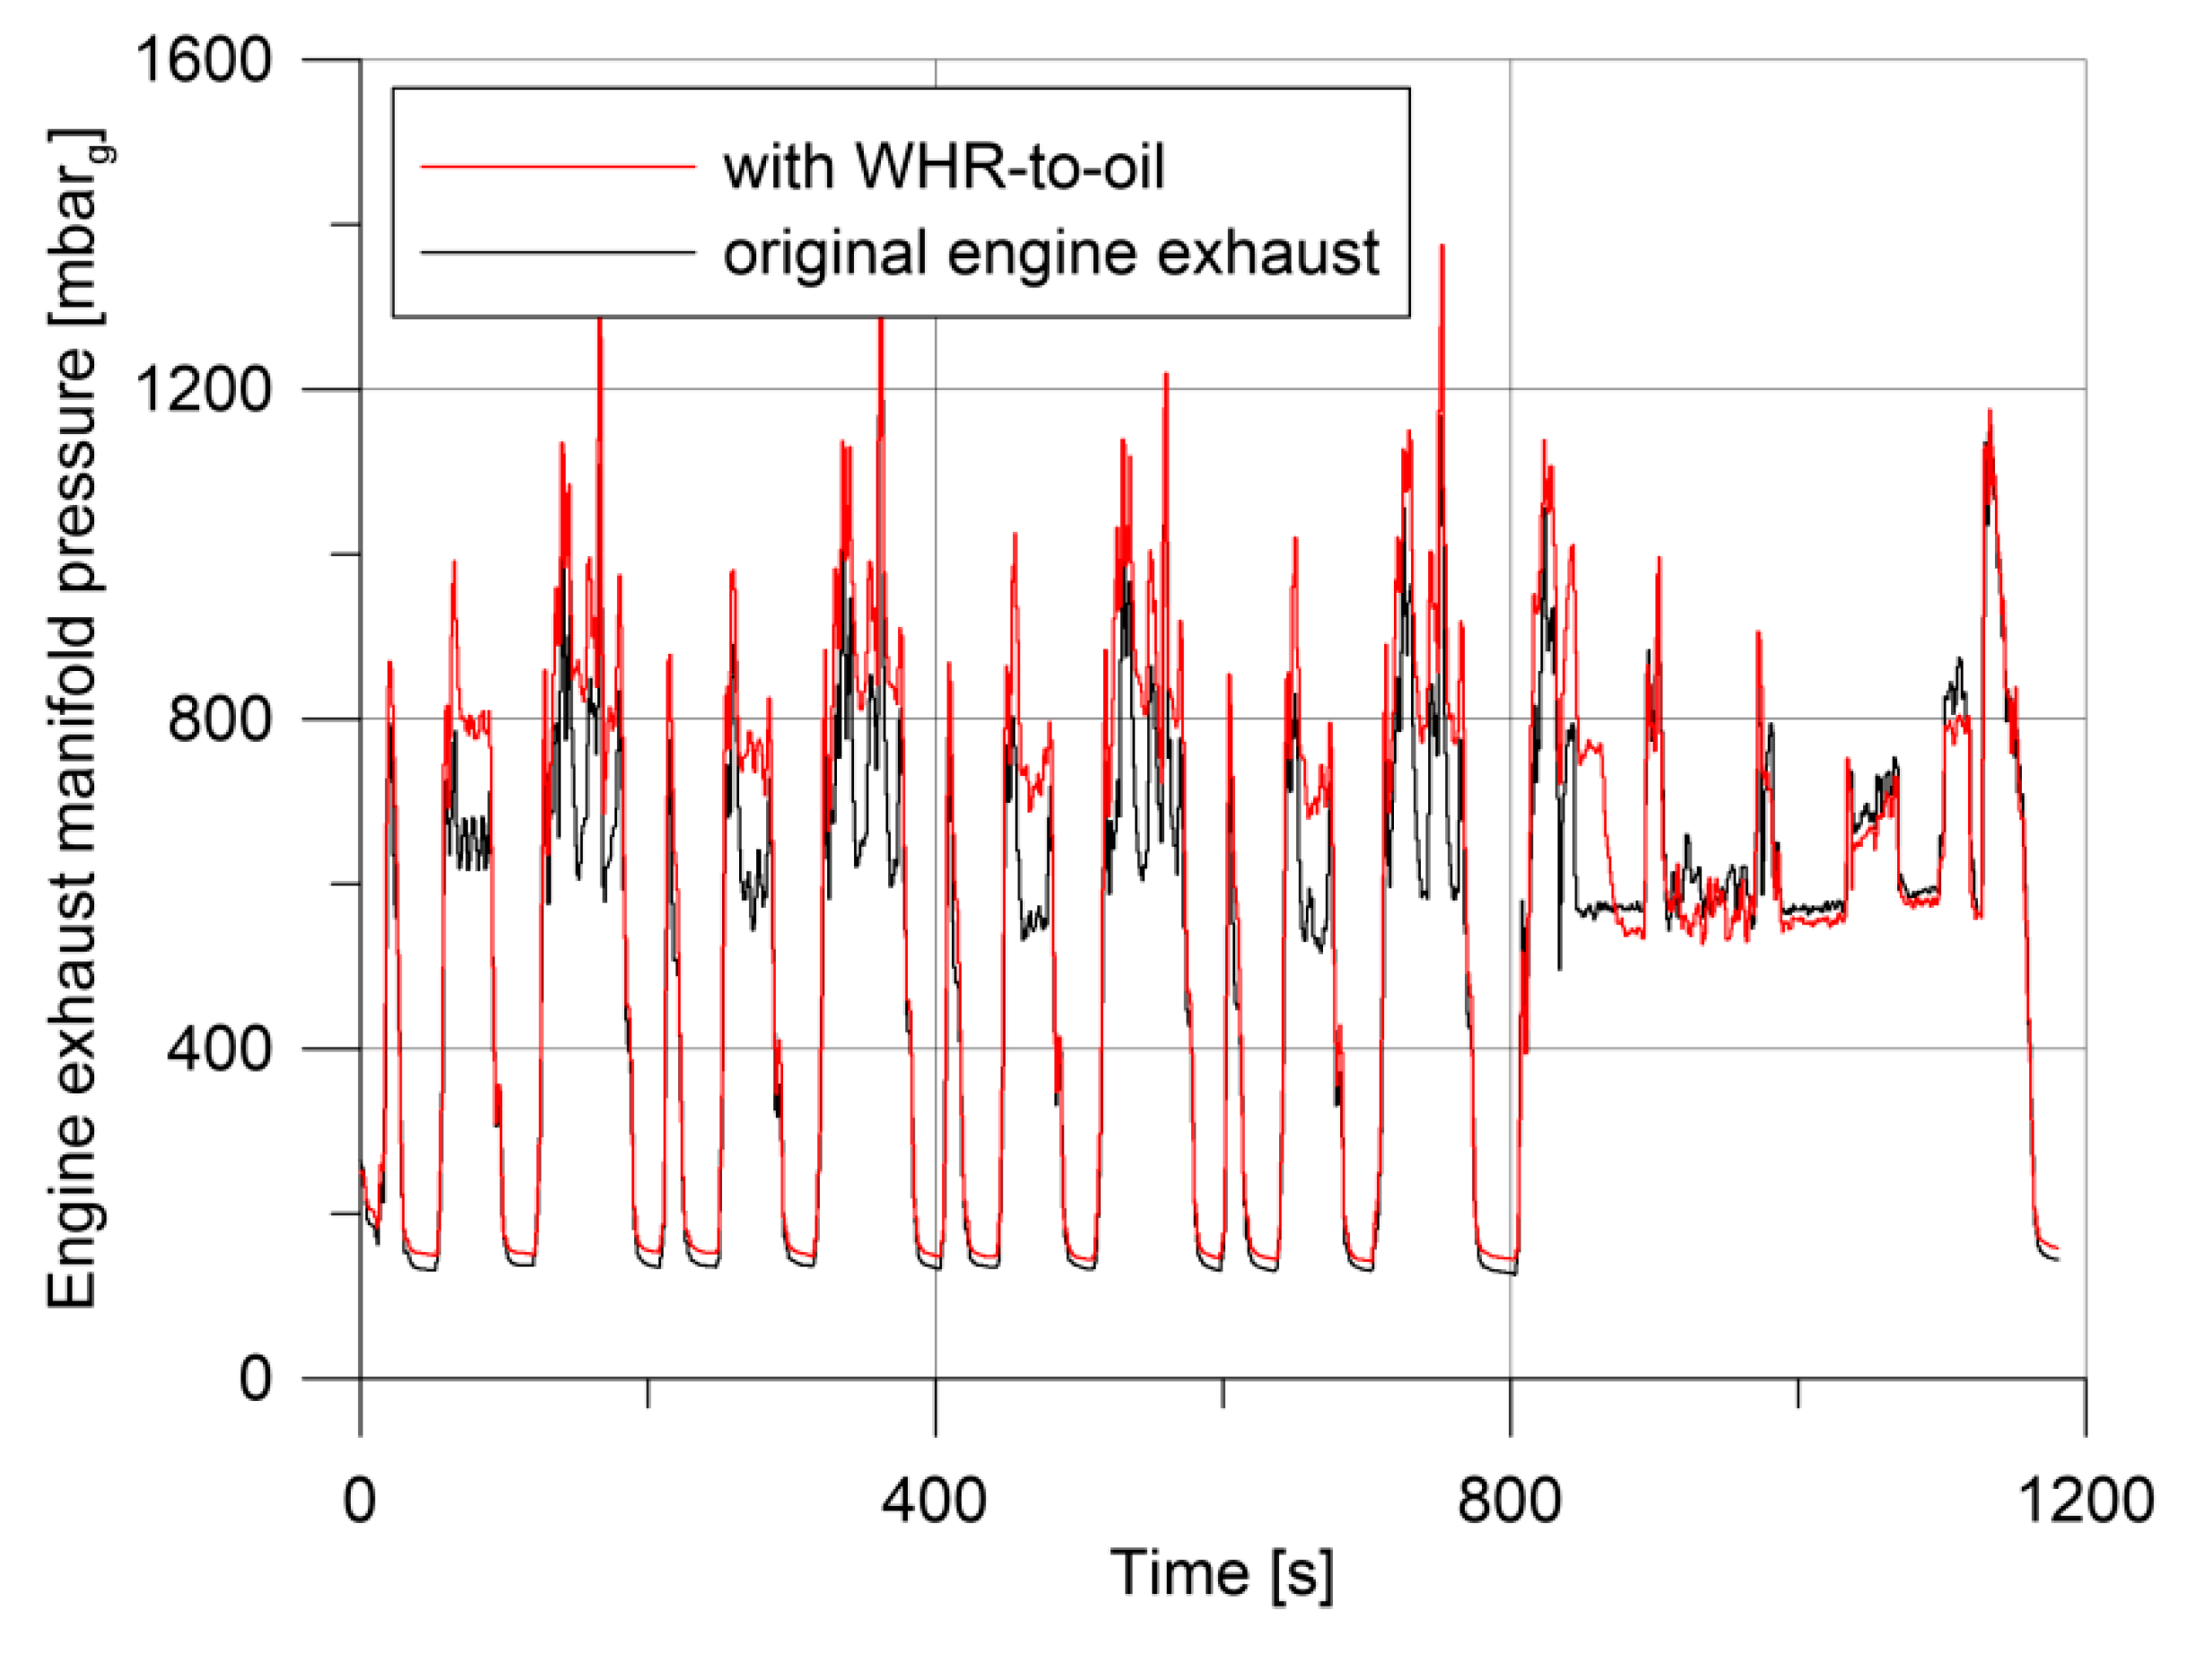
This backpressure increase is reflected also upstream of the turbine, where, during the NEDC points, the pressure increase peaks are close to 200 mbar (
Figure 17). This effect, however, seems to be mitigated if compared with the effect shown in
Figure 16. This is surely due to the regulating action of the variable geometry turbine, which acts to keep the desired charge air pressure (i.e., boost pressure).
In fact, as it is shown in
Figure 18, the revolution speed of the turbine is slightly increased in the early part of the NEDC (3000–5000 RPM higher), demonstrating how the higher pressures and the action of the variable geometry turbine lead to an increase in the speed of the turbocharger in order to have the desired boost pressure. In summary, the higher turbine backpressure would decrease the turbocharger speed and, therefore, the charge air pressure, but the regulating action of the variable geometry (realized with a guided vane at the turbine inlet) restores the desired boost pressure by increasing the gas velocity and, definitely, the turbocharger speed. The variable geometry regulation of the turbine, moreover, gives the degree of freedom to easily manage the pressure increase at the turbine outlet and to mitigate the backpressure effect on the engine [
40], without affecting turbine reliability and lifetime.
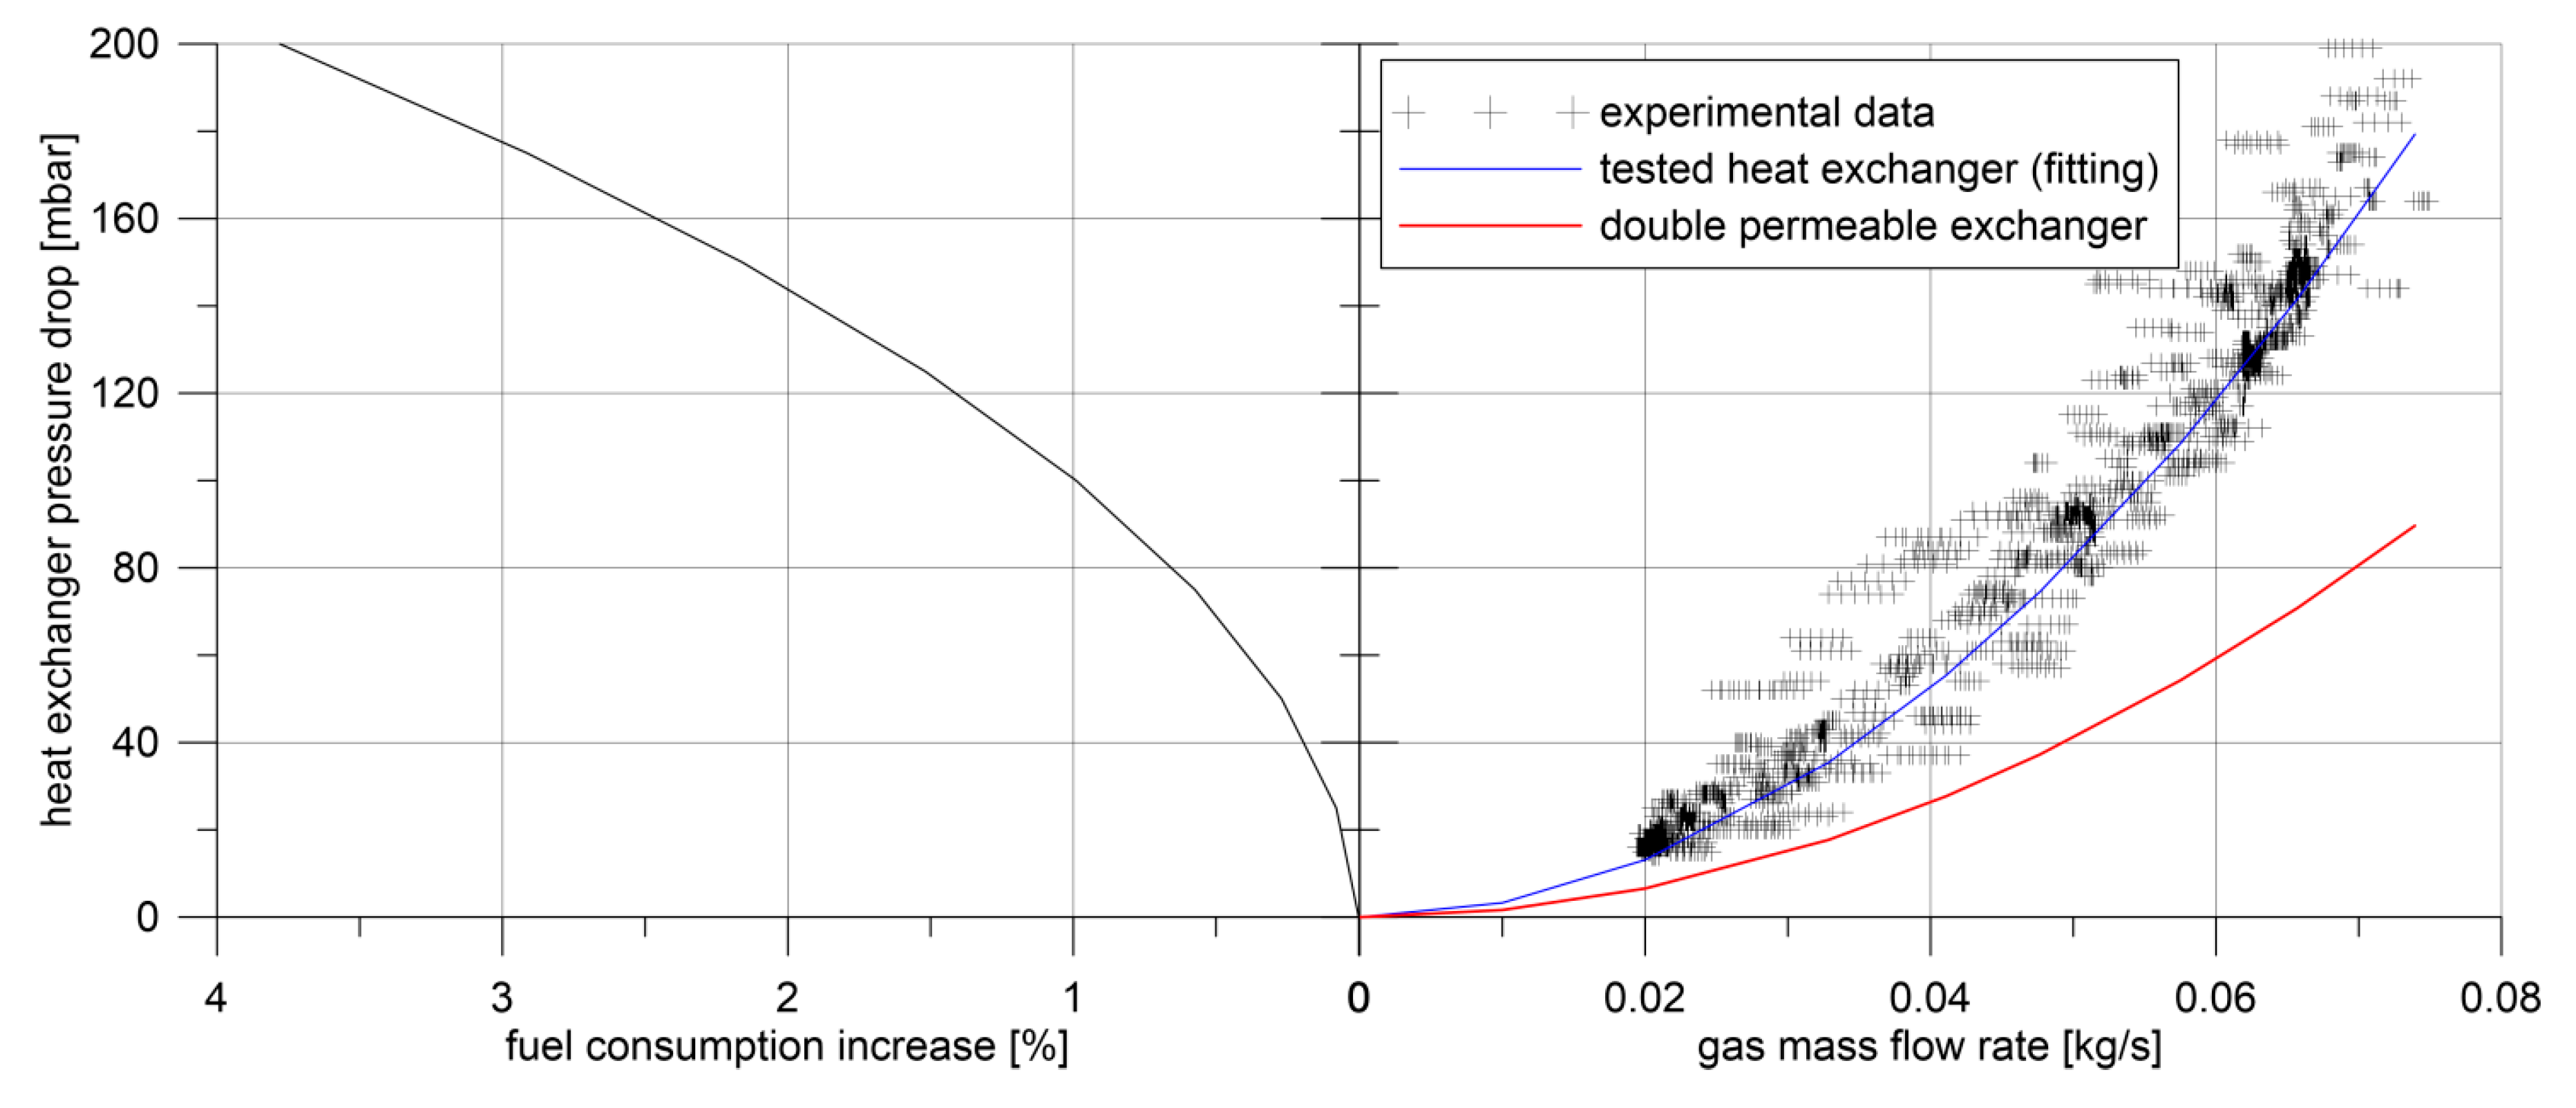
The flow resistance curve of the WHR-to-oil heat exchanger is shown in
Figure 19, in which the experimental data of the pressure drops on the exhaust side of such heat exchangers have been fitted with a second degree polynomial curve. 200 mbar of maximum pressure increase is demonstrated, according to
Figure 16.
This can be used to evaluate the extra fuel consumption due to the backpressure effect, thanks to previous experimental data [
40]. In
Figure 19, in fact, the percent increment of fuel consumption is correlated to the pressure increase realized in the exhaust line by the heat exchanger (or similarly by a different component). With the tested one (blue line of
Figure 19), the fuel consumption increase, evaluated on steady working points, is up to 4%. Combining the fuel consumption increase of
Figure 19 with the backpressure increase of
Figure 16 on the NEDC, considered as a sequence of steady working points, an overall fuel consumption increase of 2.9% is assessed. This reduced significantly the net benefit obtained heating the oil with the exhaust gases (−3.6%), limiting it to 0.7%. So, the pressure losses at the WHR at the gas side must be reduced (with respect to the testing activity done), reducing the gas speed inside the heat exchanger, orienting the design toward a solution in which the external dimension of this component exceeds those of the exhaust pipe.
Limiting the maximum pressure drop at the gas side to 100 mbar with a new heat exchanger which has half of the pressure drop of the tested one (red line in
Figure 19), the backpressure effect on the engine consumption on a NEDC would be limited to below 1%, producing a net fuel consumption reduction due to the hotter oil that is close to 2.6%.
5. Conclusions
In this work, the oil circuit of a turbocharged diesel engine (IVECO F1C 3L) has been modified in order to host an additional heat exchanger that transfers the heat of the exhaust gases to the lubricant oil. The intention was to improve engine efficiency during a NEDC and, consequently, reduce fuel consumption and CO2 emissions. Additional benefits were obtained in terms of harmful emissions.
The average thermal power available from the exhaust gases in the early phases of the NEDC (where the oil heating effect was expected to be more significant) was measured at about 5 kW, and this value is used for the heat exchanger sizing. In the first 900 s of the NEDC, a temperature increase of 2–5 °C is demonstrated.
The faster oil heating produces a significantly lower friction loss in the engine, which in turn produces a fuel consumption reduction and CO2 emissions of 3.6%, mainly in the urban part of the NEDC. The faster oil warm up helps the engine heating: cooling fluid warm up is reduced by about 60 s, but this contribution can be considered as a secondary effect. An interesting tailpipe pollutant emissions reduction was observed: unburned hydrocarbons and particulate matter have been reduced by about 3% and 2%, respectively, while CO is reduced by 7%, thanks to the higher excess of air in the combustion. For the same reason, combustion peak temperatures are lower, producing lower NOx (−3%) formation.
The detrimental effect of this waste heat recovery is represented by the engine backpressure produced in the exhaust manifold due to the heat exchanger crossing. The repercussions of the heat exchanger have been measured along the exhaust line starting from the conditions upstream of the turbine.
In the test performed, the sizing of the heat exchanger (shell and tube) was done in a way to limit the external dimension of the component to those of the exhaust pipe: this produced a pressure loss close to 180 mbar for a gas flow rate of 0.08 kg/s. According to this situation, a fuel consumption increase accounted for about 2.9%, producing a residual net improvement of 0.7%.
With the adoption of a bigger heat exchanger (integrating it in the engine exhaust) or of a more permeable technology (finned plate heat exchanger), engine backpressure can be reduced to 90 mbar (for the same gas flow rate) and fuel consumption increases can be reduced to 1%, obtaining a net fuel consumption saving equal to 2.6%.


