1. Introduction
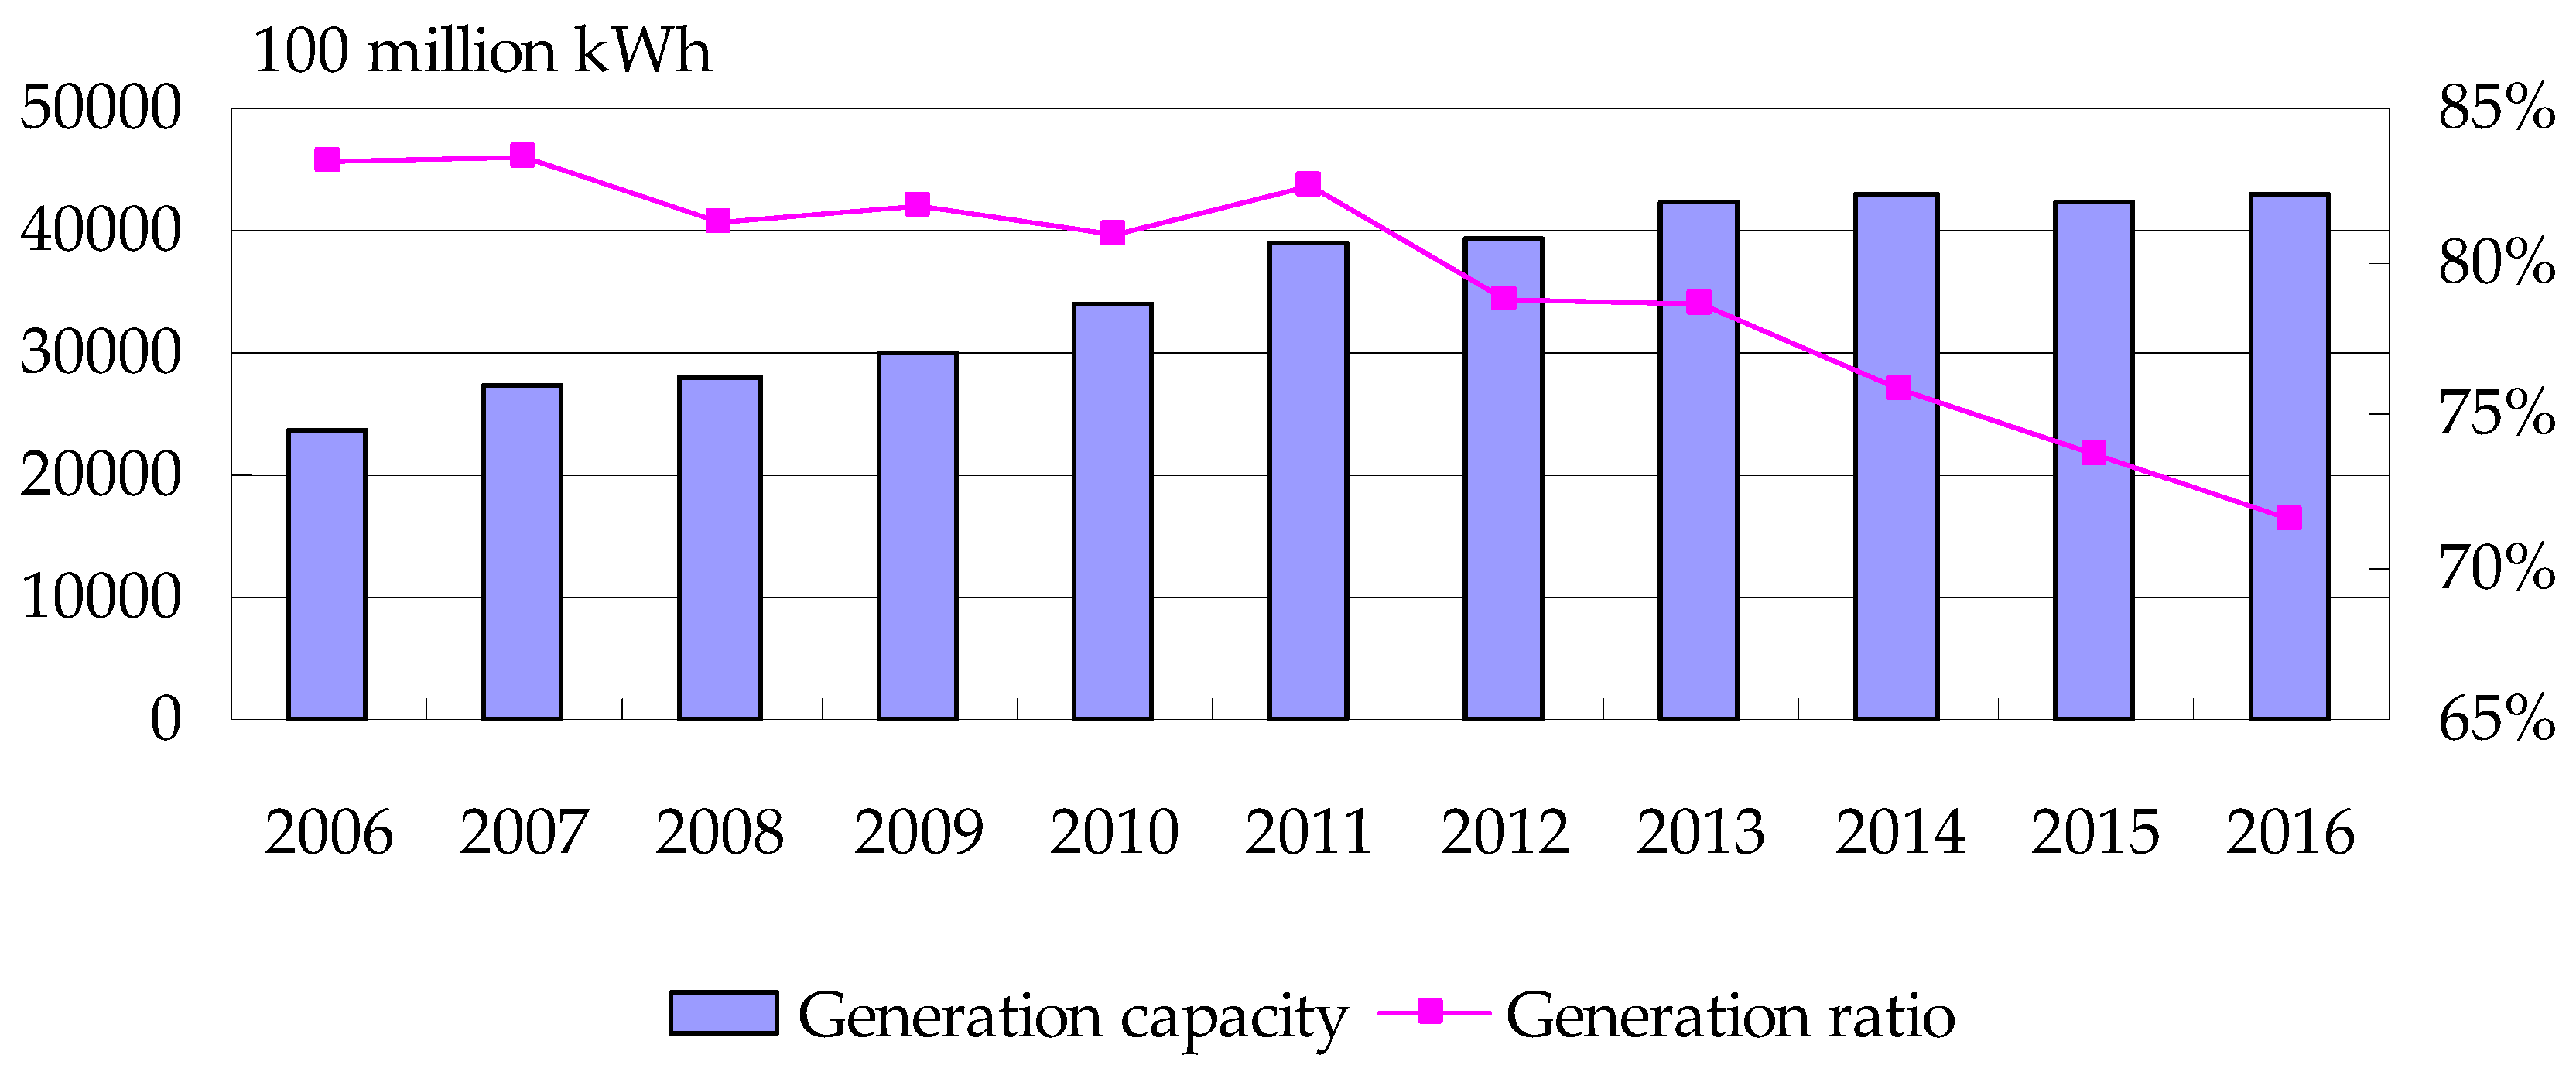
Power industry is the basis of economy and society developments. As one of the main energy consuming countries, China already had 1.65 GW installed capacity at the end of 2016. However, the explosive generation capacity is mainly determined by thermal power and the environmental problems brought by thermal generation are not negligible. From the generation structure in
Figure 1, through the thermal generation ratio in generation structure continued to decline in the past decade, but it is still an indispensable power source in China.
Meanwhile, high ratio of thermal power generation also brings a series of problems, such as thermal overcapacity, utilization hours decline and pollutant emissions. Therefore, in this new round of power market reform, promoting the energy efficiency of thermal power industry is an important issue to be solved. In addition, constrained by the goals of energy saving and emission reduction, it is also necessary to study the energy efficiency of thermal power industry comprehensively.
In this paper, the total-factors influential to the energy efficiency of thermal power industry were identified firstly from the economy, society and environment perspectives. Second, by DEA model and Malmquist function, the TFEE evaluation model was constructed to assess the national and provincial energy efficiency of thermal power industry in China. Then, by panel data model, the factors’ regression relationships to TFEE were analyzed as well. Finally, some suggestions on energy efficiency promotion were given combined with the regression results. In this paper, the combination techniques can identify the factors and assess the energy efficiency effectively. More specific influencing factors influential to TFEE can be located which can provide theoretical and practical references for thermal power industry to realize its sustainable development and energy efficiency promotion.
2. Literature Reviews
As an important energy resource, the electric power efficiency is widely studied. The previous analyses for efficiency were mainly focused on evaluation methods and its driving factors.
(1) Evaluation methods on electric power efficiency: In the previous studies, various methods and models were used to assess the electric power efficiency. Lam and Shiu used Data Envelopment Analysis (DEA) to study the increasing ratio of total-factor energy efficiency from 1995 to 2000. The effect of technical efficiency was analyzed emphatically [
1]. Nelson and Wohar. explored the total-factor productivity and influencing factors of the U.S. generation industry from 1950 to 1978. They divided the total-factor productivity into technology innovation, economy scale and government supervision based on the dual and exponential theories [
2]. Entering the 21st century, DEA model was still the main method for studying the energy efficiency. For example, Vaninsky used DEA to analyze the efficiency changes and forecast the future values of the U.S. power generation efficiency [
3]. Olatubi and Dismukes considered the influences of burning technology and operation efficiency from the cost perspective [
4]. Then, more research factors from new perspectives were considered in the DEA framework, such as emissions, pollutants and factor input level [
5,
6,
7]. However, constrained by the limits of DEA, the analysis framework did not consider the undesired output factors comprehensively. This led to an incomplete understanding about energy efficiency which cannot provide rational and objective references for government, industry and enterprises. Fortunately, with the mature of analysis techniques and the extension of research factors, more advanced methods were adopted into the power efficiency study. Via Bayesian stochastic frontier model and cost function, Kleit and Tecrell found that the productivity enhancement can reduce the production cost in thermal power plants [
8]. In addition, other techniques were also explored to evaluate the energy efficiency, e.g., Slack-based measurement (SBM), Banker Charnes Cooper (BCC), and Slack-based inefficiency (SBI) [
9,
10].
(2) Influencing factors to electric power efficiency: Besides power efficiency evaluation, the influencing factors to electric power efficiency were also widely studied. From the power plant level, the factors’ effects on power generation efficiency were analyzed, such as the rate of equipment utilization, the pattern of ownership, management experience, operation time, generation scale and fuel type [
11,
12,
13,
14]. Moreover, environmental factors were focused on gradually. On the generation process, Welch and Barnum studied the efficiency changes of fuel and pollutant by tracking the greenhouse gas emissions [
15,
16]. The suggestions were provided for balancing the costs and benefits of carbon emission reduction. For China, by reviewing the market reform in electric power industry, technology innovation has positive effects on the efficiency improvement of power generation. Meanwhile, the goals of energy saving and emission reduction also drives the efficiency promotion. For example, Wang and Zhu studied the provincial power efficiency in China from the technical and environmental levels via SBM [
17]. Additionally, with the accumulation of the research results, the power efficiency in renewable generation type was explored as well [
18]. From the factors’ relationship perspectives, some experts also studied the factors by input and output model to explore the ways to promote the energy efficiency. Lina et al., calculated the energy return on investment (EROI) by a mixed physical and monetary approach in order to redefine and evaluate the EROI for the national economy [
19]. From the relationship between economy and carbon, Yan and Ge assessed the sectoral and regional development by input and output analysis [
20]. They found that geographic location and past preferential policies were the most important factors influencing the local economic growth and CO
2 emissions reduction.
Based on the analysis above, this paper evaluates the TFEE by a mixed DEA and Malmquist model for solving the limits of traditional DEA model. In this novel combination method, multiple input and output indexes can be taken into account and Malmquist can effectively decompose the TFEE to more specific indexes. With regression analysis, the factors mainly influential to the TFEE can be selected for further analysis and policy making.
3. Factors Influential to TFEE
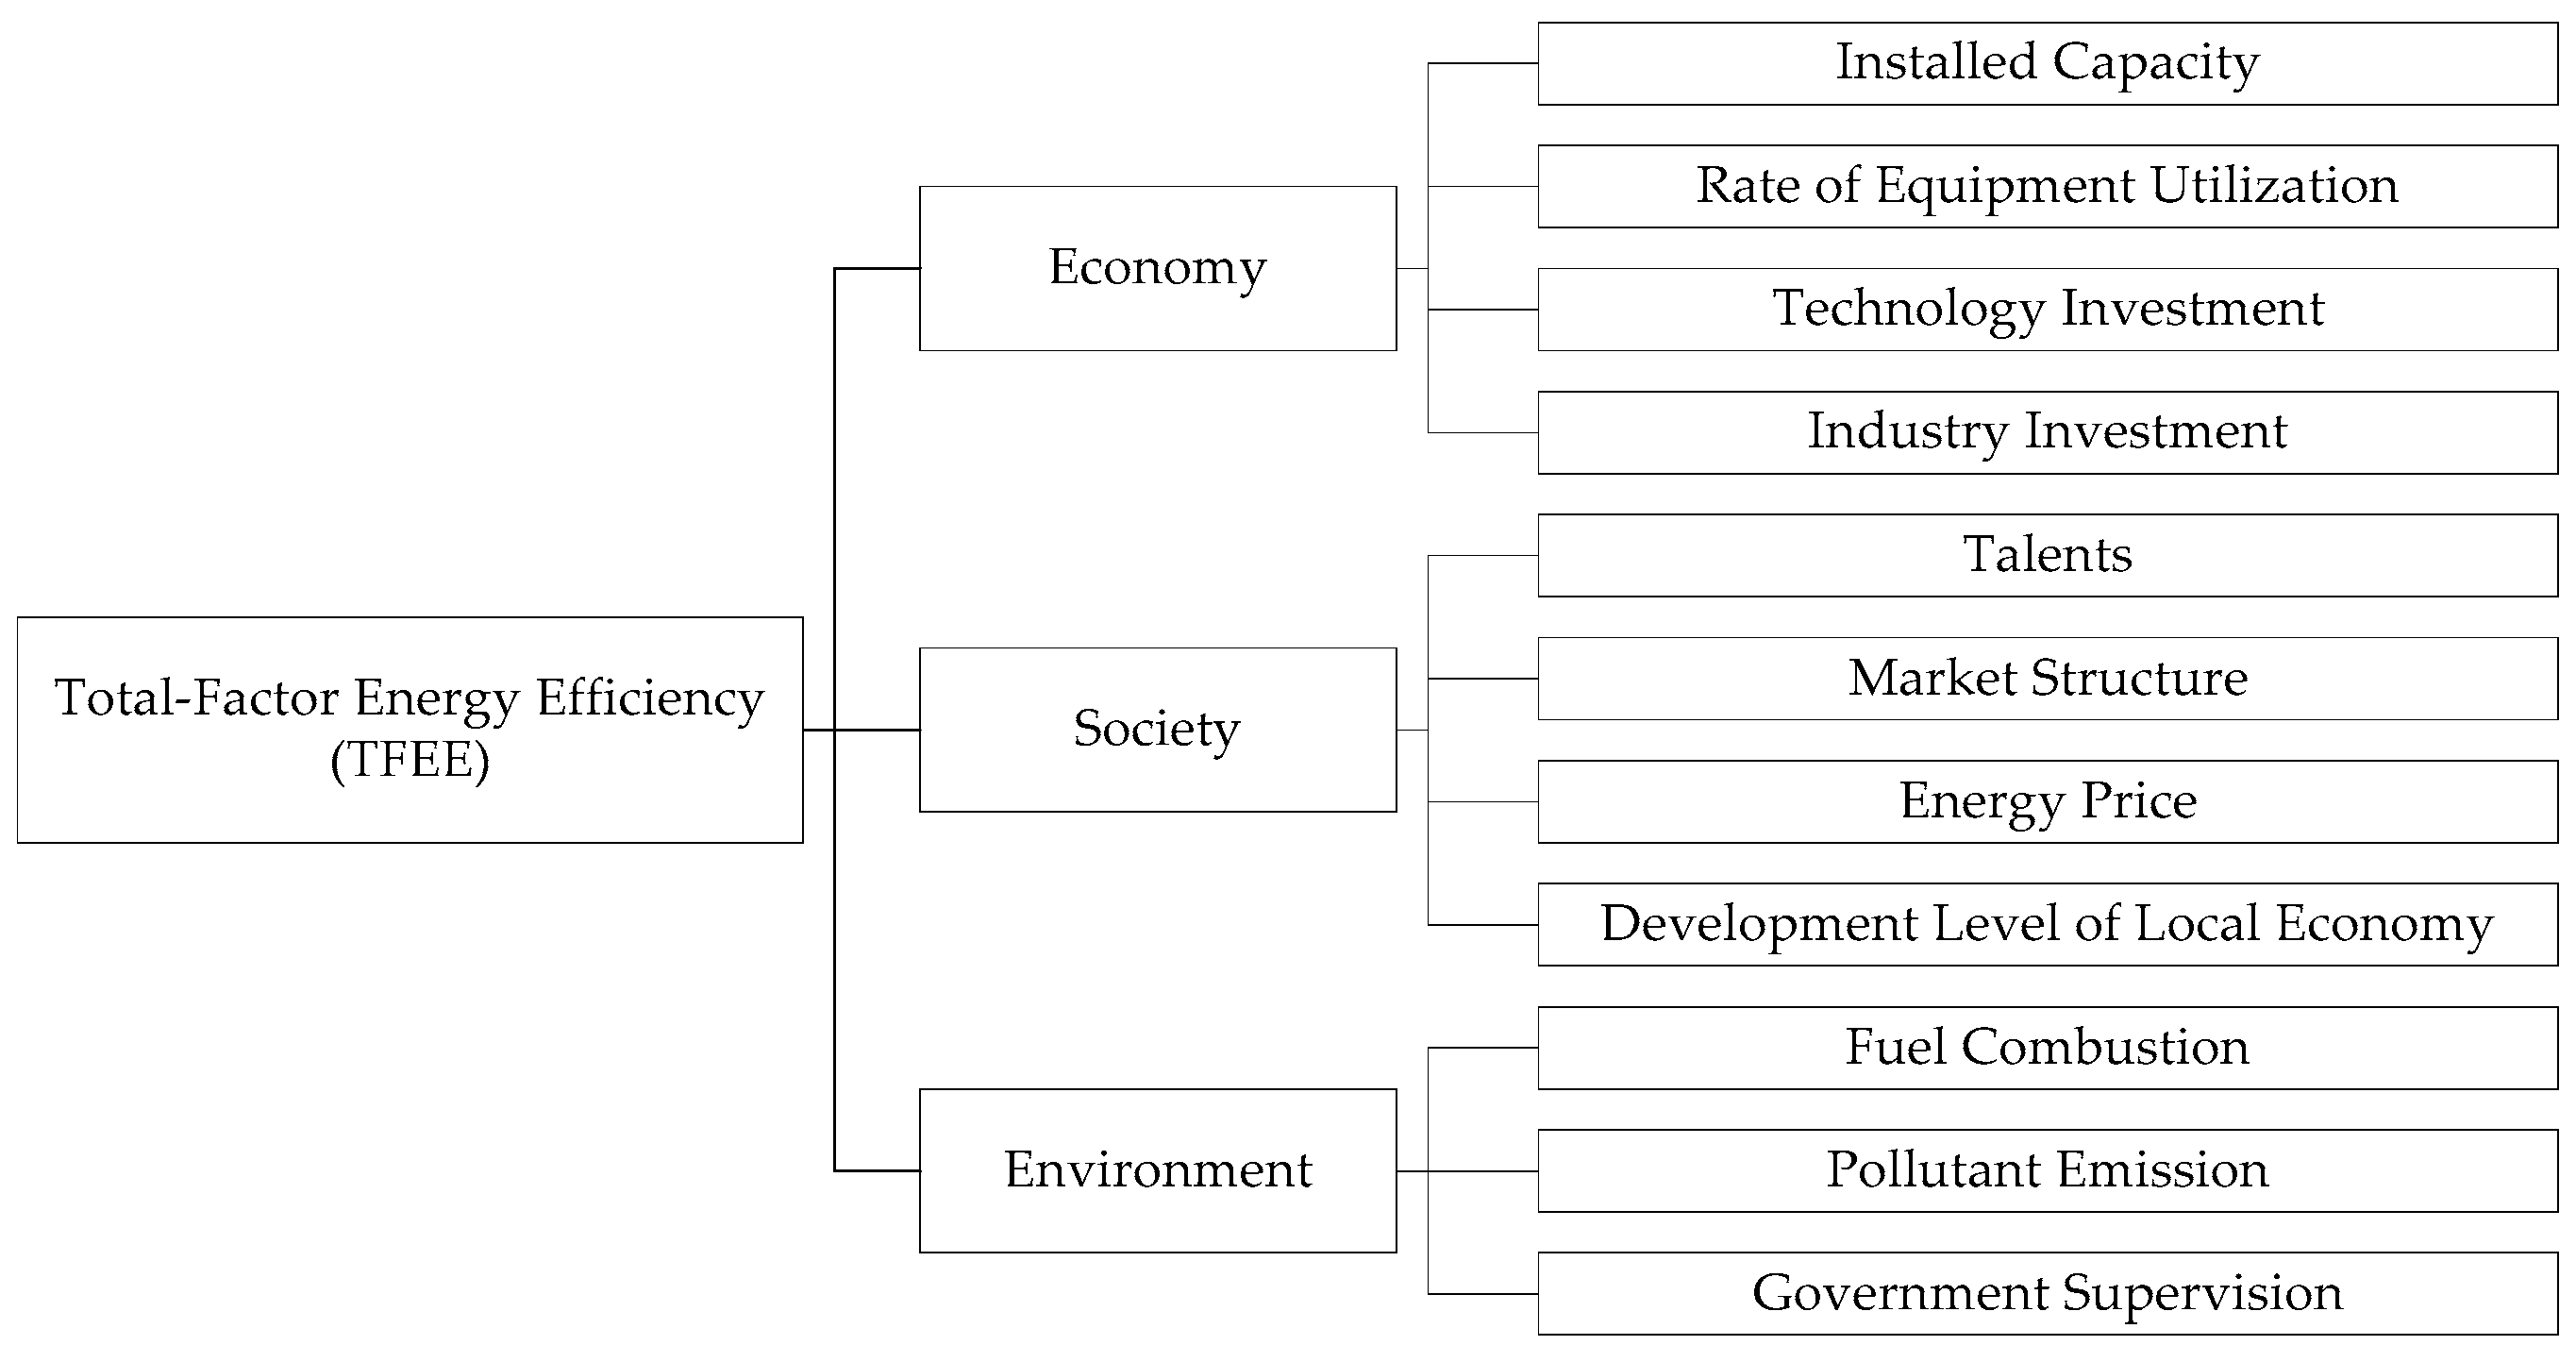
Based on the analysis results from literature reviews, the factors influential to the energy efficiency have not reached a consensus. Thus, to evaluate the energy efficiency of thermal power industry, it is imperative to summarize the factors from different perspectives. The factors influential to the TFEE are collected from economy, society and environment considering with the available data. The factor system is shown in
Figure 2.
3.1. Economic Factors
Economic factors are set to assess the TFEE from its economic development ability. Four factors were selected to describe this ability of TFEE, i.e., installed capacity, the rate of equipment utilization, technology investment and industry investment.
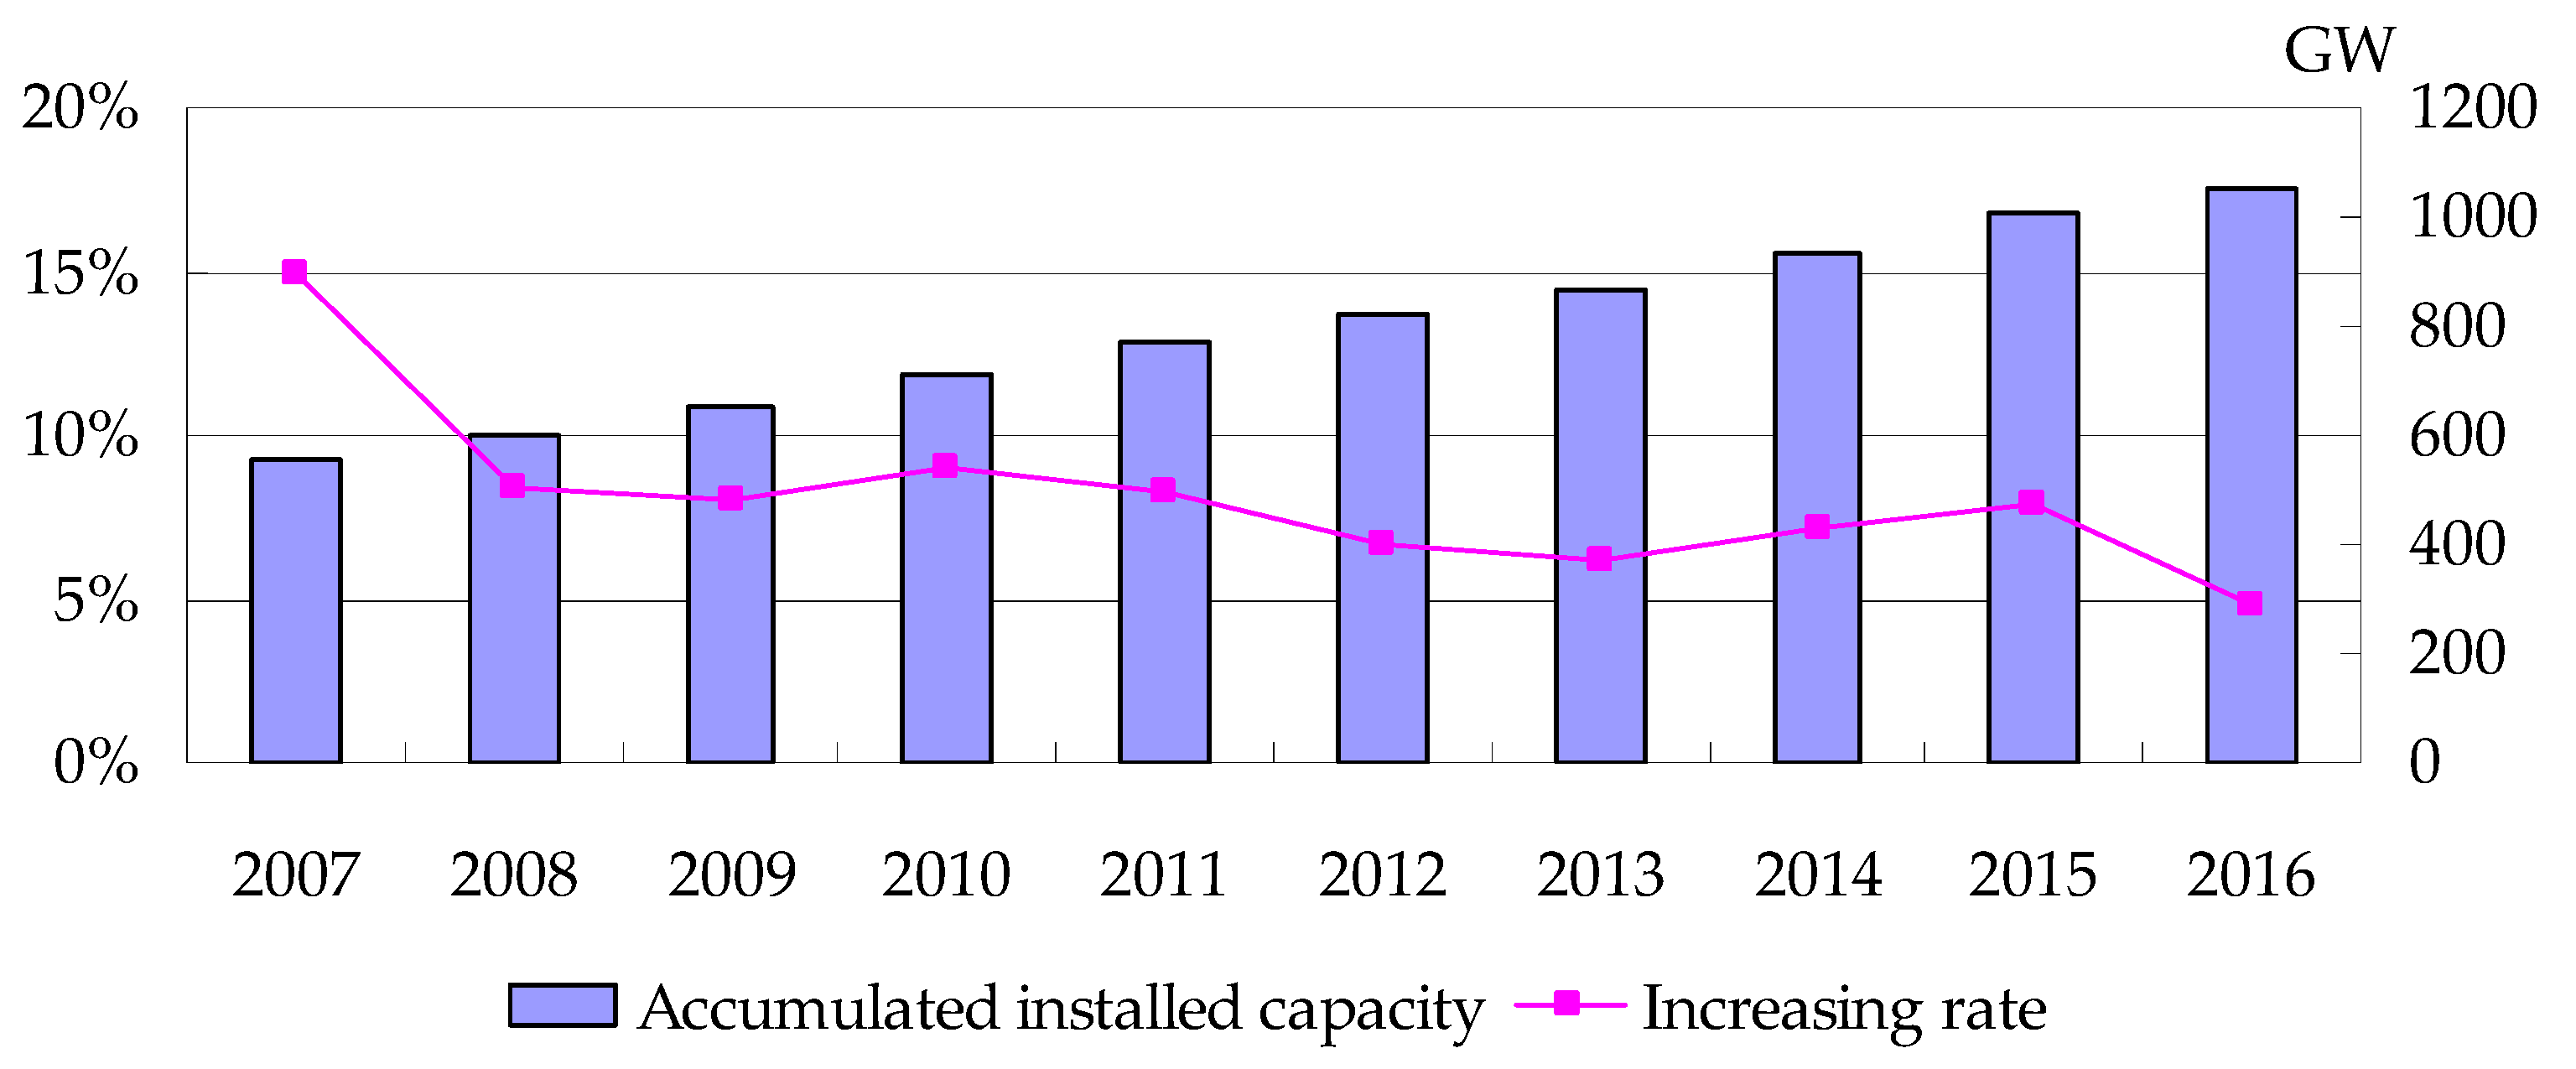
(1) Installed capacity: Installed capacity is one important index of thermal power construction which also shows the capital input in thermal power industry. By the end of 2016, the installed capacity of thermal power in China had reached 1053.88 GW, but rate of increase continued to drop, as shown in
Figure 3.
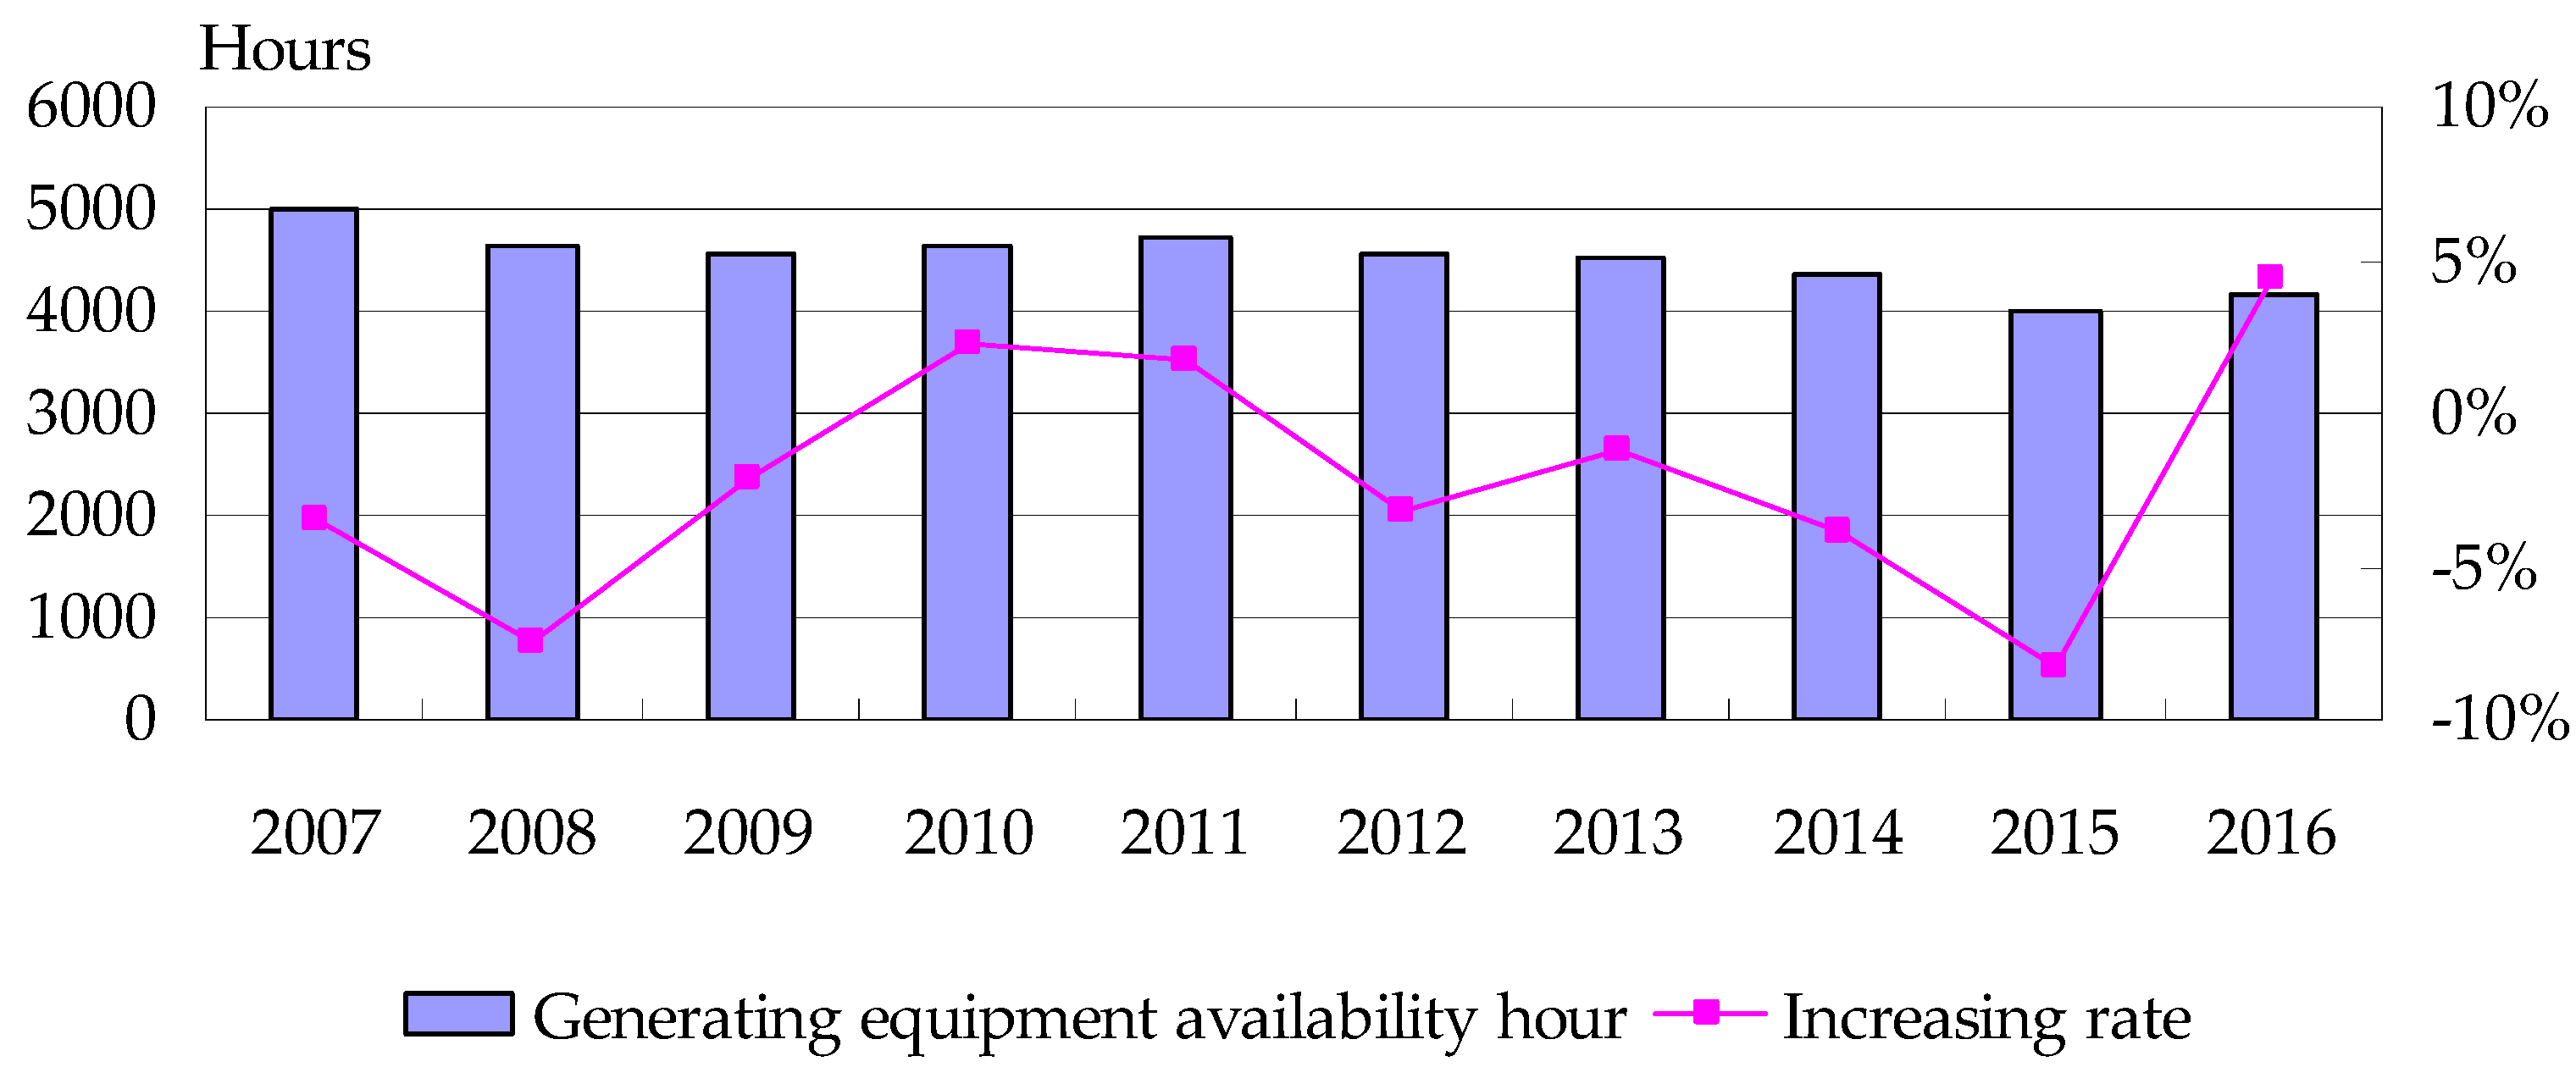
(2) The rate of equipment utilization: Compared with installed capacity, the rate of equipment utilization can reflect the energy efficiency more directly. The rate of equipment utilization can be calculated by generating equipment availability hours. The availability hours of thermal power generation equipment have dropped gradually in recent years (see
Figure 4).
In
Figure 4, the generating equipment availability hours in 2015 dropped to less than 4000 h due to the overcapacity of thermal power. In 2016, the generating equipment availability hours raised slightly compared to the level in 2015. The declining trend of availability hours will influence the thermal power efficiency extremely. Thus, the index should be adopted to the evaluation factors of TFEE.
(3) Technology investment: Technology is the initial driving factor to the efficiency promotion of thermal power industry. For example, improving coal combustion can promote the energy efficiency. Usually, the research and design (R&D) investment can be used to represent the technology level.
(4) Industry investment: Thermal power industry is a capital intensive industry which needs more capital supports. For instance, the investment contains infrastructure construction, expansion and reconstruction, desulfurization and denitration equipment and so on. In recent years, though the overall size of thermal power industry in China was controlled, its operation and development still need huge investment. Thus, the industry investment is also a decisive factor to TFEE.
3.2. Social Factors
Social factors are set to evaluate the society values influenced by TFEE in thermal power industry. The specific factors include talents, market structure, energy price and development level of local economy.
(1) Talents: Talents are the key resources to the enterprises for efficiency promotion. Rational talent distribution and management can enhance the energy efficiency exponentially. For example, Zhao H.R. et al. discussed the influences of labor force on economic growth comprehensively via panel data [
21]. It proved that the labor force plays an important role on economic growth.
(2) Market structure: Since the power market reform at the beginning of the new century, the monopoly in thermal power industry has been broken gradually. A series of market-oriented measures were tried to motivate industrial vigor. With the positive policy guidance, multiple generation companies stimulated the formation of competitive market. At present, there are more than 4000 enterprises with ≥6 MW generation capacity in China. These enterprises can provide a healthy environment for thermal power industry to improve its energy efficiency.
(3) Energy price: In China, the electricity price was mainly determined by government. However, with the pushing of electric power market reform, the coal price and the electricity price can reflect the market information more, such as the market demand and supply, energy resource reserves, pollutant treatment cost, etc. [
22]. Thus, the factor of energy price should be selected into the system to measure the TFEE.
(4) Development level of local economy: The development level of local economy has a close relationship with the generation efficiency of power industry. For example, Yan and Ge proved that the increasing GDP could accelerate the development of power generation industry, e.g., the installed capacity and the generating capacity [
20]. The dual influencing relationships between economy development and power industry will stimulate the efficiency enhancement.
3.3. Environmental Factors
Environmental factors are used to reflect the energy utilization and the treatment of pollutants and emissions. It contains fuel combustion, pollutant emission and government supervision.
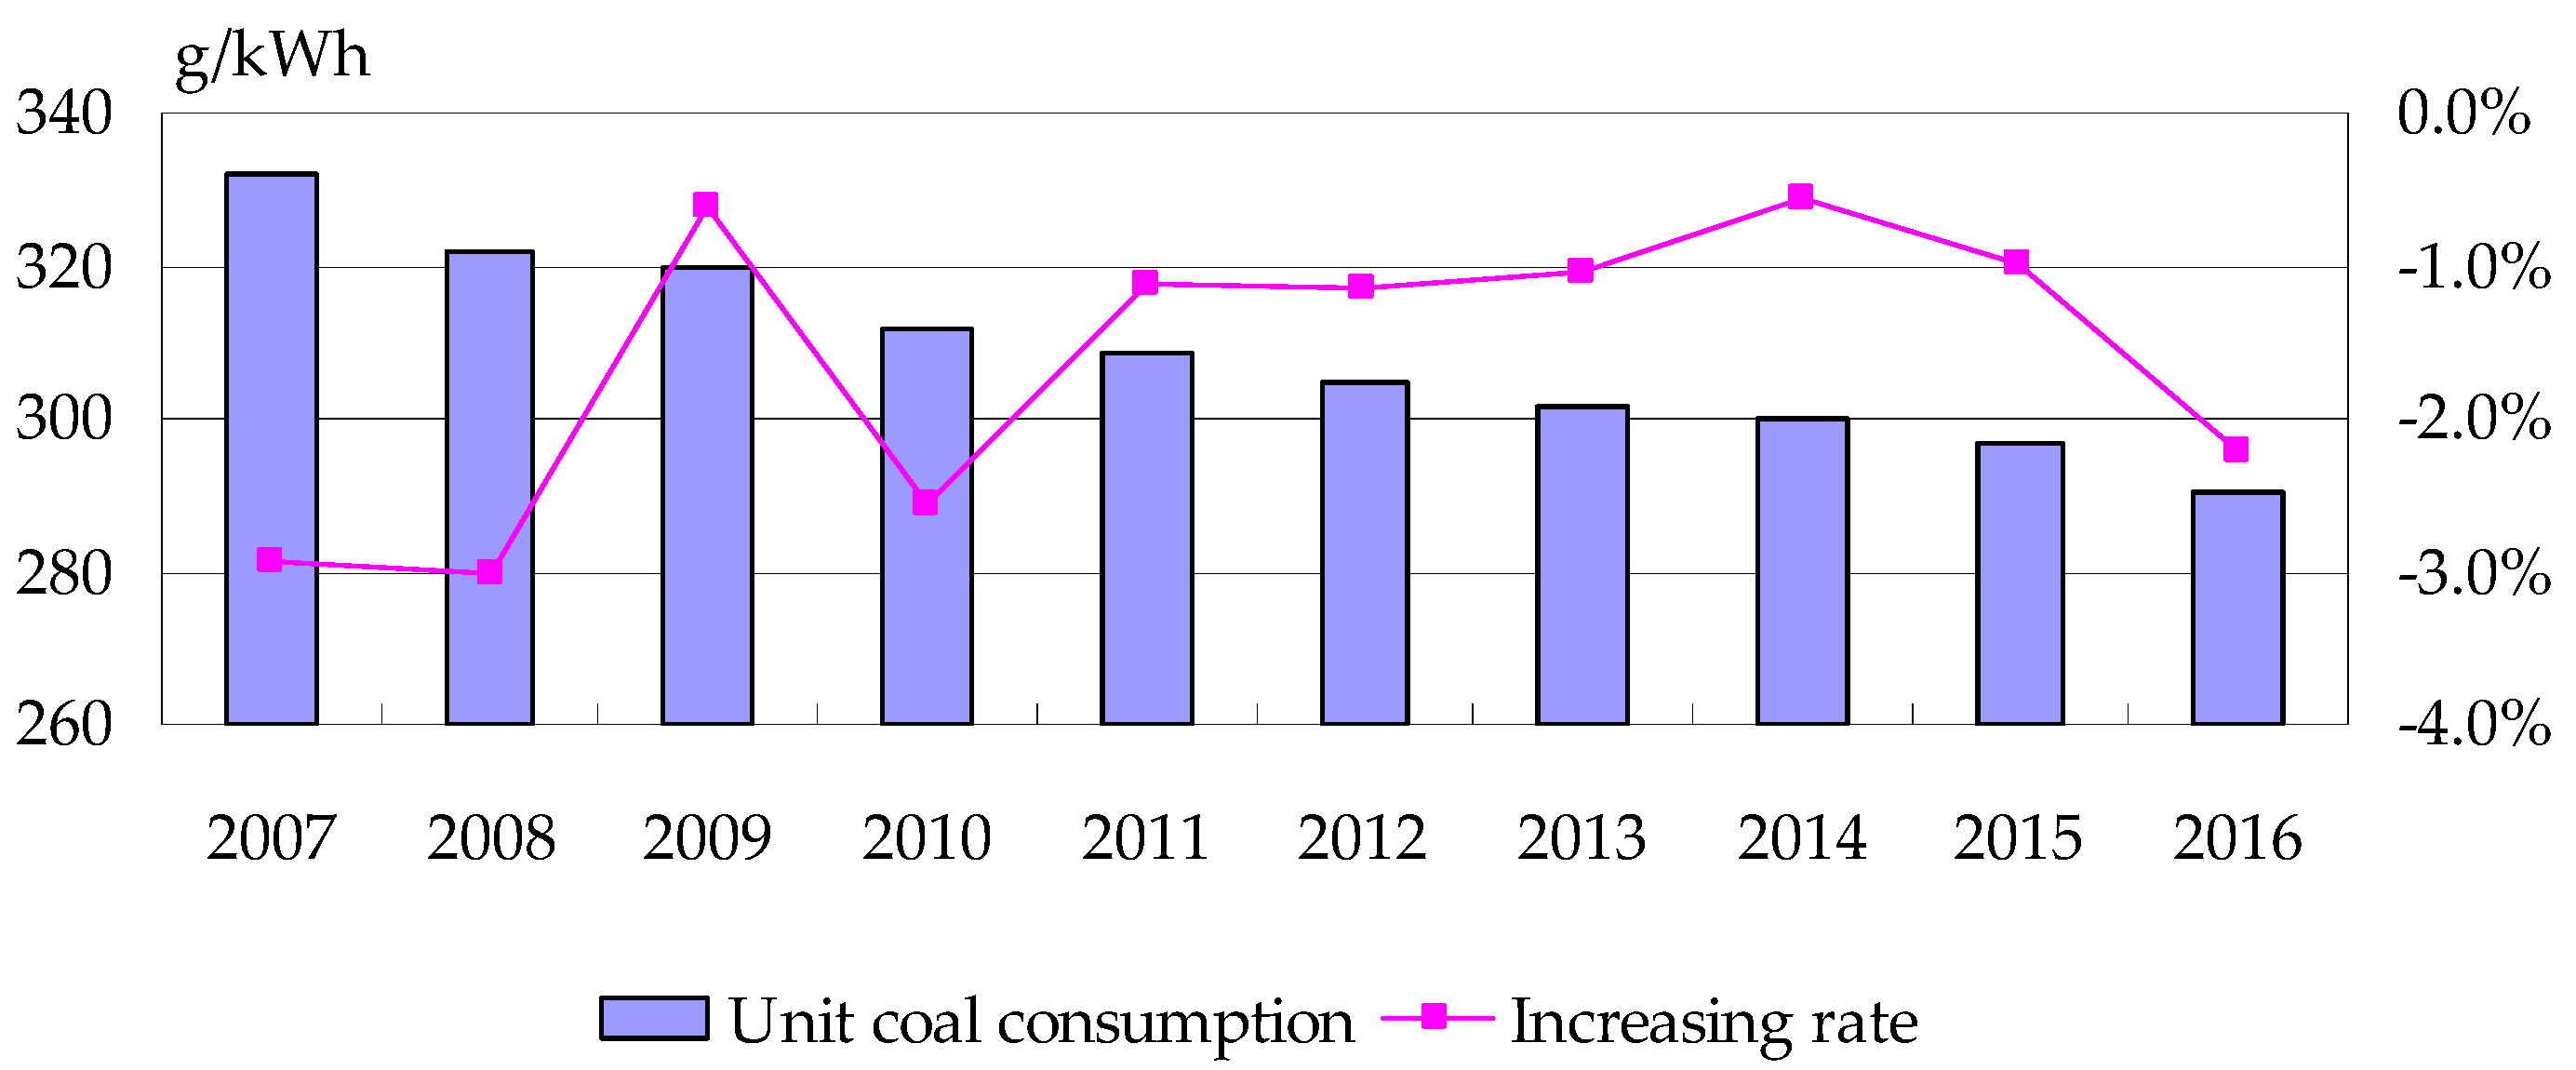
(1) Fuel combustion: As a basic input resource, coal plays an important role in the process of thermal power production. Coal consumption is a common index to evaluate the fuel efficiency. In China, the unit generating coal consumption is used the check the energy utilization efficiency in generation enterprises. The average unit coal consumptions are shown in
Figure 5. In
Figure 5, the unit coal consumption declined from 2007 to 2016, which has big contributions to the energy efficiency promotion.
(2) Pollutant emission: Thermal power production brings pollutant emissions, such as sulfur dioxide, carbon dioxide, and nitrogen oxides. How to control these pollutants is the key problem in the environmental efficiency improvement of TFEE. In this field, China has obtained a great achievement. From the statistics in 2015, the emissions of sulfur dioxide, nitrogen oxides and dust have reduced 27.79 million tons, 5.62 million tons and 363.87 million tons, respectively. The harmonious development between thermal power industry and the eco-environment is critical to improve the TFEE in China. In this paper, the total emission amount of sulfur dioxide (SO2), carbon dioxide (CO2), nitrogen oxides (NOX) were taken as undesired index to analyze the TFEE.
(3) Government supervision: To ensure the environmental efficiency promotion of thermal power industry, Chinese government should strengthen the supervision on pollutant emissions. During the 13th five-year plan period, considering with the development goals of power generation industry, the government has published a series of policies and regulations to solve the environmental problems in thermal power industry, such as measures on the operation and management of desulfurization and desulfurization facilities of coal-fired power generating units. Thus, government supervision should be employed into the evaluation system of TFEE.
4. Methods
4.1. CCR Model
Constant Returns to Scale (CRS) model is a kind of DEA model which take the weights of Decision Making Units (DMU) as decision variables. Each DMU contains various input and output indexes for optimization evaluation by programming model [
23]. In this paper,
n DMUs were set to represent decision making units in TFEE evaluation. There are
m input indexes and
s output indexes in each DMU. The input and output index can be described as shown in Equation (1).
where
Xmn stands for the
mth inputs of the
nth DMU,
Ysn is the
sth inputs of the
nth DMU. The weight sets of inputs and output were set as
Vn and
Un as shown in Equation (2).
Then, the efficiency evaluation exponent can be calculated by Equation (3).
With the proper valuations of
v and
u, when
hn ≤ 1, the Charnes-Cooper-Rhodes (CCR) model can evaluate the DMUs via Equation (4).
By Charnes–Cooper conversion, Equation (4) can be transformed into Equation (5).
In Equations (4) and (5),
X0 and
Y0 stand for the input and output variables of the
n0th DMU. Then, the DEA model can be described by the non-Archimedes infinitesimal exponent
, as shown in Equation (6).
Its dual programming function is shown in Equation (7).
where
is the weight of input or output factor,
is the radial optimization value of the
nth DMU to the efficient frontier hyperplane.
and
are the slack variables. When
, DMU shows its weak DEA efficiency. Especially, when
on the condition of
, the DEA of DMU is efficient. When
,
and
, the greater the value
has, the higher the efficiency of DMU produces. Meanwhile, when
, it stands the returns to scale are fixed. When
, the returns to scale are increasing. The returns to scale are deceasing under other circumstances.
4.2. Malmquist Index
On the aspect of energy efficiency measurement, Malmquist has its advantages with multiple input and output indexes [
24]. In general, Malmquist index (TFPCH) can be factorized into two indexes, as shown in Equation (8), i.e., technical efficiency index (TECH) and technical progress index (TPCH).
In Equation (8),
d stands for the distance function. If TFPCH > 1, the energy efficiency has increased from the period
t to
t + 1. If TFPCH > 1, the energy efficiency has decreased from the period
t to
t + 1. Meanwhile, the technical efficiency index (TECH) can be factorized further into pure efficiency index (PECH) and scale efficiency index (SECH) (see Equation (9)). The factorized indexes can determine how much efficiency promotion is contributed by pure technology and whether the power production is in its best production scale.
Thus, in this paper, the TFEE can be assessed by technical progress index (TPCH), pure efficiency index (PECH) and scale efficiency index (SECH) as shown in Equation (10).
4.3. Multiple Regression Model Based on Panel Data
Compared with traditional regression model, panel data model can not only present the commonality of cross-section data, but can also show the special effects on individual DMU. The panel data model can be set as Equation (11).
where
yit stands for the
ith individual value on the
tth time,
ai is the constant or the intercept.
uit is the value of random error,
xii is the explaining variables and
bi is its coefficient.
N is the individual numbers and
T stands for the time series.
Panel data model has the advantages of getting the variable uniform estimation, improving the sampling accuracy, and simulating the complicated behaviors [
25]. The typical panel data models include the mixed model, fixed effect model and random effect model. In this paper, fixed effect model will be chosen to explore the main components influential to the TFEE.
5. Empirical Study
Mainly considering data availability, the factors were selected to measure the TFEE of thermal power industry in China. In particular, installed capacity (10 MW), talents (10 thousands) and fuel combustion (thousand tons) are set as the input factors; generation capacity (100 million kWh) is set as the output factor and pollutant emission (100 million standard m3) is selected as the undesired output factor.
5.1. TFEE Changes of Thermal Power Industry
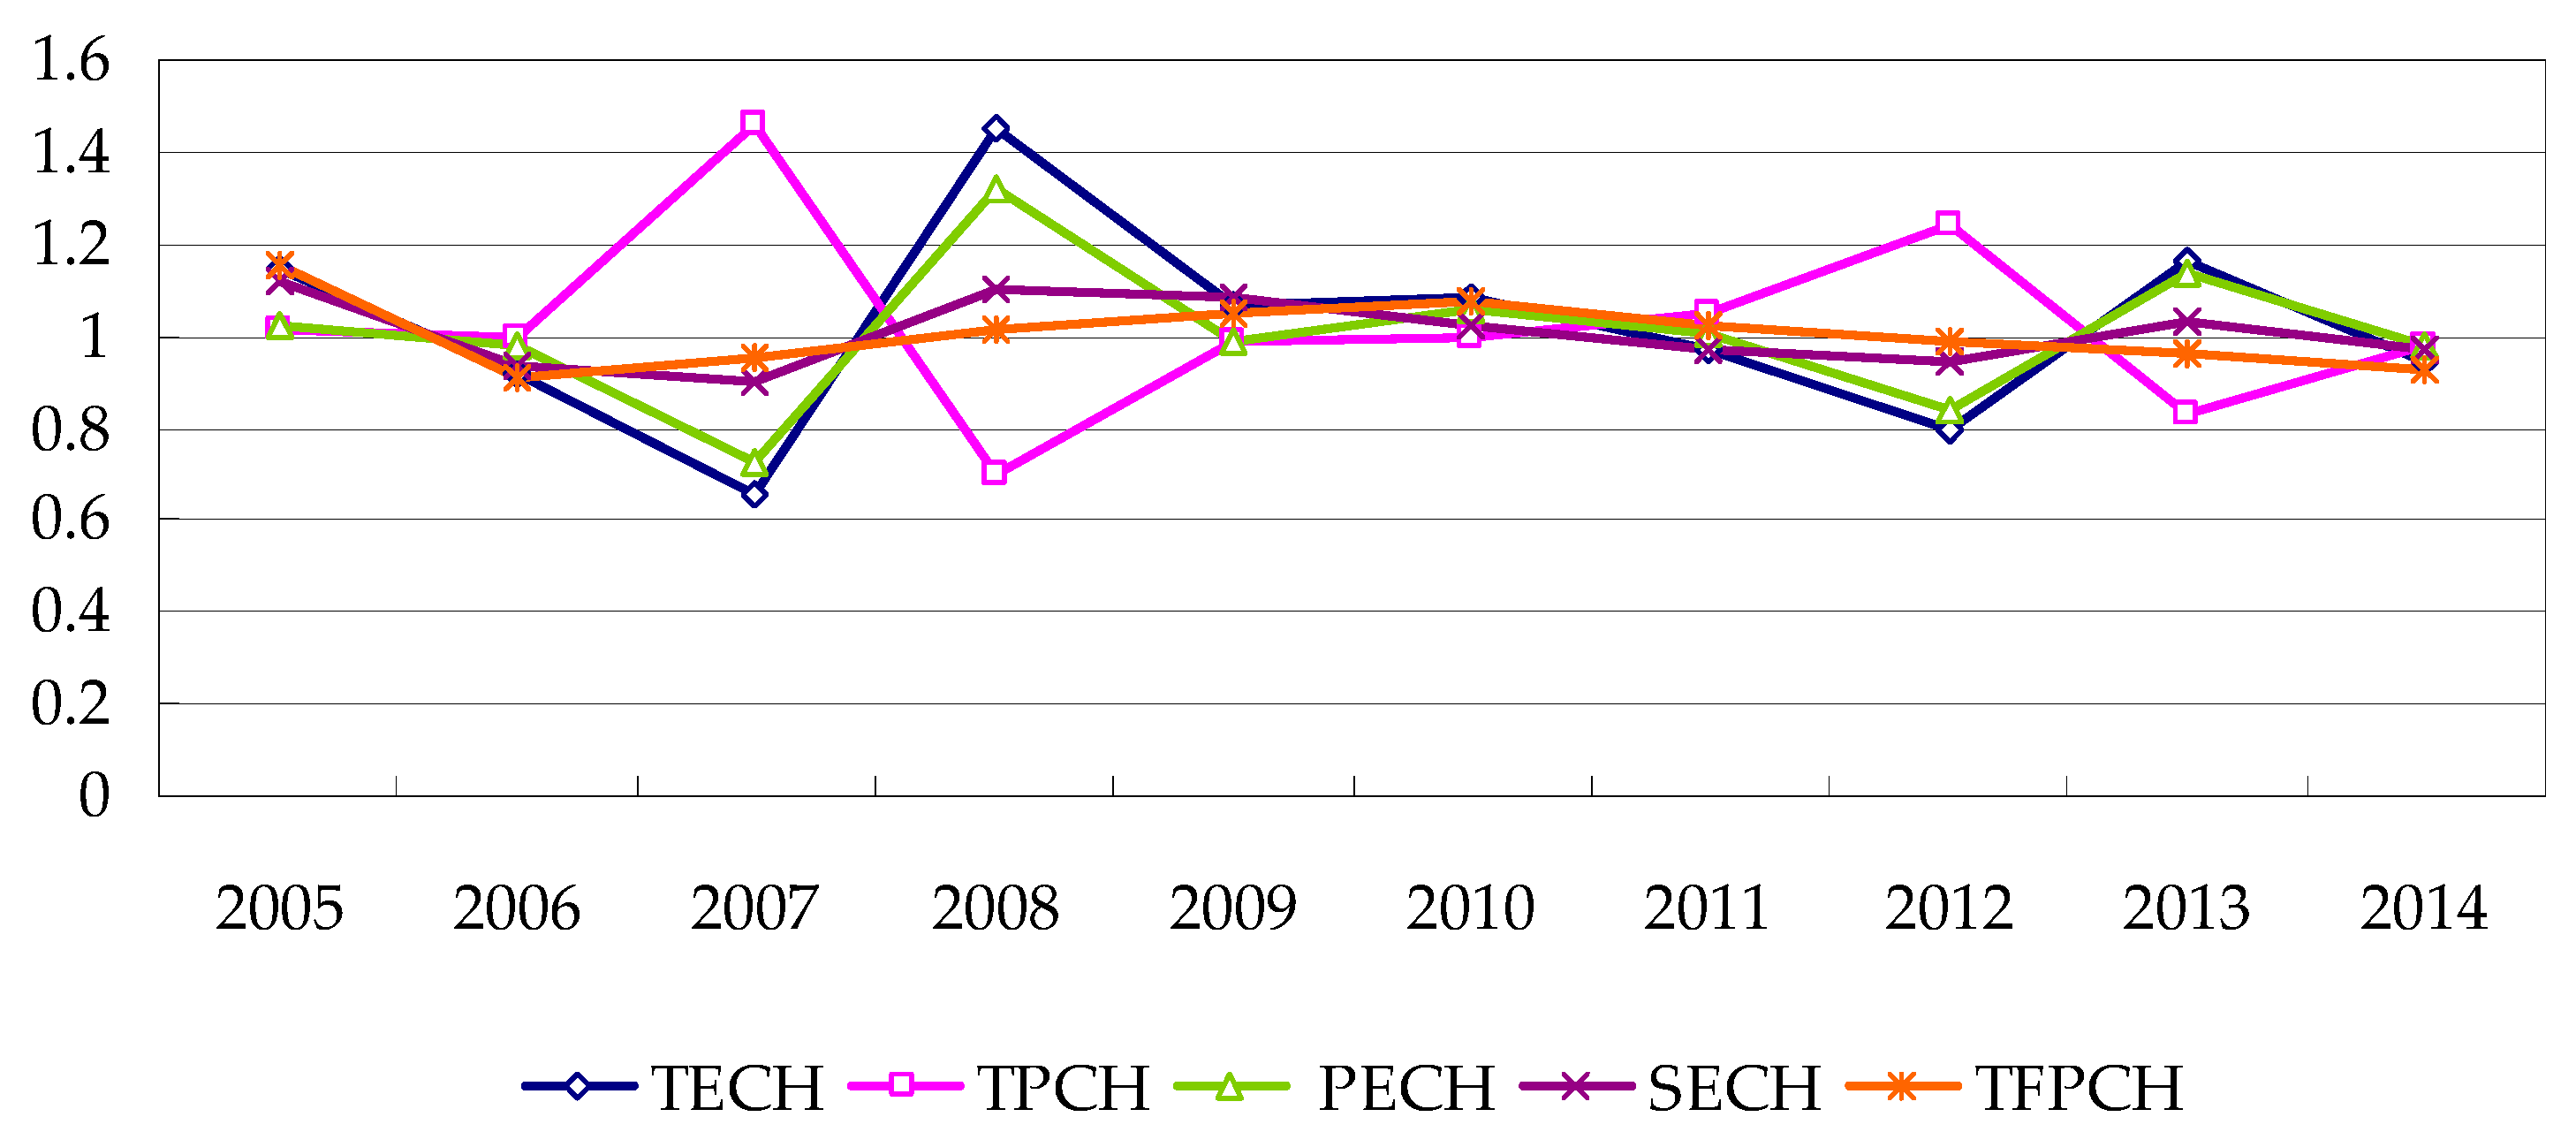
Oriented by output factors, the factors were brought into the DEA model composed by CCR and Malmquist index. With the help of software DEAP 2.1, the technical efficiency index (TECH), technical progress index (TPCH), pure efficiency index (PECH), scale efficiency index (SECH) and Malmquist index (TFPCH) of Chinese thermal power industry can be obtained (
Figure 6).
From 2005 to 2014, the average value of TFPCH was 1.004 which had a 0.4% increasing rate. It shows that the Chinese thermal power industry has a relatively stable development. During the period from 2005 to 2010, the TFPCH showed a trend that it first decreased and then increased. After 2010, the tighten development of the thermal power industry led to the index decrement again. In real terms, the thermal power industry has developed slowly due to the policy intervene, such as the “developing large units and suppressing small ones”. Meanwhile, the competition from renewable generations also crowded out the generation capacity of thermal power. Therefore, though the installed capacity of thermal power has increased constantly in recent years, but its TFPCH did not improve obviously.
From the factorized indexes, the average value of TPCH and TECH are 1.006 and 0.997, respectively. The fluctuation ranges of TPCH and TECH are both less than 1%. In addition, the average increasing rate of scale efficiency index (SECH) is 0.5% which shows a progressive increase in the returns to scale of thermal power industry. It is determined by the elimination of backward production capacity. On the other hand, the pure efficiency index (PECH) has decreased a little with the average value of 0.993. Thus, from the index analysis, the increase of TFPCH in China was mainly determined by technical progress index (TPCH) and scale efficiency index (SECH).
5.2. Provincial TFEE Analysis
After the overall TFEE analysis, the energy efficiencies of thermal power industry in different provinces were also explored, as shown in
Table 1.
From the analysis results in
Table 1, 12 provinces have higher TFPCH than the national average value. Most of these provinces are located in areas with high economic development levels, such as Beijing, Jiangsu and Zhejiang. Meanwhile, the provinces with abundant energy resources also have better performance in TFPCH, such as Inner Mongolia, Shanxi and Xinjiang. Among these provinces, TECH contributes more to the increase of TFPCH due to the industrial technology innovation.
On the contrary, the provinces with less than 1 TFPCH are mostly in low development areas, such as Ningxia, Guizhou and Yunnan. For example, the increasing rate of TFPCH in Yunnan has reached −5.4%, caused by the mutual influences of technical progress (TPCH) and technical efficiency (TECH). Meanwhile, the SECHs did not change much in the negative growth provinces.
5.3. Statistic Analysis and Regression Analysis
With the TFEE analysis results from overall and provincial level, it is imperative to identify the key factors influential to the TFEE and explore their associations with TFEE. Before the regression calculation, the factors’ stationarity and cointegration in panel data model need to be checked. The factors include installed capacity (X1), technical investment (X2), fuel combustion (X3), pollutant treatment (X4), energy price (X5) and talents (X6).
(1) Unit root test
There are various unit root test methods which have different test effects and results. In this paper, IPS, ADF-Fisher, PP-Fisher and LLC test methods were employed to measure the factors’ stationarity [
26]. The results are shown in
Table 2.
In
Table 2, the difference values
P of first order in each variable are all less than 5%. It proves the factors’ first order stationarity under 5% significant levels.
(2) Cointegration test
With the uniformity integrated variables in stationarity test, the contegration should be tested subsequently. Pedroni and Kao methods were adopted to test the contegration in this paper [
27]. The results are shown in
Table 3.
Because of short sample series in panel data model, the contegration test belongs to small sample test. Based on the test results, Panel ADF-Statistic, Group ADF-Statistic and ADF have all passed the t-Statistic standard under the 1% significant level. The results show that the variables have the stable relationships.
In addition, F-Statistic test and Hausman test are usually used to choose the panel data model. The F-Statistic test and Hausman test results are shown in
Table 3 and
Table 4. From the results in
Table 4 and
Table 5, the fixed effect panel data model was chosen to determine the best evaluation model.
(3) Regression results
Taking the factors as independent variables, their fixed effect regression results to TFEE are shown in
Table 6.
From the regression results, the largest coefficient is X3 (−6.18860) which has most influence on the TFEE of thermal power industry. In other words, 1% decline of coal consumption can bring 6.18860% increase on TFEE. It also proves that there is a positive correlation between coal consumption and TFEE. In real terms, the unit coal consumption of thermal power generation in China has reduced 50 g/kWh from 2005 to 2014 which makes a great contribution to promote the energy efficiency of thermal power industry in China.
The coefficients of X1 and X5 are both beyond 1.5. The results show that the installed capacity and energy price hindered the efficiency improvement of thermal power industry. When the installed capacity increases 1%, the energy efficiency of thermal power industry will decrease 1.62906%. On the aspect of energy price, the energy efficiency of thermal power industry will decrease 1.55819% if its price raises 1%. It is worth noting that the energy price used in this paper is a comprehensive exponent. It was employed to determine the basic relationship between price and efficiency.
The positive coefficient of technology investment (X2) shows that the advanced technology can enhance the generation efficiency, reduce the generation cost, save the labor force, and then improve the TFEE of thermal power industry. The positive coefficient of X6 also proves that professional talents are important to TFEE promotion in thermal power industry.
The negative coefficient of pollutant treatment (X4) illustrates that the environmental supervision was imperfect in the past 10 years. In the future, the government should guide the industry to eliminate the backward production capacity and introduce advanced production devices to realize the goals of energy saving, emission reduction and efficiency promotion.
6. Discussion
Based on the TFEE evaluation results of thermal power industry in China, some suggestions are given from the following four aspects considering with the regression results of installed capacity (X1), technical investment (X2), fuel combustion (X3), pollutant treatment (X4), energy price (X5) and talents (X6).
(1) Strengthening technology S&D: With the evaluation results, technology can promote the energy efficiency prominently. Thus, it is imperative to encourage the technology innovation from the industry level and the enterprise level with abundant capitals (X2). In particular, new units with great capacity, low fuel combustion (X3), and little emission features can be built and popularized in thermal power industry. Take ultra-supercritical generating unit in China Huaneng Group as an example, its generating efficiency has reached to 45.4% and its unit coal consumption is just 283.2 g/kWh which is much lower than the average level. Through calculation, its reductions on sulfur dioxide, carbon dioxide, and nitrogen oxides are 2800, 500,000, and 2000 tons per year, respectively. Limited by the current generation structure in China, the investment on technology S&D is a practical and feasible way to realize the energy efficiency improvement on thermal power industry. In the future, government and enterprise investment should tilt to advanced technology R&D.
(2) Enforcing the pollutant and emission reduction: As an undesired output factor, pollutant and emission treatment (X4) has extremely important effects on energy efficiency promotion of thermal power industry. Chinese government should strictly supervise the thermal power generation enterprises from a clean and sustainable perspective. Meanwhile, the environmental assessment system, clean development planning and technical standards for thermal power projects need to be constructed immediately. On the implementation level, using the high quality energy-saving and environmental protection equipment is also necessary. If the devices have quality problems and risks, they should not be allowed access to the thermal power industry.
(3) Distributing capitals and labors rationally: At present, there is an overcapacity trend in thermal power generation capacity in China. Considering with the positive correlations of investment and talents to TFEE, the government should redistribute the industrial capitals and labors rationally and guide the resources flow to the large installed capacity projects (X1) with high energy efficiency. For example, the measure of “developing large units and suppressing small ones” is a good beginning for thermal power industry to eliminate the overcapacity. Meanwhile, making labor (X6) more professional and skillful is also beneficial to the thermal power industry.
(4) Improving the government supervision: With the TFEE evaluation results, the positive government supervision effects on the efficiency promotion were not obvious in the past decade. As common measures to enhance and improve the government supervision, punishment and subsidy can be used to balance the production benefits, and then rationalized the current energy price (X5). Strict punishment measures are set to reduce the undesired output of thermal power industry. Meanwhile, the enterprises and projects with excellent efficiency effects should be awarded via finical subsidy. The combination of these two measures can stimulate the TFEE promotion and eliminate backward production capacity in thermal power industry. In addition, the government implementation efforts and the enterprise acceptance degrees will also influence the government supervision in different regions. Thus, the supervision for the energy efficiency should be implemented according to the different development levels and promotion potentials.
7. Conclusions
To improve the energy efficiency of thermal power industry during the 13th five-year planning period, it is critical to evaluate the national and provincial energy efficiency objectively. Based on CCR model and Malmquist index, the factors influential to the total-factor energy efficiency of thermal power industry were first identified. The factors were collected from the economy, society and environment levels. The Malmquist analysis found that the TFEE increase of thermal power industry in China was mainly contributed by technical progress index (TPCH) and scale efficiency index (SECH). The provincial analysis results can also support this conclusion. Meanwhile, by provincial TFEE analysis, it also found that the energy efficiency of thermal power industry is also influenced by the economy development levels and energy reserves. In addition, by panel data regression analysis, controlling or reducing the unit coal consumption can help thermal power industry improve its energy efficiency effectively. The research results can help the central and local government to understand the energy efficiency level objective and identify the key driving factors to TFEE. Finally, some advice was provided for thermal power industry combined with the regression results, e.g., strengthening technology S&D, enforcing pollutant and emission reduction, distributing capital and labor rationally, and improving the government supervision. Additionally, mature and healthy market construction also has a profound influence on thermal power industry development, which is an important direction on energy efficiency study in the future.


