Core Abilities Evaluation Index System Exploration and Empirical Study on Distributed PV-Generation Projects

Abstract
1. Introduction
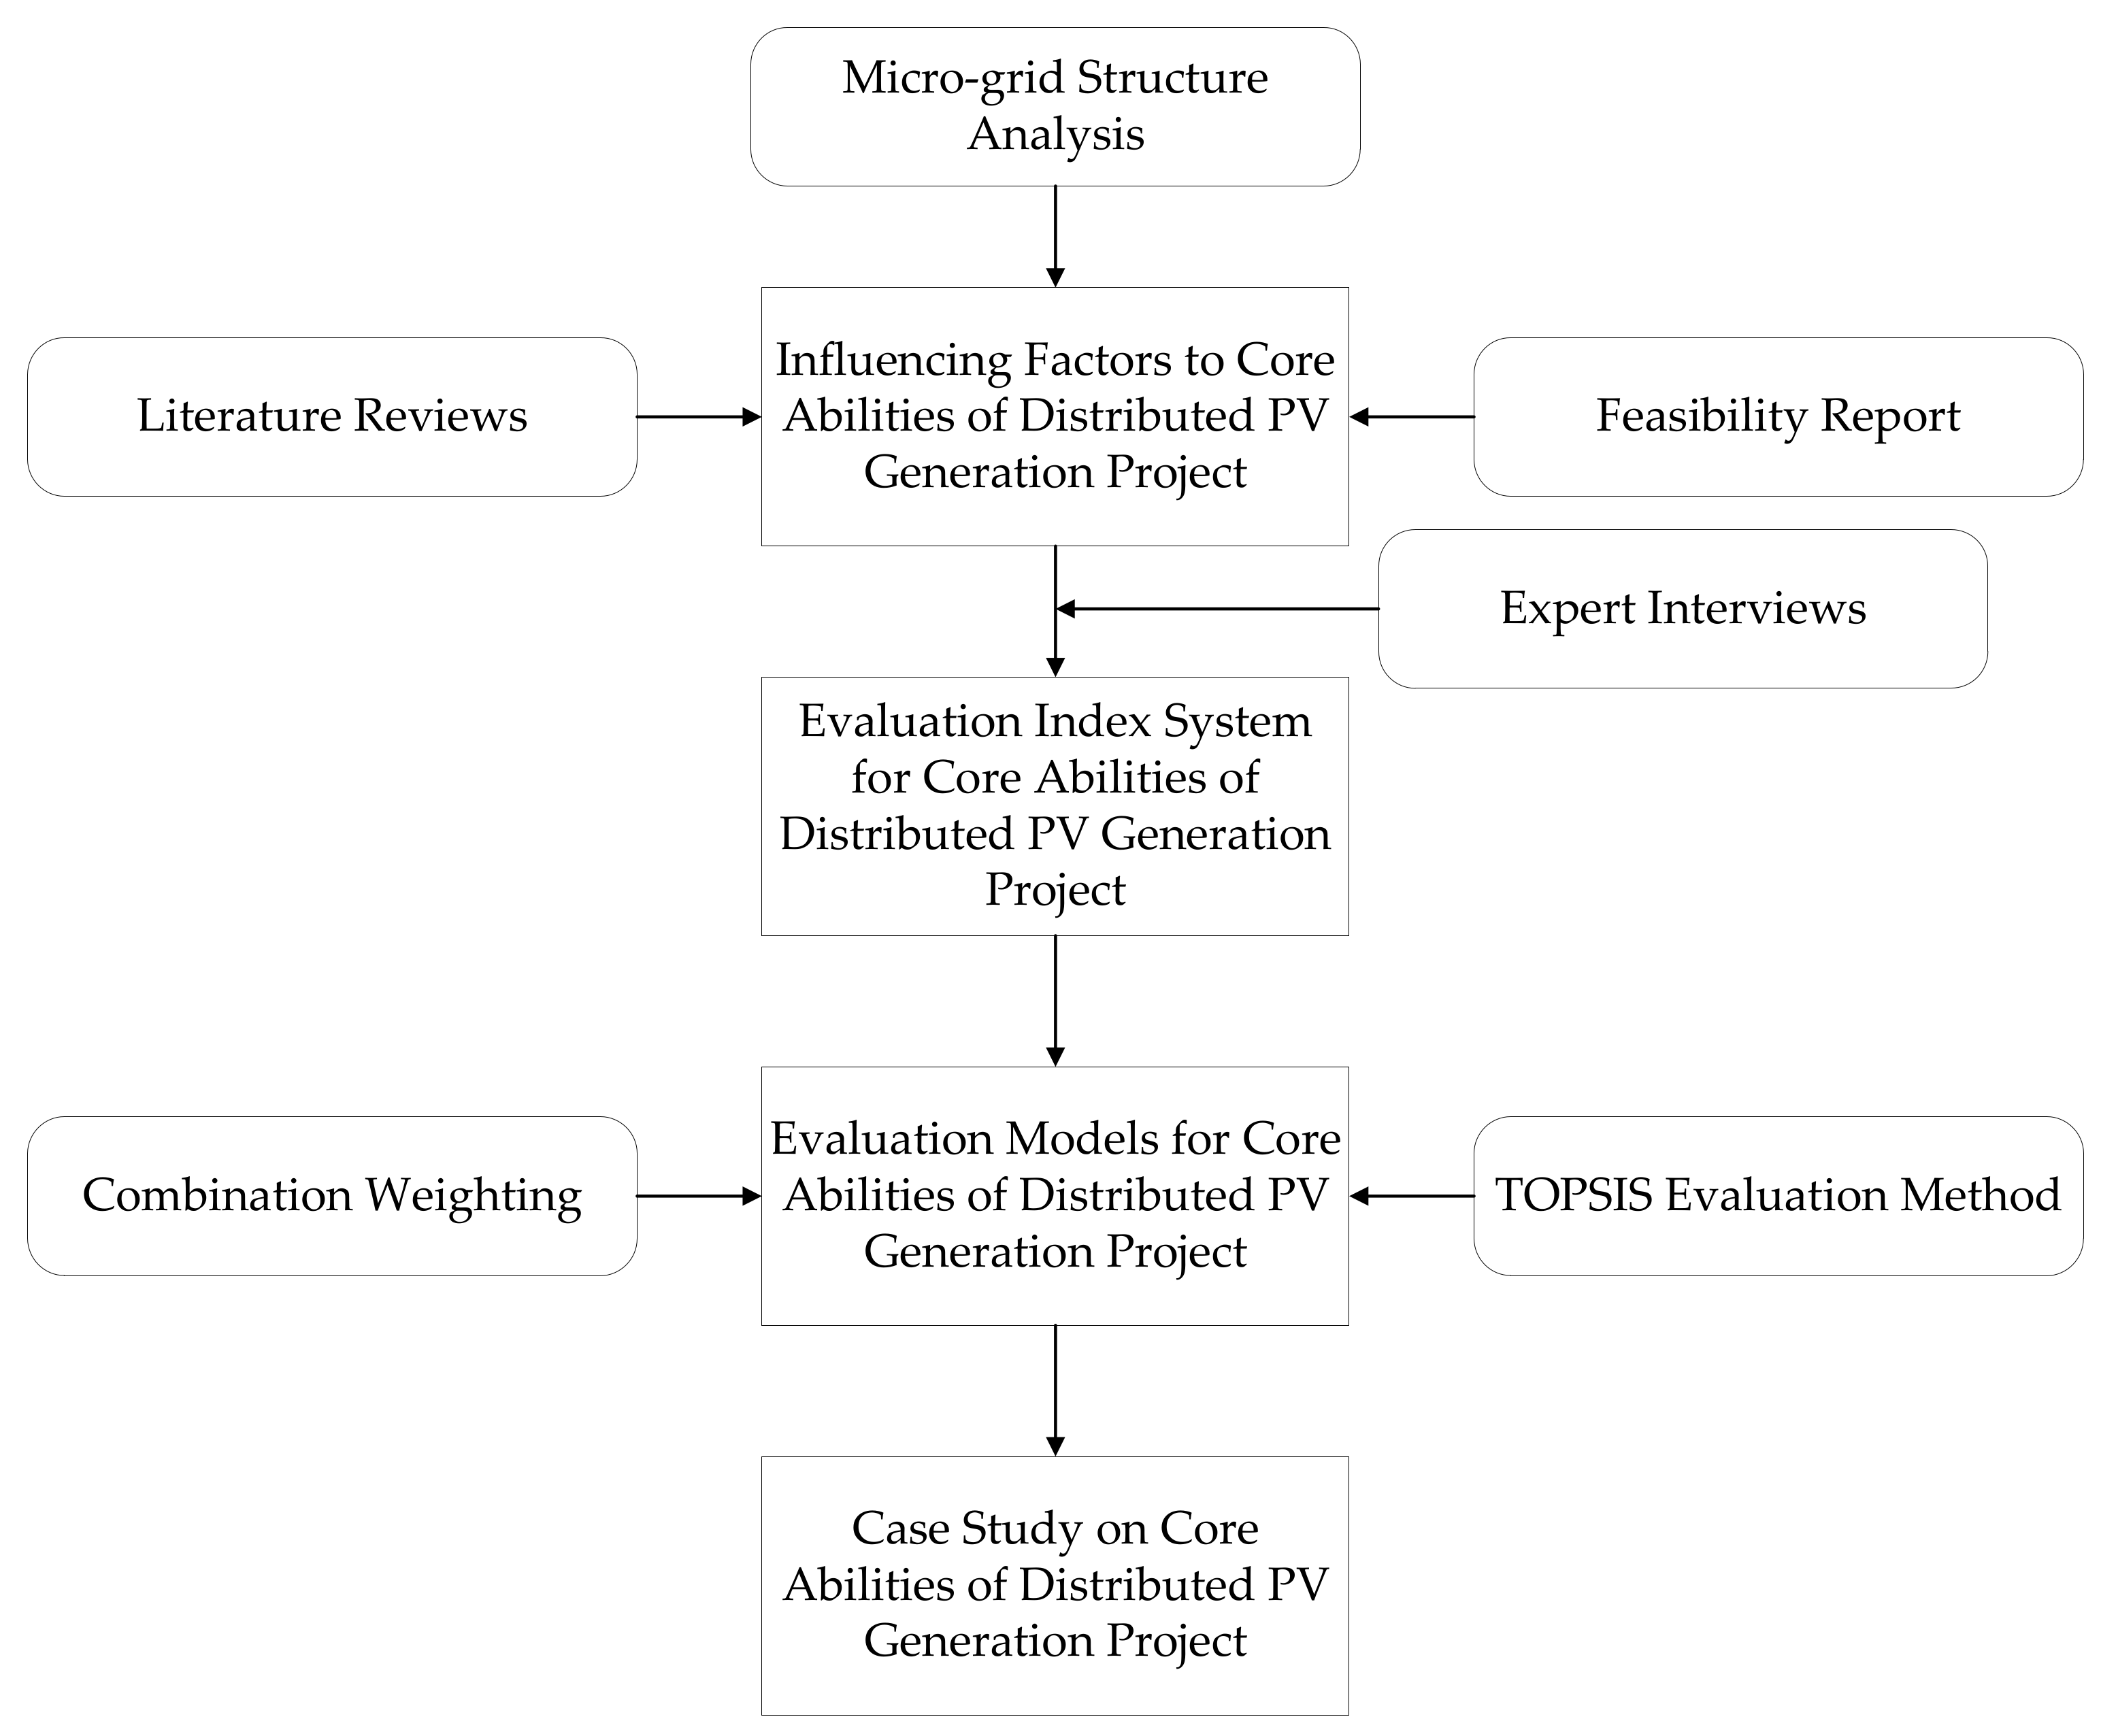
2. Methodology
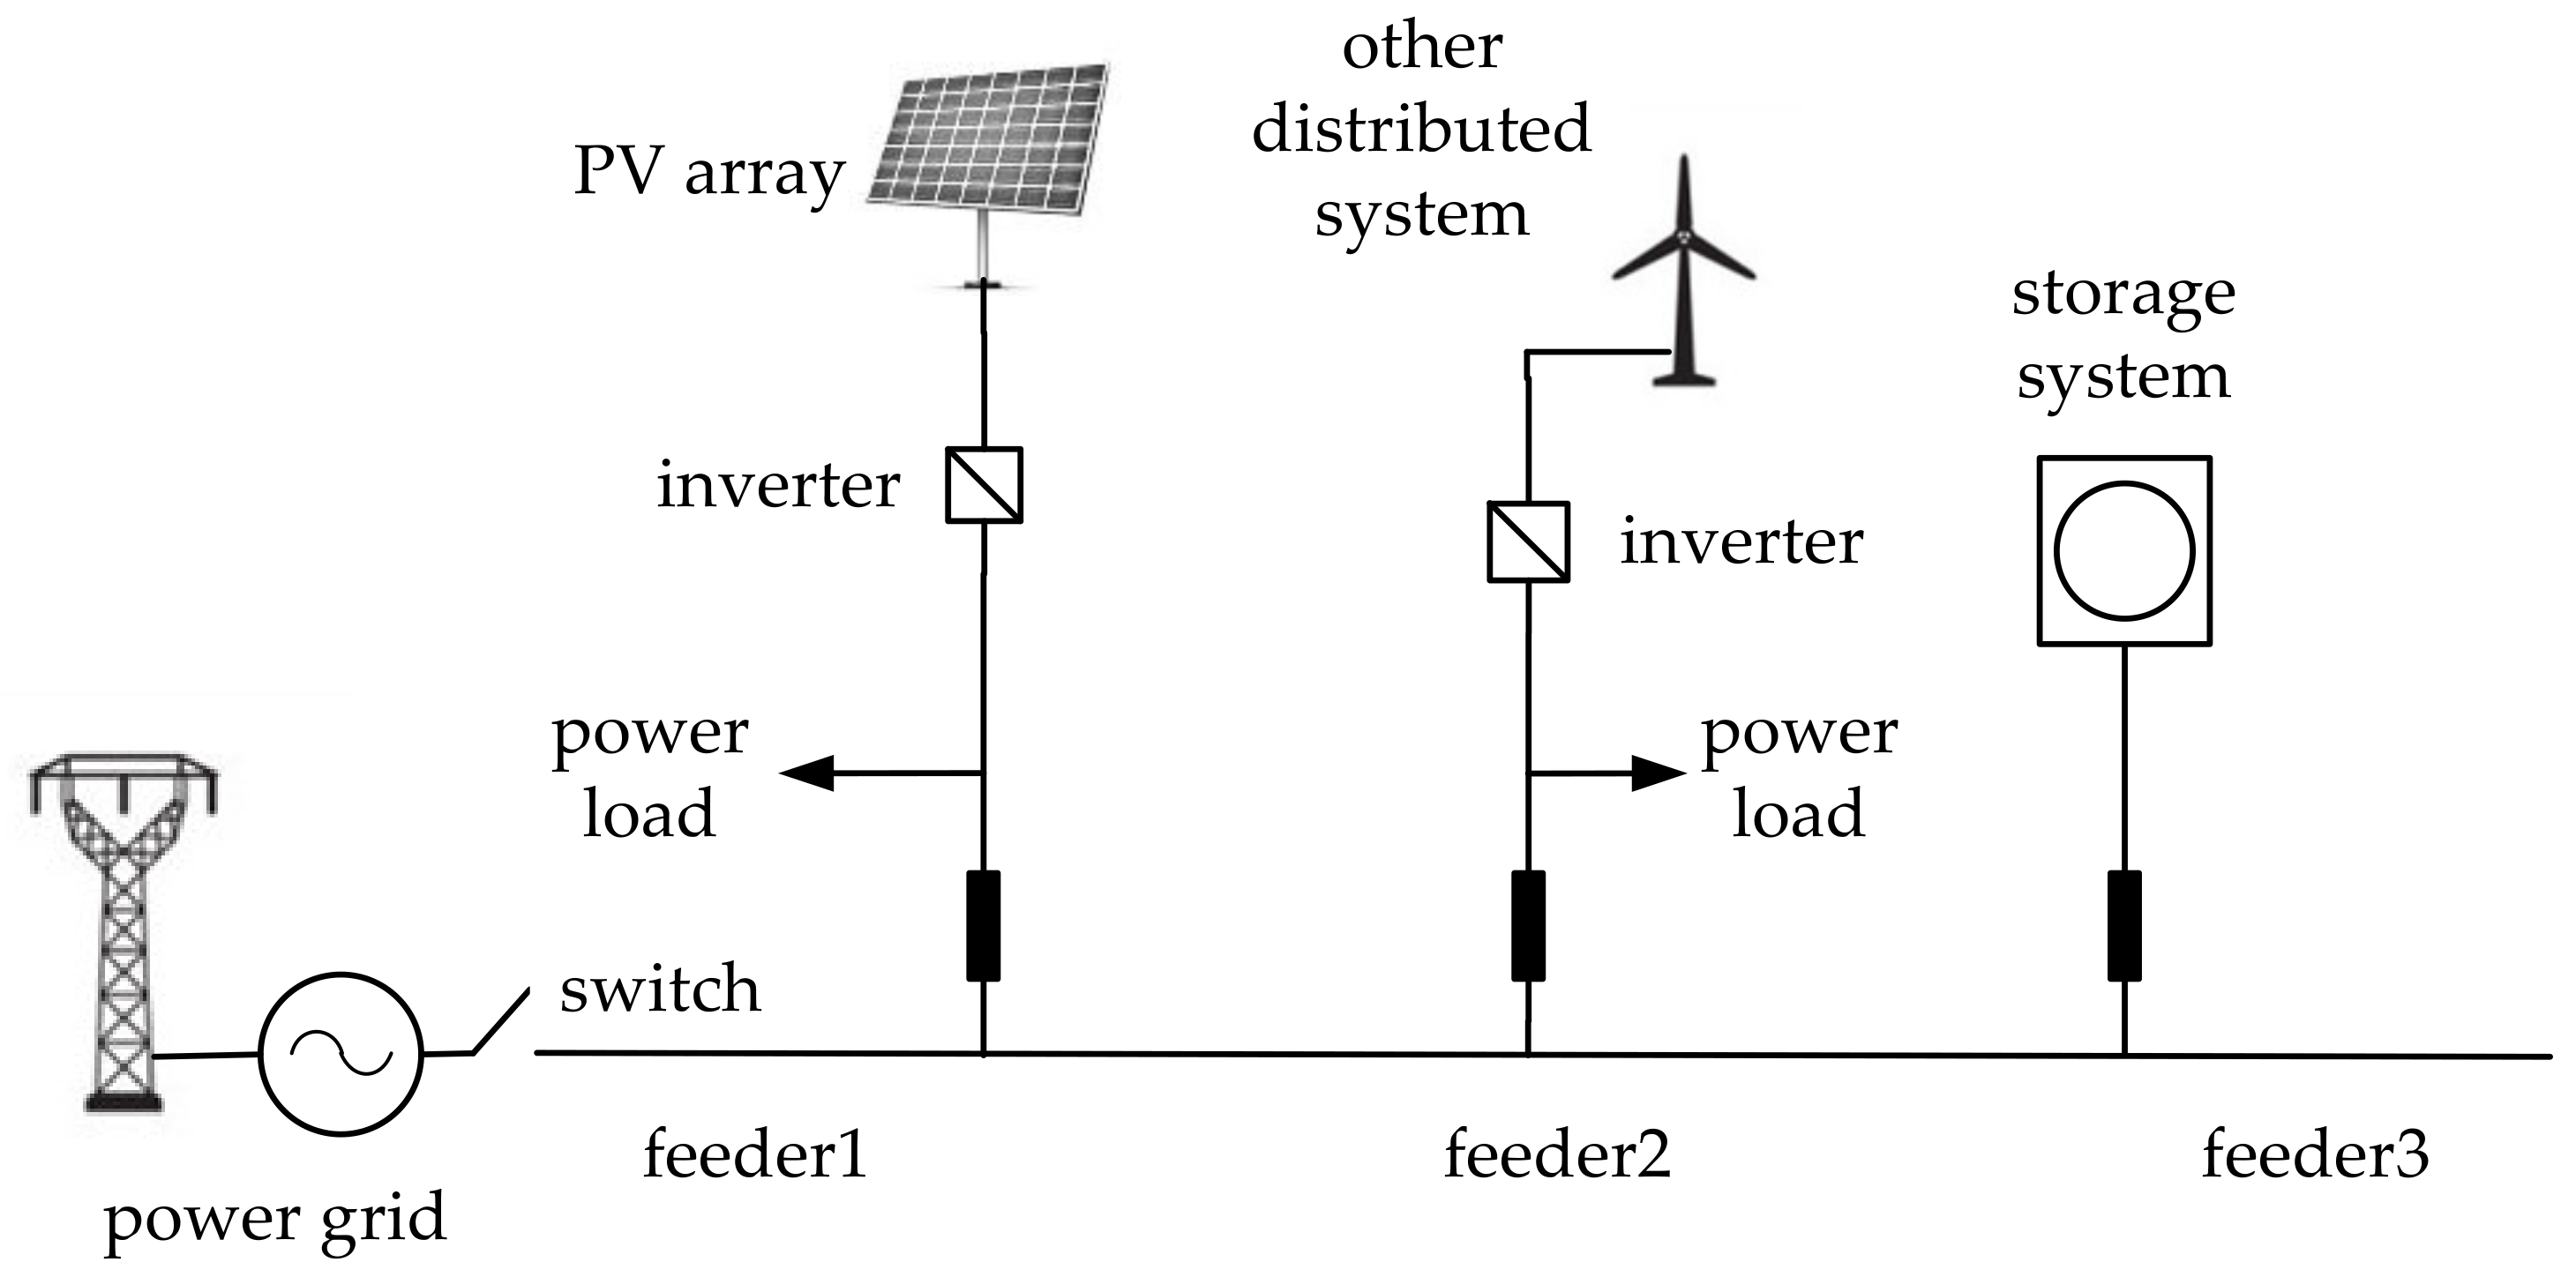
2.1. Micro-Grid Structure Analysis
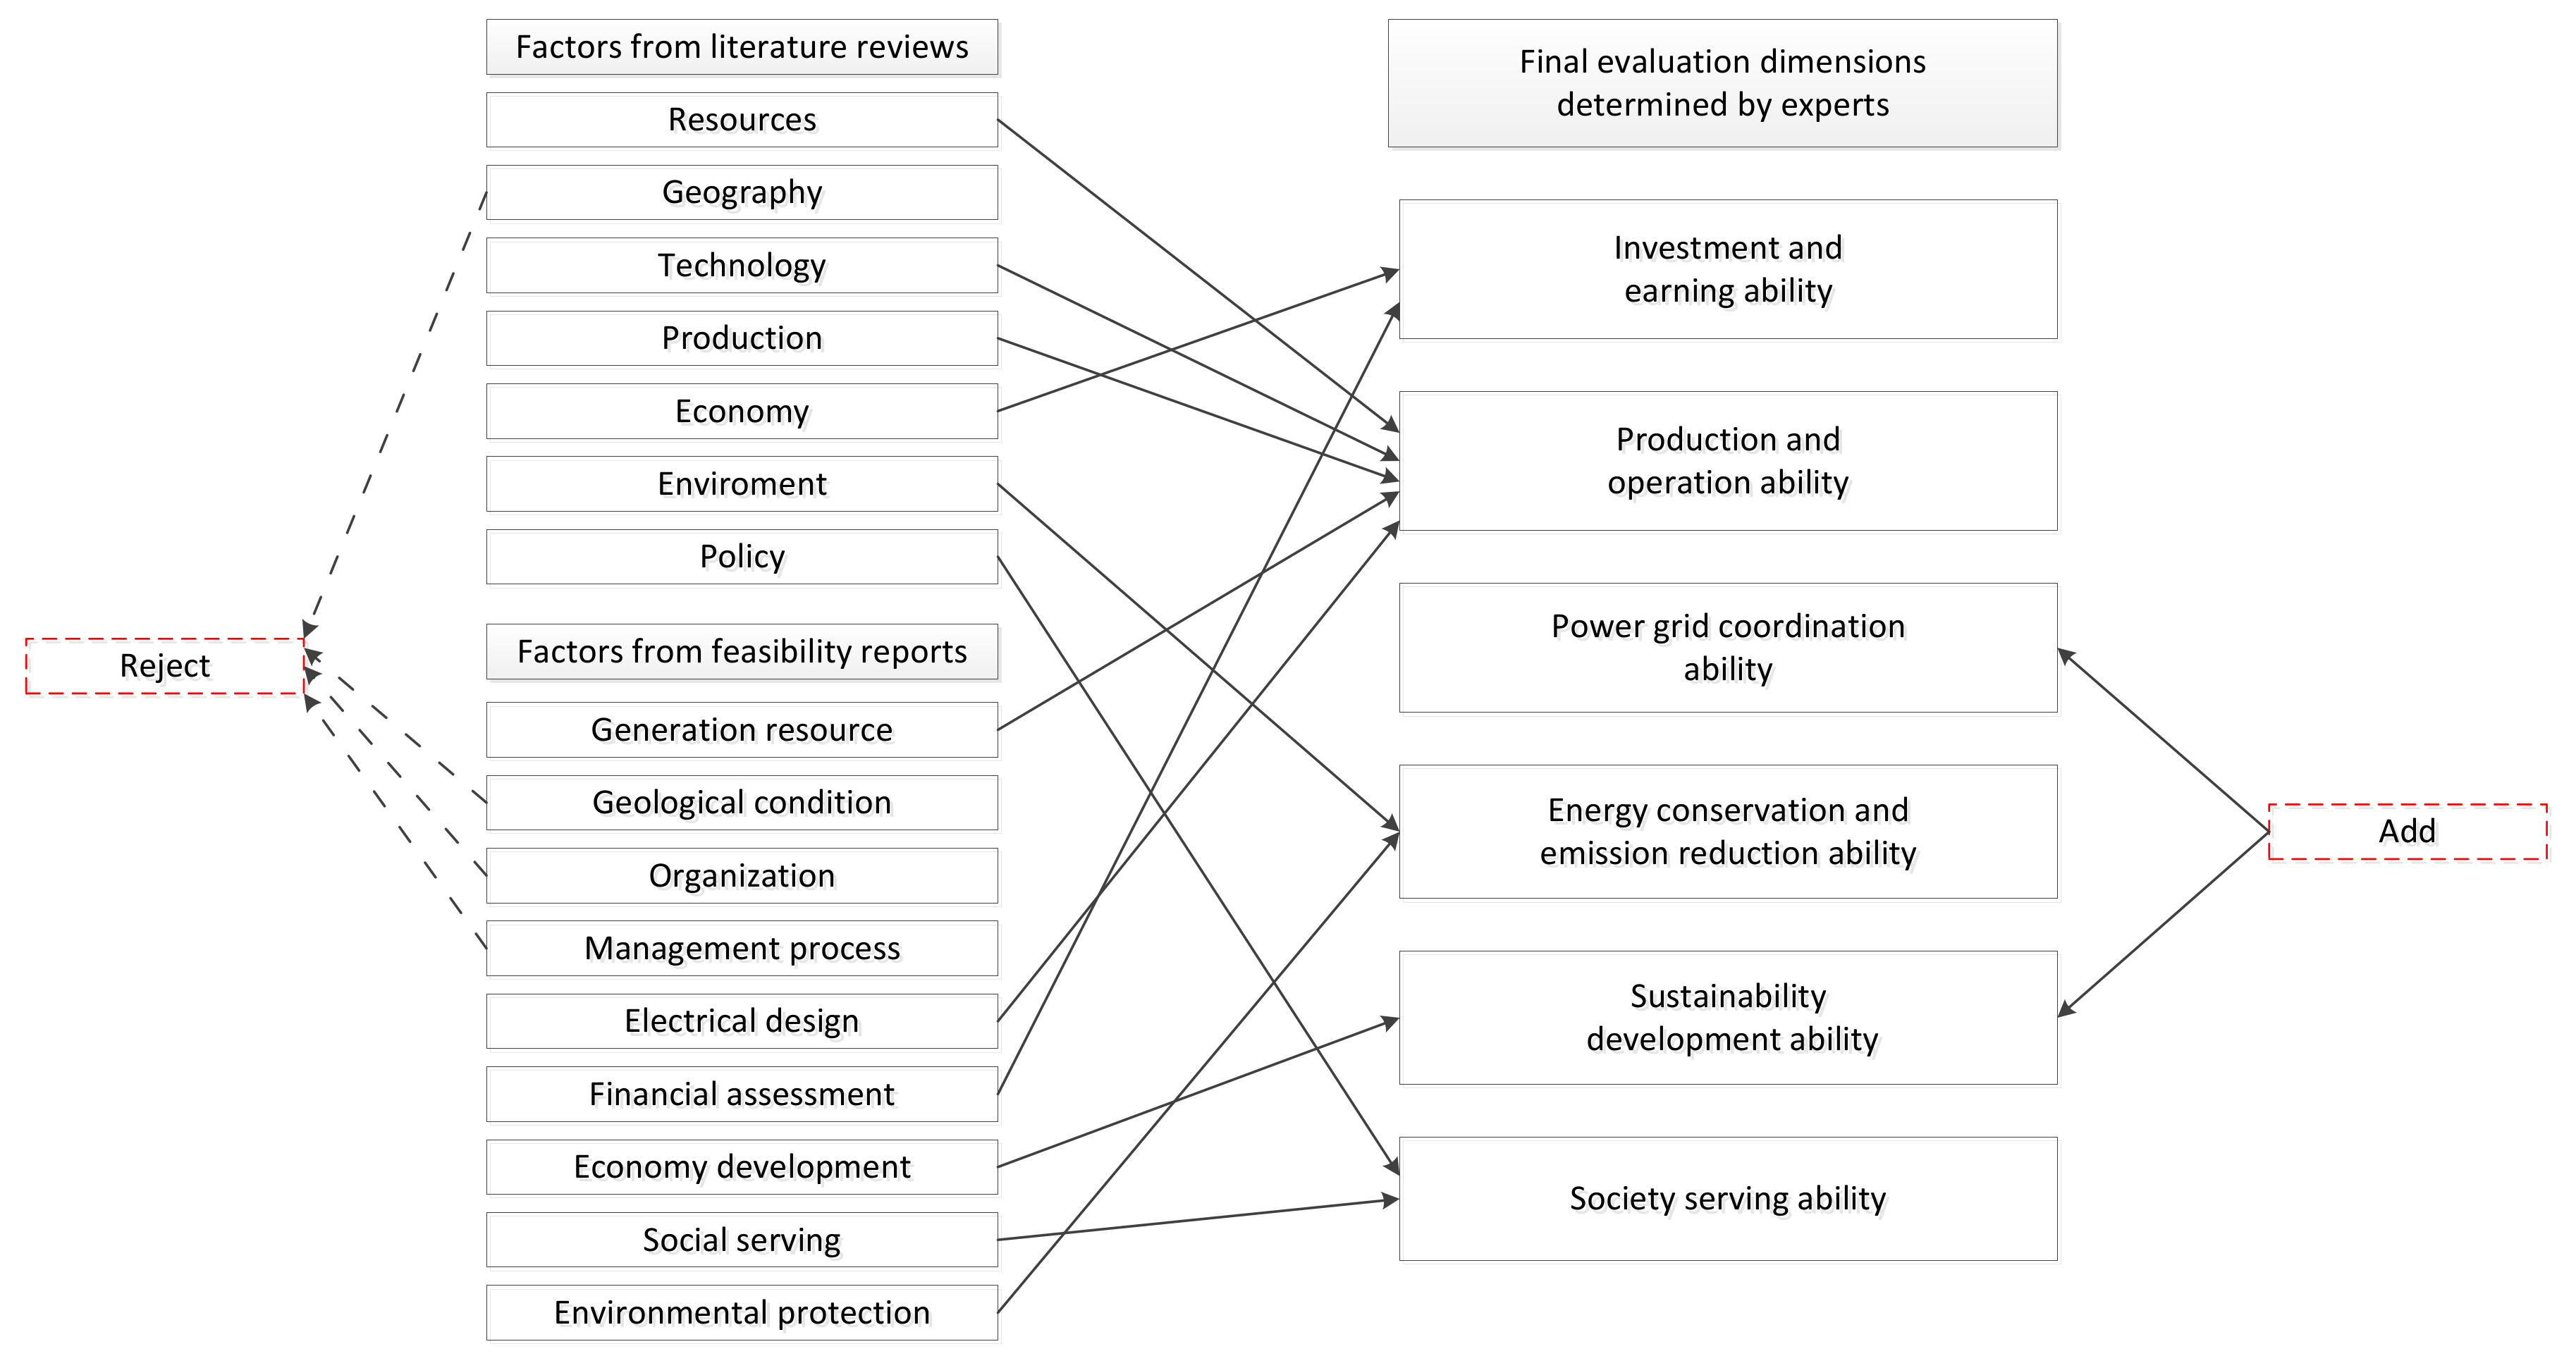
2.2. Literature Reviews
2.3. Feasibility Report Analysis
2.4. Expert Interviews
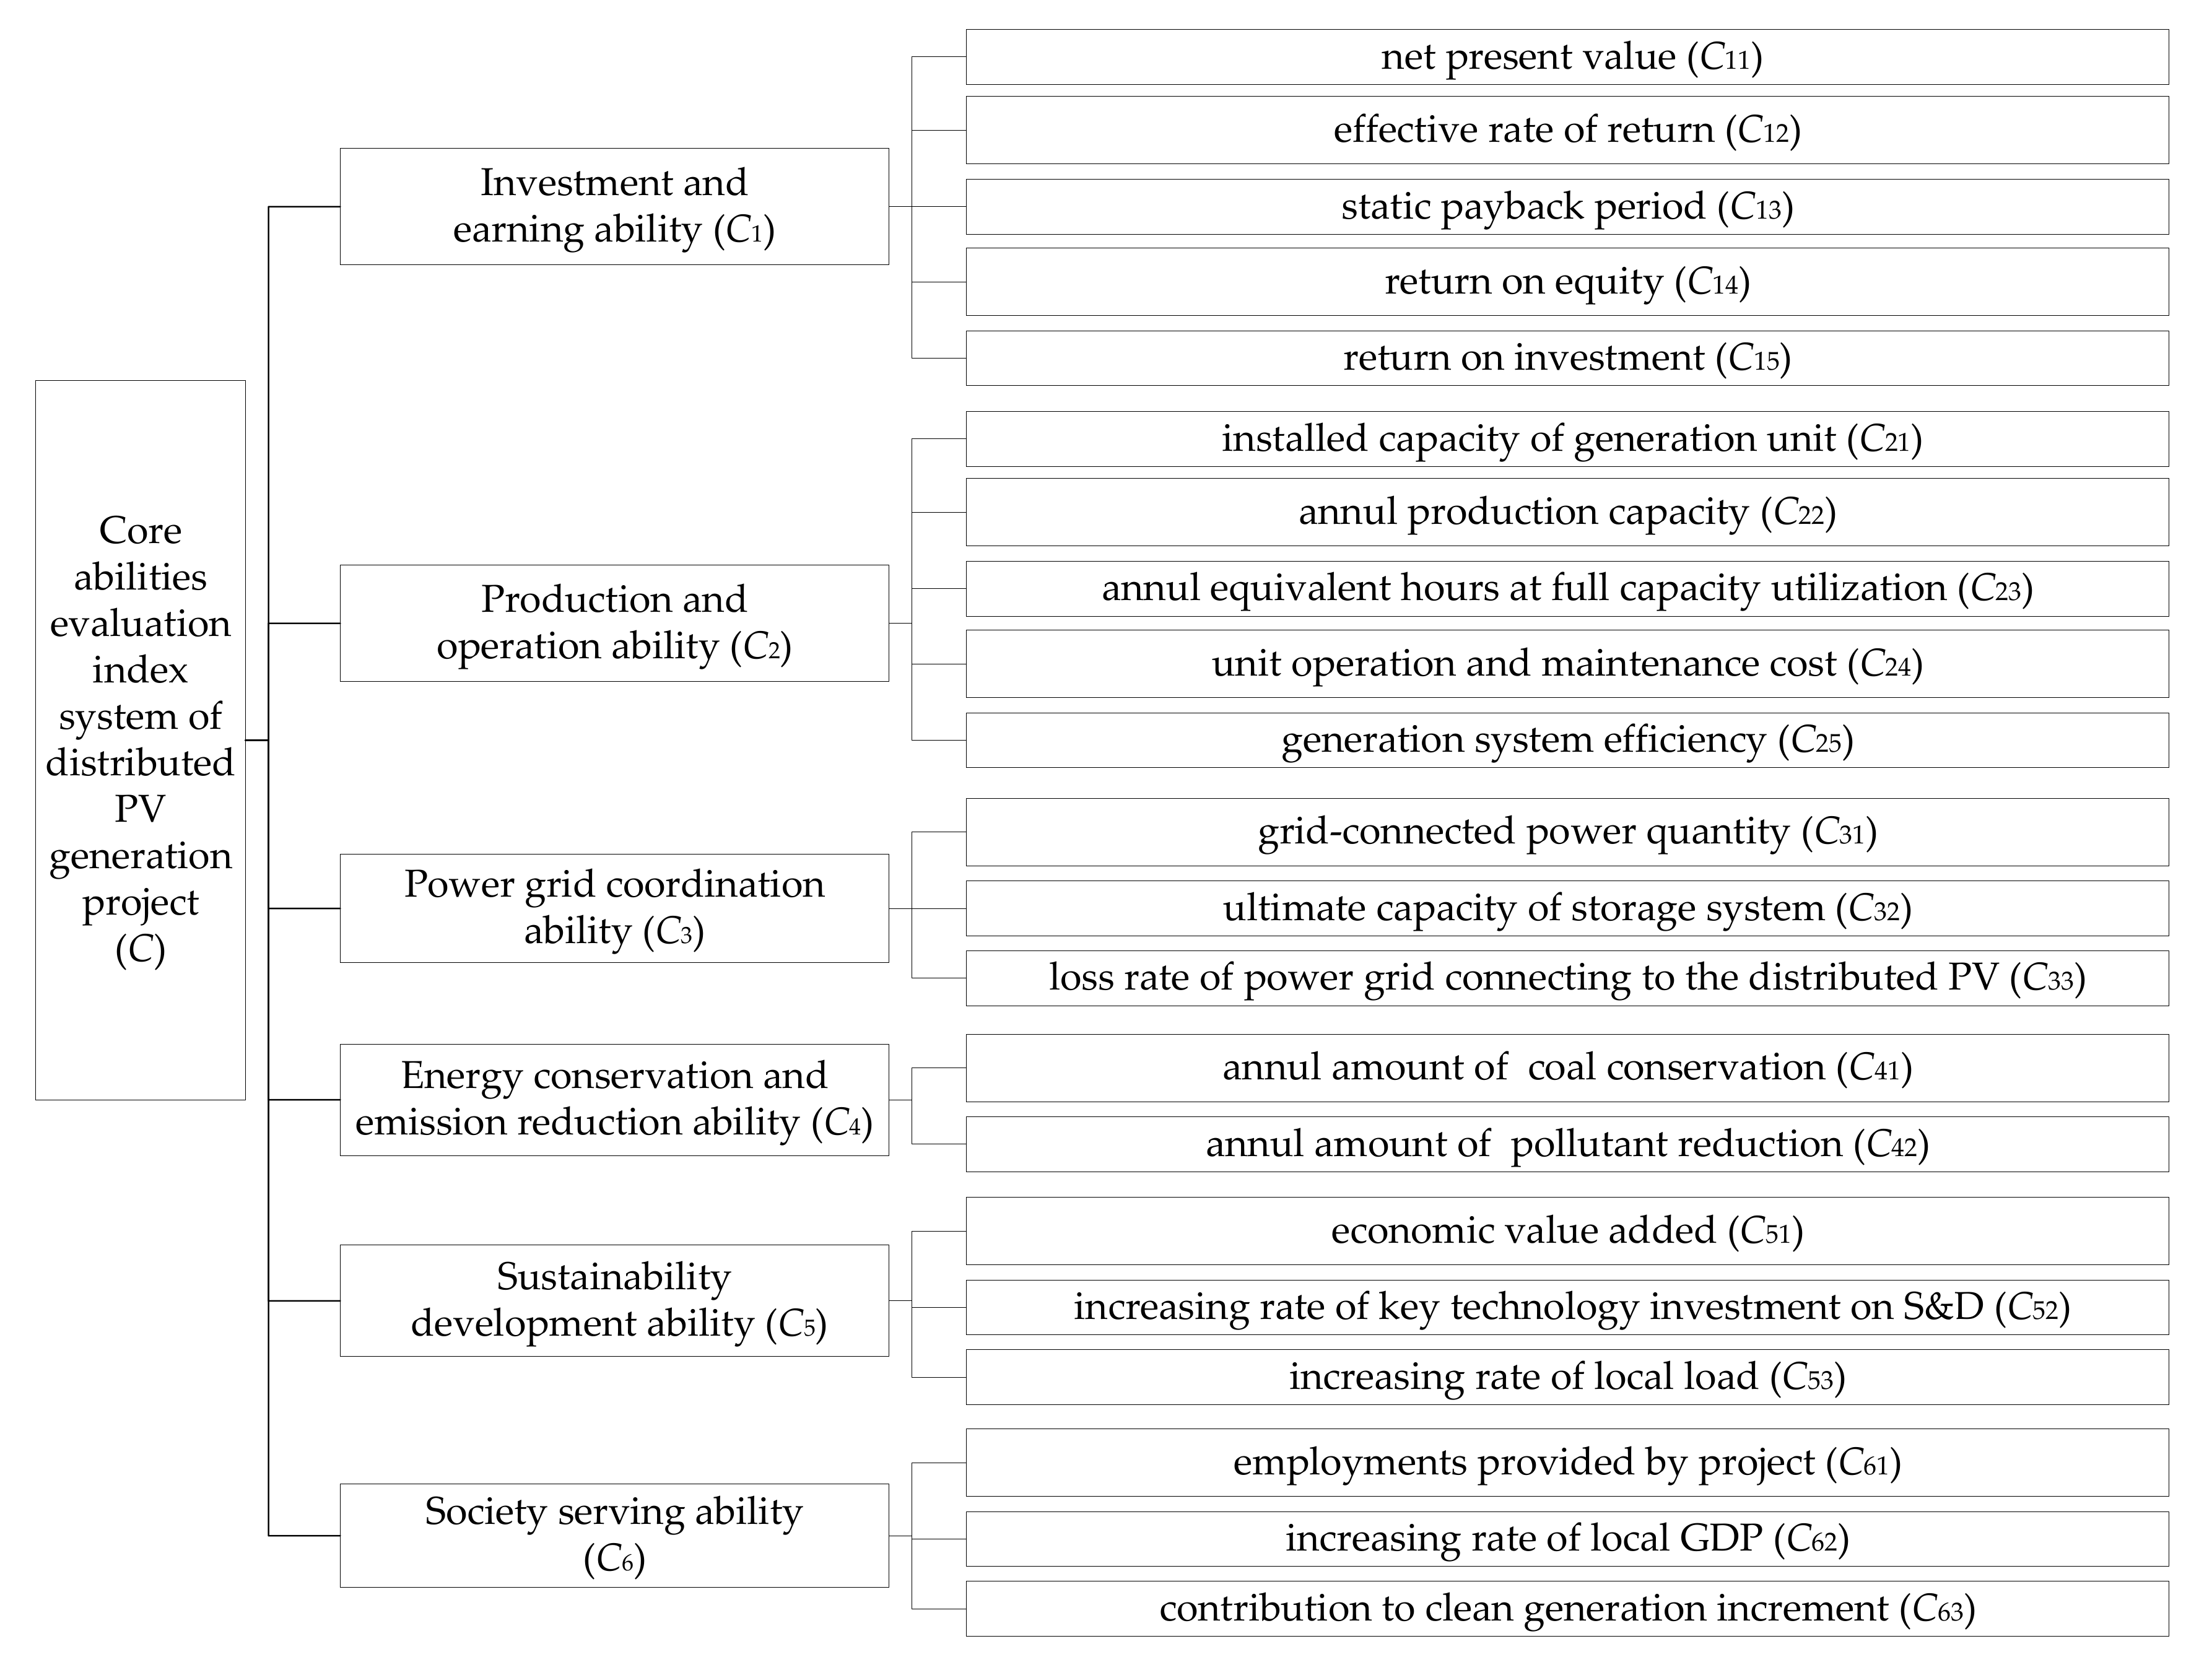
3. Evaluation Index System for Core Abilities of Distributed PV-Generation Projects
3.1. Investment and Earning Ability
- (1)
- Net present value (NPV). NPV is a basic economic indicator to describe the project’s profit during the construction and operation period. It is the sum of differentials between cash inflows and outflows in every year. It can be calculated by Equation (1).In Equation (1), CI stands for the annual cash inflow; CO is the annual cash outflow; t represents the construction and operation period and i0 is the basic discount rate.
- (2)
- Effective rate of return. Compared with internal rate of return (IRR), the rationality of the effective rate of return can be determined. When effective rate of return is bigger than internal rate of return, this means the effective rate of return is acceptable and valuable. IRR can be calculated by Equation (2).In Equation (2), IRR is the rate of return which makes the net cash flows zero. IRR can be also named as expected rate of return. As it is greater than IRR, NPV is better.
- (3)
- Static payback period (T). T stands for the return ability of investment. If T is smaller, the ability is better. A static payback period can be calculated via Equation (3).In Equation (3), stands for the year t when the accumulative net flows are more than 0 for the first time. is the absolute value of net cash flow in the year t − 1, and is the net cash flow in the year t. In general, T should be shorter than the T0 calculated by basic discount rate i0.
- (4)
- Return on equity (ROE). ROE stands for the earning ability of equity. It can be measured through Equation (4).where NP stands for net profits, ANW is the average net worth.
- (5)
- Return on investment (ROI). ROI equals pre-tax profits divided by total investment. The calculation method is shown in Equation (5).where PP stands for pre-tax profit, TI is the total investment.
3.2. Production and Operation Ability
- (1)
- Installed capacity of generation unit (IC). The data of installed capacity of a generation unit can be obtained from the production report directly.
- (2)
- Annual production capacity (APC). Similar to IC, the data of annual production capacity can also be obtained from the production report directly.
- (3)
- Annual equivalent hours at capacity utilization (H). H is used to check system production hours at full power level. It can be calculated via Equation (6).where TG stands for the unit total generation, and RC stands for the rated capacity.
- (4)
- Unit operation and maintenance cost (UC). UC is the significant expenditure in the production and operation process. It is a comprehensive indicator to reflect the production and operation ability of distributed PV-generation projects. It can be calculated via Equation (7).where AOM is the annul operation and maintenance cost, and APC stands for the annual production capacity.
- (5)
- Generation system efficiency (E). E reflects the resource utilization efficiency of the generation unit through energy input and output. The measurement is shown in Equation (8).where UEO is the unit energy output, and REI stands for the resource energy input.
3.3. Power-Grid Coordination Ability
- (1)
- Grid-connected power quantity (GPP). GPP shows the acceptable ability of the power grid to distribute PV power. It will have critical effects on distributed PV generation. The data can be obtained from the statistics of both distributed PV operators and power grid companies.
- (2)
- Ultimate capacity of storage system. This indicator is determined by the design capacity of the storage system. It should consider both the technical and economic factors of distributed power production.
- (3)
- Loss rate of power grid connecting to the distributed PV power. When distributed PV power is connected to the local power grid, it will influence the stability and power scheduling of the grid, especially the loss rate of the grid in transmission and distribution. So the loss rate can examine the distributed PV-generation project’s relationship with a local power grid. The data can be adopted from the statistics of the grid company.
3.4. Energy Conservation and Emission-Reduction Ability
- (1)
- Annual amount of coal conservation. Due to renewable and clean energy input, the production of a distributed PV-generation project can save coal consumption. It is a basic indicator of the energy=conservation ability of distributed PV-generation projects. It can be measured through generation amount.
- (2)
- Annual amount of pollutant reduction. Thermal power generations discharge CO2, SOX, NOX, smoke, dust and ash which are serious problems for the local environment. The substitution of a distributed PV-generation project for a thermal power plant can solve the pollution and emission problems effectively.
3.5. Sustainable Development Ability
- (1)
- Economic value added (EVA). EVA is a common indicator for examining an enterprise’s financial benefit used widely in the evaluation of power-generation projects. EVA is also the basis and core of a value-management system. For the distributed PV-generation project, adopting EVA can help managers to understand its sustainable development ability well. It can be assessed via Equation (9).where NPTA stands for the net profit after tax, CC is the capital cost of a distributed PV-generation project.
- (2)
- Increasing rate of key technology investment on sustainability and development (S&D) (TIR). TIR is set to reflect the technology S&D investment of the distributed PV-generation project and its operators. It is a relative value, as shown in Equation (10).In Equation (10), ti stands for the annual technology investment.
- (3)
- Increasing rate of local load (LIR). LIR can reflect the development potential of distributed generation power. The faster the local load increases, the more generation space the distributed PV-generation project has. It can be calculated via Equation (11).In Equation (11), l stands for the annual local load.
3.6. Society-Serving Ability
- (1)
- Employment provided by the project. Employment provided by the project is a direct indicator to show the society-serving ability of distributed PV-generation projects.
- (2)
- Increasing rate of local GDP (GIR). If the local GDP grows fast, power demand must be large to support economic development. Thus, from the increasing GDP rate, an increasing potential of distributed PV-generation can be seen easily. The GIR can be calculated via Equation (12).
- (3)
- Contributions to clean-generation increment (CCGI). In order to optimize the energy structure, renewable and clean energy is widely used in power generation. For testing the generation contributions of distributed PV projects, CCGI is used to assess the increment ratio of renewable generation produced by distributed PV projects. The calculation of CCGI is shown in Equation (13).where PVt stands for the PV project generation in year t, and CGE is the total generation of clean energy in this power supply area.
4. Evaluation Models for Distributed PV Project
4.1. Combination Weighting Method
- (1)
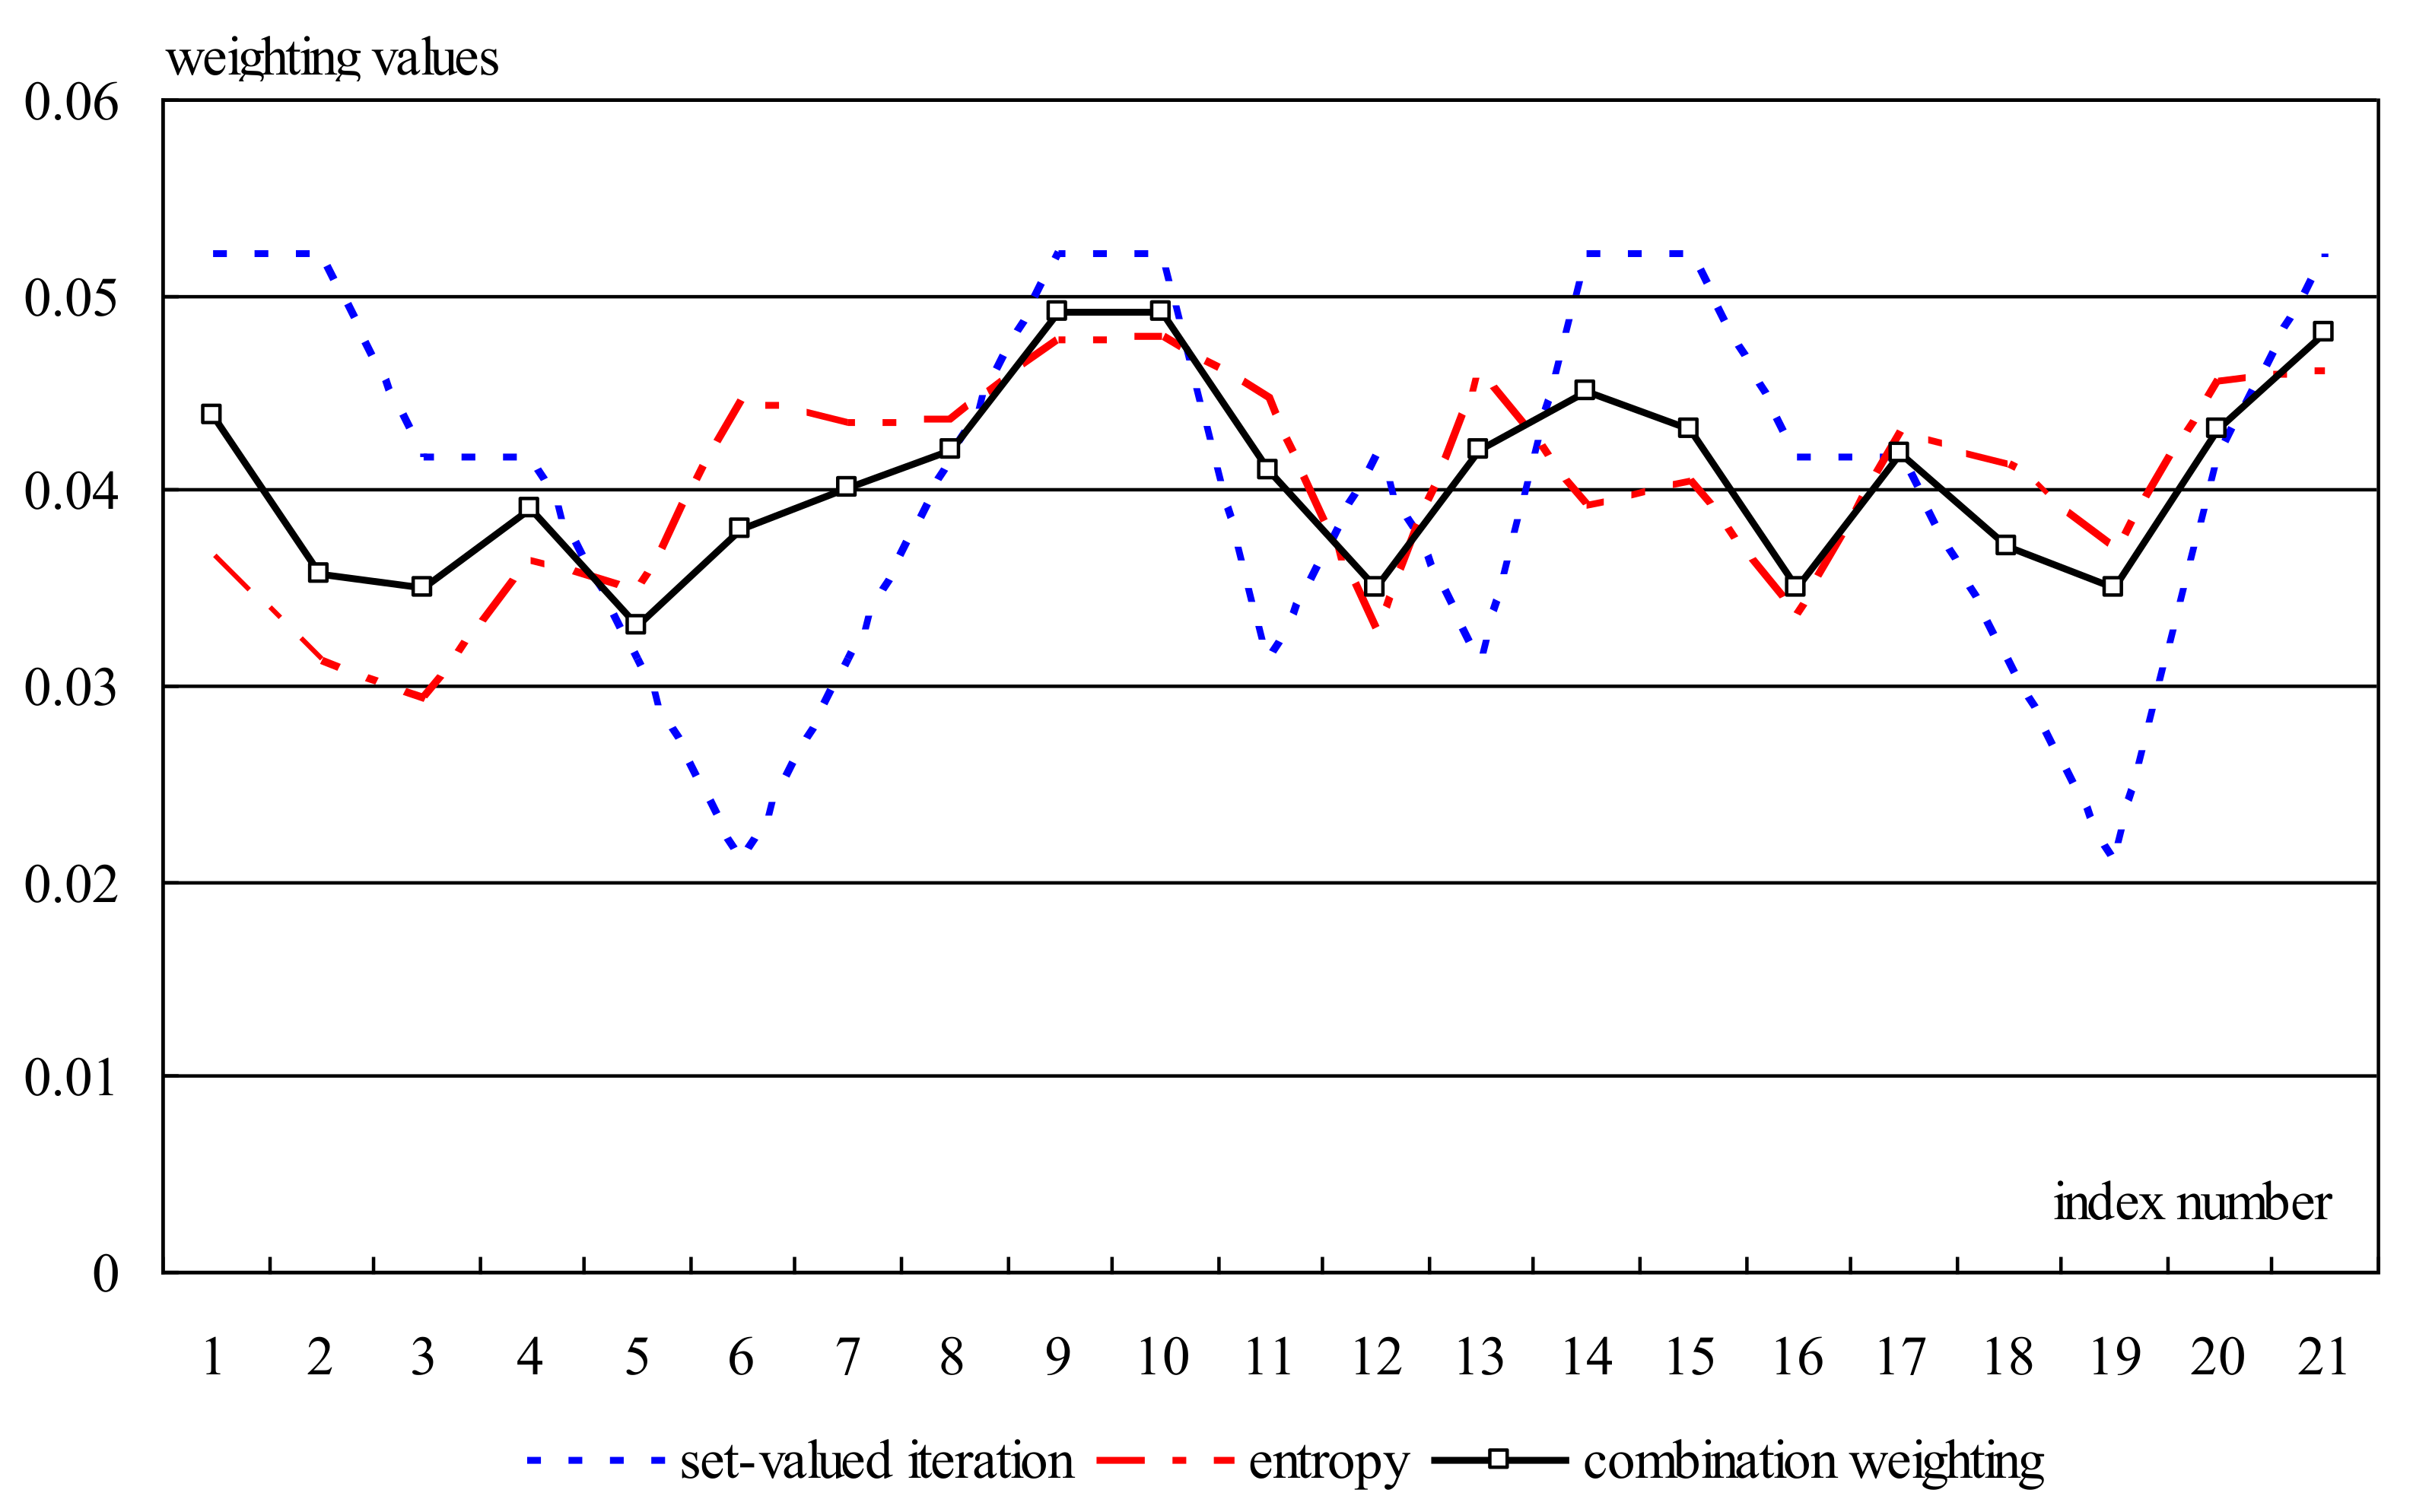
- Assuming that there are n indexes in the evaluation system, the weighting results of the set-valued iteration method and entropy methods are set as T = {t1, t2, …, tn} and S = {s1, s2, …, sn} respectively. The set of combination weighting results is W = {w1, w2, …, wn}.
- (2)
- If the relative importance degree of T to W is , and the relative importance degree of S to W is , the objective function of W can be described as Equation (14).
4.2. Technique for Order Preference by Similarity to an Ideal Solution (TOPSIS) Evaluation Method
- (1)
- Matrix construction of multi-objective decision (R). Assume that C = {C1, C2, …, Cm} is the solution set of objective problems and X = {x1, x2, …, xn} is the index set, the evaluation value of X to C is rij (i = 1, 2, …, m; j = 1, 2, …, n). Then, the matrix R can be represented as Equation (19).
- (2)
- Positive and negative ideal point setting. Combining this with the weighting result W, the decision matrix Z = (zij)m×n can be calculated with R. From the decision matrix, the positive and negative ideal points can be set as and which can be measured via Equation (20).
- (3)
- Distance calculation of solution to ideal point. Set and as positive ideal point and negative ideal point respectively, the calculation method is shown in Equation (21).
- (4)
- Evaluation result ranking. According to the evaluation results, the solutions can be ranked by their distances to the negative ideal point. The solution values can be calculated via Equation (22).
5. Case Study
5.1. Project Selection
- (1)
- Project A. Distributed PV-generation project A is constructed for a coalfield in north-western China. Its construction capacity is 6.27 MWp, which consists of 6 generation units. The project is nearby a 35 kV substation in the coalfield area. The generation from this distributed PV-generation project is all used by the coalfield. The operation period is set as 20 years with 171.61 GWh total generation amounts. The annul generation is 8.58 GWh. The annual equivalent generation hours are 1368.08. Total investments are 47.75 million yuan.
- (2)
- Project B. Distributed PV-generation project B is located in a tourist area in northern China. This project is near a 35 kV substation and consists of 36,237 PV components. All generation power is consumed by the tourist area, which will work for 25 years. The total generation amounts are 459.23 GWh. The annual generations is 18.35 GWh. The annual equivalent generation hours are 2362.31. Total investment is 128.1 million yuan.
- (3)
- Project C. Distributed PV-generation project C is a residential project with construction capacity of 1.6243 MWp in eastern China. 7062 PV generation components are installed on the roof. The generation system is directly connected to a 10 kV electrical circuit in the consumer side. In the 25-year operation period, its total generation amount is 60.88 GWh. The annual generation is 2.43 GWh. The annual equivalent generation hours are 1123.85. The total investment is 32.83 million yuan.
5.2. Weighting Result Analysis
5.3. Evaluation Result Analysis
- (1)
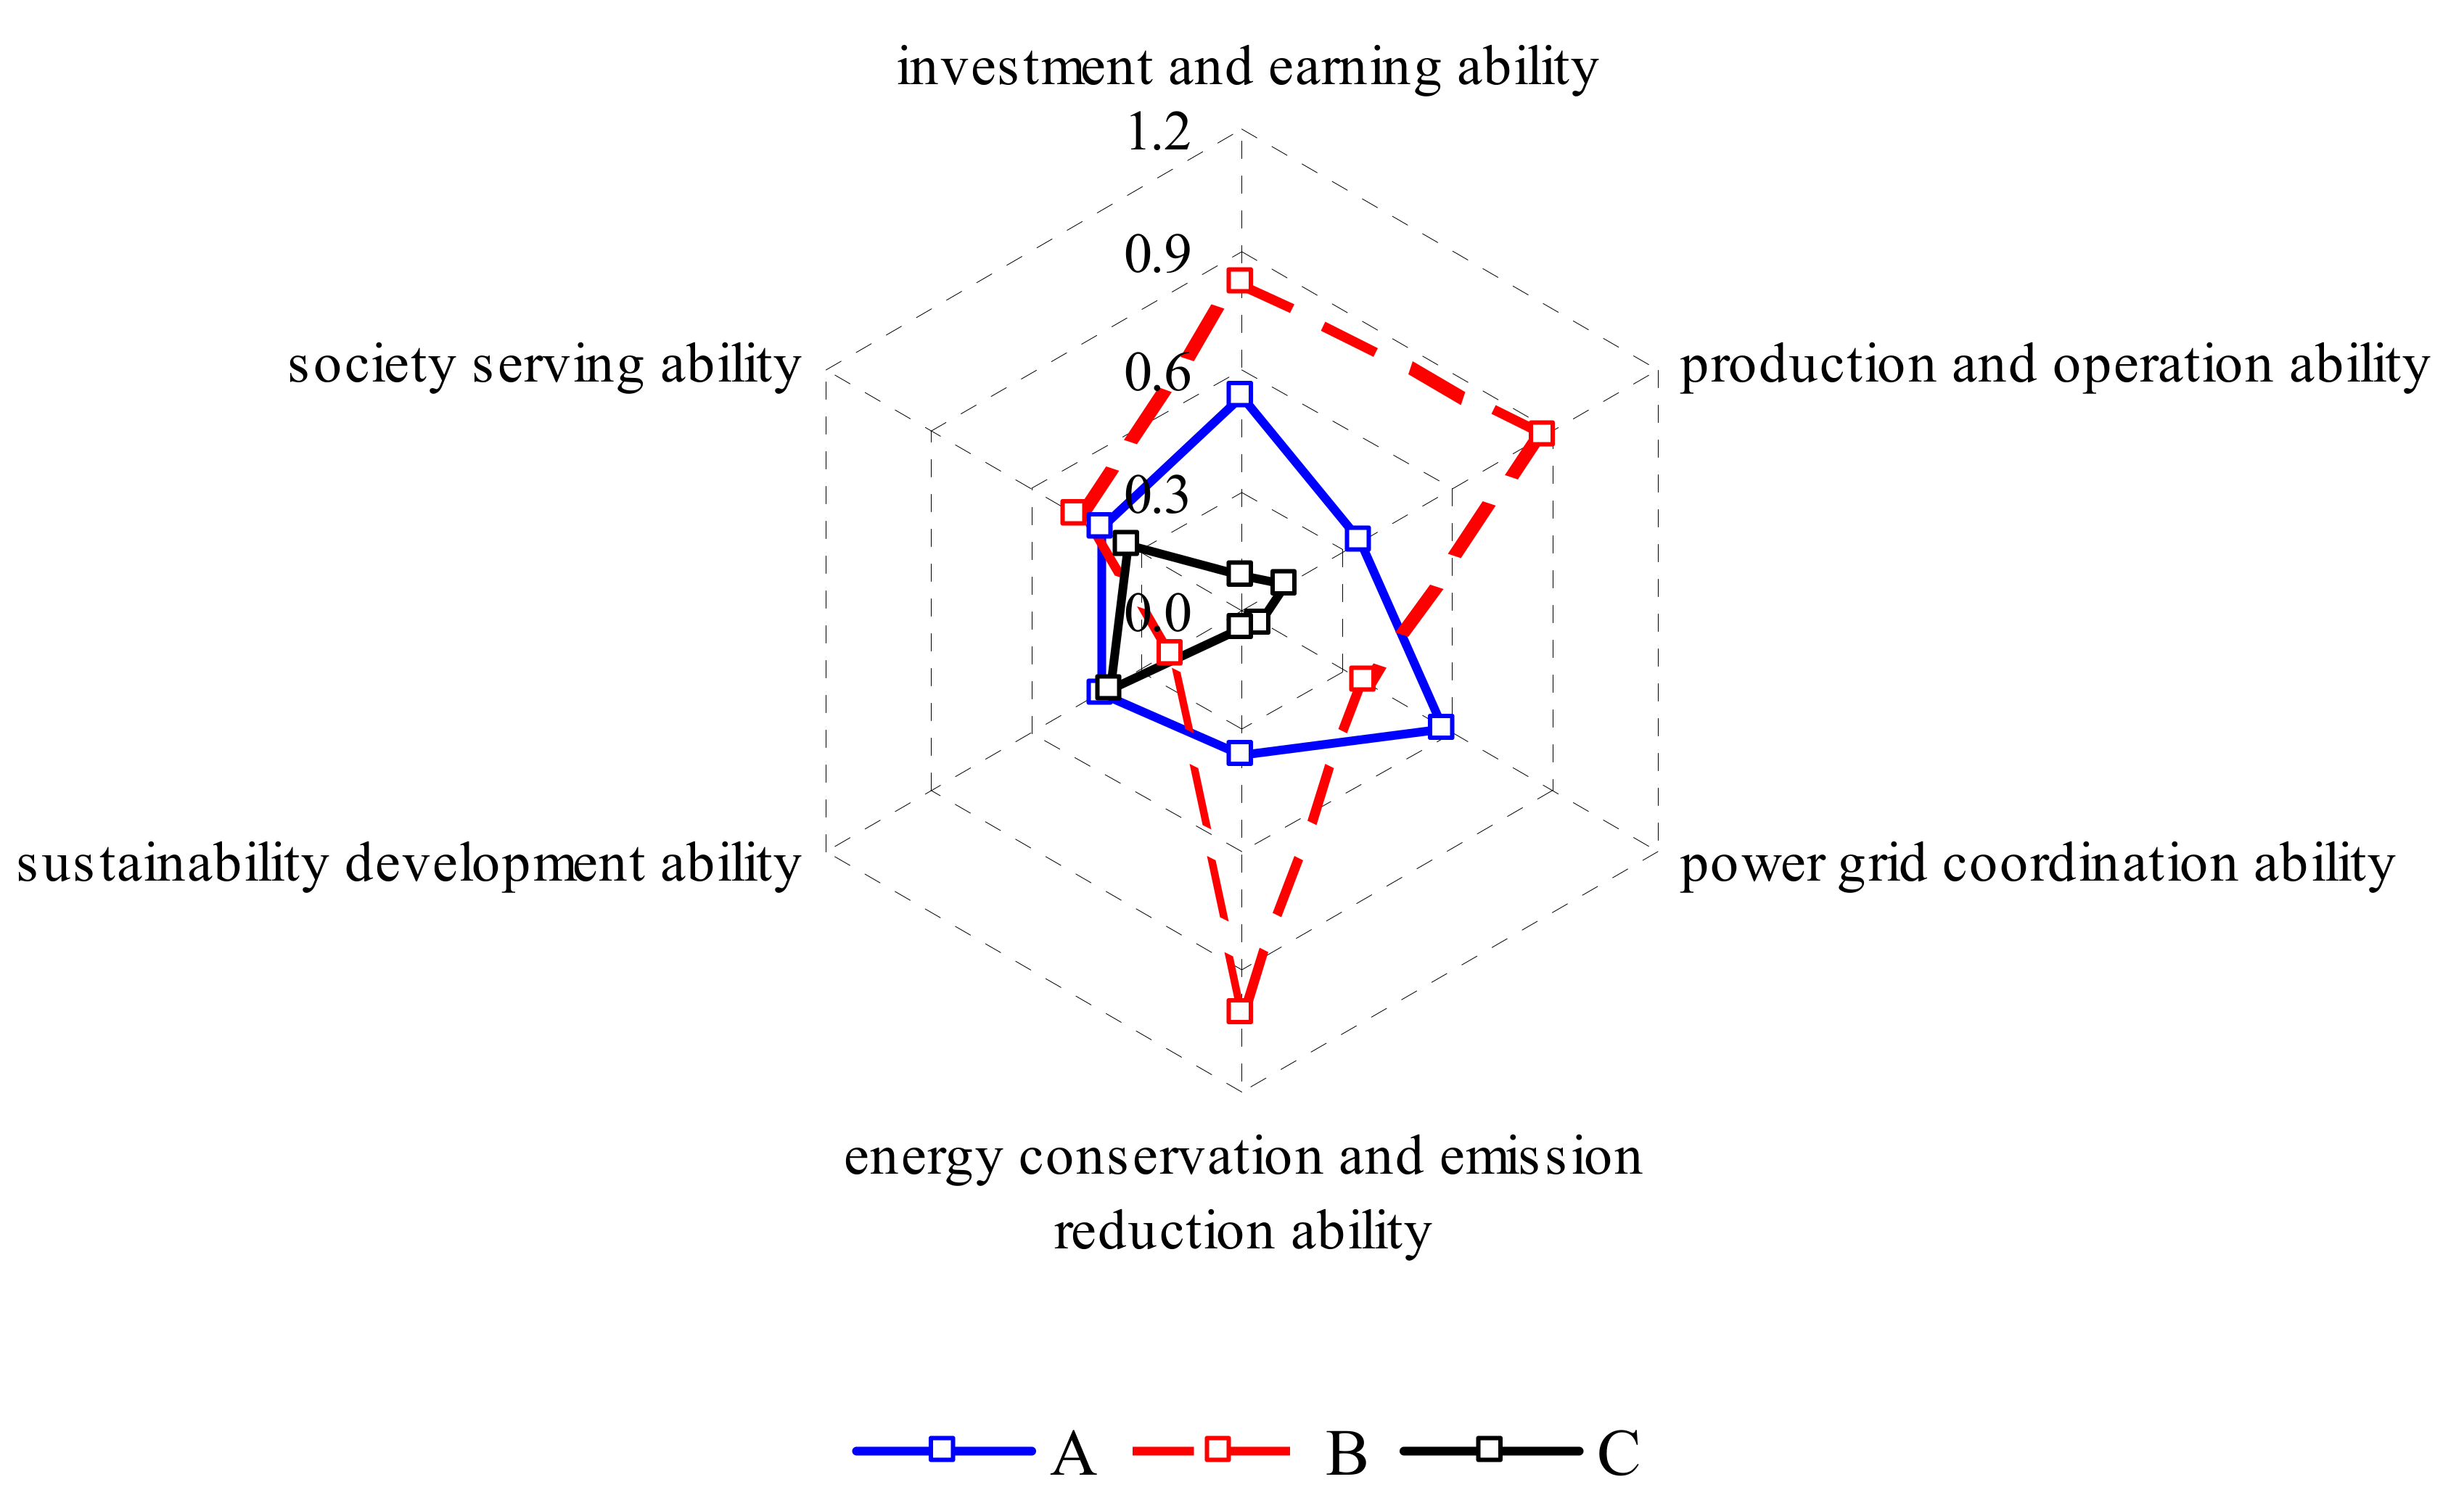
- Investment and earning ability. Influenced by installed capacity, project B has the best performance in investment and earning ability. From the indicators of effective rate of return and static payback period, the abilities of project A are better than that in the other two projects. Project C has an advantage in return on equity. The evaluation results of investment and earning ability in each project are 0.5317, 0.8149 and 0.0873, respectively.
- (2)
- Production and operation ability. From the evaluation conclusions, it can be found that the installed capacity with scale-production benefits has significant effects on production and operation ability. For example, the unit operation and maintenance cost of project B is just 0.018 yuan/kWh due to its largest installed capacity in these three projects. Meanwhile, rich resources also influence production and operation ability. At project A in north-western China, rich solar energy promotes the efficiency of the generation system up to 87%. The evaluation results of production and operation ability in projects A, B and C are 0.3398, 0.8732 and 0.1171, respectively.
- (3)
- Power grid coordination ability. Based on the investigation in the feasibility report, power grid coordination ability is mainly determined by policy. In 2016, most of provinces in China developed a purchasing policy for renewable and clean generation power which improve the power supply structure. Due to its own electric power system, project A has better performance in terms of coordination ability on the aspects of grid-connected power quantity and loss rate of the power grid. Projects A, B and C’s evaluation results for power grid coordination ability are 0.5782, 0.3441 and 0.0519, respectively.
- (4)
- Energy-conservation and emission-reduction ability. Similar to production and operation ability, project B saves more coal and reduces more pollutant. The environmental effect on energy-conservation and emission-reduction in project B is obvious. On the contrary, project A and C did not yet demonstrate their best environmental benefit. The evaluation results of energy conservation and emission reduction are 0.3645, 0.9763 and 0.0450 in projects A, B and C, respectively.
- (5)
- Sustainable development ability. Project A has the best evaluation result in EVA that can amount to 14.3 million yuan annually. Meanwhile, project A also shows its competitiveness on the increasing rate of local load. With greater acceptance of renewable power to the power grid, the ratio of renewable energy in the power supply structure has increased stably. Due to the technology improvement in micro-grids in particular, the potential of distributed generation projects has grown even further. The evaluation results of each project in the sustainable development ability are 0.3999, 0.2123 and 0.3833.
- (6)
- Society-serving ability. Project A provides more employments than projects B and C. On the aspect of increasing rate of local GDP, location C has a better economic development environment which can promote the development of a distributed generation project. Project B generates more renewable energy for the local power supply increment. Therefore, the society-serving ability of project B has the best evaluation result among these three projects. The evaluation results of the society-serving ability are 0.4066, 0.4834 and 0.3234.
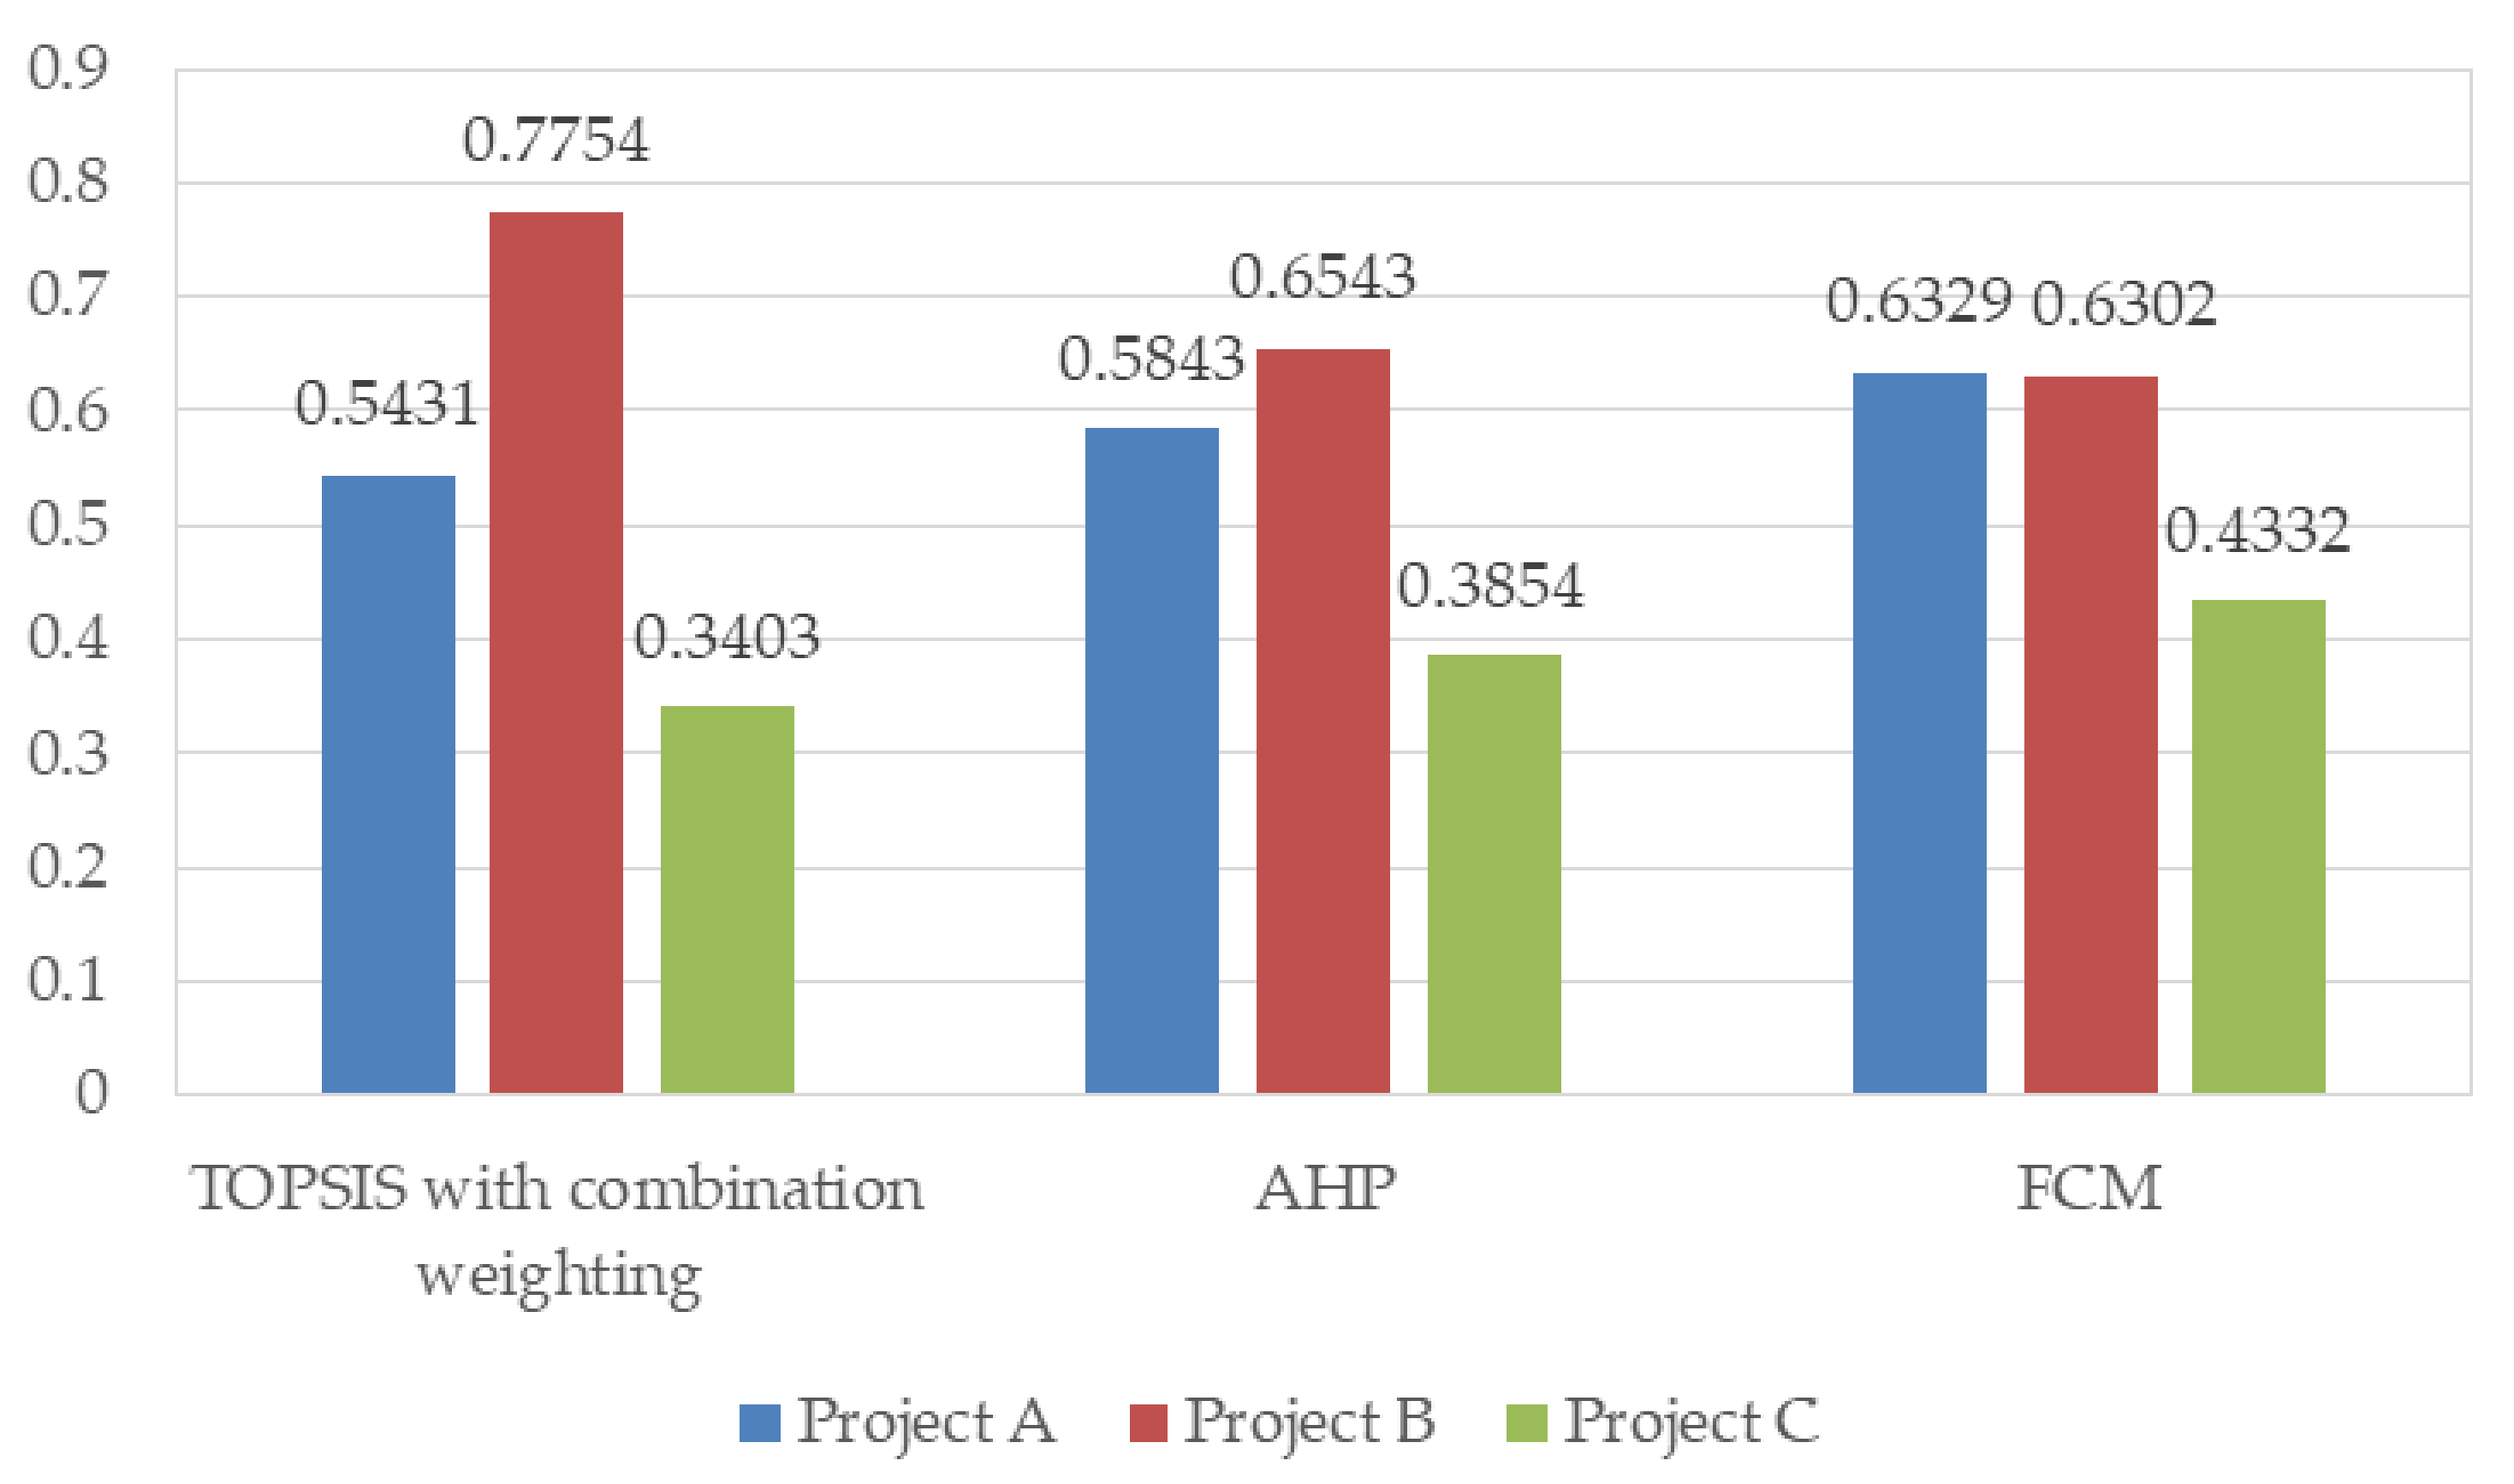
5.4. Validity Analysis
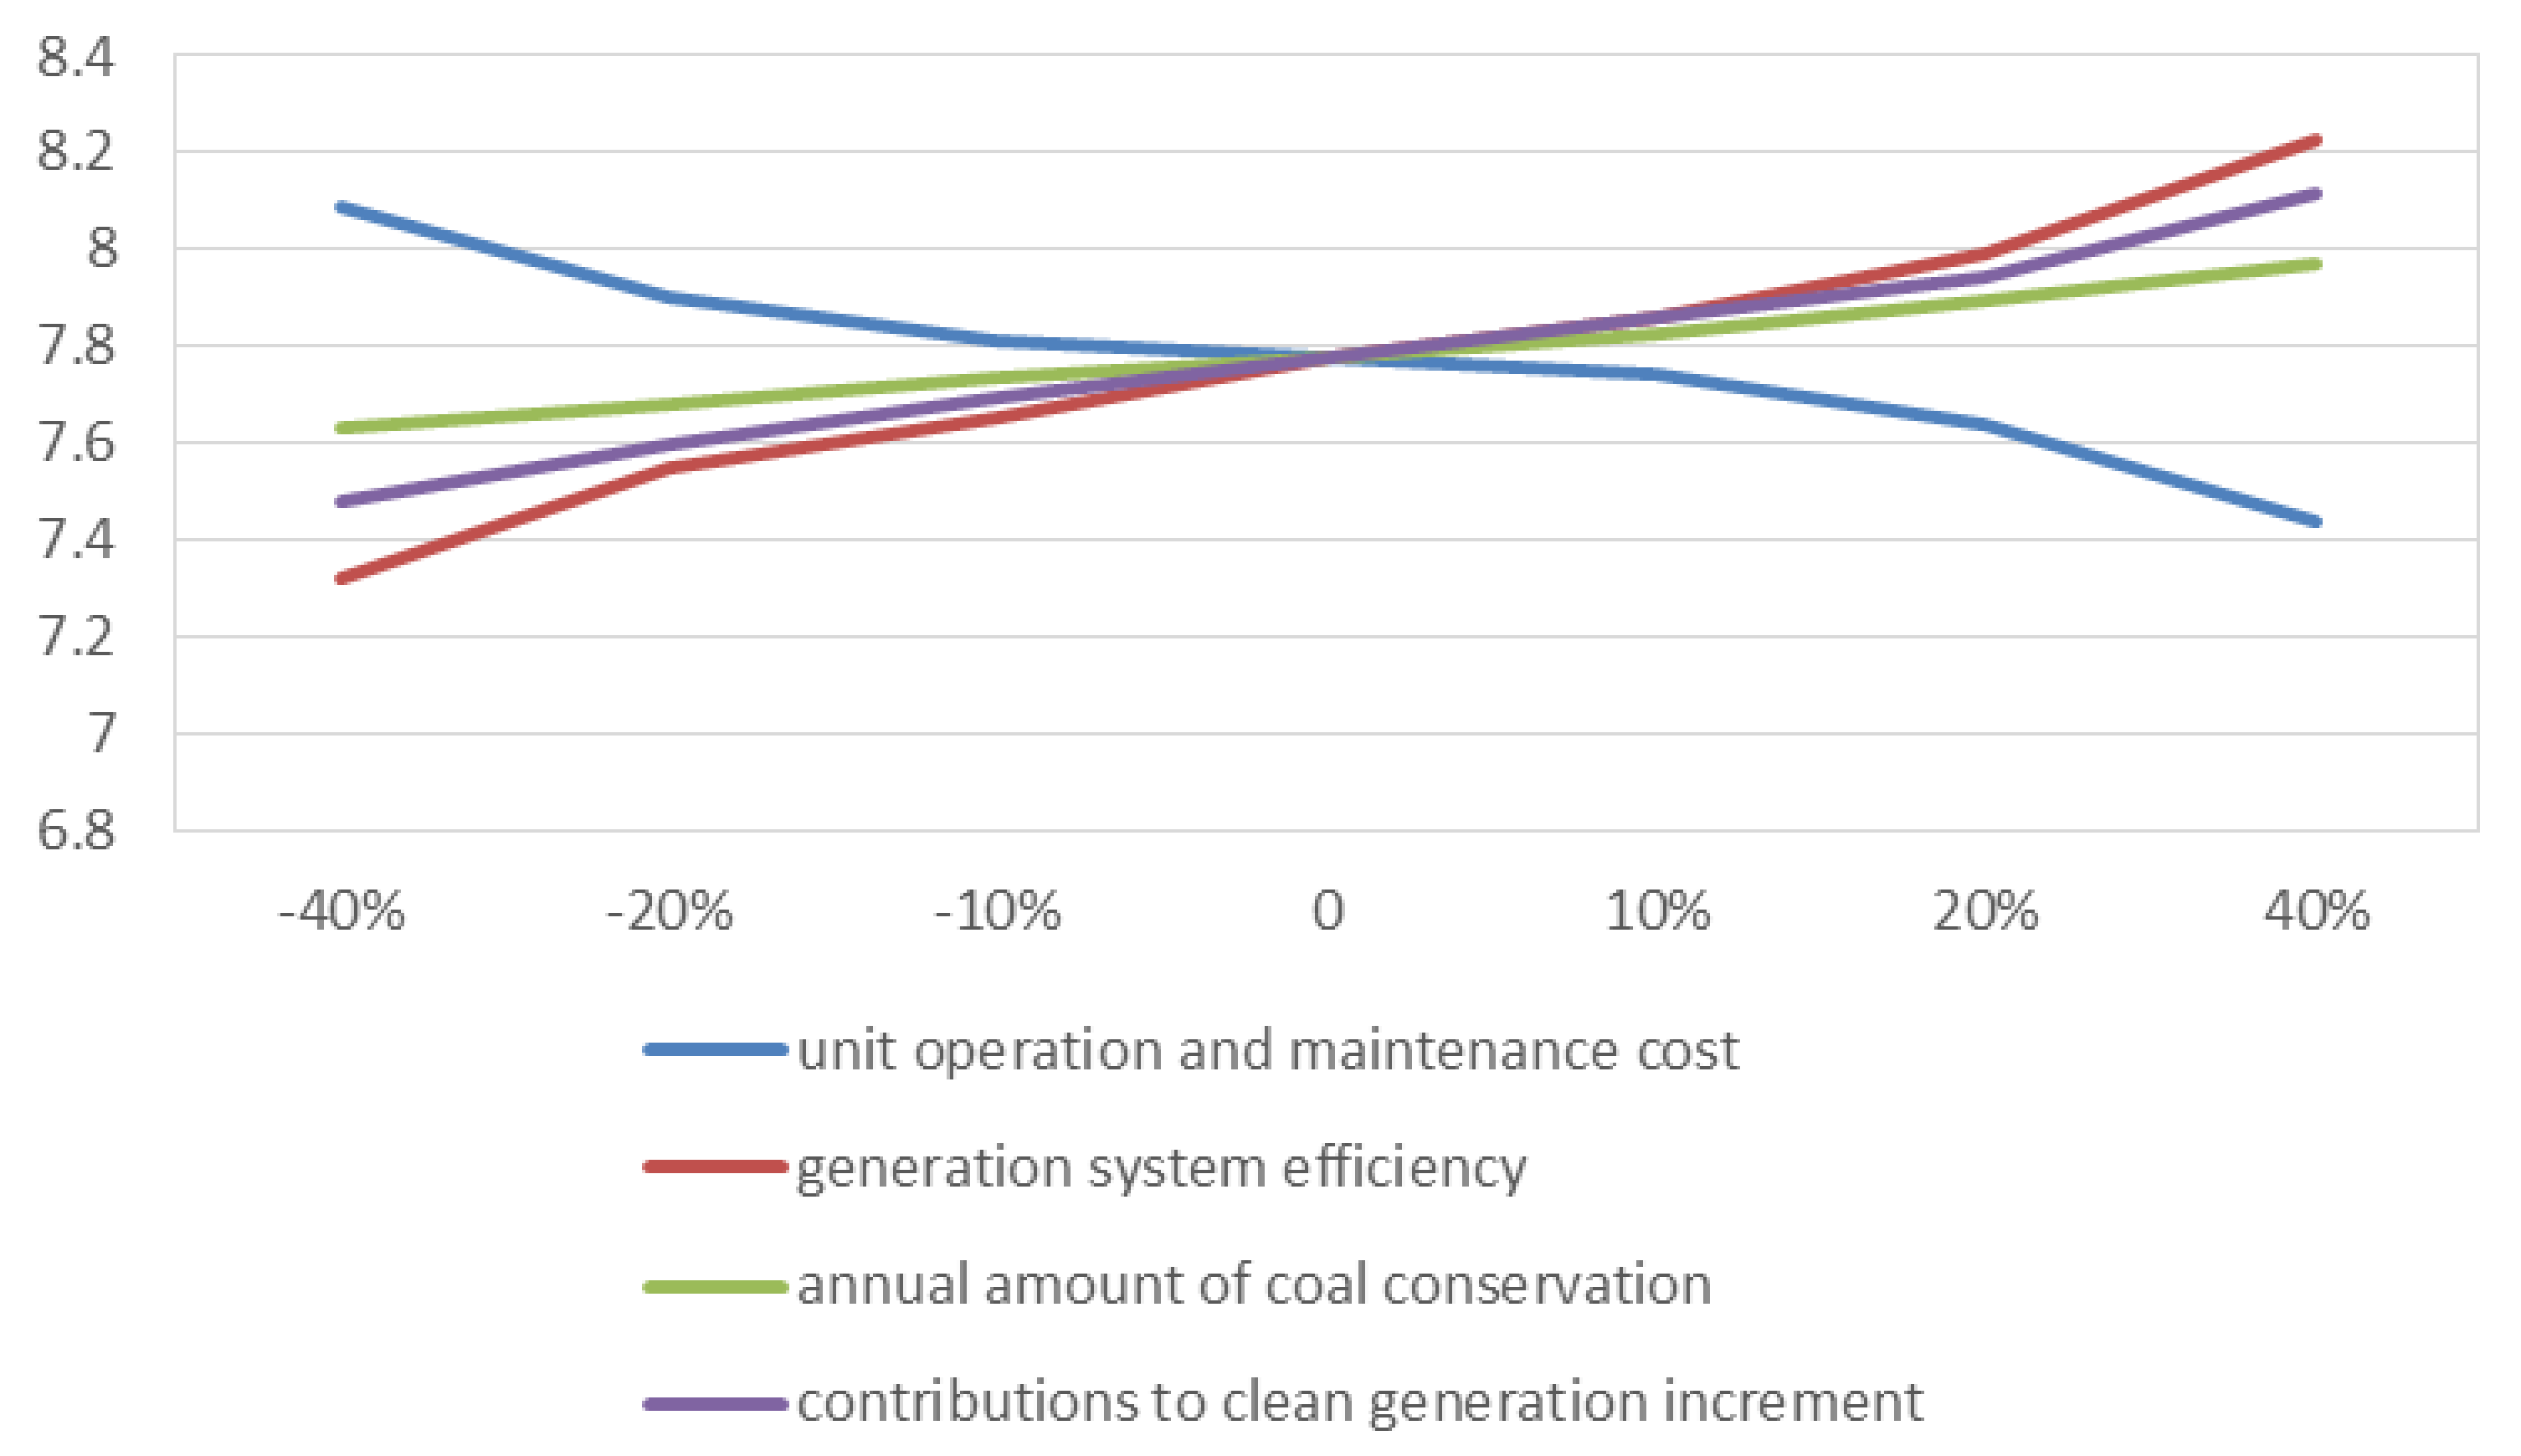
5.5. Sensitivity Analysis
6. Conclusions
Acknowledgments
Author Contributions
Conflicts of Interest
References
- National Bureau of Statistics of China. China’s Electric Power Production Reviews in 2016. Available online: www.chinapower.com.cn (accessed on 11 May 2017).
- National Energy Administration. Distributed PV Generation Capacity Has Increased 200% in 2016. Available online: www.nea.gov.cn (accessed on 10 March 2017).
- Comello, S.; Reichelstein, S. Cost competitiveness of residential solar PV, The impact of net metering restrictions. Renew. Sustain. Energy Rev. 2017, 75, 46–57. [Google Scholar] [CrossRef]
- Carless, T.S.; Griffin, W.M.; Fischbeck, P.S. The environmental competitiveness of small modular reactors, a life cycle study. Energy 2016, 114, 84–99. [Google Scholar] [CrossRef]
- Ziemele, J.; Pakere, I.; Blumberga, D. The future competitiveness of the non-Emissions Trading Scheme district heating systems in the Baltic States. Appl. Energy 2016, 162, 1579–1585. [Google Scholar] [CrossRef]
- Feng, T.; Yang, Y.; Yang, Y.; Wang, D. Application status and problem investigation of distributed generation in China, The case of natural gas, solar and wind resources. Sustainability 2017, 9, 1022. [Google Scholar] [CrossRef]
- Kadhem, A.A.; Wahab, N.I.A.; Aris, I.; Jasni, J.; Abdalla, A.N. Reliability assessment of power generation systems using intelligent search based on disparity theory. Energies 2017, 10, 343. [Google Scholar] [CrossRef]
- Wu, Q.; Peng, C. Comprehensive benefit evaluation of the power distribution network planning project based on improved IAHP and multi-Level extension assessment method. Sustainability 2016, 8, 796. [Google Scholar] [CrossRef]
- Min, C.; Kim, M. Flexibility-based evaluation of variable generation acceptability in Korean power system. Energies 2017, 10, 825. [Google Scholar] [CrossRef]
- Escobar, R.A.; Cortés, C.; Pino, A.; Pereira, E.B.; Martins, F.R.; Cardemil, J.M. Solar energy resource assessment in Chile, Satellite estimation and ground station measurements. Renew. Energy 2014, 71, 324–332. [Google Scholar] [CrossRef]
- Burnett, D.; Barbour, E.; Harrison, G.P. The UK solar energy resource and the impact of climate change. Renew. Energy 2014, 71, 333–343. [Google Scholar] [CrossRef]
- Ramgolam, Y.K.; Soyjaudah, K.M.S. Unveiling the solar resource potential for photovoltaic applications in Mauritius. Renew. Energy 2015, 77, 94–100. [Google Scholar] [CrossRef]
- He, G.; Kammen, D.M. Where, when and how much solar is available? A provincial-scale solar resource assessment for China. Renew. Energy 2016, 90, 38–45. [Google Scholar]
- Al-Waeli, A.H.A.; Sopian, K.; Kazem, H.A.; Chaichan, M.T. Photovoltaic/Thermal (PV/T) systems, Status and future prospects. Renew. Sustain. Energy Rev. 2017, 77, 109–130. [Google Scholar] [CrossRef]
- Jacobson, M.Z.; Delucchi, M.A. Providing all global energy with wind, water, and solar power, Part I, Technologies, energy resources, quantities and areas of infrastructure, and materials. Energy Policy 2011, 39, 1154–1169. [Google Scholar] [CrossRef]
- Wang, H.; Zheng, S.; Zhang, Y.; Zhang, K. Analysis of the policy effects of downstream Feed-In Tariff on China’s solar photovoltaic industry. Energy Policy 2016, 95, 479–488. [Google Scholar] [CrossRef]
- Zhang, S. Innovative business models and financing mechanisms for distributed solar PV (DSPV) deployment in China. Energy Policy 2016, 95, 458–467. [Google Scholar] [CrossRef]
- Park, A.; Lappas, P. Evaluating demand charge reduction for commercial-scale solar PV coupled with battery storage. Renew. Energy 2017, 108, 523–532. [Google Scholar] [CrossRef]
- Tomar, V.; Tiwari, G.N. Techno-economic evaluation of grid connected PV system for households with feed in tariff and time of day tariff regulation in New Delhi—A sustainable approach. Renew. Sustain. Energy Rev. 2017, 70, 822–835. [Google Scholar] [CrossRef]
- Pillai, G.; Putrus, G.; Pearsall, N.; Georgitsioti, T. The effect of distribution network on the annual energy yield and economic performance of residential PV systems under high penetration. Renew. Energy 2017, 108, 144–155. [Google Scholar] [CrossRef]
- Nookuea, W.; Campana, P.E.; Yan, J. Evaluation of solar PV and wind alternatives for self renewable energy supply: Case study of shrimp cultivation. Energy Procedia 2016, 88, 462–469. [Google Scholar] [CrossRef]
- Flowers, M.E.; Smith, M.K.; Parsekian, A.W.; Boyuk, D.S.; McGrath, J.K.; Yates, L. Climate impacts on the cost of solar energy. Energy Policy 2016, 94, 264–273. [Google Scholar] [CrossRef]
- Hanel, M.; Escobar, R. Influence of solar energy resource assessment uncertainty in the levelized electricity cost of concentrated solar power plants in Chile. Renew. Energy 2013, 49, 96–100. [Google Scholar] [CrossRef]
- Ma, W.W.; Rasul, M.G.; Liu, G.; Li, M.; Tan, X.H. Climate change impacts on techno-economic performance of roof PV solar system in Australia. Renew. Energy 2016, 88, 430–438. [Google Scholar] [CrossRef]
- Duan, H.; Zhang, G.; Zhu, L.; Fan, Y.; Wang, S. How will diffusion of PV solar contribute to China’s emissions-peaking and climate responses? Renew. Sustain. Energy Rev. 2016, 53, 1076–1085. [Google Scholar] [CrossRef]
- Yang, J.; Olsson, A.; Yan, J.; Chen, B. A Hybrid Life-cycle Assessment of CO2 Emissions of a PV Water Pumping System in China. Energy Procedia 2014, 61, 2871–2875. [Google Scholar] [CrossRef]
- Kittner, N.; Gheewala, S.H.; Kammen, D.M. Energy return on investment (EROI) of mini-hydro and solar PV systems designed for a mini-grid. Renew. Energy 2016, 99, 410–419. [Google Scholar] [CrossRef]
- Kumar, S.R.; Gafaro, F.; Daka, A.; Raturi, A. Modelling and analysis of grid integration for high shares of solar PV in small isolated systems—A case of Kiribati. Renew. Energy 2017, 108, 589–597. [Google Scholar] [CrossRef]
- Zaid, S.A.; Kassem, A.M. Review, analysis and improving the utilization factor of a PV-grid connected system via HERIC transformerless approach. Renew. Sustain. Energy Rev. 2017, 73, 1061–1069. [Google Scholar] [CrossRef]
- Lorenzi, G.; Silva, C.A.S. Comparing demand response and battery storage to optimize self-consumption in PV systems. Appl. Energy 2016, 180, 524–535. [Google Scholar] [CrossRef]
- Calpa, M.; Castillo-Cagigal, M.; Matallanas, E.; Caamaño-Martín, E.; Gutiérrez, Á. Effects of large-scale PV self-consumption on the aggregated consumption. Procedia Comput. Sci. 2016, 83, 816–823. [Google Scholar] [CrossRef]
- Franco, A.; Fantozzi, F. Experimental analysis of a self consumption strategy for residential building, the integration of PV system and geothermal heat pump. Renew. Energy 2016, 86, 1075–1085. [Google Scholar] [CrossRef]
- Yamamoto, T.; Sakamoto, H. A new concept of Monte Carlo kinetics parameter calculation using complex-valued perturbation. Ann. Nucl. Energy 2014, 71, 480–488. [Google Scholar] [CrossRef]
- Duan, Y.; Mu, H.; Li, N.; Li, L.; Xue, Z. Research on Comprehensive Evaluation of Low Carbon Economy Development Level Based on AHP-Entropy Method, A Case Study of Dalian. Energy Procedia 2016, 104, 468–474. [Google Scholar] [CrossRef]
- Li, N.; Zhao, H. Performance evaluation of eco-industrial thermal power plants by using fuzzy GRA-VIKOR and combination weighting techniques. J. Clean. Prod. 2016, 135, 169–183. [Google Scholar] [CrossRef]
- Mao, N.; Song, M.; Deng, S. Application of TOPSIS method in evaluating the effects of supply vane angle of a task/ambient air conditioning system on energy utilization and thermal comfort. Appl. Energy 2016, 180, 536–545. [Google Scholar] [CrossRef]
- Zeng, F.; Cheng, X.; Guo, J.; Tao, L.; Chen, Z. Hybridising Human Judgment, AHP, Grey Theory, and Fuzzy Expert Systems for Candidate Well Selection in Fractured Reservoirs. Energies 2017, 10, 447. [Google Scholar] [CrossRef]


| Main Aspects | Specific Content | Mentioned No. of Times |
|---|---|---|
| Resources | Rodrigo A. Escobar, et al. [10] and Mark Z. Jacobson, et al. [15] found the solar energy resource has an effect on PV generation. | 2 |
| Geography | Gang He and Daniel M. Kammen [13] also pointed it out that the location will influence the PV project. | 1 |
| Technology | Ali H.A., et al. [14], Vivek Tomar [19] and Sandip Ravi Kumar, et al. [28] showed that technical factors may determine the PV development level, such as grid-connection. | 3 |
| Production | Yatindra K. Ramgolam, et al. [12], Worrada Nookuea, et al. [21], Hong-Bo Duan, et al. [25], Alessandro Franco, et al. [32] figured that the output features are the basic drivers for PV power generation. | 4 |
| Economy | Most researchers considered that the business models and financing and tariff mechanisms are the main factors in economic evaluation of PV projects, such as Alex Park and Petros Lappas [18], Mallory E. Flowers, et al. [22] and so on. | 5 |
| Environment | Environmental effects of PV generation are another important aspect in PV project evaluation proposed by Dougal Burnett, et al. [11], and Weiwu Ma, et al. [24]. | 2 |
| Policy | Hongwei Wang, et al. [16] focused on policy influences on PV. | 1 |
| Main Dimension | Report 1 | Report 2 | Report 3 | Report 4 | Report 5 | Total |
|---|---|---|---|---|---|---|
| Generation resource | √ | √ | √ | √ | √ | 5 |
| Geological condition | √ | √ | √ | √ | √ | 5 |
| Organization | √ | √ | √ | √ | 4 | |
| Management process | √ | √ | √ | √ | 4 | |
| Electrical design | √ | √ | √ | √ | √ | 5 |
| Financial assessment | √ | √ | √ | √ | √ | 5 |
| Economic development | √ | √ | √ | 3 | ||
| Society serving | √ | √ | √ | √ | 4 | |
| Environmental protection | √ | √ | √ | √ | √ | 5 |
© 2017 by the authors. Licensee MDPI, Basel, Switzerland. This article is an open access article distributed under the terms and conditions of the Creative Commons Attribution (CC BY) license (http://creativecommons.org/licenses/by/4.0/).
Share and Cite
He, L.; Li, C.-L.; Nie, Q.-Y.; Men, Y.; Shao, H.; Zhu, J. Core Abilities Evaluation Index System Exploration and Empirical Study on Distributed PV-Generation Projects. Energies 2017, 10, 2083. https://doi.org/10.3390/en10122083
He L, Li C-L, Nie Q-Y, Men Y, Shao H, Zhu J. Core Abilities Evaluation Index System Exploration and Empirical Study on Distributed PV-Generation Projects. Energies. 2017; 10(12):2083. https://doi.org/10.3390/en10122083
Chicago/Turabian StyleHe, Lin, Chang-Ling Li, Qing-Yun Nie, Yan Men, Hai Shao, and Jiang Zhu. 2017. "Core Abilities Evaluation Index System Exploration and Empirical Study on Distributed PV-Generation Projects" Energies 10, no. 12: 2083. https://doi.org/10.3390/en10122083
APA StyleHe, L., Li, C.-L., Nie, Q.-Y., Men, Y., Shao, H., & Zhu, J. (2017). Core Abilities Evaluation Index System Exploration and Empirical Study on Distributed PV-Generation Projects. Energies, 10(12), 2083. https://doi.org/10.3390/en10122083