Coordinated Control of a Wind-Methanol-Fuel Cell System with Hydrogen Storage


 ,
, 
Abstract
1. Introduction
- (1)
- Integration wind energy into the grid has resulted in degradation of the inertia response, which in turn seriously affects the stability of the power system’s frequency. This problem can be solved by using an active power reserve to stabilize the frequency. Hydrogen/oxygen fuel cell technology is one of solution as a power reserve for this purpose.
- (2)
- Hydrogen/oxygen production from water electrolysis could provide the resource for fuel cell applications. As typical electricity-to-hydrogen conversion devices, electrolysers are regarded as deferrable loads with the ability to operate under a flexible schedule on the demand side.
- (3)
- The coal-based methanol production is one of research challenges of clean energy applications of fossil fuels. This study adopts a “greener” process. The oxygen is fed to the gasifier as the gasification agent and then the hydrogen is mixed with the CO-rich gas to adjust H2/CO so as to produce methanol. However, it requires local supplies of hydrogen/oxygen continuously. Therefore, this kind of applications are limited. However, specific geometry advantages of Xinjiang province is perfect for this kind of applications.
- (4)
- This innovative application integrates wind power, hydrogen from water electrolysis, hydrogen/oxygen fuel cells and a coal-based methanol production by a “greener” process. The system proposed has advantages of both the renewable sources and sustainable coal industries in China. Methanol receives hydrogen/oxygen to balance the local loads and to increase the overall profits. However, the hybrid construct would increase the system complexity. Therefore, it is necessary to investigate the possible energy management strategy and control mechanism before physical complicated system is build up.
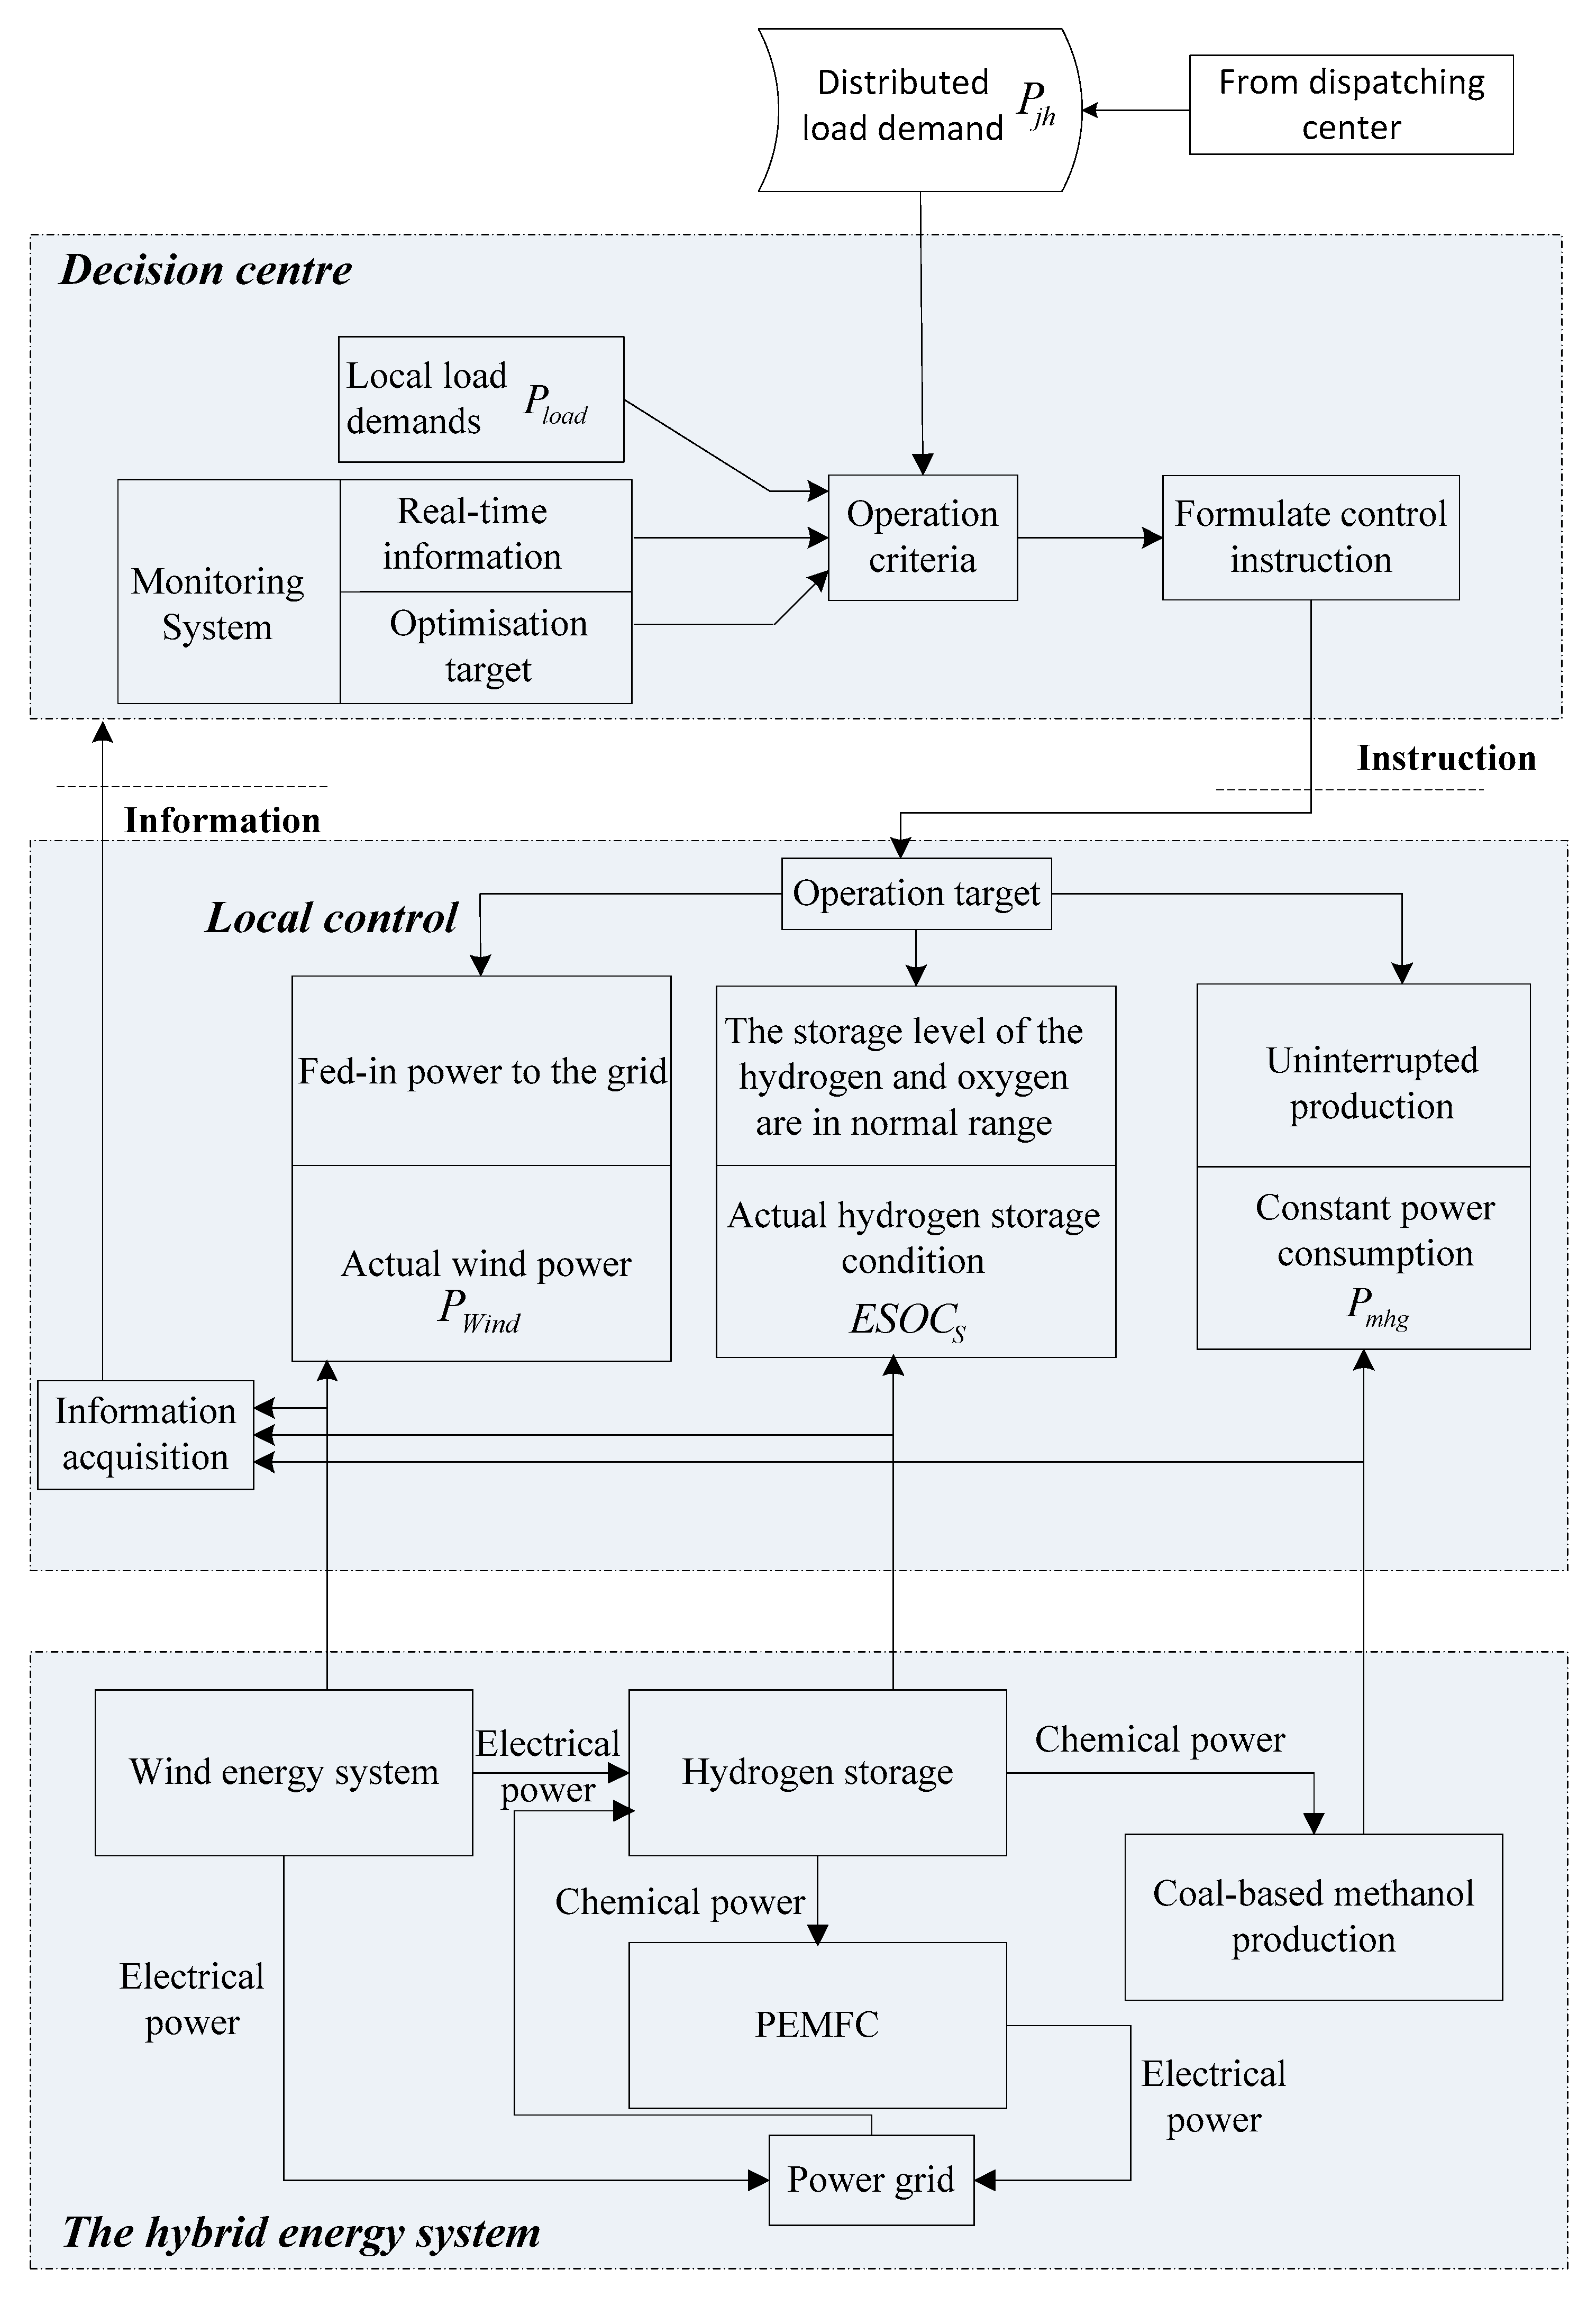
2. The Hybrid System and Its Control Scheme
- Wind power is used to generate electricity for supplying the grid and for producing hydrogen through water electrolysis.
- Normally, the generated electricity is fed into the power grid. If the wind power is plenty, the additional power is used for water electrolysis and the energy is stored in hydrogen.
- Hydrogen and oxygen produced are stored in separate tanks and are controlled to be within a range (upper limit 90% and lower limit 20%).
- Fuel cells absorb hydrogen and generate electricity to supply the grid.
- Methanol is produced constantly (from coal, hydrogen and oxygen) at a set value regardless of wind power input.
2.1. State Index of the Hybrid Energy Storage System (HESS)
- (1)
- When ESOCS > ESOCS_max, let i = 1 and
- (2)
- When ESOCS_min ≤ ESOCS ≤ ESOCS_max, let i = 2 and
- (3)
- When ESOCS < ESOCS_min, let i = 3 and
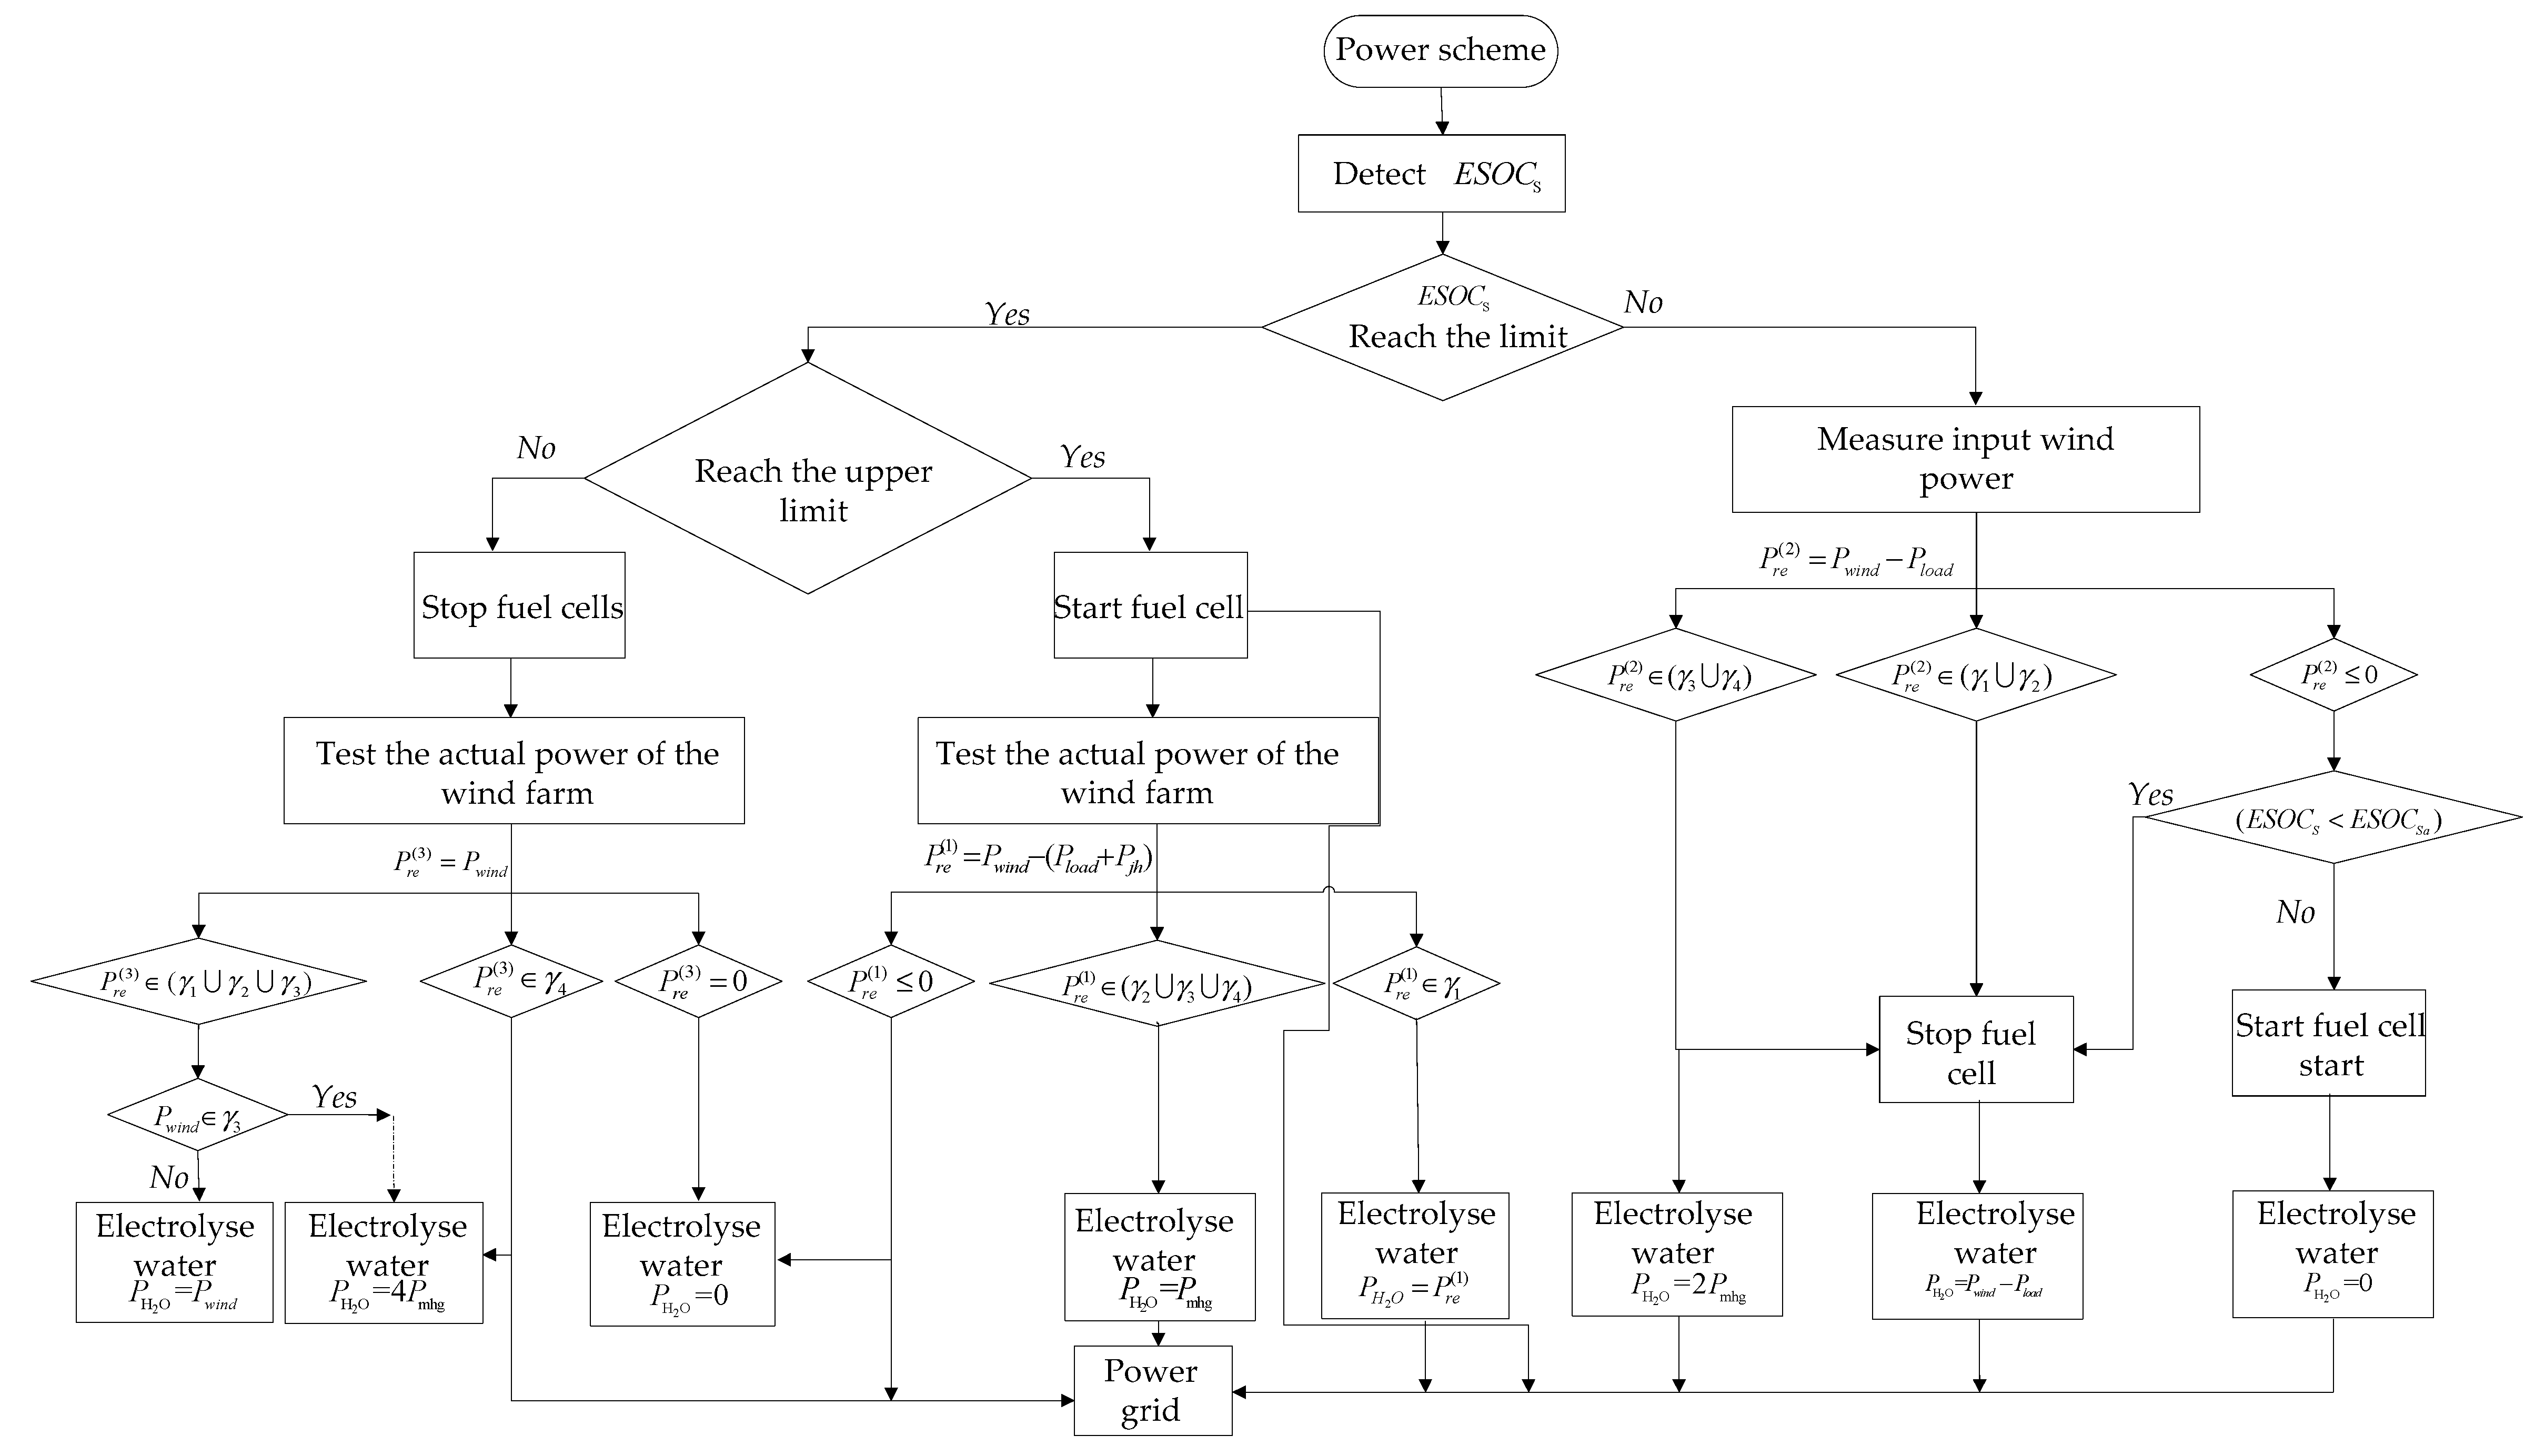
2.2. Operation Scheme of the Hybrid System
2.3. Electrical Power and ESOC Control
- The actual stock of the hydrogen is calculated by:
- The actual stock of the oxygen is calculated by:
2.4. Overall Control Scheme
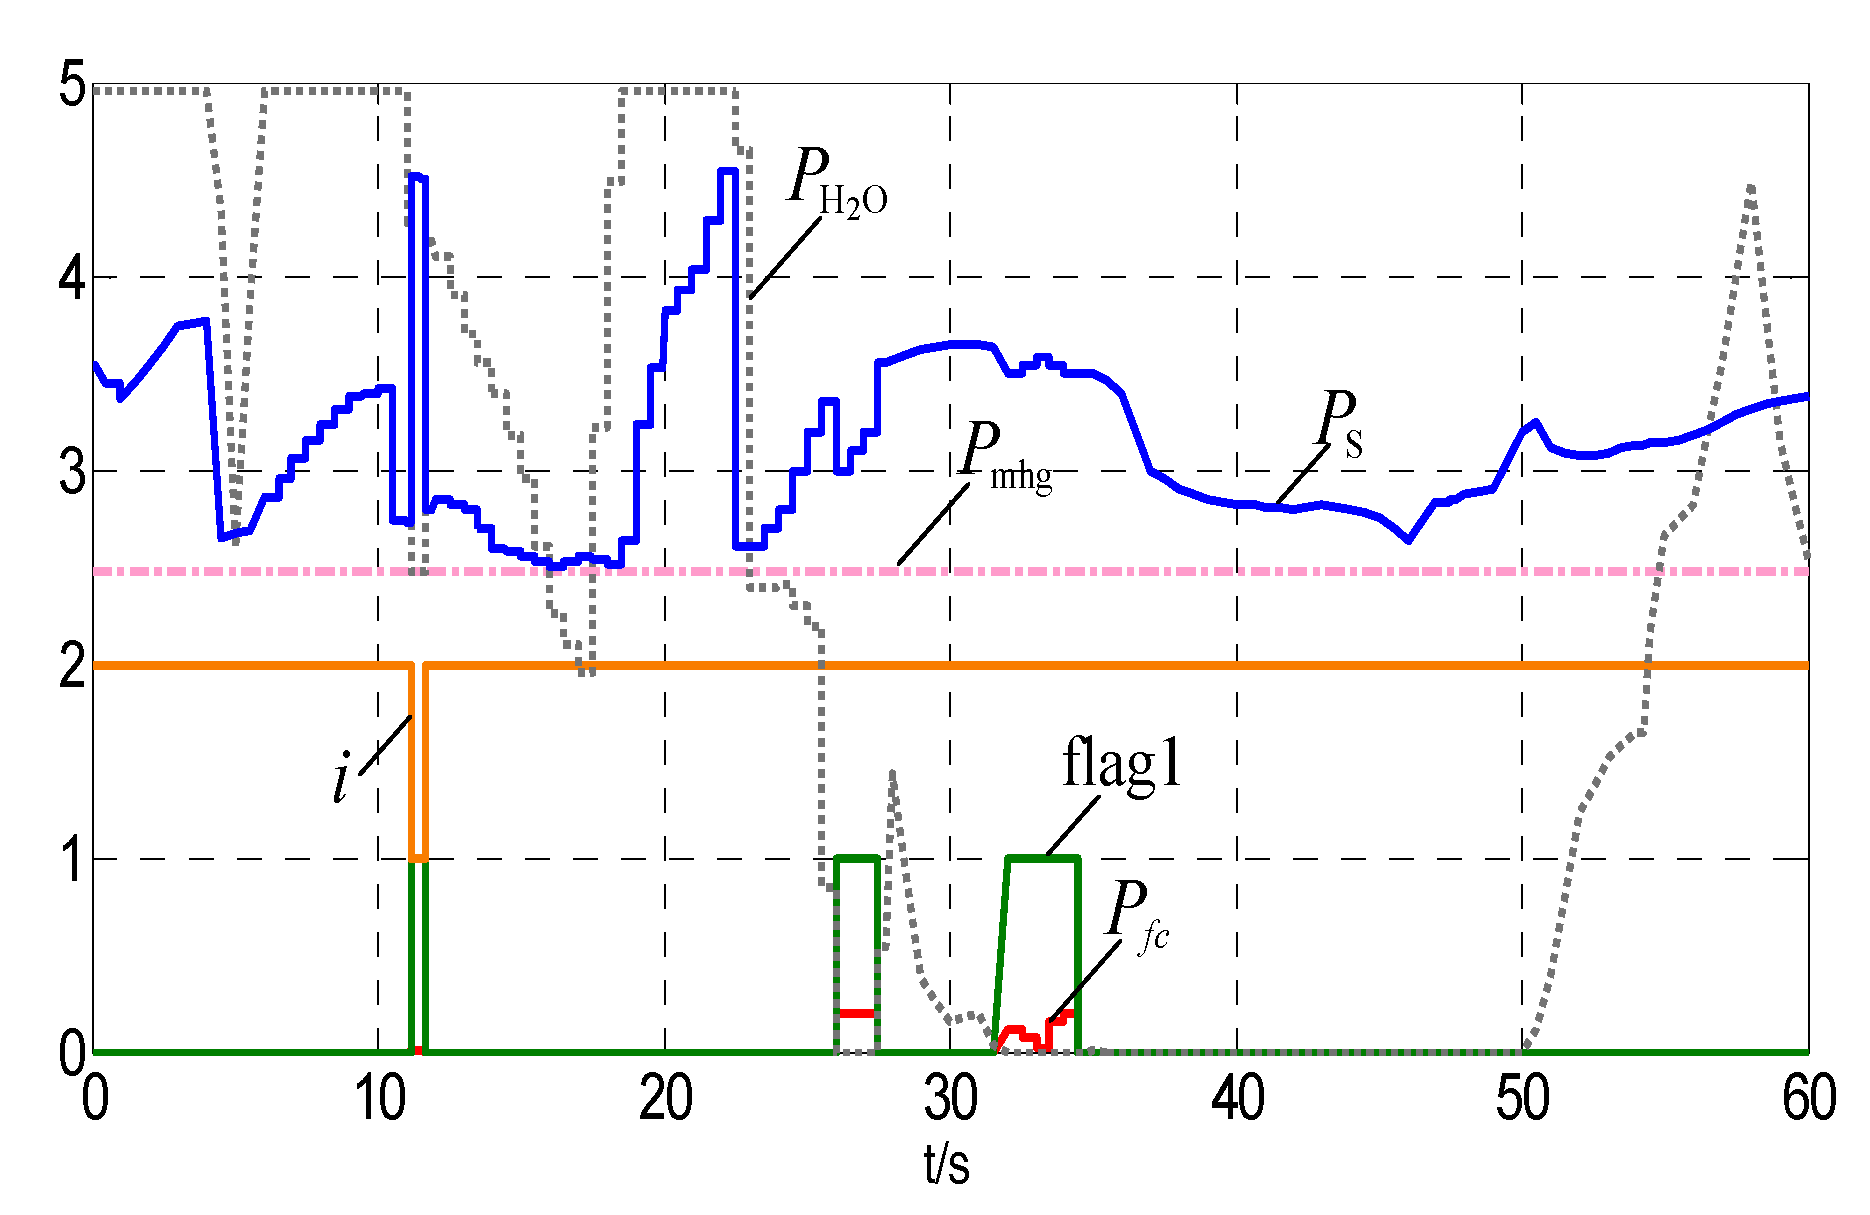
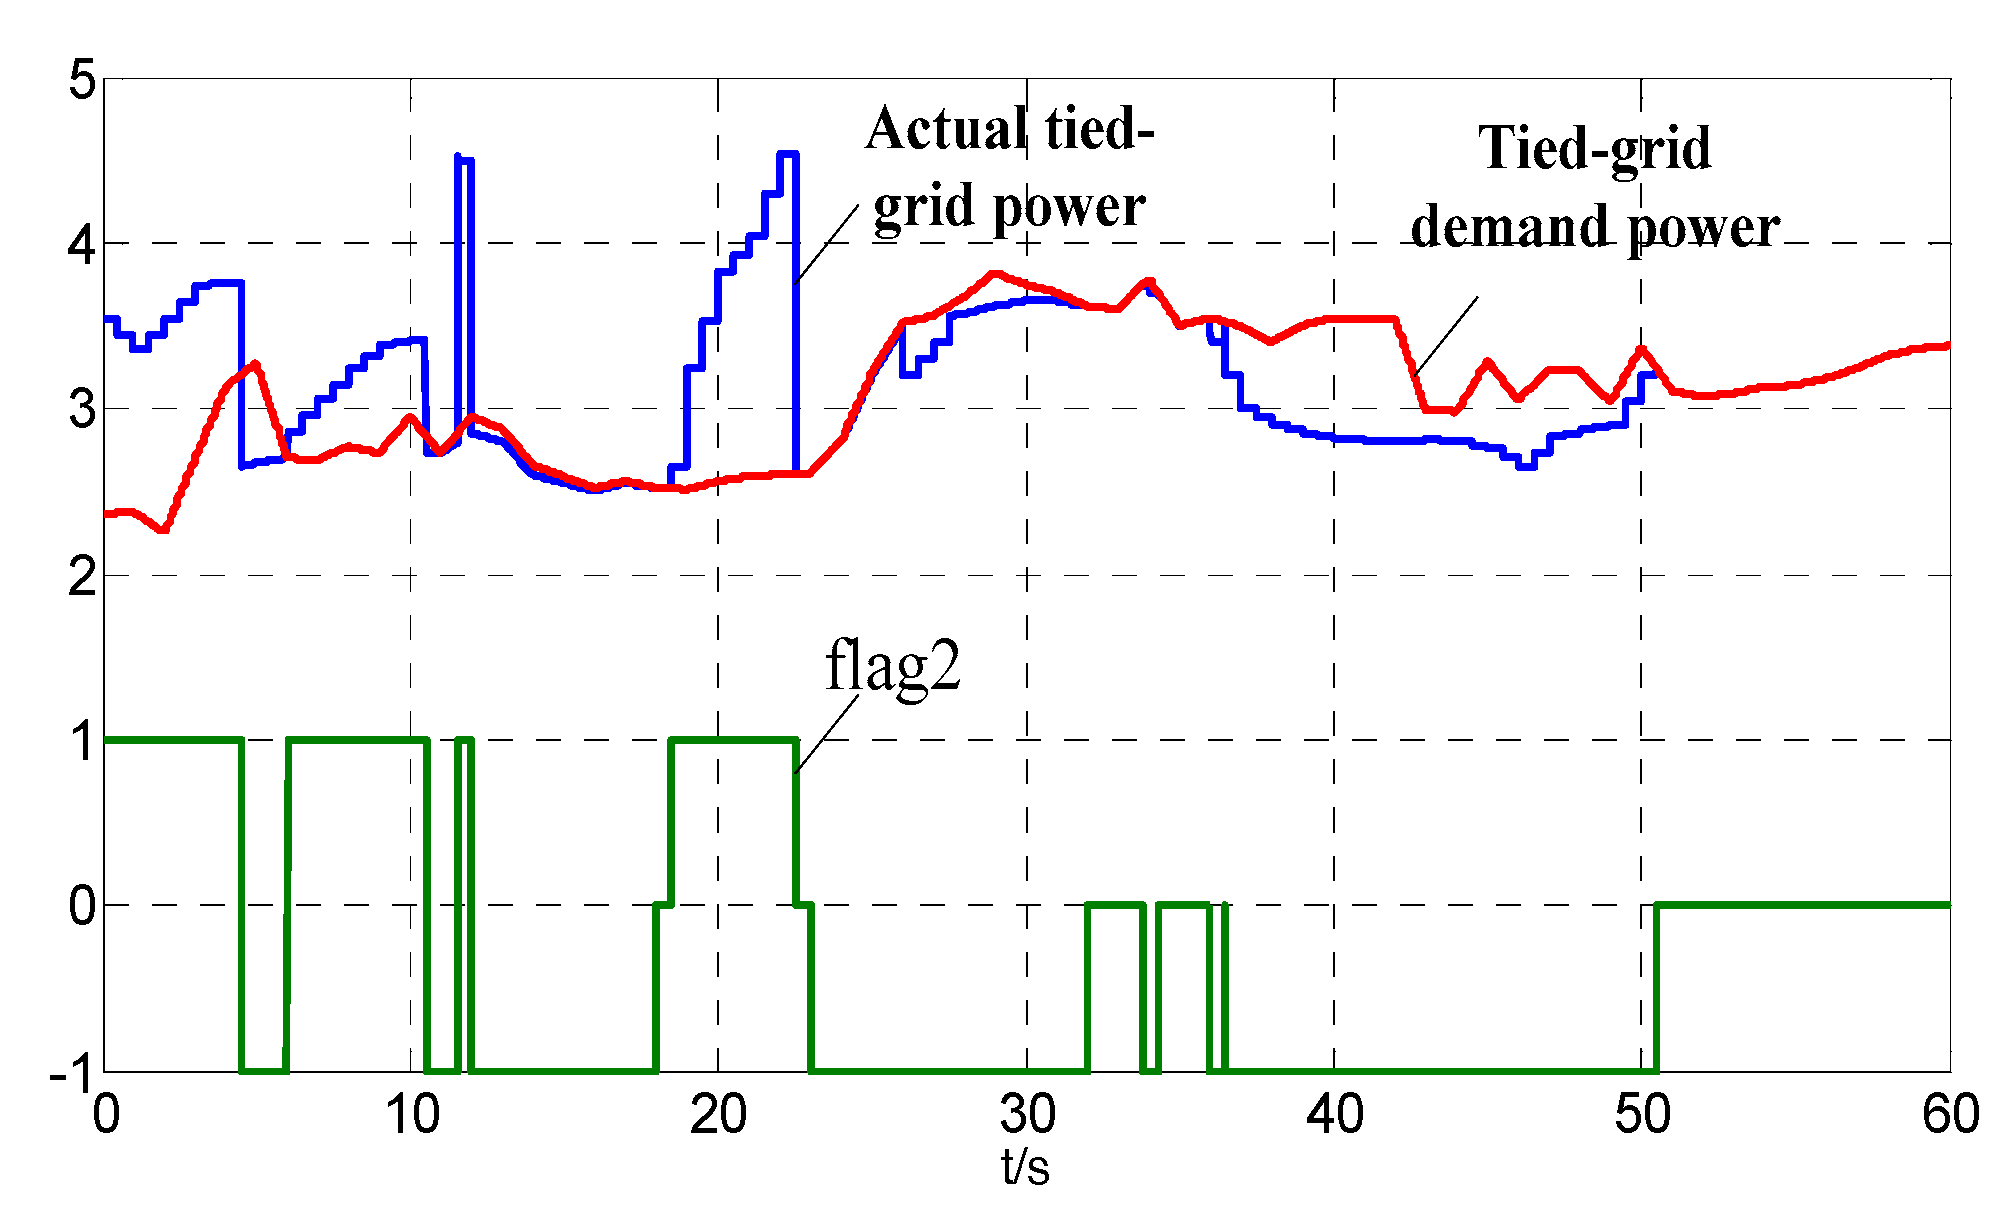
- If Ps + Pfc < Pload + Pjh, flag2 = −1, the local system does not satisfy with the grid plan and the local system requests the cluster control center to provide power assistance;
- If Ps + Pfc = Pload + Pjh, flag2 = 0, the local system operates in an ideal state and the established target is realised;
- If Ps + Pfc > Pload + Pjh, flag2 = 1, the local system requests assistance from cluster control center and the more power from the local system is sent to the grid.
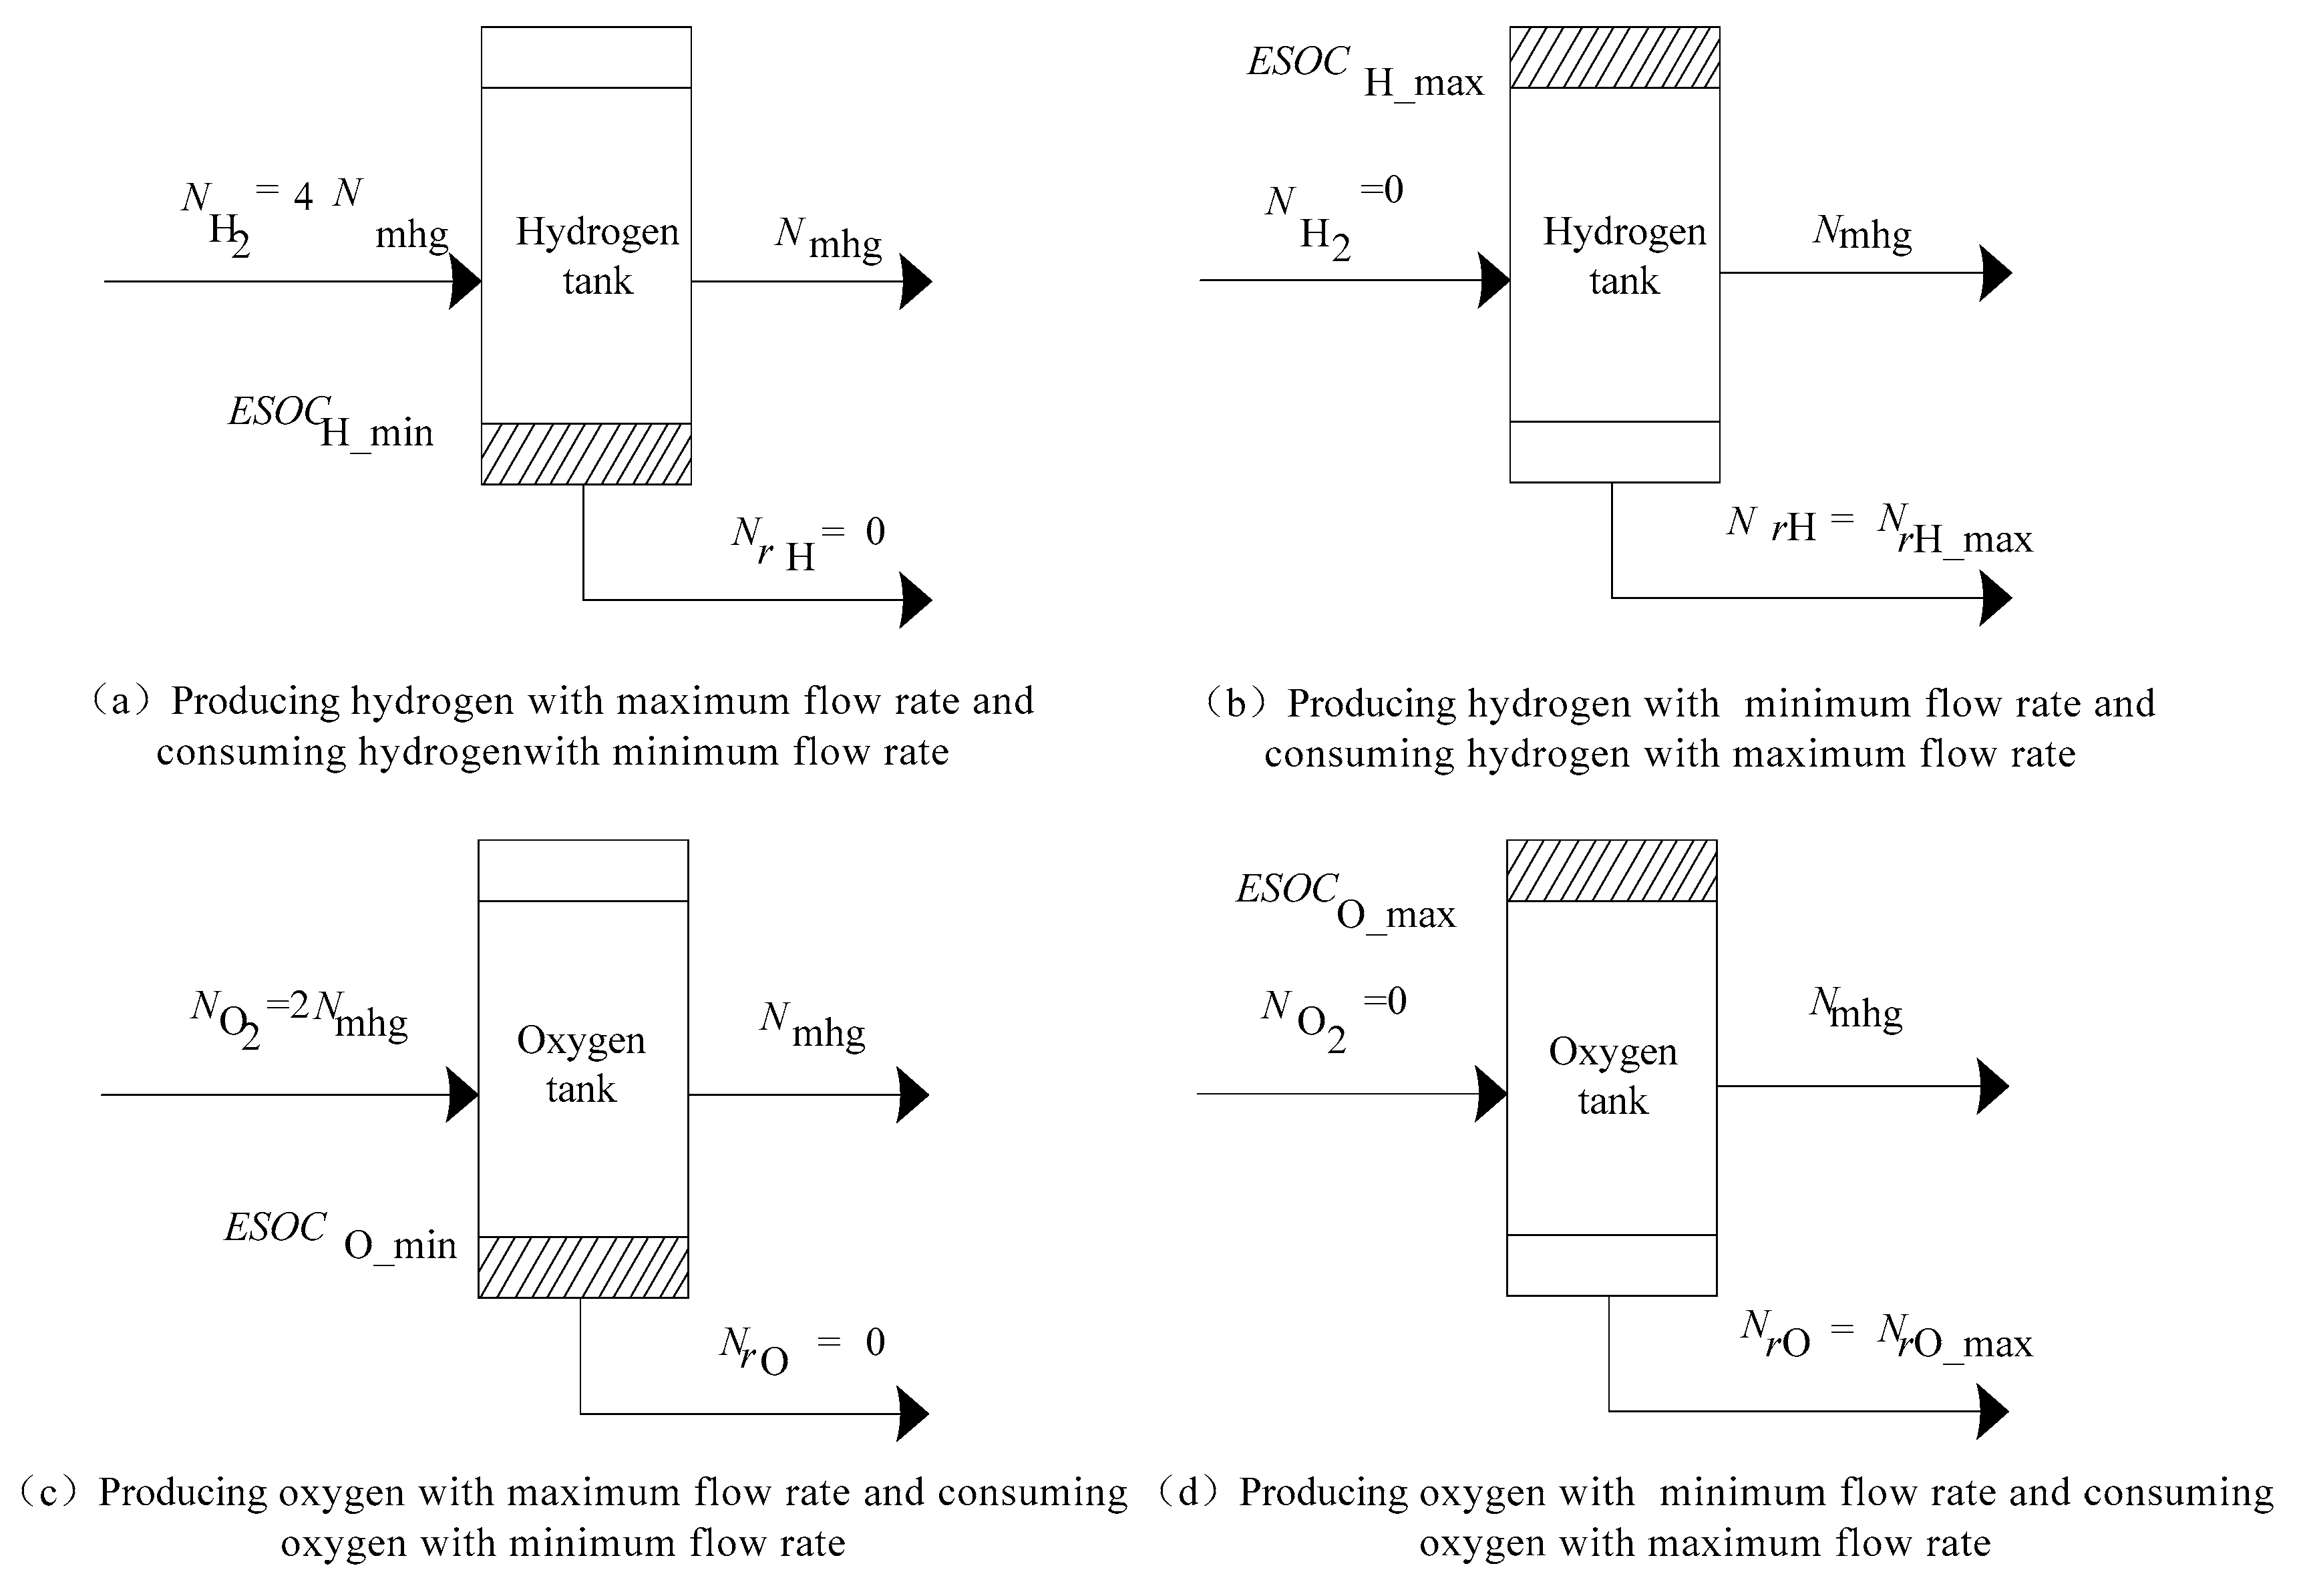
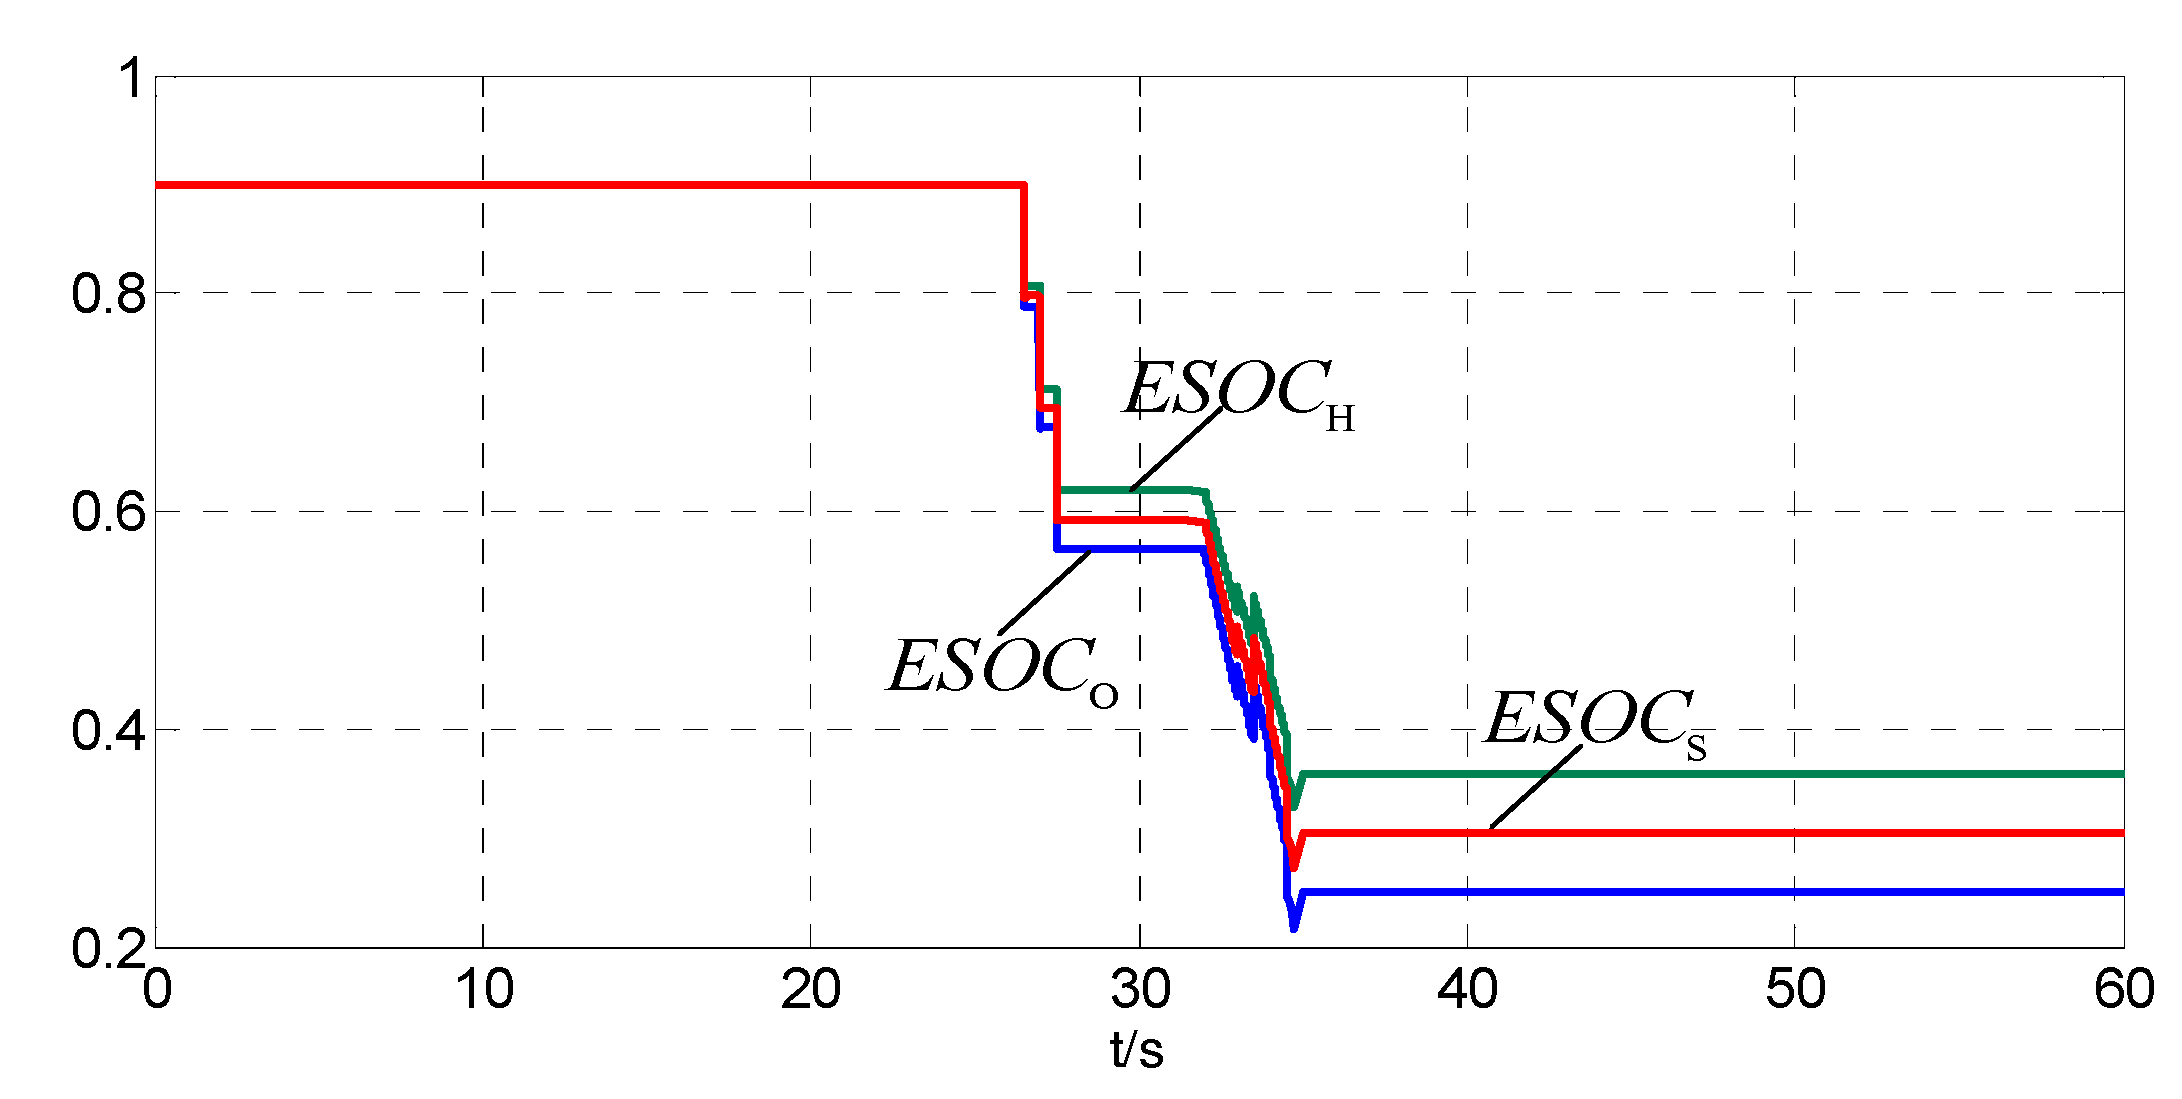
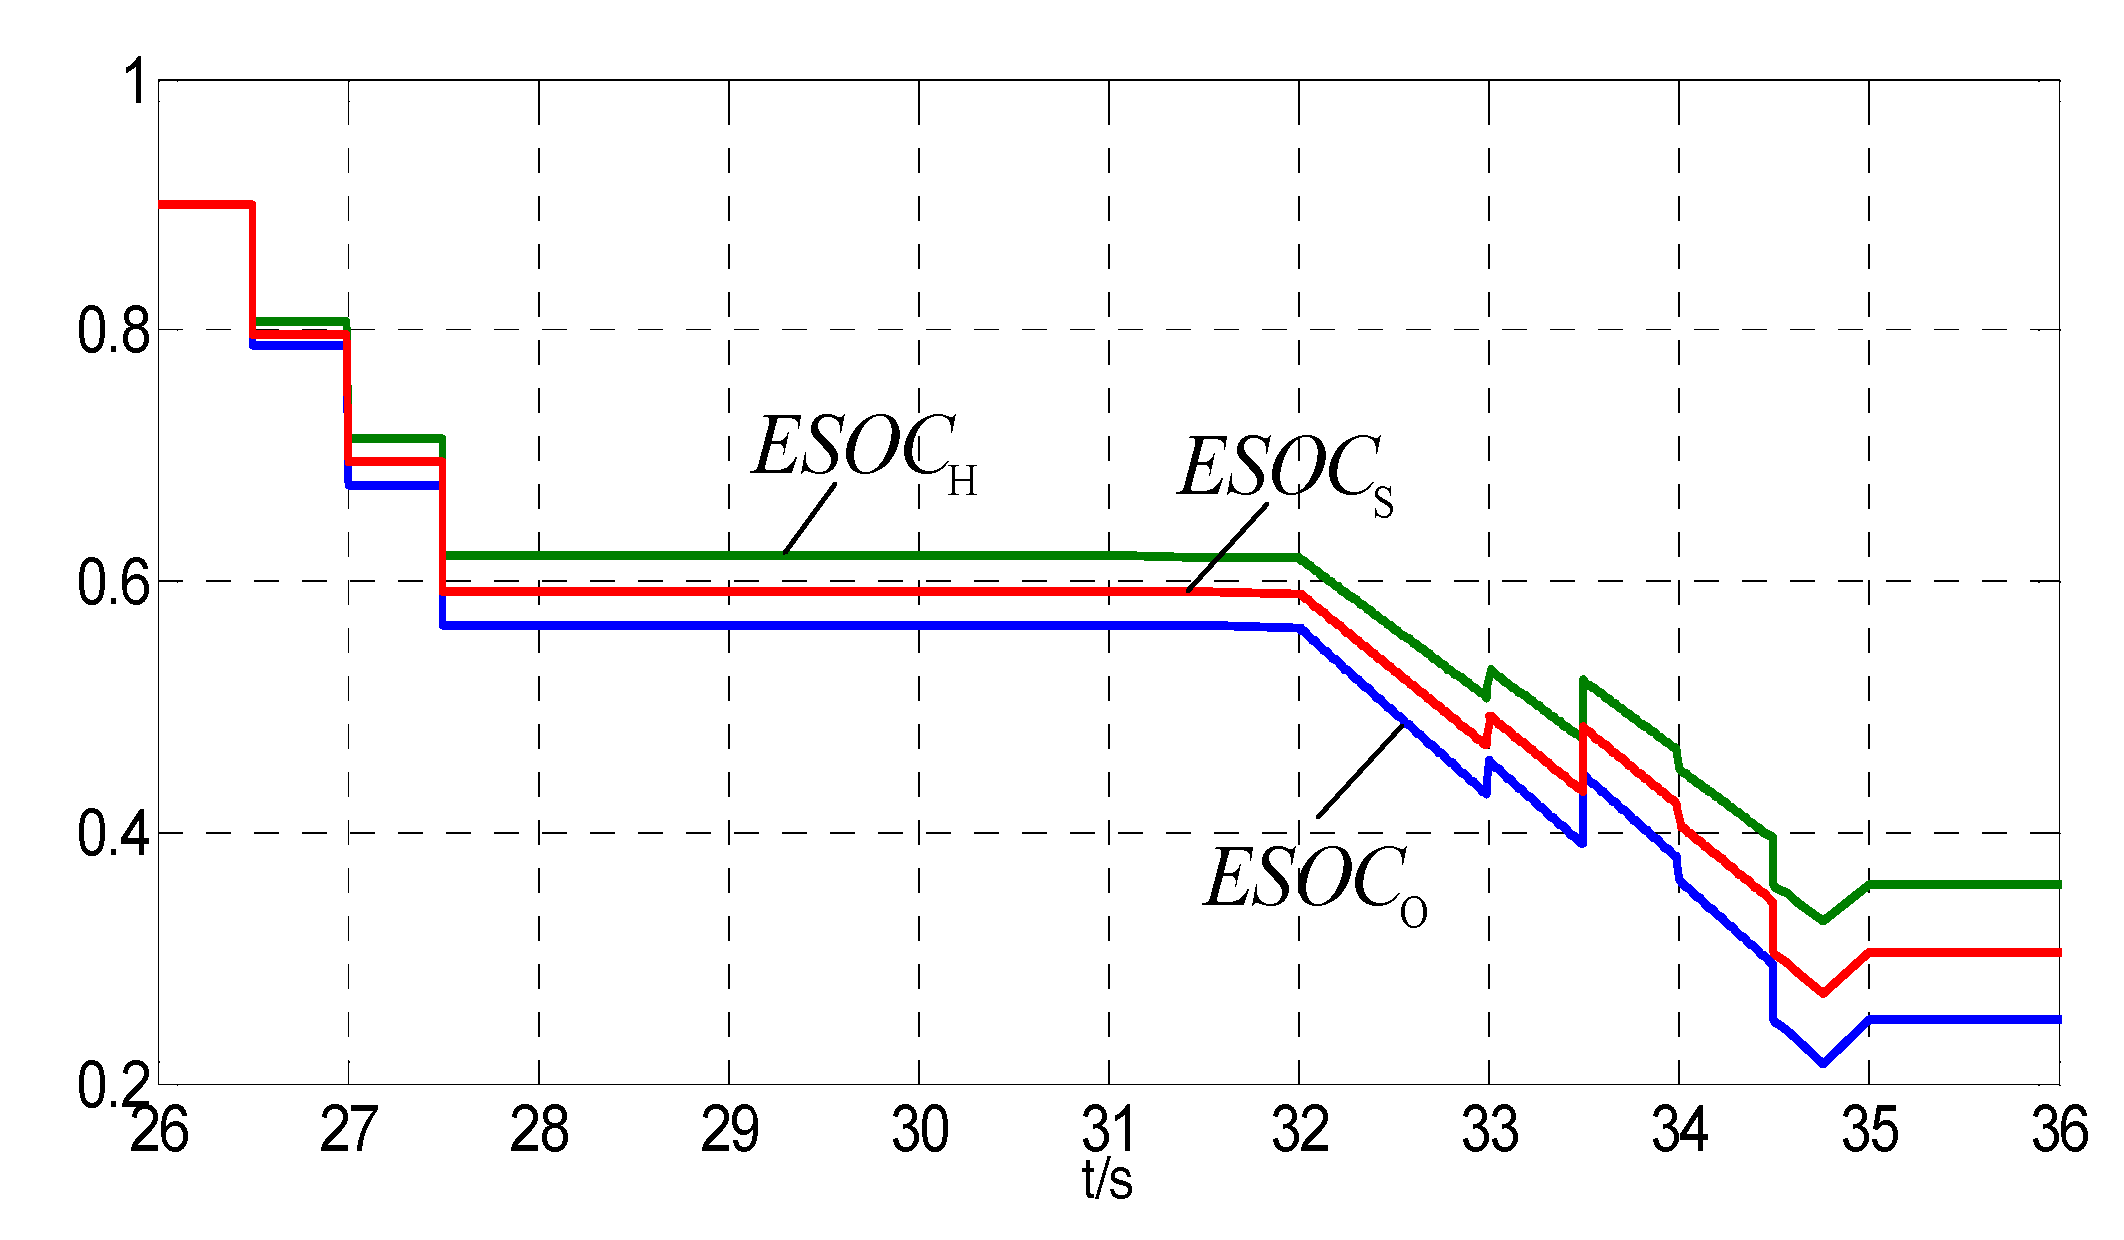
- As shown in Figure 5a,c, when ESOCH or ESOCO is lower than ESOCH_min or ESOCO_min, the hybrid system produces the hydrogen/oxygen in maximum and consumes the hydrogen/oxygen in minimum. ∆ta should select the smaller one between and :
- As shown in Figure 5b,d, when ESOCH or ESOCO is over than ESOCH_max or ESOCO_max, the hybrid system produces the hydrogen/oxygen in minimum and consumes hydrogen/oxygen in maximum. ∆tb should select the smaller one between and :
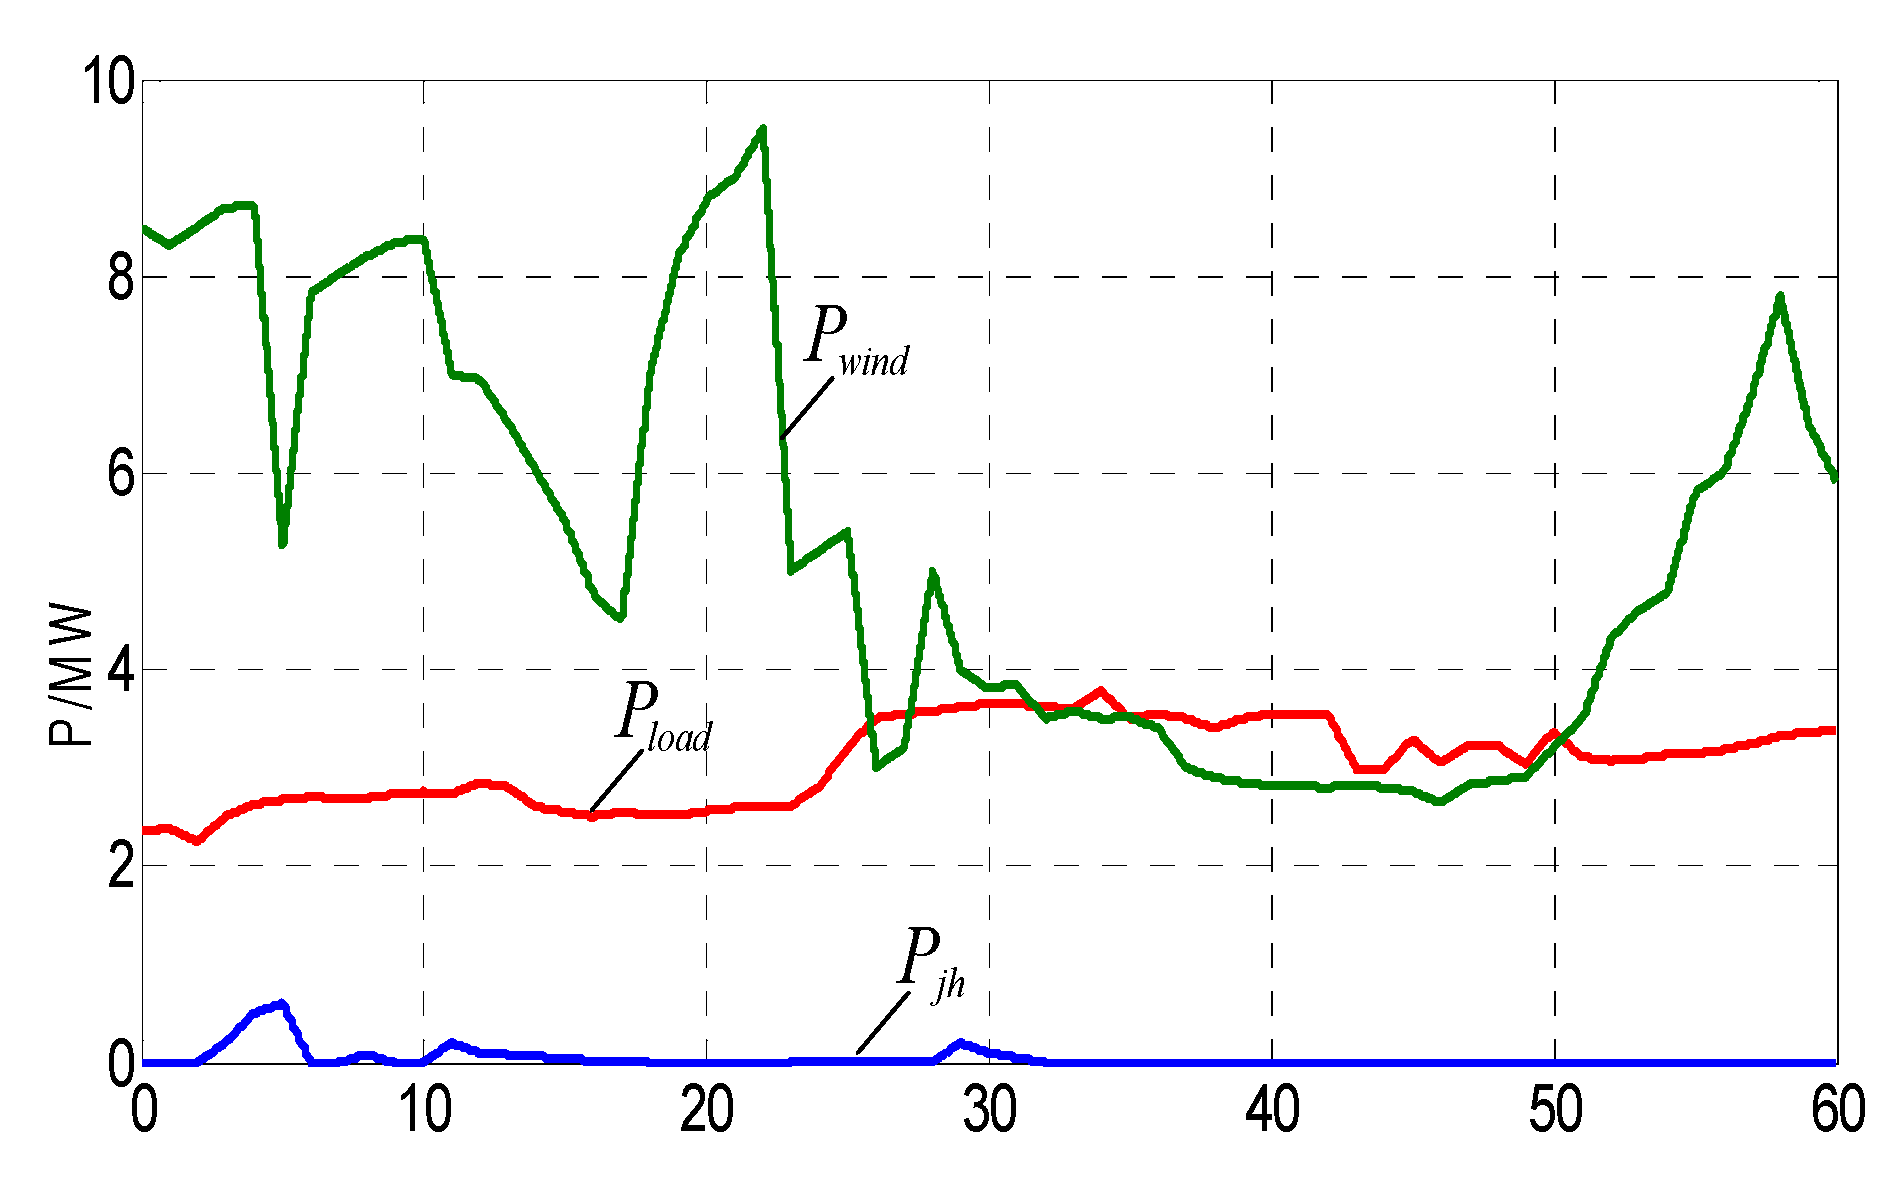
3. Simulation Results
4. Conclusions
- (1)
- This work takes advantage of wind power for electricity generation and for energy storage. In addition, coal-based energy systems for methanol production in a cleaner manner. This is critically important for China as well as many coal-dependent economies.
- (2)
- It integrates some interdisciplinary techniques into a multi-functional dynamic system to effectively manage various energy sources to enhance stable power supply stability, increase energy efficiency in utilization, and reduce CO2 emissions.
- (3)
- It proposes a concept prototype and then implements the structured system in a simulation environment, which significantly reduces the real test cost.
- (4)
- The simulation results have confirmed the technical feasibility of the proposed system. It paves the way for next stage progression in small scale real tests and future commercialization of the technology.
- (5)
- Because of the optimal design and control of the hybrid system, energy efficiency and cost efficiency will be improved. This has a significant economic implications. Moreover, the reduction in CO2 emissions will have an additional benefit from Carbon Trading Scheme in China.
- (1)
- Development of a full-scale simulation with hardware-in-loop real-time simulator for feasibility investigation.
- (2)
- Development of a full scale demonstration experimental setup of the system.
- (3)
- Conduction economic analysis, costs and gains, energy trading and carbon trading.
- (4)
- Carrying out a study on other social, environmental, legal impacts to minimize the uptake of the proposed technology.
Acknowledgments
Author Contributions
Conflicts of Interest
Appendix A

| 1 | Active area of the membrane | |
| 2 | Equation coefficient | |
| 3 | Equivalent capacitor of fuel cell | |
| 4 | Thermodynamic potential | |
| 5 | Equivalent state of charge | |
| 6 | Equivalent state of charge of the hydrogen tank | |
| 7 | Equivalent state of charge of the HESS | |
| 8 | Threshold of ESOC | |
| 9 | Equivalent state of charge of the oxygen tank | |
| 10 | The upper limit of the ESOC | |
| 11 | The low limit of the ESOC | |
| 12 | Faraday constant | |
| 13 | Current in water electrolyser | |
| 14 | Discharge current of fuel cell | |
| 15 | ampere density in fuel cell | |
| 16 | Maximum ampere density in fuel cell | |
| 17 | Fuel recovery rate | |
| 18 | Hydrogen constant | |
| 19 | Oxygen constant | |
| 20 | Thickness of the membrane | |
| 21 | Nominal capacity of the wind farm | |
| 22 | Hydrogen production amount by water electrolysis in ∆t | |
| 23 | Oxygen production amount by water electrolysis in ∆t | |
| 24 | Hydrogen consumption by methanol production in ∆t | |
| 25 | Oxygen consumption by methanol production in ∆t | |
| 26 | Hydrogen consumption by fuel cell in ∆t | |
| 27 | Oxygen consumption by fuel cell in ∆t | |
| 28 | Hydrogen consumption amount in ∆t | |
| 29 | Oxygen consumption in ∆t | |
| 30 | Hydrogen amount when the pressure of the hydrogen tank is over the upper limit | |
| 31 | Oxygen amount when the pressure of the oxygen tank is over the upper limit | |
| 32 | The serial units of fuel cells | |
| 33 | Flow rate of the hydrogen fed in the fuel cells | |
| 34 | Hydrogen flow rate in water electrolysis | |
| 35 | Flow rate of the hydrogen by water electrolysis | |
| 36 | Hydrogen flow rate consumed by methanol production at the rated power | |
| 37 | Hydrogen consumption at full discharging of the fuel cells | |
| 38 | Hydrogen flow rate when fuel cell discharging in minimum | |
| 39 | Tank pressure when fully charged | |
| 40 | Hydrogen pressure in a fuel cell | |
| 41 | Maximum power output of fuel cell discharging | |
| 42 | Minimum power output of fuel cell discharging | |
| 43 | Oxygen pressure in a fuel cell | |
| 44 | Full pressure of the hydrogen tank | |
| 45 | Current pressure in the hydrogen tank | |
| 46 | Initial pressure in hydrogen tank | |
| 47 | Full pressure of the oxygen tank | |
| 48 | Current pressure in the oxygen tank | |
| 49 | Initial pressure in oxygen tank | |
| 50 | Current pressure in storage tank | |
| 51 | Discharging power of fuel cell | |
| 52 | Power for water electrolysis | |
| 53 | Cluster power demand dispatched by cluster control center | |
| 54 | Local power demand | |
| 55 | Equivalent power for the water electrolysis when the amount of the hydrogen production is equal to the amount of methanol production | |
| 56 | Fed-in power to the grid | |
| 57 | Wind power | |
| 58 | R | Idea fuel constant (8.3145 J/mol·K) |
| 59 | T | Nominal temperature of fuel cell |
| 60 | Temperature in hydrogen tank | |
| 61 | Temperature in oxygen tank | |
| 62 | Equivalent voltage | |
| 63 | Output voltage of a single fuel cell | |
| 64 | Discharging voltage of fuel cell | |
| 65 | Polarization voltage | |
| 66 | Volume capacity of the hydrogen tank | |
| 67 | Volume capacity of the oxygen tank | |
| 68 | Size of a single fuel cell | |
| 69 | Cathode size of a single fuel cell | |
| 70 | Molar volume | |
| 71 | Equivalent resistance of the membrane | |
| 72 | Equivalent resistance of a fuel cell | |
| 73 | , , , | Empirical coefficients |
| 74 | Efficiency of water electrolyser | |
| 75 | Discharging efficiency of fuel cell | |
| 76 | Resistant rate of the membrane | |
| 77 | Water rate of the membrane | |
| 78 | Hydrogen pressure increment by water electrolysis | |
| 79 | Hydrogen pressure increment by incomplete consumption by fuel cell | |
| 80 | Hydrogen pressure decrement by methanol production | |
| 81 | Hydrogen pressure decrement by fuel cell consumption | |
| 82 | Operational time interval |
References
- Shu, Y.B. Deepening Cooperation, Embrace Challenges to Promote Sustainable Development of Renewable Energy. In Proceedings of the 2017 International Conference on Renewable Energy Development and Technology and High-Level Dialogue, Frankfurt, Germany, 16 June 2017; Available online: http://www.epri.sgcc.com.cn/html/eprien/col2016201124/2017-07/03/20170703161018331376621_1.html (accessed on 10 July 2017).
- Zhao, H.; Wu, Q.; Hu, S.; Xu, H. Review of energy storage system for wind power integration support. Appl. Energy 2015, 137, 545–553. [Google Scholar] [CrossRef]
- Perera, A.; Vahid, M.; Mauree, D.; Scartezzini, J. Electrical hubs: An effective way to integrate non-dispatchable renewable energy sources with minimum impact to the grid. Appl. Energy 2017, 190, 232–248. [Google Scholar] [CrossRef]
- Solomon, A.; Kammen, D.; Callaway, D. Investigating the impact of wind–solar complementarities on energy storage requirement and the corresponding supply reliability criteria. Appl. Energy 2016, 168, 130–145. [Google Scholar] [CrossRef]
- Shi, J.; Tang, Y.J.; Ren, L.; Li, J.D. Application of SMES in wind farm to improve voltage stability. Phys. C Supercond. Appl. 2008, 15, 2100–2103. [Google Scholar] [CrossRef]
- Li, N.; Zhang, X.L.; Shi, M.J.; Zhou, S.L. The prospects of China’s long-term economic development and CO2 emissions under fossil fuel supply constraints. Resour. Conserv. Recycl. 2017, 121, 11–22. [Google Scholar] [CrossRef]
- Shekhar, C.C. Methanol: The New Hydrogen, MIT Technology Review. Available online: https://www.technologyreview.com/s/405597/methanol-the-new-hydrogen/ (accessed on 10 July 2017).
- Li, Q.; Wei, Y.N.; Chen, Z.A. Water-CCUS nexus: Challenges and opportunities of China’s coal chemical industry. Clean Technol. Environ. Policy 2016, 18, 775–786. [Google Scholar] [CrossRef]
- Khaitan, S.K.; Raju, M.; McCalley, J.D. Design of a novel and efficient hydrogen compressor for wind energy based storage systems. Int. J. Hydrog. Energy 2015, 40, 1379–1387. [Google Scholar] [CrossRef]
- Lotfy, M.E.; Senjyu, T.; Farahat, M.A.; Abdel-Gawad, A.F.; Yona, A. A frequency control approach for hybrid power system using multi-objective optimization. Energies 2017, 10, 80. [Google Scholar] [CrossRef]
- Maleki, A.; Hafeznia, H.; Rosen, M.A.; Pourfayaz, F. Optimization of a grid-connected hybrid solar-wind-hydrogen CHP system for residential applications by efficient metaheuristic approaches. Appl. Therm. Eng. 2017, 123, 1263–1277. [Google Scholar] [CrossRef]
- Beccali, M.; Brunone, S.; Finocchiaro, P. Method for size optimisation of large wind–hydrogen systems with high penetration on power grids. Appl. Energy 2013, 102, 534–544. [Google Scholar] [CrossRef]
- Chrenko, D.; Lecoq, S.; Herail, E. Static and dynamic modeling of a diesel fed fuel cell power supply. Int. J. Hydrog. Energy 2010, 35, 1377–1389. [Google Scholar] [CrossRef]
- Boulon, L.; Agbossou, K.; Hissel, D. A macroscopic PEM fuel cell model including water phenomena for vehicle simulation. Renew. Energy 2012, 46, 81–91. [Google Scholar] [CrossRef]
- Jiang, Z.H.; Yu, X.W. Modeling and control of an integrated wind power generation and energy storage system. In Proceedings of the Power & Energy Society General Meeting 2009, Calgary, AB, Canada, 26–30 July 2009; pp. 1–8. [Google Scholar]
- Abbey, C.; Joos, G. Supercapacitor Energy Storage for Wind Energy Applications. IEEE Trans. Ind. Appl. 2007, 43, 769–776. [Google Scholar] [CrossRef]
- Ni, W.D.; Gao, J.; Chen, Z.; Li, Z. How to make the production of Methanol/DME “GREENER”—The integration of wind power with coal chemical industry. Front. Energy Power Eng. 2009, 3, 94–98. (In Chinese) [Google Scholar] [CrossRef]
- Yuan, T.; Lin, K.; Guan, Y.; Dong, X.; Sun, Y.; Mei, S. Modeling on hydrogen producing progress in EMR based wind power-hydrogen energy storage and coal chemical pluripotent coupling system. High Volt. Eng. 2015, 41, 2156–2164. (In Chinese) [Google Scholar]
- Elgammal, A.A.A.; El-naggar, M.F. MOPSO-based optimal control of shunt active power filter using a variable structure fuzzy logic sliding mode controller for hybrid (FC-PV-Wind-Battery) energy utilisation scheme. IET Renew. Power Gener. 2017, 11, 1148–1156. [Google Scholar] [CrossRef]
- Saravanan, S.; Thangavel, S. Instantaneous reference current scheme based power management system for a solar/wind/fuel cell fed hybrid power supply. Int. J. Electr. Power Energy Syst. 2014, 55, 155–170. [Google Scholar] [CrossRef]
- Mohammadi, S.; Soleymani, S.; Mozafari, B. Scenario-based stochastic operation management of MicroGrid including Wind, Photovoltaic, Micro-Turbine, Fuel Cell and Energy Storage Devices. Int. J. Electr. Power Energy Syst. 2014, 54, 525–535. [Google Scholar] [CrossRef]
- Xu, L.J.; Fan, X.C.; Wang, W.Q. Renewable and sustainable energy of Xinjiang and development strategy of node areas in the “Silk Road Economic Belt”. Renew. Sustain. Energy Rev. 2017, 79, 274–285. [Google Scholar] [CrossRef]
- National Energy Administration, Chinese. Energy Development 12th Five-Year Plan. Available online: http://www.nea.gov.cn/2013-01/28/c_132132808.htm# (accessed on 1 January 2013).
- Xinhua. China Tops the World in Renewable Energy Production: BP Report. Available online: http://news.xinhuanet.com/english/2017-07/10/c_136432582.htm (accessed on 10 July 2017).
- Lin, H.; Jin, H.G.; Gao, L.; Han, W. Economic analysis of coal-based polygeneration system for methanol and power production. Energy 2010, 35, 858–863. [Google Scholar] [CrossRef]
- Tang, L.; Wu, J.Q.; Yu, L.; Bao, Q. Carbon emissions trading scheme exploration in China: A multi-agent-based model. Energy Policy 2015, 81, 152–169. [Google Scholar] [CrossRef]
- Jia, L.; Qu, F.C. Index of Carbon Dioxide and the Main Pollutant Emissions of Coal Chemical Industry Demonstration Project Research. Chem. Ind. 2014, 7, 13–17. (In Chinese) [Google Scholar]
- Lamy, C. From hydrogen production by water electrolysis to its utilization in a PEM fuel cell or in a SO fuel cell: Some considerations on the energy efficiencies. Int. J. Hydrog. Energy 2016, 41, 15415–15425. [Google Scholar] [CrossRef]
- Giaconia, A.; Grena, R.; Lanchi, M.; Liberatore, R.; Tarquini, P. Hydrogen/methanol production by sulfur–iodine thermochemical cycle powered by combined solar/fossil energy. Int. J. Hydrog. Energy 2007, 32, 469–481. [Google Scholar] [CrossRef]
- Wang, W.L.; Wang, D.; Jia, H.J.; He, G.X.; Hu, Q.; Sui, P.C.; Fan, M.H. Performance Evaluation of a Hydrogen-Based Clean Energy Hub with Electrolyzers as a Self-Regulating Demand Response Management Mechanism. Energies 2017, 10, 1211. [Google Scholar] [CrossRef]
- Francois, B.; Hissel, D.; Iqbal, M.T. Dynamic Modelling of a Fuel Cell and Wind Turbine DC-Linked Power System. In Proceedings of the ELECTRIMACS Conference, Hammamet, Tunisia, 17–20 April 2005; The ELECTRIMACS Technical Committee: Hammamet, Tunisia, 2005. [Google Scholar]
- Choi, S.; Chu, K.; Ryu, J.; Sunwoo, M. Empirical modeling of a polymer electrolyte fuel cell based on water transport investigation and current interrupt measurement. Int. J. Automot. Technol. 2009, 10, 719–732. [Google Scholar] [CrossRef]
- Mann, R.F.; Amphlett, J.C.; Hooper, M.A.I.; Jensen, H.M.; Peppley, B.A.; Roberge, P.R. Development and application of a generalised steady-state electrochemical model for a PEM fuel cell. J. Power Sources 2000, 86, 173–180. [Google Scholar] [CrossRef]


| (0,Pmhg) | [Pmhg,2Pmhg] | (2Pmhg,4Pmhg] | (4Pmhg,+∞) | |
| (0,Nmhg) | [Nmhg,2Nmhg] | (2Nmhg,4Nmhg] | (4Nmhg,+∞) |
| Indicator | Scenario | Action | |
|---|---|---|---|
| | < 0 | ESOCS is over the upper limit. The wind power is insufficient to satisfy both local demands and cluster power requested by the grid. | The total wind power is fed into the grid. The fuel cells discharge. Water electrolysis suspends, = 0. |
| = 0 | ESOCS is over the upper limit. The wind power is sufficient to satisfy both local and cluster power, the rest of the wind power is equal to 0. | The wind power is completely transferred to the grid. Water electrolysis suspends, = 0. | |
| ∈ Ƴ1 | ESOCS is over the upper limit. The wind power is sufficient to satisfy both local and cluster power. The rest of the wind power is within Ƴ1. | The wind power fed into the grid is set (Pload + Pjh), = . | |
| ∈ (Ƴ2 ∪ Ƴ3 ∪ Ƴ4) | ESOCS is over the upper limit. The wind power is sufficient to satisfy both local and cluster power. The rest of the wind power is within Ƴ2 or Ƴ3 or Ƴ4. | The wind power is used for water electrolysis which provide the hydrogen for methanol production. = and the rest wind power is transferred to the grid. | |
| | < 0 | ESOCS is within the normal range. The wind power is insufficient to satisfy the local demands. | The total wind power is fed into the grid. The fuel cells discharge with Pfc = ||. Water electrolysis process suspends, = 0. |
| ∈ (Ƴ1 ∪ Ƴ2) or ∈ (Ƴ3 ∪ Ƴ4) | ESOCS is within the normal range. The wind power is sufficient to satisfy the local demands. The rest of the wind power is within (Ƴ1 ∪ Ƴ2) or (Ƴ3 ∪ Ƴ4). | The fuel cells suspend. Wind power is used for water electrolysis which provide the hydrogen for methanol production with = || or = 2Pmhg. The rest wind power is fed to the grid. | |
| | = 0 | ESOCS is below the lower limit. No wind power provided. | Both The fuel cell and water electrolysis process suspend; No wind power is fed to the grid. |
| ∈ (Ƴ1 ∪ Ƴ2 ∪ Ƴ3) | ESOCS is below the lower limit. The wind power is within (Ƴ1 ∪ Ƴ2 ∪ Ƴ3). | All wind power is used for water electrolysis = . | |
| ∈ Ƴ4 | ESOCS is below the lower limit. The wind power is within Ƴ4. | The wind power used for water electrolysis is equal to 4Pmhg. The rest wind power is fed to the grid. | |
| <0 | =0 | >0 | ||
|---|---|---|---|---|
| <0 | - | - | select | |
| =0 | - | - | select | |
| >0 | Select | Select | ||
| Parameter | Value | Parameter | Value |
|---|---|---|---|
| Ue | 2 V | A | 50 cm2 |
| ηe | 80% | 14 | |
| R | 8.3145 J/mol·K | C | 3 F |
| VHcap | 60 m3 | −0.9514 | |
| VOcap | 60 m3 | 3.12 × 10⁻³ | |
| 5 × 10⁶ Pa | 7.4 × 10⁻⁵ | ||
| 5 × 10⁶ Pa | −1.87 × 10⁻⁴ | ||
| 4.499 × 10⁶ Pa | B | 0.016 | |
| 4.499 × 10⁶ Pa | Jmax | 1.2 A/cm2 | |
| TH | 298 K | ηf | 90% |
| TO | 298 K | Ifc | 25 A |
| 6.781 × 10⁻² mol/s·atm | Va | 0.005 m3 | |
| 6.781 × 10⁻² mol/s·atm | Vca | 0.01 m3 | |
| k′ | 0.9 | Pfc_max | 0.2 MW |
| N | 400 | Pfc_min | 2 × 10⁻⁴ MW |
| T | 350 K | NrH_max | 27,140 mol/s |
| l | 5.1 × 10⁻³ cm | 1.357 mol/s |
© 2017 by the authors. Licensee MDPI, Basel, Switzerland. This article is an open access article distributed under the terms and conditions of the Creative Commons Attribution (CC BY) license (http://creativecommons.org/licenses/by/4.0/).
Share and Cite
Yuan, T.; Duan, Q.; Chen, X.; Yuan, X.; Cao, W.; Hu, J.; Zhu, Q. Coordinated Control of a Wind-Methanol-Fuel Cell System with Hydrogen Storage. Energies 2017, 10, 2053. https://doi.org/10.3390/en10122053
Yuan T, Duan Q, Chen X, Yuan X, Cao W, Hu J, Zhu Q. Coordinated Control of a Wind-Methanol-Fuel Cell System with Hydrogen Storage. Energies. 2017; 10(12):2053. https://doi.org/10.3390/en10122053
Chicago/Turabian StyleYuan, Tiejiang, Qingxi Duan, Xiangping Chen, Xufeng Yuan, Wenping Cao, Juan Hu, and Quanmin Zhu. 2017. "Coordinated Control of a Wind-Methanol-Fuel Cell System with Hydrogen Storage" Energies 10, no. 12: 2053. https://doi.org/10.3390/en10122053
APA StyleYuan, T., Duan, Q., Chen, X., Yuan, X., Cao, W., Hu, J., & Zhu, Q. (2017). Coordinated Control of a Wind-Methanol-Fuel Cell System with Hydrogen Storage. Energies, 10(12), 2053. https://doi.org/10.3390/en10122053