Article

Are Developed Regions in China Achieving Their CO2 Emissions Reduction Targets on Their Own?—Case of Beijing

College of Environmental Sciences and Engineering, Peking University, No. 5 Yiheyuan Road, Haidian District, Beijing 100871, China
*
Author to whom correspondence should be addressed.
Energies 2017, 10(12), 1952; https://doi.org/10.3390/en10121952
Submission received: 26 August 2017 / Revised: 12 October 2017 / Accepted: 20 October 2017 / Published: 24 November 2017

Abstract

:
The extensive and close economic linkages among different regions of China have effects not only on regional economic growth, but also on CO2 emissions and carbon leakage among regions. Taking Beijing as a study case, we constructed MRIO models for China’s 30 provinces and municipalities for 2002, 2007 and 2010, to measure the embodied CO2 emissions in the interregional trade of China on regional and industrial levels to explore their changes over time, and to analyze the driving forces of the final demand-induced interregional CO2 emissions through an SDA model. Results showed that Beijing was a surplus region for embodied carbon and the net input embodied CO2 emissions were in industries with high CO2 emission coefficients, while the net output embodied carbon was in industries with low carbon-emission coefficients. Beijing’s trade with non-Beijing areas led to an increase in the total CO2 emissions in China and a composite effect of Beijing and the efficiency effect of non-Beijing areas were the main effects behind the reduction of Beijing’s input embodied carbon. The results have yielded important implications for China’s CO2 emissions control: first, the embodied CO2 need be taken into consideration when formulating CO2 emissions control measures; second, CO2 emission reduction requirements should be reasonably distributed across the provinces to reduce carbon leakage in interprovincial trade; third, the consumption structure in the production chain needs to be moderately adjusted; and last but not least, financial and technical support for CO2 emissions control in the central and western provinces should be strengthened.

1. Introduction

In this age of economic globalization, international trade has become an important part of global economic growth. It exerts a great influence not only on economic growth, but also on energy costs and CO2 emissions throughout the world. International trade separates production and consumption both among countries and within individual countries, allowing them to shift environmental problems to other regions. Confronted with the challenges brought on by global climate change, for example, developed countries have begun to transfer carbon-intensive enterprises to developing countries, concentrating their own efforts on low-carbon service-oriented products, and importing non-low-carbon products from developing countries. In this way, the developed countries can reduce their own CO2 emissions by transferring them to developing countries [1,2].
This shifting of the responsibility for CO2 emissions reduction has been driven by international implementation of the “polluter pays” system: i.e., the producer is responsible for all the CO2 emissions within his territory, from the processes of production, service, and energy consumption. The international community such as IPCC has adopted the principle of “production-based principle” as the basic basis for formulation of environmental policies, for which is relatively simple. However this approach does not take into account the difference between carbon emissions for export and domestic consumption, and does not indiscriminately put carbon emissions on the producer country [3]. Under such a principle, on the one hand, if a country replaces domestic production by importing foreign-made goods, the growing consumption demand of the developed countries is gradually met by developing countries through trade, that is, the developed countries reduce the carbon emissions through trade thus increasing carbon emissions in developing countries, and essentially transfers carbon emissions to other countries, resulting in carbon leakage [4]. Furthermore, it is not necessary for producers to bear the carbon responsibility in the process of production while enjoying the high living standard provided by imported products, which is unfair [5]. On the other hand, it is also likely to affect the effectiveness of carbon emission reduction, as the level of production technology in developing countries is usually relatively low, the carbon emissions from producing the same products are much more than those of developed countries [6,7,8]. In order to avoid these flaws, the consumer responsibility system has then be put forward, which proposes that consumers take responsibility for the CO2 emissions generated in the production process of their purchases, thus ameliorating the problem of carbon leakage [1,9]. In addition, this new system, in contrast to the producer responsibility system, evaluates the embodied carbon in trade and verifies the carbon-emission responsibilities of developed and developing countries more fairly, forming a basis for international repartition of CO2 emissions responsibility [1,9,10,11].
International trade exerts a great influence on both global and individual countries’ carbon emissions, and the import of carbon-intensive products from developing countries to developed ones has been a significant factor in the increase in developing countries’ carbon emissions over the past several decades. Furthermore, is there a similar trend within regions of China? The more developed regions transfer their industries to less developed regions, allowing the developed regions to upgrade their own industrial structure while also transferring their carbon emissions to the less developed regions. As the largest developing country in the world, China has enjoyed rapid, and so far, sustainable economic development since it started its reform and opening-up policy, but it also has the highest energy consumption and CO2 emissions, creating the dilemma of balancing economic growth and CO2 emissions reduction. With the aim of CO2 emissions reduction, China has been evaluating the implementation of emissions reduction strategies in every province (city and district) since the end of the 12th Five-Year-Plan. The Chinese government also promised in 2015 that China’s CO2 emissions per unit of domestic product (the carbon intensity) would decline by 60% to 65% by 2030, compared to 2005, even while reaching its total CO2 emissions peak in the interim [12]. With the recent economic integration of regions, the developed eastern regions have tended to transfer their pollution-intensive and resource-intensive industries to less developed regions. Some central and western provinces have even drawn up specialized industrial plans or policy preferences, or built industrial parks with the aim of receiving industries from the eastern regions. According to the calculations based on the input-output tables of each province, China’s interprovincial trade volume increased by a factor of 29 from 1987 to 2007, with an average growth rate of 143% every five years [13]. The CO2 emissions shift caused by the increasing interregional trade will greatly influence the CO2 emissions reduction for each province. Therefore, in order to reduce total CO2 emissions and effectively distribute this decrease among the different provinces, it is necessary to scientifically calculate the CO2 emissions for each province, and evaluate their influence on other provinces.
As the capital of China, Beijing has led the way in carbon emissions reduction and environmental protection. In order to achieve a pattern of green and low-carbon economic growth, Beijing has taken measures to reduce its non-capital functions, and these measures have risen to become a national strategy. Energy-intensive and high-emission projects such as steel and concrete industries have been forbidden, and have been transferred to surrounding provinces and municipalities (hereafter, provinces). Meanwhile, the productive service and high-technology industries like finance, technological services, electronics and information, energy conservation and environmental protection industries have developed rapidly; these tertiary industries have expanded, and made up 79.8% of the industrial output in Beijing in 2015. During the 11th Five-Year-Plan period, Beijing reached its goal of emissions reduction one year earlier than planned (The People’s Government of Beijing: The Plan for Saving Energy and Reducing Consumption, and Addressing Climate Change, during the 12th FYP Period. http://zhengwu.beijing.gov.cn/gh/gh/zxgh/t1416590.htm). During the 12th Five-Year-Plan period, energy consumption and carbon emissions per ten thousand yuan GDP decreased by 25.08% and 30%, respectively. These achievements have made Beijing the sole province that has over-fulfilled its annual assignment of CO2 emissions reduction over the last ten years. Furthermore, under the CO2 emissions-reduction targets in China, Beijing has been given higher target than provinces. In 2015, it was announced that Beijing was expected to reach its CO2 emissions peak in 2020, and plans would be implemented as soon as possible to meet a target of 20.5% lower CO2 emissions per ten thousand yuan GDP, compared to 2015 (The People’s Government of Beijing: The Plan for Saving Energy, Reducing Consumption, and Addressing Climate Change, during the 13th FYP Period. http://zhengwu.beijing.gov.cn/gh/dt/t1445501.htm).
Even though Beijing has done an excellent job in reducing its CO2 emissions, it has influenced the CO2 emissions of other provinces, and even China, due to interprovincial trade. Hence, it is necessary to study the embodied CO2 emissions transferred by Beijing to other provinces. That is, has Beijing really reached its goal of CO2 emissions reduction on its own? Or, to what degree have other provinces supported Beijing, to enable it to reach that goal?

2. Literature Review

Among the existed literature, these methods are usually used to calculate embodied carbon include: (1) Direct computation: Multiplying the trade balance by the CO2 emissions intensity. This method is limited by the availability of data and may lead to an oversimplified result [14]. (2) Life cycle assessment method (LCA): calculating the CO2 emissions by analyzing all material activity input throughout the entire life cycle of a product [10]. Because this method requires large amounts of data, it can only be applied to a few products for which complete data are available, and even then, there could be truncation errors [15]. (3) Input-output method (I-O): Put forward by Leontief in the 20th century, this method is currently the one most widely used, internationally. It was first used to analyze the balance between input and output among different departments, using an input-output table, and later applied in the field of resources and the environment. The input-output model can be further divided into: single-region input-output (SRIO); emissions embodied in bilateral trade (EEBT); and the multi-regional input-output model (MRIO) [16,17].
Research on international embodied carbon can be divided into three types, according to the research objects: (1) Embodied carbon among several countries or regions. Results usually show that under a multilateral trade system, developed countries are net importers of embodied carbon, while most developing countries are net exporters and therefore shoulder the consumptive carbon-emissions responsibility for the developed countries [1,18,19,20]. (2) Embodied carbon between bilateral trading partners. Most of this type of research focuses on trade between two developed countries or between one developed and one developing country, although some has focused on trade between two developing countries [21,22,23,24,25,26]. Research involving China has shown that it has always been a net exporter of embodied carbon, indicating that China has taken on great environmental burdens when it profits economically from trade [26]. (3) Embodied carbon of an individual country, which in most cases has focused on a developing country. Results show that, overall, productive carbon emissions of developing countries outweigh their consumptive carbon emissions [27,28,29,30,31]. To sum up, international trade exerts great influence on both global and individual countries’ carbon emissions, and the import of carbon-intensive products from developing countries to developed ones has been a significant factor in the increase in developing countries’ carbon emissions over the past several decades.
With the development of China’s input-output compilation technology and the publication of interregional input-output tables, there are quantitative researches of embodied carbon in China in recent years. Taking an overview of the research, several aspects need to be further addressed to be a complement:
(1)
Most existing analysis have measured embodied CO2 emissions either in total national export [32,33] or in bilateral trade with various trading partners [21,23,34]. These findings have implications for national CO2 emission-reduction policies and international negotiations [20,35,36]. However, research on embodied carbon in China’s interregional trade, which has only shown up recently, is necessary for two reasons. First, economic development in China varies sharply from region to region, more detailed regional analysis is required for embodied CO2 emissions studies [37,38], which would lay the foundation for distributing CO2 emissions-reduction responsibility among different regions [39]. Second, the embodied carbon induced by economic connections among regions cannot be neglected. For example, Zhong calculated the embodied carbon in 30 provinces (as well as cities and counties) of China, and his results show that the interregional embodied carbon in 30 provinces made up 60.02% of China’s total CO2 emissions in 2007 [40].
(2)
For the existing researches on embodied carbon of interregional trade in China, they mostly explore the flow and relationship of embodied carbon among regions or provinces. For example, M. Zhang analyzed the embodied carbon emission relationships between developed and developing areas, and found that regional carbon overflow in China is centered in the coastal areas, but that it causes an increase in carbon emissions in the central and western areas [41]. However, for a single region—especially for a developed region which is at the top of the industrial chain and produces knowledge-intensive and technology-intensive products—detailed in-depth research on the degree of dependence that region has on other regions’ carbon emissions in the interprovincial trade, is still rare.
(3)
The interregional flow of embodied carbon has been analyzed for only one selected year in general, however the time-variant and pattern analyses have seldom been conducted. For example, Su calculated the embodied carbon of eight regions of China in 1997, and found that the developed areas transferred their carbon emissions to developing ones within China, and that developed areas are therefore net importers of carbon emissions, while developing areas are net exporters [39]. However, a time-series comparative study can reflect variations in the embodied carbon flow over the long run [42], to better understand the long-term tendencies and even make an in-depth analysis of influencing factors, using a decomposition model. We therefore tested the temporal and spatial variations of embodied carbon, and discuss here its impact on regional CO2 emissions.
(4)
Some studies on embodied CO2 emissions of industries usually focus on the national aggregate analysis, assuming homogeneity in the spatial distributions of domestic production, however in fact production techniques differ greatly among regions [43], which only reflect the average economic production technology of one industry, without considering the provincial differences in production techniques and CO2 emissions intensity in the same industry [40]. Thus, attention need to be paid to interregional CO2 emissions transfer among different industries, for the emissions output has been driven by a particular sector in a particular region.
In this study, taking Beijing as a study case, we constructed MRIO models for China’s 30 provinces for 2002, 2007 and 2010, to measure the embodied CO2 emissions in the interregional trade of China on regional and industrial levels; to explore their changes over time; and to analyze its driving forces of the final demand-induced interregional CO2 emissions through an SDA model. Section 2 introduces the methodology of the MRIO model and the structural decomposition analysis model (SDA) used in this study, as well as the sources of the MRIO tables and CO2 emissions data. Section 3 presents and discusses the results from the MRIO analysis: first, the shift of net embodied carbon imported to Beijing, and its variation tendencies at the regional and industrial levels, were analyzed; next, Beijing’s influence on the increase in CO2 emissions throughout China, via interregional trade, was evaluated, using virtual scenario analysis; then, structural decomposition analysis (SDA) was performed on the embodied carbon that Beijing receives from other provinces during 2002–2010. In Section 4, we conclude our findings and highlight their implications with regard to the coordination of the CO2 emissions reduction pressure between Beijing and its surrounding areas, as well as China’s domestic CO2 emissions control policy.

3. Methodology and Data

3.1. Estimating CO2 Emissions Embodied in Trade

Embodied CO2 emissions in trade refers to the CO2 discharged by the entire production process of any given product, including direct emissions in the sector where the product is produced and indirect emissions in the upstream sectors that feed into the production process (intermediate inputs) [44]. To expand the evaluation analysis to a model that captures the complex interregional supply chains, we adopted here a multi-regional input-output model (MRIO), which was developed based on the single-region input-output (SRIO) model. MRIO abandons the import homogeneity hypothesis of the SRIO model and considers that the standards of technology are different in different regions, leading to different carbon emission coefficients as well. MRIO can not only depict the industrial relationships and trade links among provinces, but also reflects the feedback and spillover effects of the environment. The fundamental form of MRIO is:
X   =   A X   +   Y
The concrete form is:
[ X 1 X r X m ]   =   [ A 11 A 1 s A 1 m A r 1 A r s A r m A m 1 A m s A m m ] [ X 1 X r X m ]   +   [ Y 11 + Y 11 + + Y 1 m + E x 1 Y r 1 + Y r 2 + + Y r m + E x r Y m 1 + Y m 2 + + Y m m + E x m ]
where X r is a vector quantity based on the gross output of the industries in region r ; A r s is a matrix of the direct consumption coefficient between the industries in regions r and s ; Y r s is the final demand of region s from region r ; and E x r is the export of region.
The gross output can be determined through the calculation of final demand as:
X   =   r ( I     A ) 1 Y r
Carbon emissions in each region can be calculated as:
E r r =   D r X r =   D r r ( I     A ) 1 Y r r
E r s   =   D r X s   =   D r r ( I     A ) 1 Y r s
where D r is the carbon emissions intensity vector of region r , which is indicated by carbon emissions per unit of output; r = 1,2,…, m , indicate different regions; E r r   is the CO2 emissions vector of region r ; E r s is the CO2 emissions vector that region r outputs (or outflows) to region s ; and ( I     A ) 1 is the Leontief inverse matrix, which captures both direct and indirect inputs to satisfy one unit of final demand, in monetary value.
The matrix of embodied carbon in multi-regional trade can be obtained from Formulas (1) to (5):
[ E 11 E 1 s E 1 N E r 1 E r s E r N E N 1 E N s E N N ]
(1) The embodied carbon that Beijing receives from interprovincial trade ( E I ) can be determined as:
E I   =   E 11   + +   E r 1   + +   E N 1   =   r s D ^ ( L 11   + +   L r s + +   L n n ) F r 1 Z r 1
where D ^ is the matrix of carbon emissions intensity; L   =   ( I     A ) 1 , L r s indicates the Leontief inverse matrix between region s and region r ; and F r 1 is the consumption structure of region 1 (Beijing) from other regions r , and Z r 1 is the scale of final demand of region 1 (Beijing).
(2) The embodied carbon that Beijing outputs via interprovincial trade ( E O ) can be determined as:
E O = E 11 + + E 1 s + + E 1 m = r s D ^ ( L 11 F 11 + + L 1 r F 1 s + + L 1 n F m m )   Z 1 s
where F 1 s is the consumption structure of region s from region 1 ( Beijing ) , and Z 1 s is the scale of final demand of region s from region 1 (Beijing).
The net embodied carbon that Beijing receives from interprovincial trade ( E n e t ) is:
E n e t   =   E I     E O

3.2. Structural Decomposition Analysis

The current factorial decomposition methods are mainly Index Decomposition Analysis (IDA) and Structural Decomposition Analysis (SDA) [45]. The biggest difference between the two is that SDA is a comparative static analysis method based on input-output tables, which can comprehensively analyze all kinds of direct and indirect influencing factors (especially the indirect impact of a change in demand from one department, on other departments) using an input-output model; and IDA cannot [46]. As for the application conditions, SDA has a higher data requirement than IDA, as the latter needs only the aggregate data of departments [45]. Because our research was based on the MRIO model, we used an SDA for estimating the relative importance of each of the scale, efficiency, technical and composition effects, to the changes in CO2 embodiment in trade, over the periods of 2002–2007 and 2007–2010. We adopted the I-O SDA to study the contributions of the various factors.
There are usually four forms for SDA: ① Retain the cross term; ② Do not retain the cross term but assign it to each variable, at different weights; ③ Weighted average; ④ Geometric average of the two polar decompositions, or the central point weight decomposition method [45]. Method ① cannot explain all the impacts brought about by one independent variable on the dependent variables, because of the cross term. Method ② cannot match the weights when merging into the cross term. Method ③ is complete in theory, but requires a large number of calculations. Method ④ is approximate solution to method ③ and is relatively intuitive. For these reasons, we used the polar decomposition method ④ to perform the factor decomposition analysis. The factors that cause changes in embodied carbon are decomposed into four factors: total demand amount (scale effects), demand structure (composition effects), carbon emission intensity (efficiency effects) and intermediate production technology (technical effects) to quantitatively survey the amount and rate of contribution to Beijing’s input of trade-embodied carbon.
The decomposition model of embodied carbon input to Beijing is as follows:
Subscripts 1 and 0 indicate the calculation period and the baseline period, respectively. To quantitatively survey the factors that affect embodied carbon emissions in two periods, the embodied carbon that Beijing received from non-Beijing of China Δ E can be decomposed using the polar decomposition method based on (7).
Δ E   =   D 1 ^ · L 1 · F 1 · Z 1     D 0 ^ · L 0 · F 0 · Z 0
If we decompose from the calculation period (Period 1), Δ E can be decomposed as follows:
Δ E   =   Δ D ^ · L 1 · F 1 · Z 1   +   D 0 ^ · Δ L · F 1 · Z 1   +   D 0 ^ · L 0 · Δ F · Z 1   +   D 0 ^ · L 0 · F 0 · Δ Z
If we decompose from the baseline period (Period 0), Δ E can be decomposed by:
Δ E   =   Δ D ^ · L 0 · F 0 · Z 0   +   D 1 ^ · Δ L · F 0 · Z 0   +   D 1 ^ · L 1 · Δ F · Z 0   +   D 1 ^ · L 1 · F 1 · Δ Z
The arithmetic average, Δ E can be obtained by:
Δ E   =   1 2 Δ D ^ ( L 0 F 0 Z 0 + L 1 F 1 Z 1 )   +   1 2 ( D 0 ^ Δ L F 1 Z 1 + D 1 1 ^ Δ L F 0 Z 0 )          + 1 2 ( D 0 ^ L 0 Δ F Z 1 + D 1 ^ L 1 Δ F Z 0 )   +   1 2 ( D 0 ^ L 0 F 0 Δ Z   +   D 1 ^          L 1 F 1 Δ Z )
where f ( Δ D ^ )   =   1 2 Δ D ^ ( L 0 F 0 Z 0   +   L 1 F 1 Z 1 ) , which indicates the impact of a change in the direct emissions intensity in each province D ^ (efficiency effects) on the change of embodied carbon input to Beijing Δ E .
f ( Δ L )   =   1 2 Δ L ( D 0 ^ F 1 Z 1 +   D 1 ^ F 0 Z 0 ) , which indicates the impact of a change in the Leontief inverse matrix L for each province (technical effects) on the change of embodied carbon input to Beijing Δ E .
f ( Δ F )   =   1 2 Δ F ( D 0 ^ L 0 Z 1   +   D 1 ^ L 1 Z 0 ) , indicates the impact of the change of final demand structure in Beijing F (composition effects) to other provinces on the change of embodied carbon input to Beijing Δ E .
f ( Δ Y )   =   1 2 Δ Z ( D 0 ^ L 0 F 0   +   D 1 ^ L 1 F 1 ) , stands refers to the impact of the change of final total utilization in Beijing from other provinces Z (scale effects) on the change of embodied carbon input to Beijing Δ E .

3.3. Data Sources and Processing

Multi-regional IO tables and sectoral CO2 emissions data for each province were required to apply the input–output analysis. The 42-sector input-output tables for each of the 30 provinces (excluding Tibet, Hong Kong, Macau, and Taiwan) for the years 2002, 2007 and 2010 have been published by the National Statistical Bureau of China (NSBC) [47,48,49]. Liu et al., estimated the trade flows among provinces using the well-known gravity model, and compiled a 30-sector MRIO table of the 30 provinces, in 2007 and 2010, based on these provincial input-output tables [50,51]. This MRIO table met the desired requirement of our analysis and was directly adopted. As for the MRIO table for 2002, based on the interprovincial trade flows of 42 sectors estimated by Li using the gravity model, Liu constructed the 2002 China MRIO table following the Chenery-Moses compilation method: the same method as that adopted by Liu et al. [13]. To eliminate the impact of price changes between years, based on the GDP indices of related industries (ecological-finance industry, construction industry, tertiary industry), the MRIO tables for 2002 and 2007 were inflation-adjusted to the 2010 price.
Using available data and matching, our analysis was based on the Chinese multi-regional IO tables of 2002, 2007, and 2010, for several reasons. First, these tables represented the most recent and most complete data of all the published MRIO tables, for China. According to the administrative division of mainland China in the tables, they consist of 30 regions at the provincial level (including 22 provinces), five autonomous regions (Inner Mongolia, Guangxi, Xinjiang and Ningxia, not including Tibet) and four municipalities (Beijing, Shanghai, Tianjin and Chongqing). Second, the noncompetitive imports assumption, which excludes imports from interprovincial trade in China from the empirical study, can avoid overestimation. Third, these multi-regional IO tables provide the data for China’s 30-province trade for 30 sectors, which are important for the calculation of emissions embodied in inter-sectoral and interprovincial trade.
Because CO2 emissions of provinces in China are not available directly on the National Bureau of Statistics website, we adopted CO2 emissions data from the Chinese Emission Accounts and Datasets (CEADS) database [52], which includes data for 45 sectors in 30 provinces in China [53]; the provinces involved in the research are listed in Table 1. The CO2 emissions data were calculated for 20 types of energy (Raw Coal, Cleaned Coal, Other Washed Coal, Briquettes, Coke, Coke Oven Gas, Other Gas, Other Coking Products, Crude Oil, Gasoline, Kerosene, Diesel Oil, Fuel Oil, LPG, Refinery Gas, Other Petroleum Products, Natural Gas, Non-fossil-fuel Heat, Non-fossil-fuel Electricity, and Other Energy) and an industrial production process (cement).
The number of sectors differs between provincial IO tables and CO2 emissions data from the CEADS database, in that there are 30 sectors in the MRIO table and 42 sectors in the CEADS database. According to the characteristics of the data, we merged the sectors of CO2 emissions data from the CEADS database and the MRIO table into 27 sectors, as described in Table 2.

4. Results and Discussion

4.1. Analysis Based on Regions

4.1.1. Beijing and other Areas in China

Comparing the transfer of domestic trade volume with the embodied carbon of Beijing (Table 3), it can be found that:
In terms of the net trade output from Beijing to non-Beijing provinces of China, the output trade volume was greater than the input trade volume. The net trade input increased from −772.86 billion yuan in 2002, to 234.60 billion yuan in 2007, and to 822.26 billion yuan in 2010. And the net embodied carbon flow in Beijing also increased, gradually, from 33.5852 million tons in 2002, to 78.9341 million tons in 2007, and then to 92.789 million tons in 2010, which respectively accounted for 46.91%, 86.42% and 103.14% of the total annual CO2 emissions in Beijing (Table 3).
By comparing the dependence degree of interprovincial consumption-based carbon (Table 3), it can be found that the value gradually increased from 29.63% in 2002 to 56.51% in 2010, indicating that more than half the CO2 emissions of Beijing were transferred through domestic trade, by transferring its own CO2 emissions reduction pressure to other areas of China, in 2010.
Furthermore, in view of the CO2 emissions intensity-reduction targets in China, we compared and analyzed the annual average change rate of production-based CO2 emissions intensity and the annual average change rate of consumption-based CO2 emissions intensity for Beijing during 2002–2007, 2007–2010 and 2002–2010 (Table 4). The results showed that the annual average change rate of production-based CO2 emission intensity always decreased, in all the time periods. For example, there was an average decrease of 77.19% per year during 2002–2010. While the annual average change rate of consumption-based CO2 emissions intensity decreased during 2002–2007, it increased rapidly during 2007–2010, resulting in an overall annual average change rate of 54.38% over the period of 2002–2010. Hence it can be seen that although Beijing realized a gradual decrease in CO2 emissions intensity from the production point of view, it showed a rising trend for CO2 emissions intensity from the consumption aspect. This result indicates that Beijing’s realize its target mainly by consuming products in other provinces.

4.1.2. Regional Sources

(1) Embodied carbon flowed in Beijing
The input trade volume to Beijing from other regions of China first increased and then decreased, from 15.5903 million yuan in 2002 to 24.875 million yuan in 2007, and then down to 17.1775 million yuan in 2010. However, during that period, the total input of embodied carbon in trade from other areas to Beijing increased gradually, from 65.4133 million tons in 2002 to 108.7026 million tons in 2007, and then to 116.3458 million tons in 2010.
By comparing the embodied carbon flowed from other areas to Beijing, it can be found that the embodied carbon from Hebei, Shanxi, Inner Mongolia, Shandong and Henan were the highest. For example, embodied carbon from Hebei increased from 10.6055 million tons in 2002 to 27.025 million tons in 2007 and to 27.1128 million tons in 2010 (Figure 1). It can be seen that the Beijing’s production processes have the largest external dependencies, for reducing its local CO2 emissions, on Hebei, Shanxi and Inner Mongolia, mainly through the input of products from surrounding areas such as Tianjin and Hebei.
(2) Embodied carbon output from Beijing
The output volume of goods from Beijing was on the rise, from 23.7012 million yuan in 2002 to 34.1215 yuan in 2007, and to 53.3262 yuan in 2010, while during this same period, the output embodied carbon in trade from Beijing continued to decline, from 31.3869 million tons in 2002 to 27.7785 million tons in 2007, and then to 24.286 million tons in 2010. The largest outputs of embodied carbon in trade were to Tianjin, Shanghai, Jiangsu, Zhejiang, et al. (Figure 2).
(3) Net embodied carbon flowed in Beijing
The net input of embodied carbon to Beijing were mainly from the surrounding areas such as Hebei, Inner Mongolia, Shanxi and Shandong, in 2002, 2007 and 2010. The main net output of embodied carbon was Guangxi, Guangdong, Fujian, Hainan in 2002; Zhejiang, Jiangxi in 2007; and Qinghai, Guangxi, Fujian in 2010, most of which were far from Beijing, in the eastern coastal developed areas. The results showed that Beijing receives products from surrounding areas to meet its local needs, at the same time transferring CO2 emissions to other regions (Figure 3).
As for the net embodied carbon flowed in Beijing from 2002 to 2010, Inner Mongolia, Hebei, Shandong, Shanxi increased the most. Among these, the largest increase was from Hebei in 2002–2007, and from Inner Mongolia in 2007–2010. In addition, Tianjin, Shanghai, Zhejiang, Jiangxi and Chongqing first showed net input of embodied carbon from Beijing in 2002–2007, and then showed net output of embodied carbon to Beijing in 2007–2010. Jilin, Fujian, Henan, Hunan, Guangxi and Xinjiang, on the other hand, first showed net output of embodied carbon to Beijing in 2002–2007, then net input of embodied carbon from Beijing in 2007–2010 (Figure 4). These results indicate that Beijing was increasingly dependent on Inner Mongolia, Hebei, Shandong, Shanxi and surrounding underdeveloped areas for importing products and thereby transferring CO2 emissions. These results are also in line with He (2009) who found some “pollution haven” evidences in China based on panel data for Chinese provinces from 1991 to 2000 [54]. Similarly, the results of Liu (2015) showed that through interregional production linkages, Guangdong partly outsources its emissions to other provinces, especially provinces in the central and western regions [13].

4.2. Analysis Based on Specific Industries

Aggregate analysis of industry at national level neglects the connections among regions [32,39], which cannot reflects the specific geographic distribution of embodied emissions in specific industries. Therefore, we analyzed the embodied carbon in industries of Beijing, which is important in understanding the CO2 emissions impact of interregional trade through industries.
From the perspective of trade structure, the industry with the largest volume of net input was (S17) the transportation equipment manufacturing industry in 2002, and (S6) the food manufacturing and tobacco processing in 2007 and 2010. The industry with the largest volume of net trade output was (S27) accommodations and catering (Figure 5). From the perspective of embodied carbon: the industries with the largest volumes of net embodied carbon flowed in were (S22) production and supply of electricity and heat, (S14) smelting and pressing of ferrous metals, and (S25) transportation and storage, in 2002, 2007, and 2010, respectively. The industry with the largest embodied carbon flowed out was (S27) accommodations and catering (Figure 6).
In addition, there was a large difference in carbon-emission intensities between Beijing and the average for non-Beijing regions in China (Table 5). The CO2 emissions intensities of industries in Beijing tended to become gradually lower than the average value of non-Beijing regions, between 2002 and 2010. There were 8 industries in Beijing that had higher CO2 emissions intensities than the average value in 2002 (noted with “▲”), but only 5 industries were higher than the average value in 2010. For example, the CO2 emissions intensity of (S22) production and supply of electricity and heat in Beijing decreased from 11.63 tons/ten thousand yuan (9.81 tons/ten thousand yuan for average value of non-Beijing areas) in 2002 down to 1.74 tons/ten thousand yuan (9.59 tons/ten thousand yuan for average value of non-Beijing areas) in 2010. While for the (S25) transportation and storage, although the CO2 emissions intensity of Beijing in 2002 was 0.74 tons/ten thousand yuan, which was bigger than the average value of non-Beijing areas (0.58 tons/ten thousand yuan), it was down to 0.71 tons/ten thousand yuan which was smaller than the average (9.59 tons/ten thousand yuan) in 2010. That is because coal use and energy-intensive activities such as the production of infrastructure were dominant, and economies were growing rapidly in most of the central, northwestern, and southwestern provinces in China [55]. In contrast, the more established economies were in the eastern provinces, such as Beijing, which were the least carbon-intensive.
Here it can be seen that the net embodied CO2 emissions flowed in Beijing came from the energy production industry, with high CO2 emissions intensity, while that flowed out was from industries such as services and light industry, with low CO2 emissions intensities. Although the industrial restructuring of Beijing played an important role in curbing CO2 emissions, the consumption of secondary products had not been reduced even as the proportion of the secondary industry had declined, only now its demand was being met by production in other regions of China. In other words, Beijing established a trade model that brought in high-carbon products or services with low value, and exported low-carbon products or services with high value, by virtue of the advantages of science and technology, resulting in a large indirect increase in CO2 emissions in other areas, and a decrease in its own CO2 emissions. This is why Beijing had maintained a net input of embodied carbon. These results are similar to those of Feng, which demonstrated that the highly-developed areas of China, such as Beijing–Tianjin, import large quantities of low value-added, carbon-intensive goods from less developed Chinese provinces in the central, northwestern, and southwestern regions. They also found that the most affluent regions in outsource more than 50% of the emissions related to the products they consume to provinces where technologies tend to be less efficient and more carbon-intensive [55].

4.3. Virtual Scenario Analysis

In order to reassess how much the local CO2 emissions in Beijing were avoided by the consumption of products from other regions, we created a virtual scenario. The assumption was that the products actually imported to Beijing from other provinces in China were instead produced in Beijing, meaning the CO2 emissions intensity of each sector in other province is consistent with that in Beijing [2]. Then we compared the amounts of embodied CO2 emissions flowed in Beijing in virtual scenario with the actual ones in 2002, 2007, and 2010 (Table 6).
According to the results in Table 6, the total amounts of local carbon emissions avoided by net input products to Beijing in 2002, 2007 and 2010 were 16.2876 million tons, 30.2311 million tons and 56.2136 million tons respectively, accounting for 21.10%, 44.14% and 79.34% of the annual total CO2 emissions in Beijing. The actual net input embodied carbon in trade was greater than that under the virtual scenario, indicating that because products were imported to Beijing from other provinces, more CO2 emissions were added to China than were avoided, and that the transfer of CO2 emissions from Beijing to other regions, through domestic trade, increased the CO2 emissions overall.
Among these increases, the largest were from Hebei, Shanxi and Inner Mongolia, and the actual net input of embodied carbon from these provinces was greater than the virtual one in 2002, 2007 and 2010. In 2010, the differences for these provinces were 6.922, 6.3468, and 9.2209 million tons, respectively, indicating that by importing products from these areas rather than producing them locally, Beijing added the most of all the provinces, to the CO2 carbon emissions of China, mainly because of the technological inequality between Beijing and these other areas.

4.4. Decomposition Results in the Aggregate of Embedded Carbon Input to Beijing

4.4.1. Decomposition Results in Aggregate

Using the decomposition formulas of Equations (10)–(13), the decomposition results for embodied CO2 emission changes flowed in Beijing ( Δ E ) between 2002 and 2010 are shown in Table 7. These results quantify the contributions of the consumption scale of Beijing (scale effect), the consumption composition of Beijing (composition effect), the production techniques of non-Beijing regions (technical effect), and the CO2 emissions efficiencies of non-Beijing regions (efficiency effect), to the reduction of embodied carbon input to Beijing. For each effect, a negative value means an emission-reductive effect to the emission change from the calculation year to the base year, and vice versa.
As Table 7 shows, during the 2002–2010 period, the influx of embodied carbon to Beijing increased by 50.6656 million tons. The structural effect of Beijing was −13.7188 million tons, accounting for −27.08% of the total reduction in emissions, which was the main reason for CO2 emissions reduction during this period.
The efficiency effect of non-Beijing regions was −1.6763 million tons, accounting for −3.31% of the total reduction in CO2 emissions, and was the second most important contributor to emissions reduction, indicating that low-carbon production technology was also the dominating contributor to CO2 emissions reduction. This result is consistent with both Guan et al., and Liang et al., who found that emission intensity was a vital factor in reducing emissions [56,57].
The technical effect of the non-Beijing areas was 38.6959 million tons, accounting for 76.39% of the total increases in emissions, demonstrating that the effect of production techniques in non-Beijing areas was the main cause of the embodied CO2 emissions increase during this period. This result is consistent with that of Guan et al., who showed that a change in the production structure increased PM2.5 emissions between 2005 and 2010 [56]. Studies on energy and carbon emissions have also shown that production structure change is an emission-increasing factor [58].
The scale effect of Beijing was 27.3579 million tons, accounting for 54.00% of the total reduction in emissions, and was the second most important factor in emissions increase, indicating that the trade scale significantly offset the emission reductions from other factors. This is consistent with the results that the scale of international trade is a driver of China’s CO2 emissions growth [59] and PM2.5 emission changes [56].

4.4.2. Further Analysis of Each Effect

In this section, we further analyze the effects of each factor and discuss the main contributions to CO2 emissions reduction.
(1)
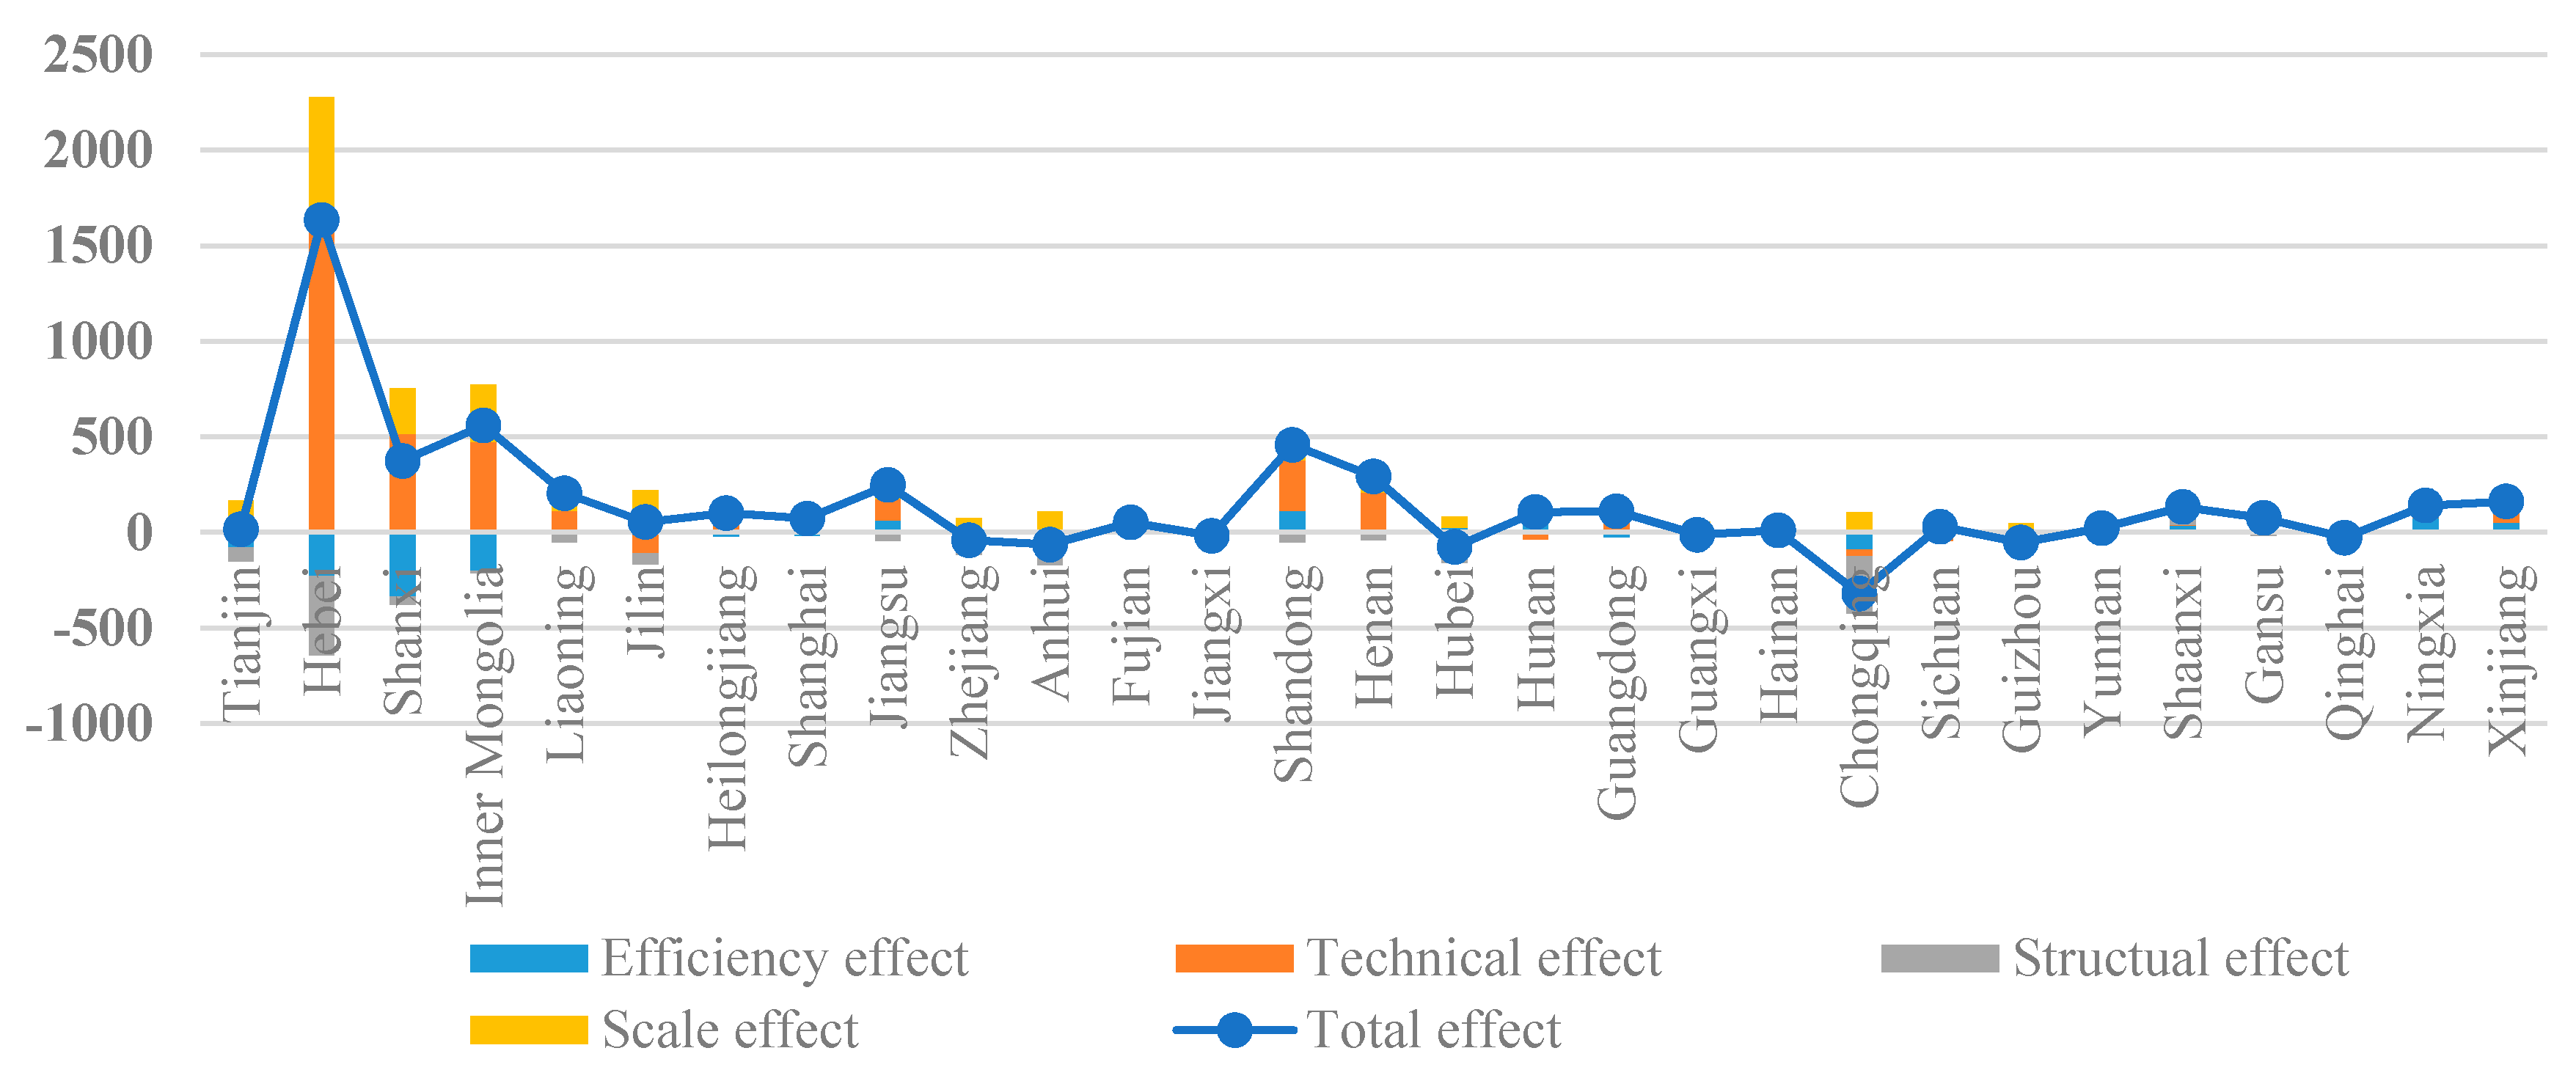
Technical effect: During the period of 2002–2007, the increase in embodied carbon caused by the technical effect in non-Beijing areas was 30.8844 million tons, accounting for 72.71% of the total embodied carbon; during the period of 2007–2010, the technical effect was responsible for 2.4654 million tons, accounting for 30.14% of the total embodied carbon. We can see that the technical effect has gradually decreased: that is, the production technology in non-Beijing areas has gradually improved.
(2)
Efficiency effect: During the period of 2002–2007, the efficiency effect of non-Beijing areas was -3.3518 million tons, accounting for −7.89% of the total embodied carbon reduction; during the period of 2007–2010, the efficiency effect was responsible for 7.0255 million tons, accounting for 85.88% of the increase in embodied carbon. It can be seen that although the efficiency effect of non-Beijing areas was a decreasing one during 2002–2007, the CO2 emissions efficiency of non-Beijing areas decreased, and was much more backward compared with Beijing, during 2007–2010.
(3)
Composition effect: During the period of 2002–2007, the composition effect of non-Beijing areas was −12.7620 million tons, accounting for −30.04% of the total embodied carbon reduction; during the period of 2007–2010, the composition effect was responsible for 0.6224 million tons, accounting for 7.61% of the total embodied carbon increase, indicating that the import trade structure of Beijing changed for the worse in terms of low-carbon development.
(4)
Scale effect: During the period of 2002–2007, the scale effect of non-Beijing areas was 27.7070 million tons, accounting for 65.23% of the total embodied carbon increase; during the period of 2007–2010, the scale effect was responsible for −1.9323 million tons, accounting for −23.62% of the total embodied carbon reduction. The embodied carbon caused by the scale effect turned from a positive effect in 2002–2007 to a negative effect, due to the decrease in imported trade volume to Beijing, by 2.3414 million yuan, during 2007–2010.
During the period of 2002–2007, the efficiency effect of non-Beijing provinces and the composition effect of Beijing were the main decreasing effects for the embodied carbon input to Beijing, and the technical effect of non-Beijing provinces and the scale effect of Beijing were the main influences on the increase in embodied carbon. Between 2007 and 2010, the scale effect of Beijing turned negative and the technical effect decreased, while the efficiency and composition effects transformed to become positive effects on the embodied carbon increase. Therefore, upgrading CO2 reduction technology in non-Beijing regions and adjusting the trade structure of products imported to Beijing would help improve the emissions situation.

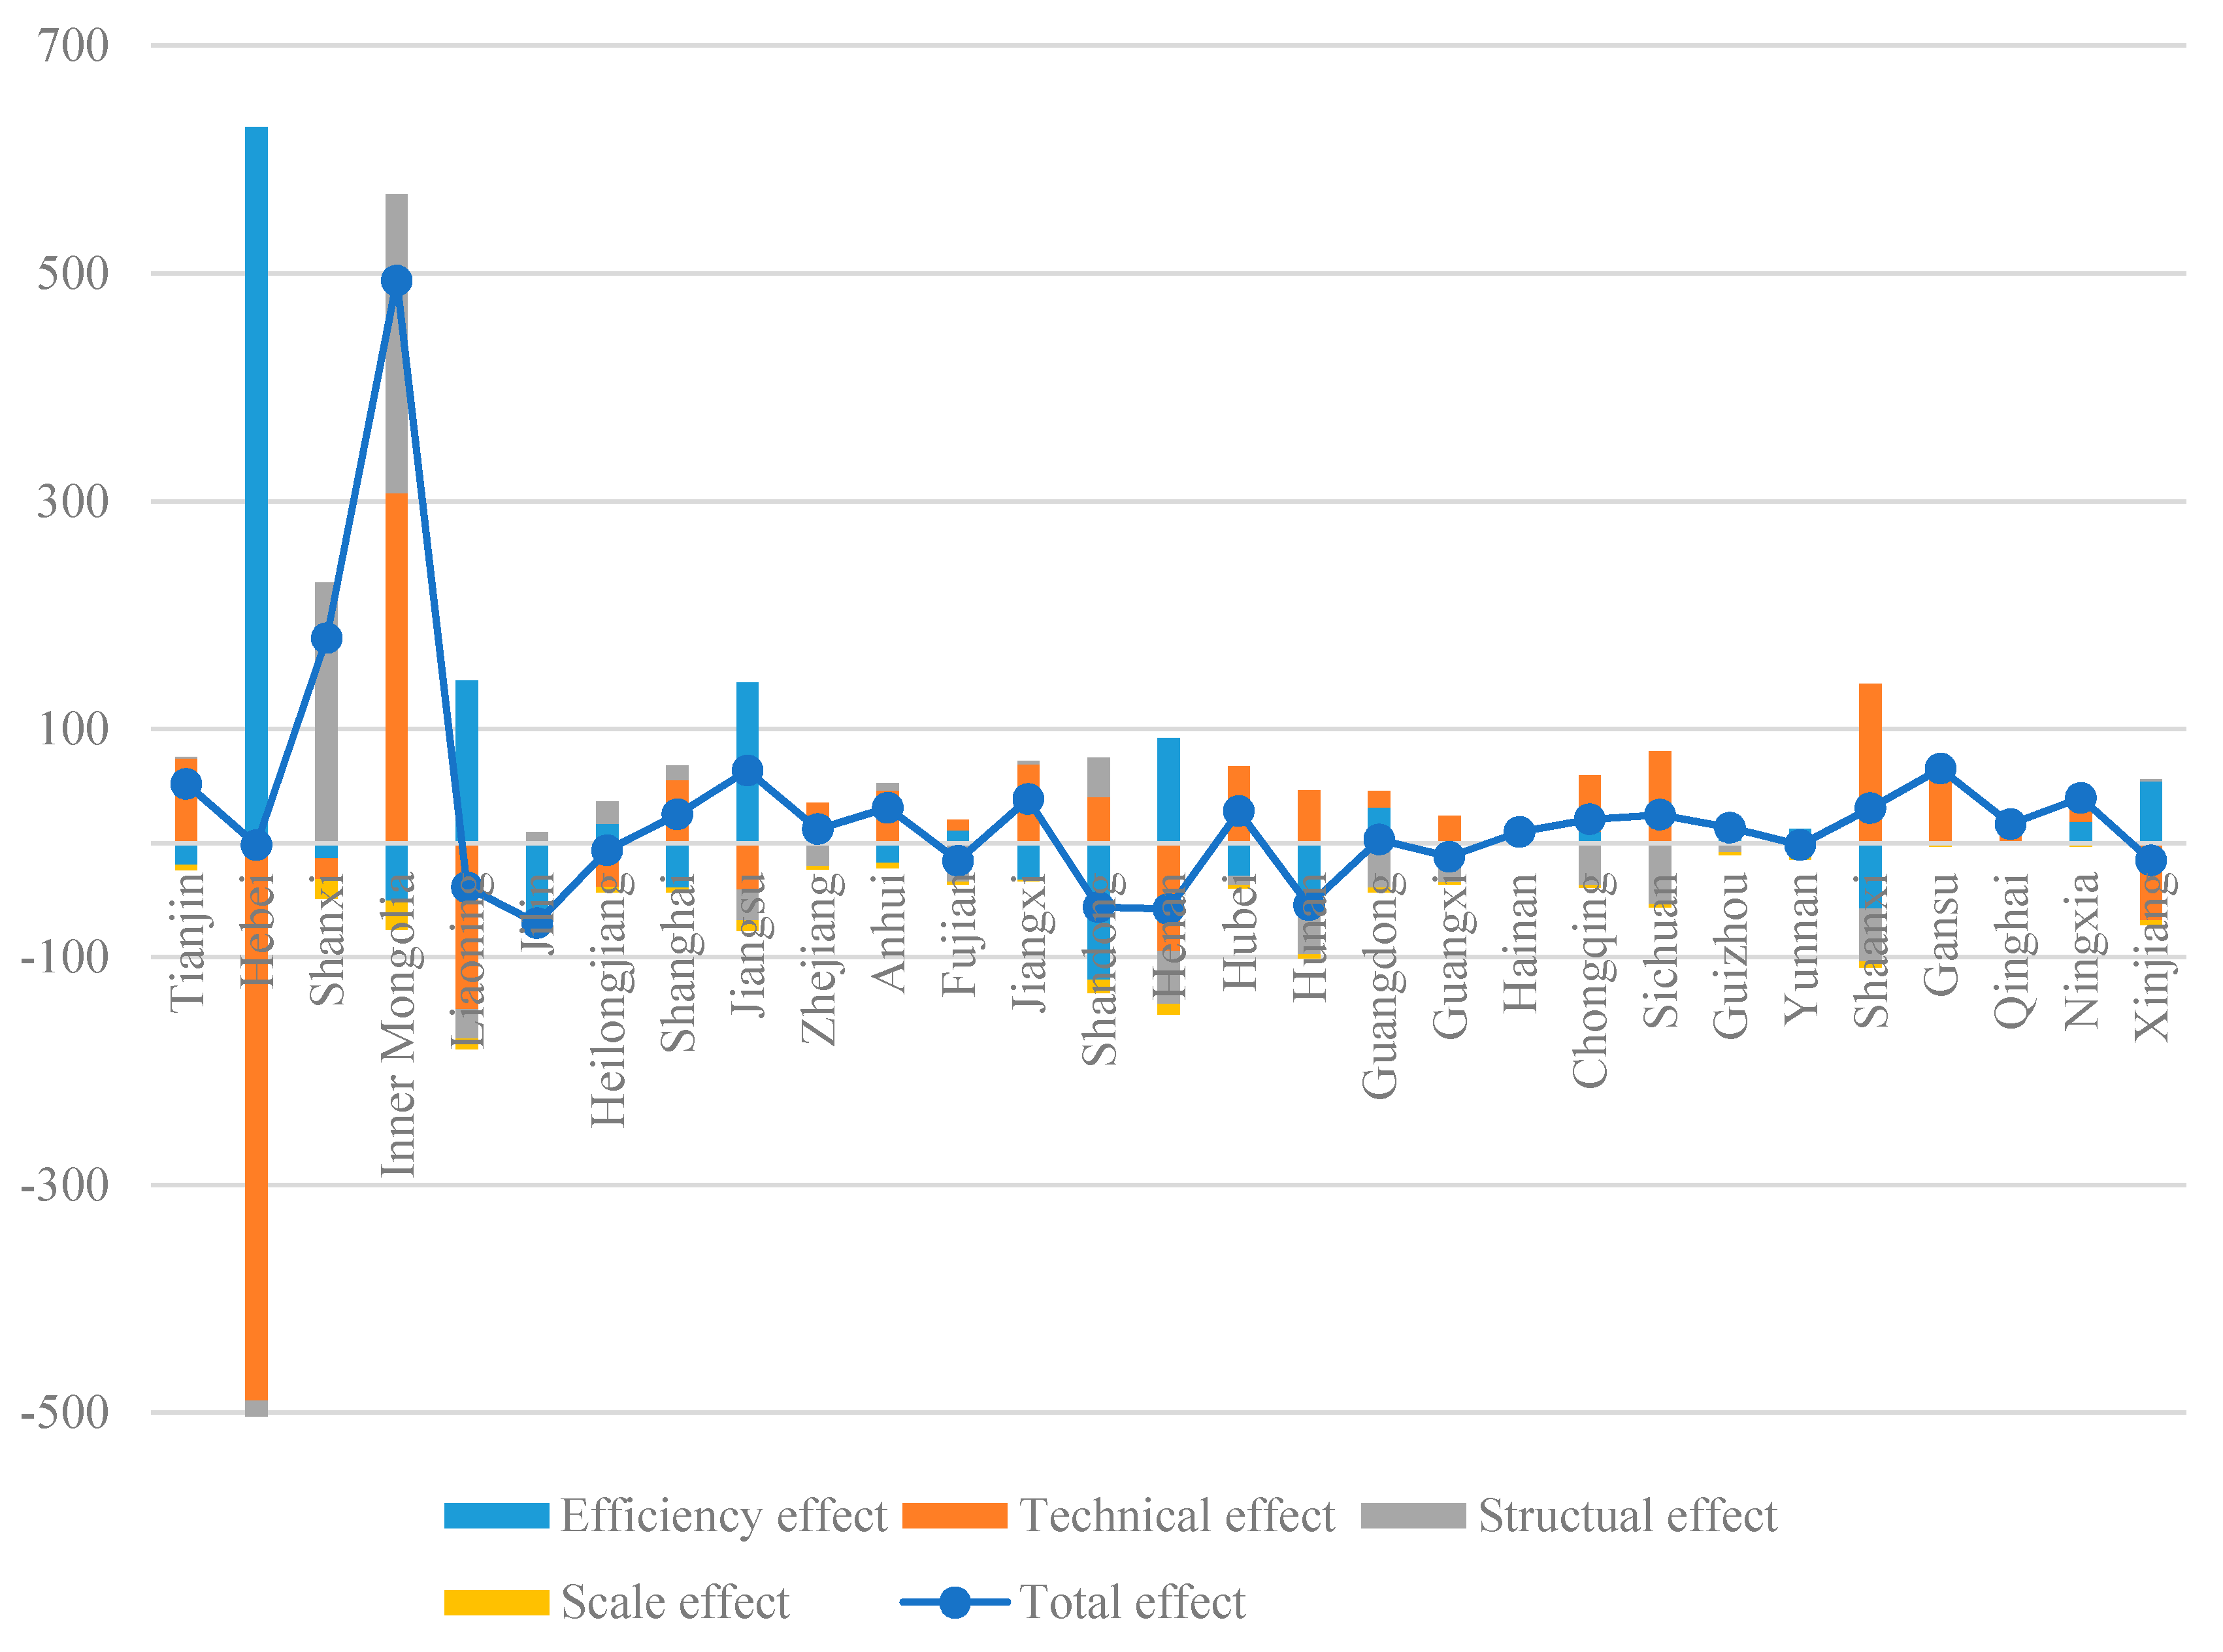
4.4.3. Decomposition Analysis in Each Province

During the period of 2002–2007 (Figure 7), the scale effect was an increasing effect for all of the provinces; the efficiency and technical effects were the main increasing ones on embodied carbon, in 20 provinces and 16 provinces, respectively; while the composition effect was a decreasing one for 24 provinces.
Between 2007 and 2010 (Figure 8), the efficiency and technical effects were still the main ones for increasing embodied carbon for most of the provinces, and the composition effect was a decreasing one for only 16 provinces. The scale effect, however, was transformed to a decreasing effect for all of the provinces. It can be seen that for most of the provinces in the two periods, the efficiency and technical effects had increasing effects on embodied carbon emissions to Beijing, and the composition effect was a decreasing one for most provinces; while the scale effect changed from a decreasing one to an increasing one, because of the abatement in the trade scale that Beijing imported from non-Beijing provinces.
However, the effects changed for many provinces, between the two time periods: 2002–2007 and 2007–2010. For example, for Hebei, a province with a large output of embodied carbon to Beijing, the efficiency effect was a reducing one in 2002–2007, but an increasing one in 2007–2010; while the technical and scale effects were increasing ones in 2002–2007, but became reducing ones in 2007–2010, indicating that compared with Beijing, Hebei’s production technology has improved but its CO2 emissions efficiency has decreased, and its trade scale to Beijing has declined. Clearly, our findings provide more detail on the contribution of specific factors and their provincial distribution to emissions, compared to previous studies.
To sum up, even though the decrease in the trade scale from non-Beijing regions to Beijing made a contribution to the scale effect for embodied carbon reduction, the efficiency and technical effects of non-Beijing areas largely offset the emission reductions from the scale effect, making the improvement of CO2 emissions efficiency and production techniques of non-Beijing regions the key factors in reducing the embodied carbon input to Beijing.

5. Conclusions and Policy Implications

5.1. Conclusions

Using an interregional input-output model (MRIO) of China, and taking Beijing as a research case, the embodied carbon flows in the interprovincial trade in 2002, 2007 and 2010 were measured at the regional and industrial level, and the factors affecting the changes in embodied carbon were decomposed and analyzed. The empirical results included the following:
(1)
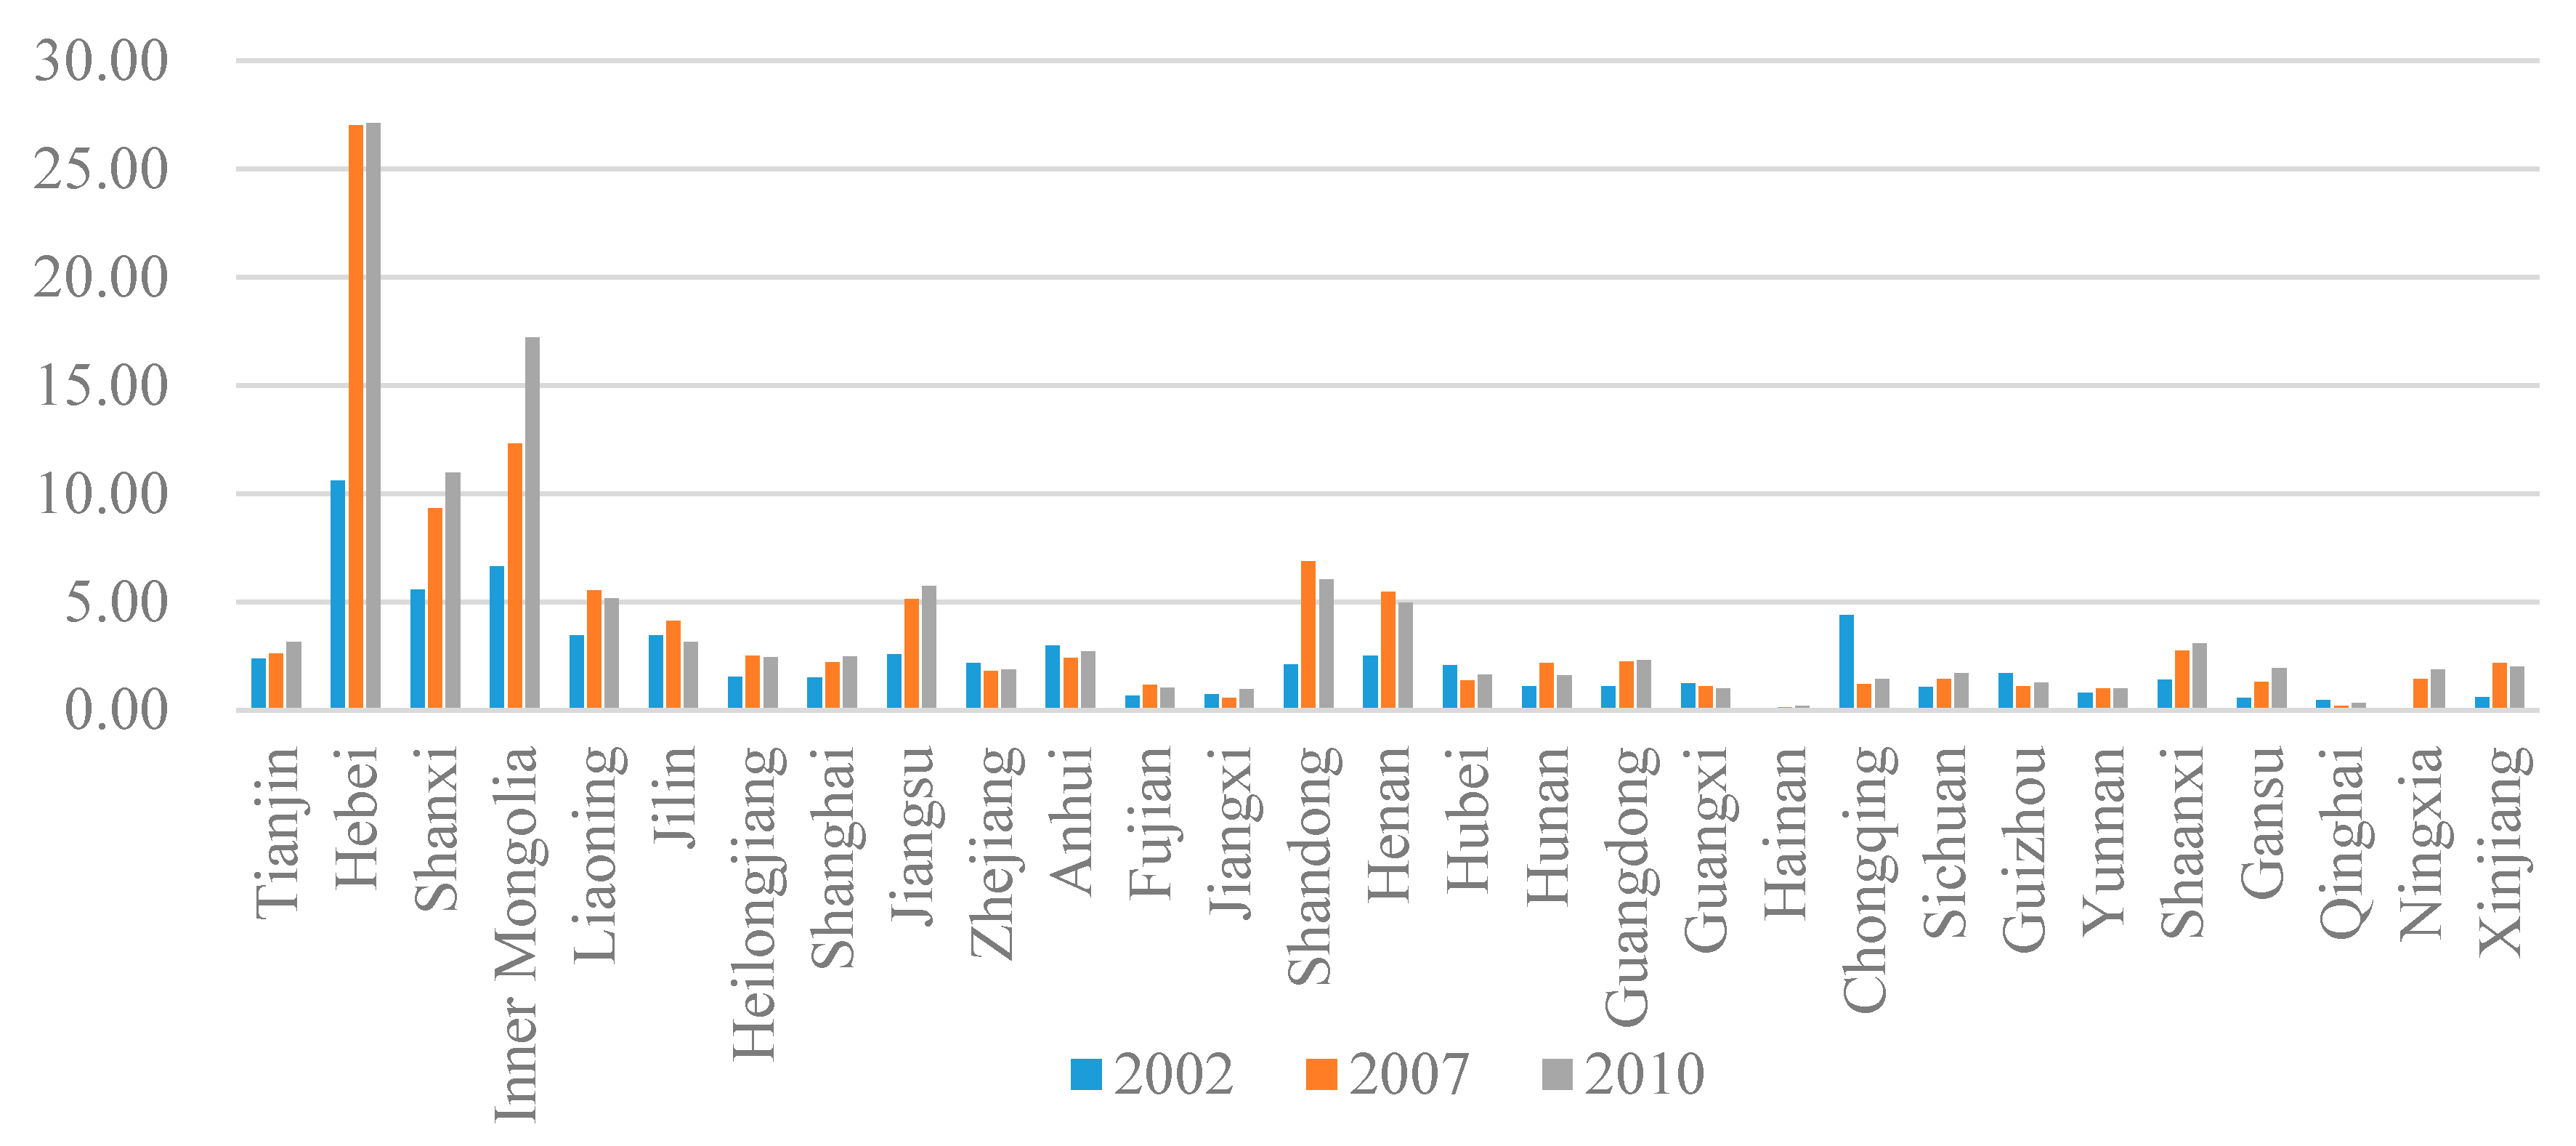
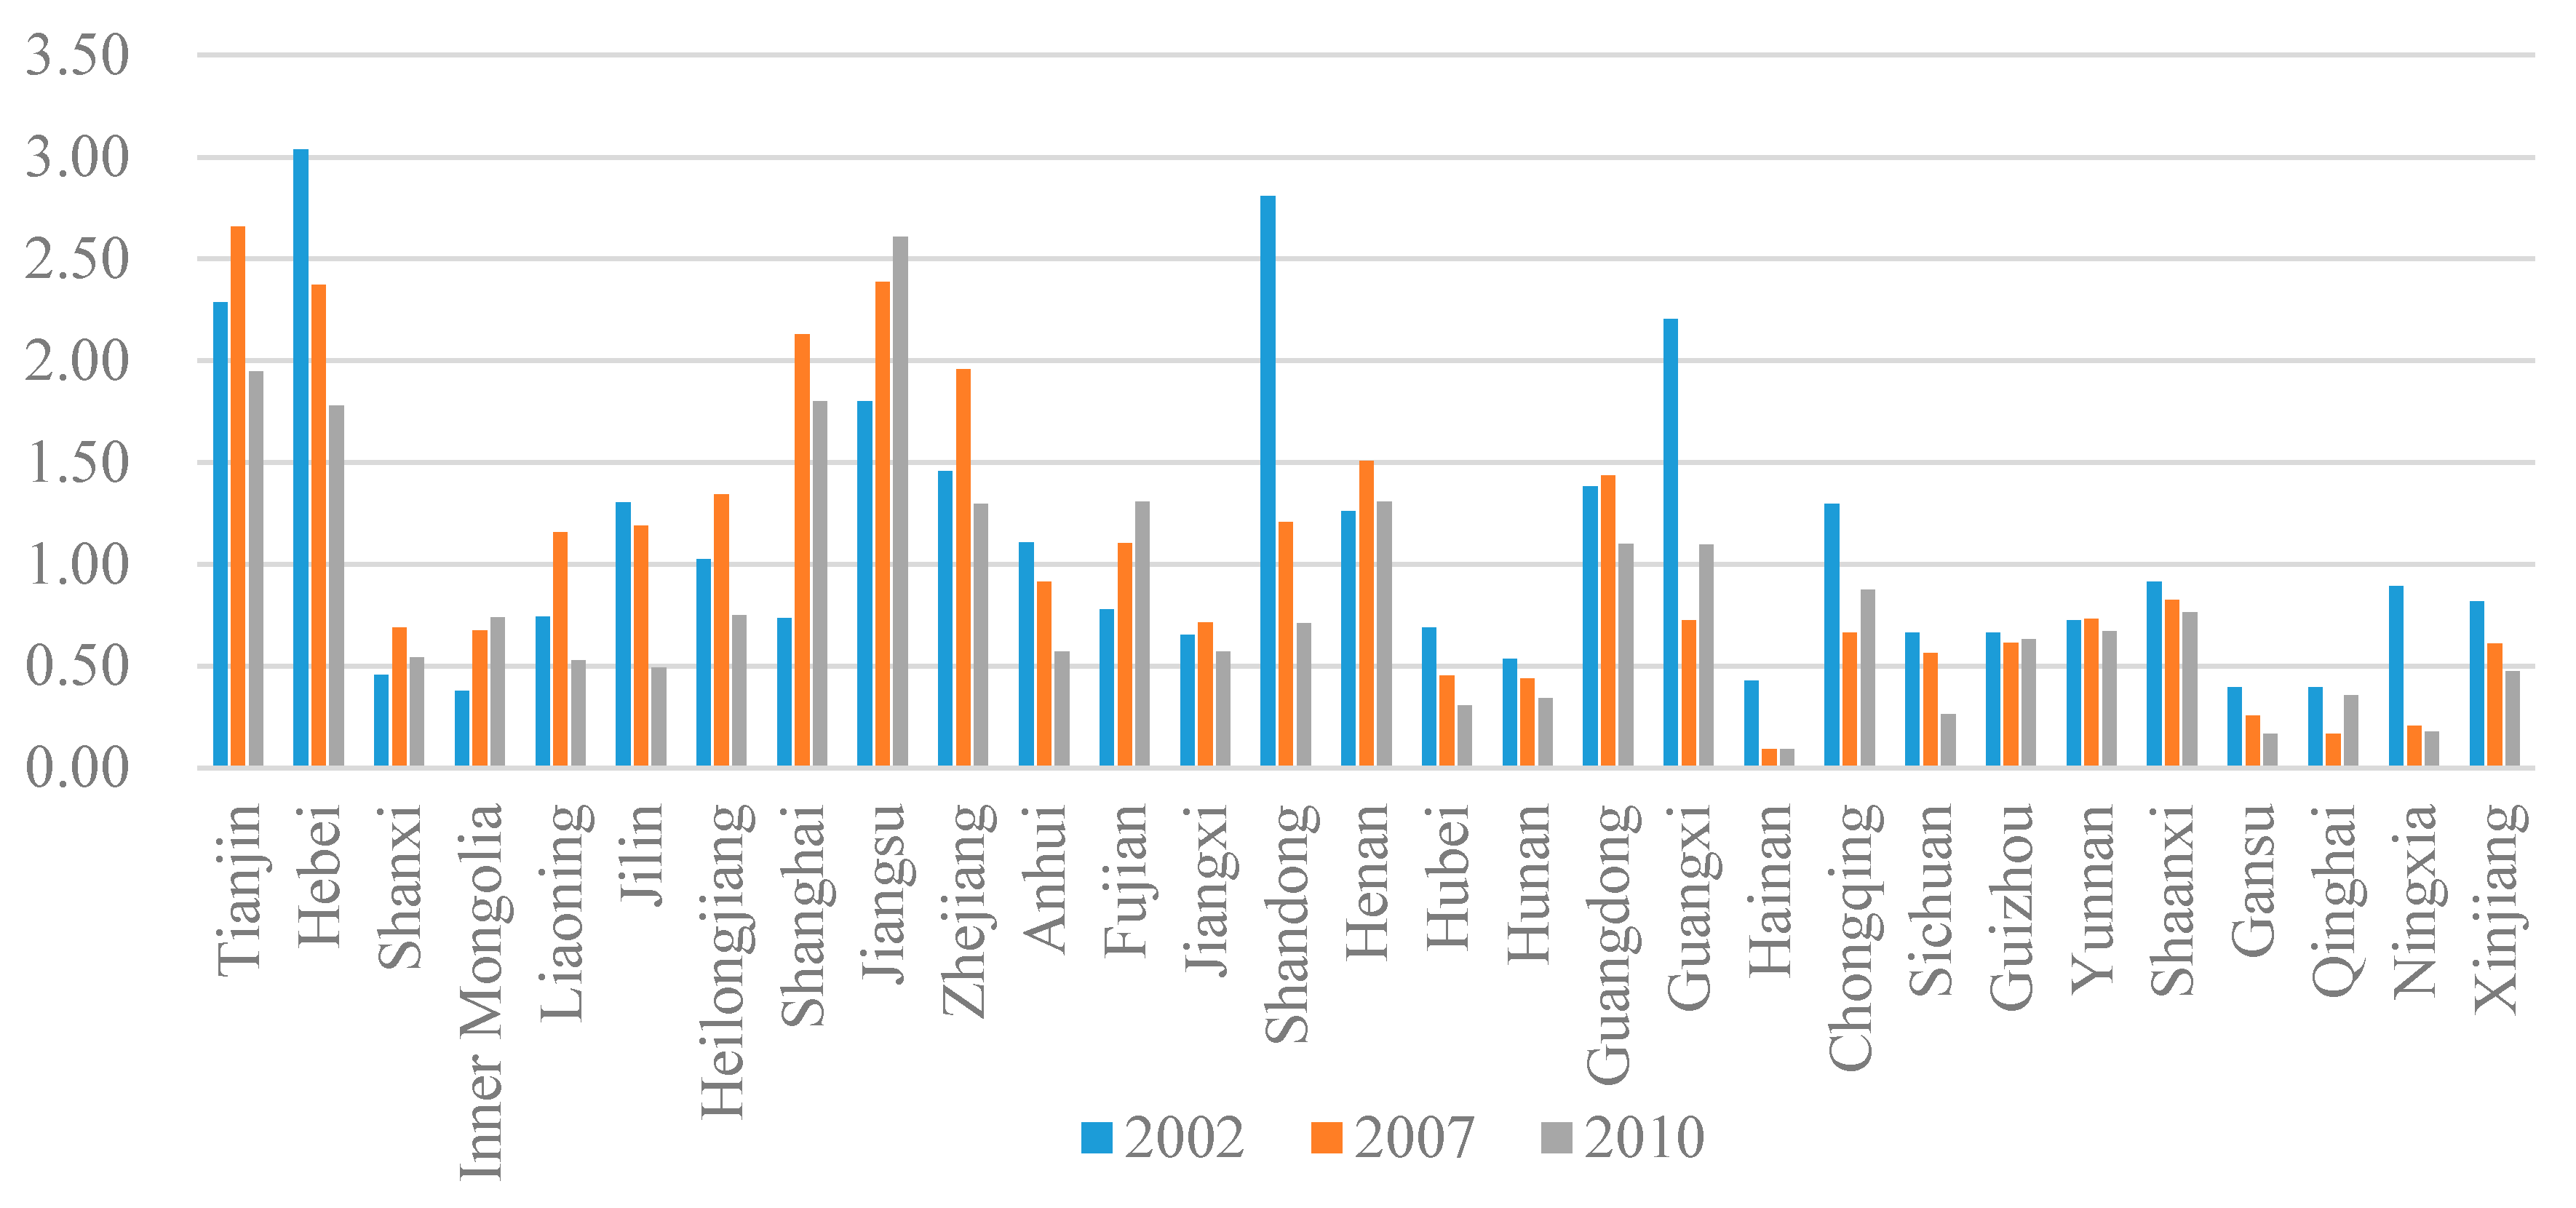
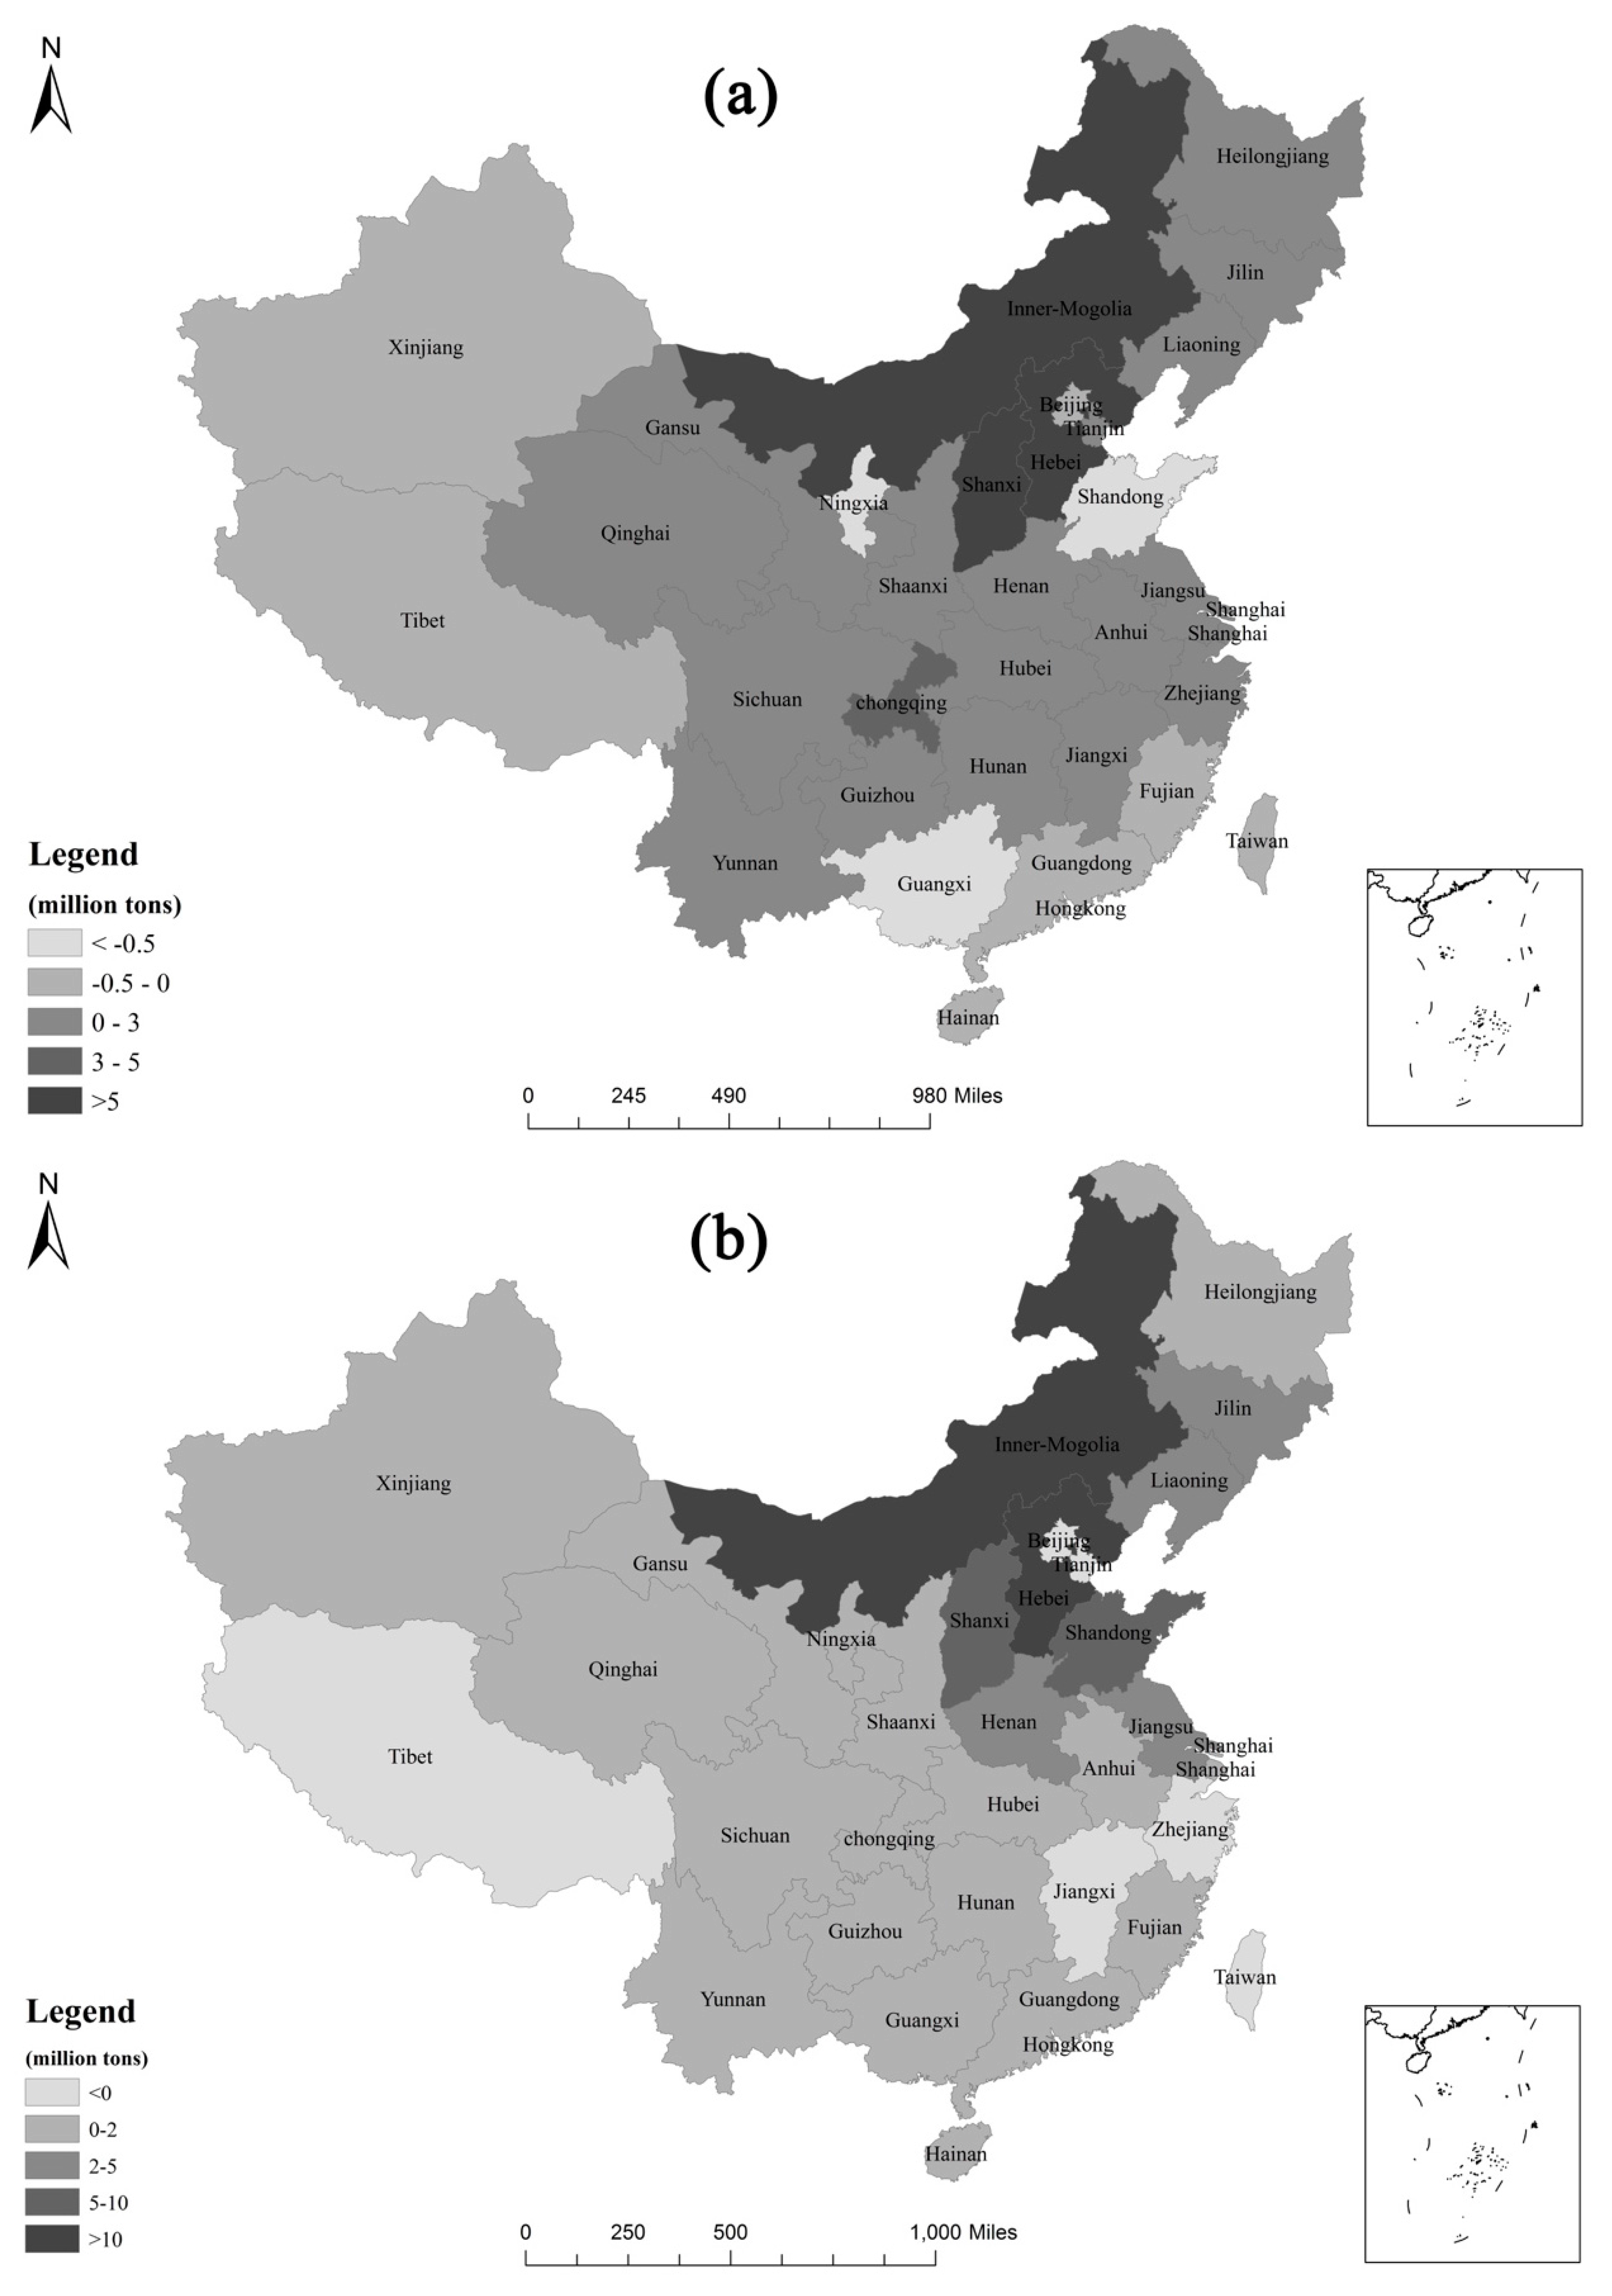
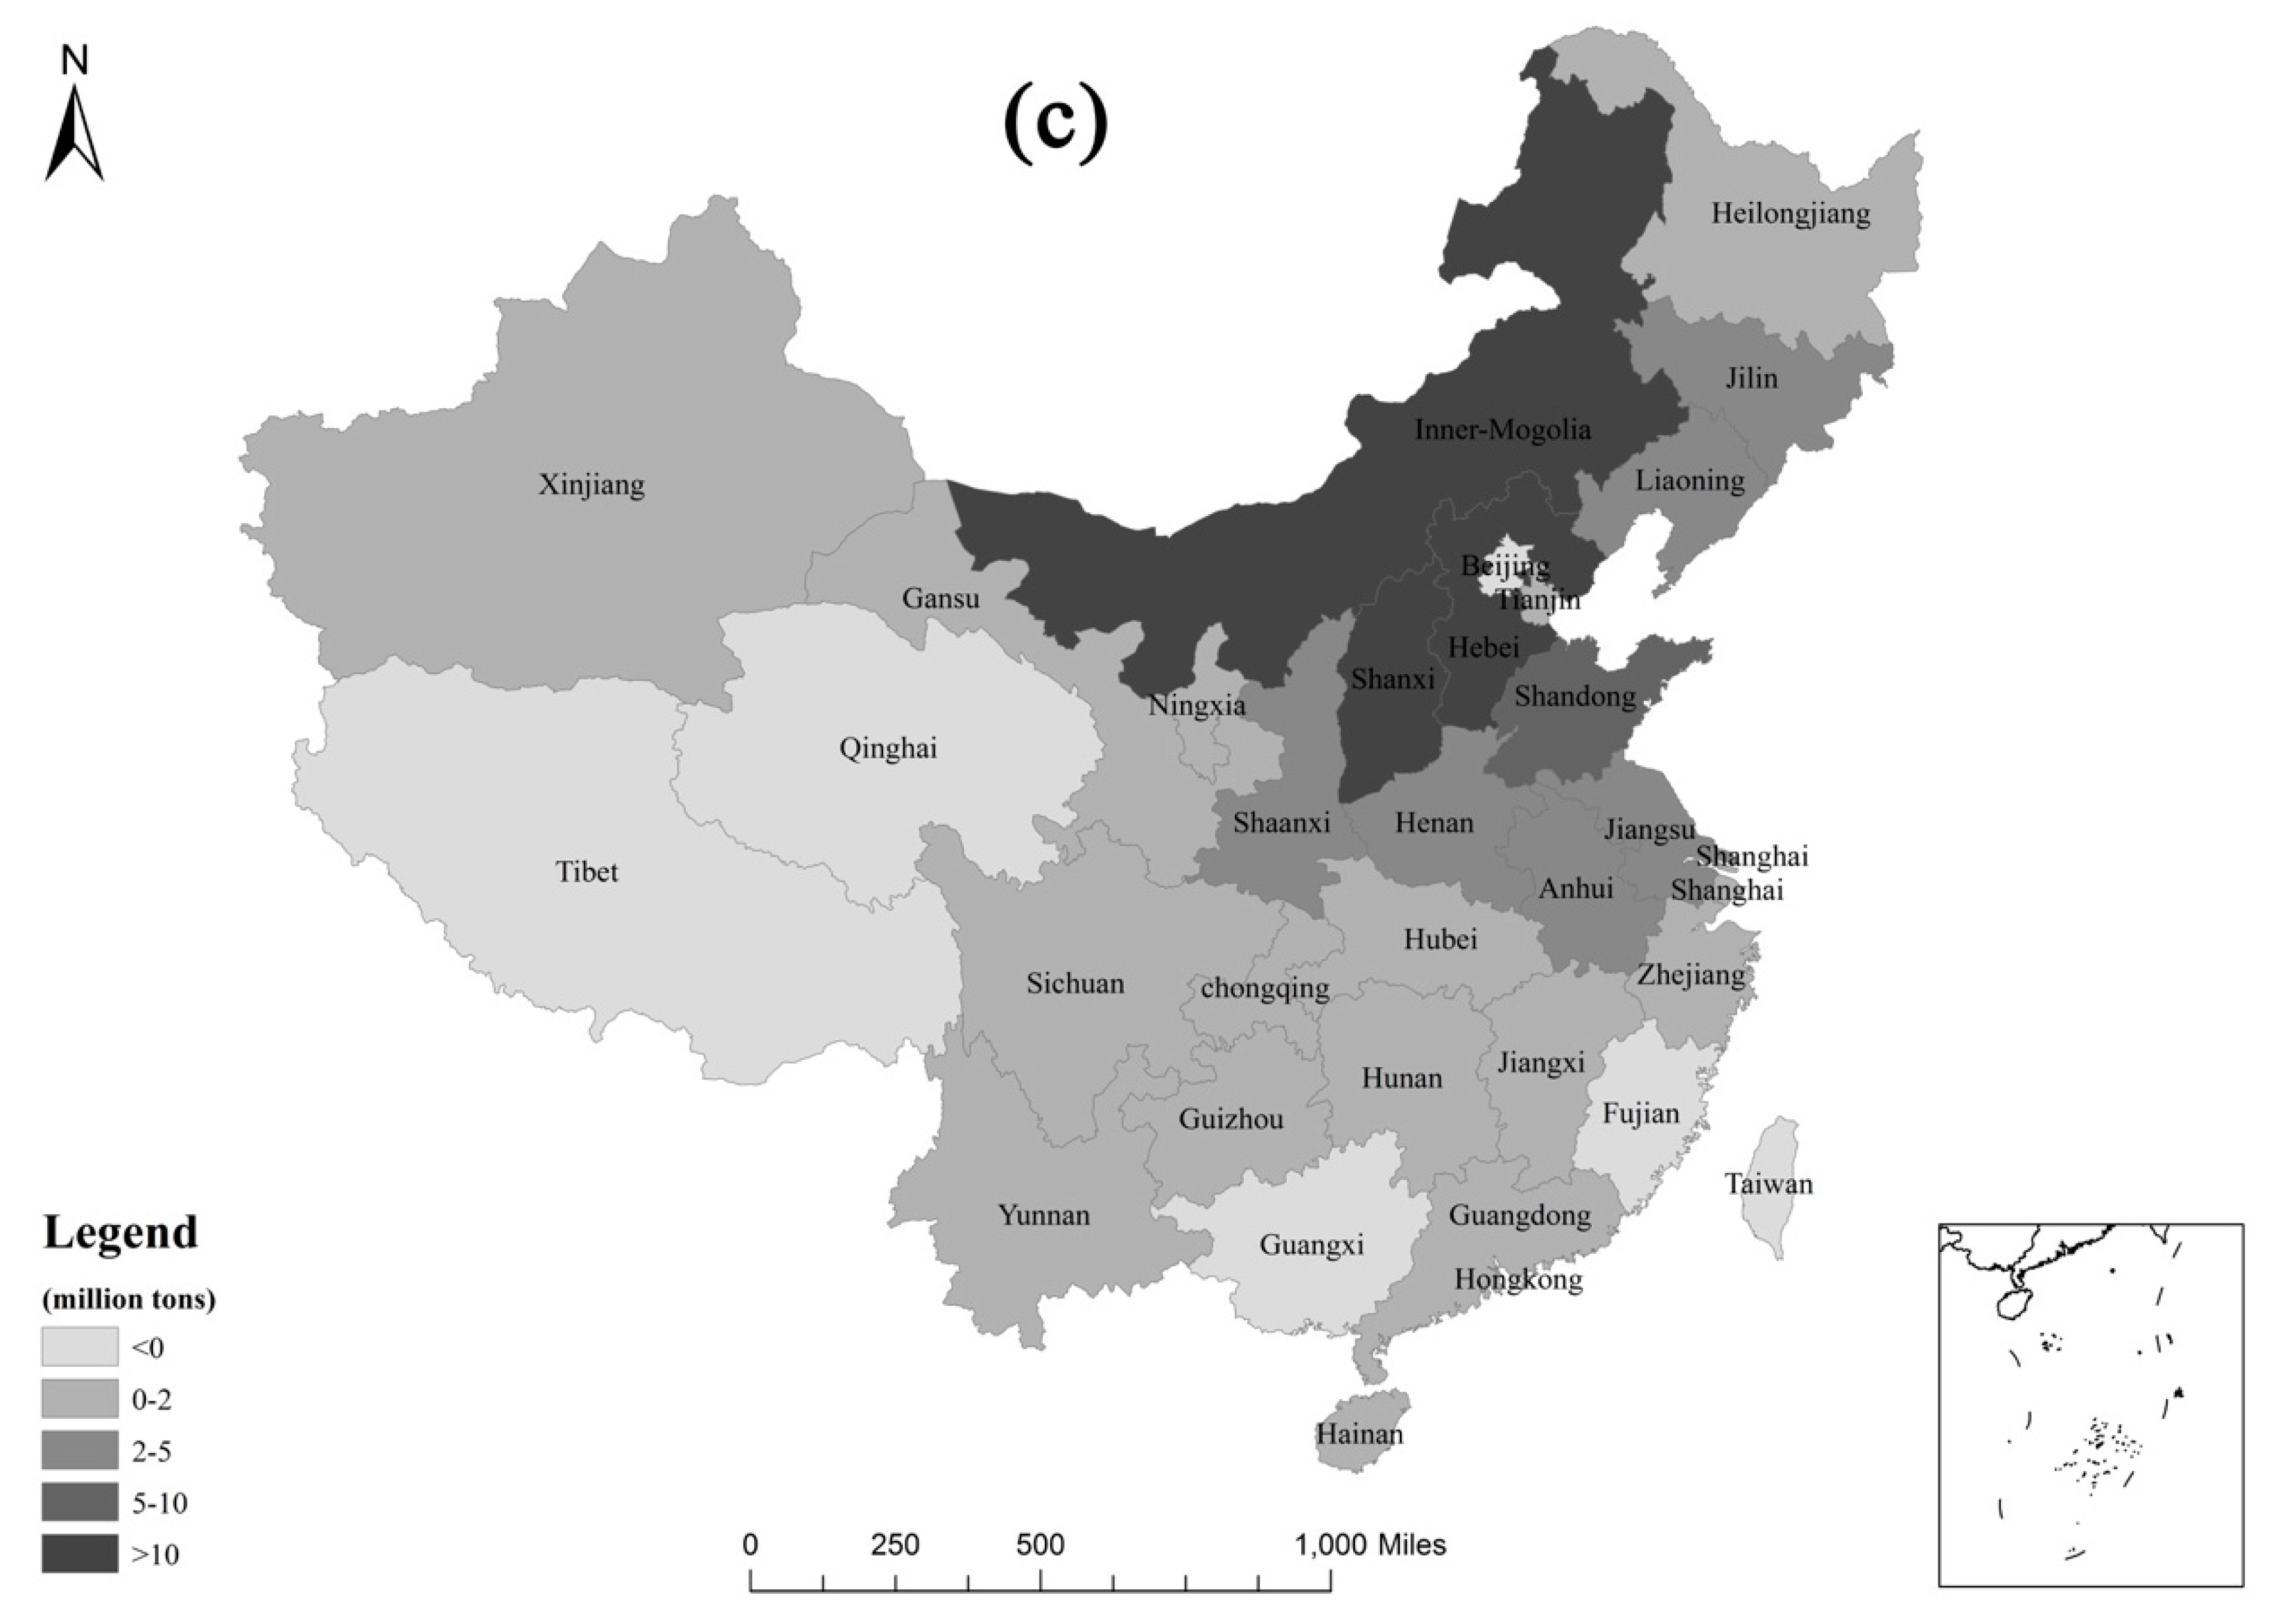
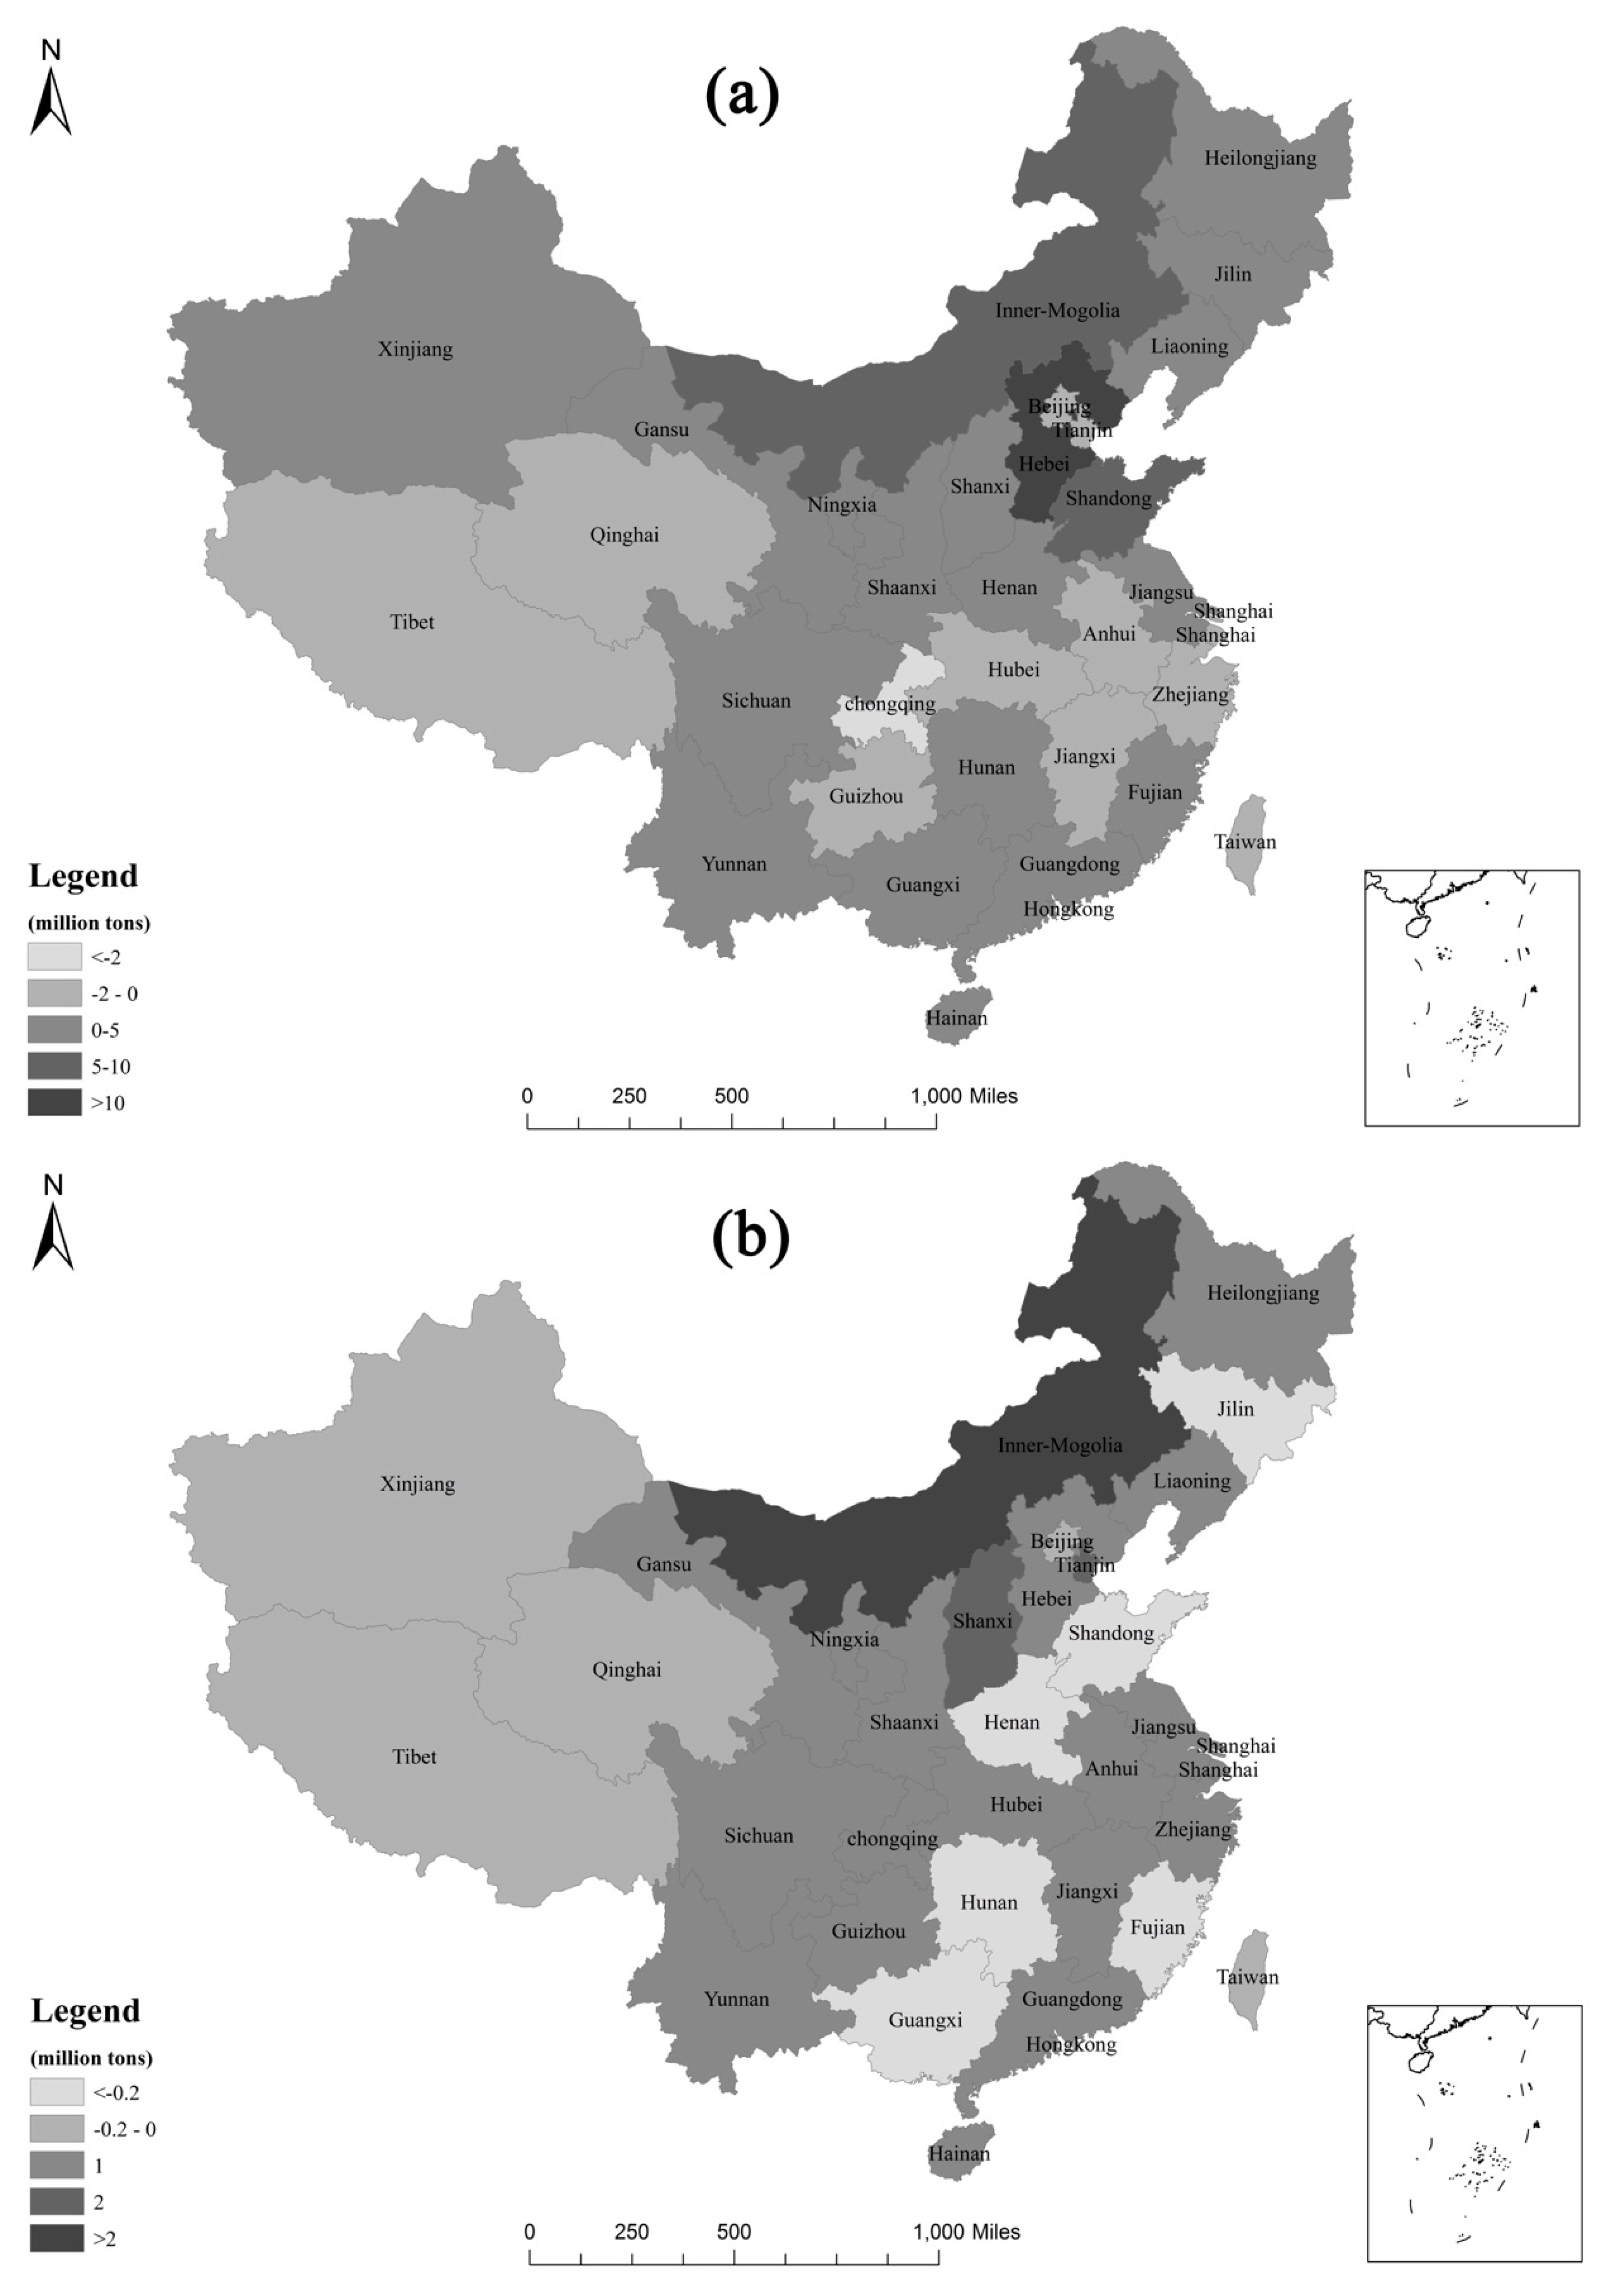
The net imported embodied carbon to Beijing gradually increased from 2002 to 2010. The dependence of CO2 emissions induced by final demand of Beijing on other regions increased from 29.63% in 2002 to 56.51% in 2010, indicating that more than half of the CO2 emissions induced by the final demand of Beijing in 2010 were from other regions. The embodied carbon surplus of Beijing was mostly from Hebei, Shanxi, Inner Mongolia and other surrounding areas, while the net output was to Guangdong, Guangxi, Fujian and other more developed areas, over the period of 2002 to 2010.
(2)
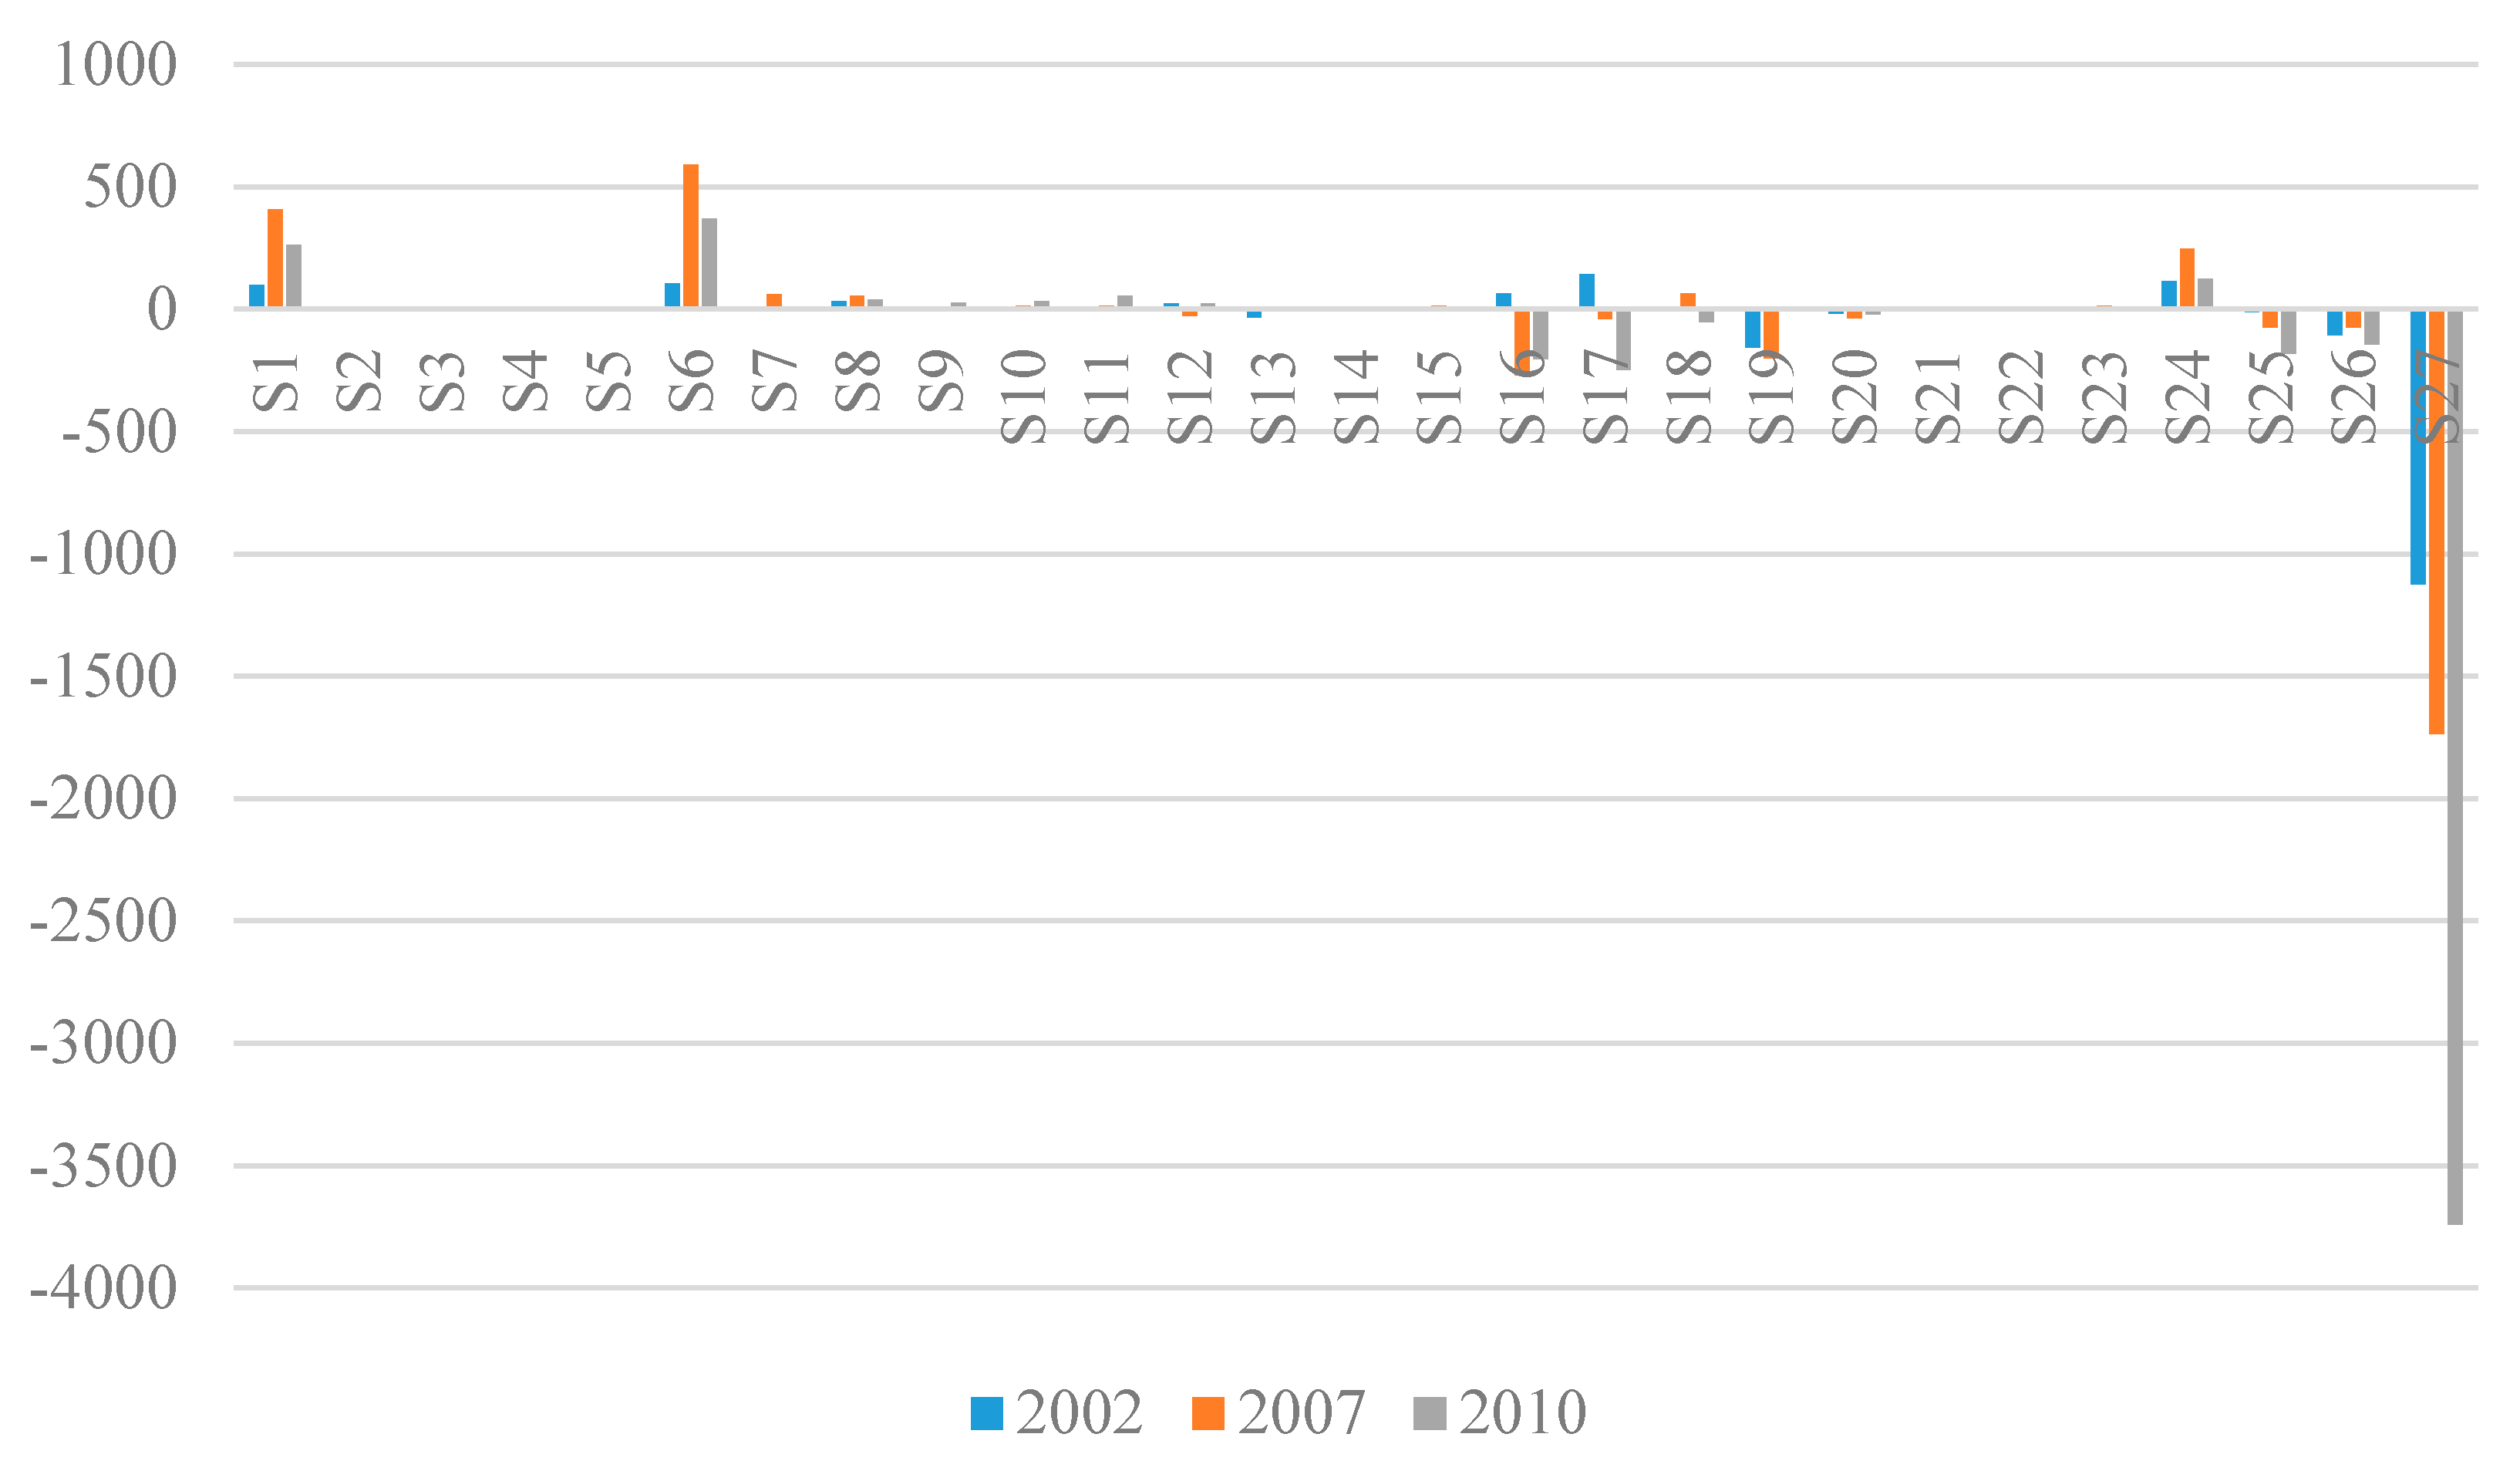
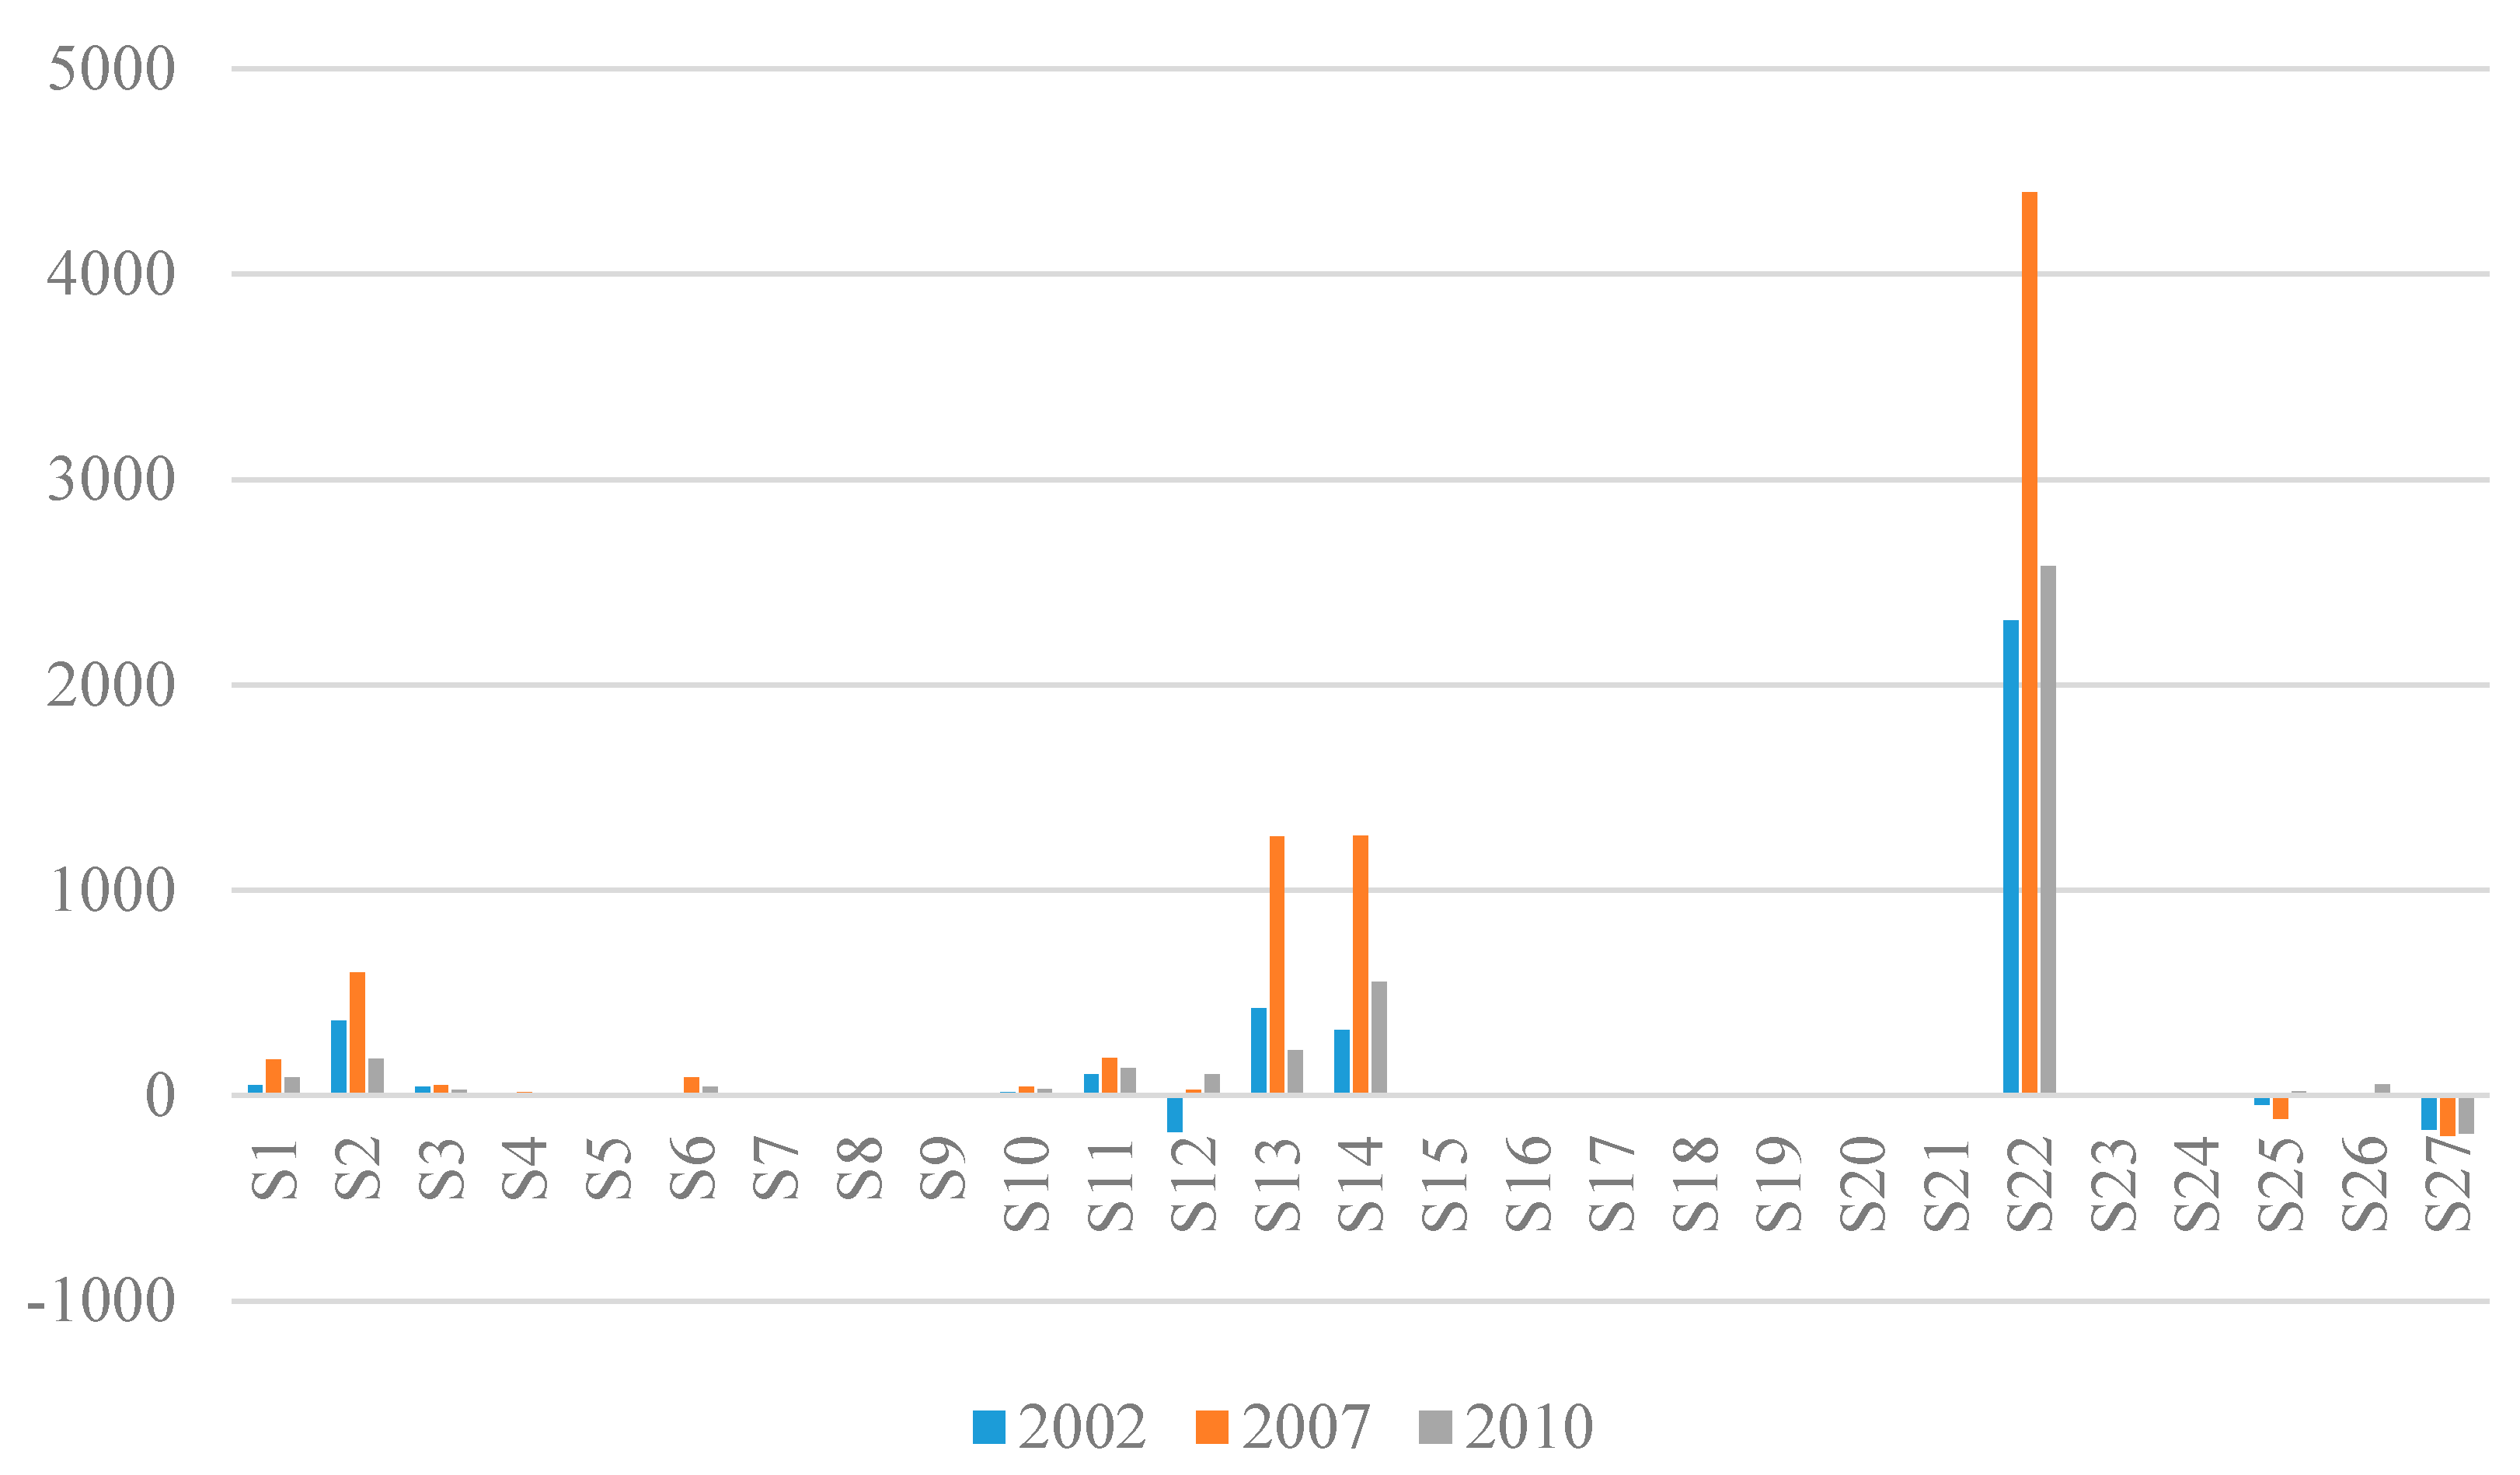
The industries with the largest proportions of net imported embodied carbon to Beijing during 2002 to 2007 were: (S22) production and supply of electricity and heat, followed by (S13) nonmetal mineral products), (S14) smelting and pressing of ferrous metals, (S2) coal mining and pressing) and (S11) petroleum processing, coking and nuclear fuel processing); industries that accounted for the largest proportion in the net output trade-embodied carbon were (S27) other services and (S25) transportation and storage. It can be seen that the industries with net embodied carbon input to Beijing were those with large carbon emission coefficients, while industries with smaller carbon emission factors were flowed out of Beijing.
(3)
In the virtual scenario, the total amount of local carbon emissions avoided by net input products to Beijing in 2002, 2007 and 2010 were 16.28 million tons, 30.23 million tons and 56.21 million tons, respectively, accounting for 21.10%, 44.14% and 79.34% of the total amount of CO2 emissions in Beijing. The actual values of net input embodied carbon were greater than the virtual values, indicating that the input products of other provinces to Beijing increased the CO2 emissions in China by more than the amount of Beijing’s avoided CO2 emissions, resulting in an increase in national CO2 emissions.
(4)
The structural effects of input products to Beijing and the efficiency effects of other regions contributed to a reduction in input CO2 emissions, while the scale and technical effects contributed to an increase in embodied carbon input to Beijing, from 2002 to 2010. Therefore, in order to reduce the CO2 emissions input to Beijing, the production and carbon-abatement technologies in non-Beijing areas should be gradually improved.

5.2. Suggestions

The results of this study have implications for China’s CO2 emissions control policies:
First, policy makers should examine the driving forces of CO2 emissions from the perspective of consumption, and take the embodied CO2 in trade into consideration when formulating CO2 emissions control measures. The existing CO2 emissions accounting and control policies follow either the production-based principle or the territory-based principle, ignoring the embodied carbon flow accompanying interprovincial trade [52,55]. This means that CO2 emission-intensive provinces, such as Inner Mongolia, Hebei and Shanxi, should vigorously reduce CO2 emissions. In fact, a large portion of CO2 emissions is generated from these provinces in order to fulfill the consumption needs of other provinces such as Beijing. The final demands of industries (S22) production and supply of electricity and heat, (S13) nonmetal mineral products, (S14) smelting and pressing of ferrous metals, (S2) coal mining and pressing and (S11) petroleum processing, coking and nuclear fuel processing in Beijing are the driving force of CO2 emissions generation, and should take responsibility for the CO2 emissions they produce.
Second, CO2 emissions reduction requirements should be reasonably distributed across the provinces to reduce carbon leakage in interprovincial trade. The developed regions such as Beijing have reduced local CO2 emissions not only by technological advancement and strict environmental standards, but also, to some extent, by the transfer of embodied emissions in interprovincial trade [13]. Our study showed that Beijing transferred large amounts of CO2 emissions to other provinces through interprovincial trade, between 2002 and 2010, and this trend is expected to continue. However, trade only redistributes CO2 emissions across provinces instead of eliminating them. In addition, considering the relatively inferior production technologies (intensity of CO2 emissions) in the central and western provinces, interprovincial trade is likely to increase the total national CO2 emissions. Therefore, whether using the total control target or the carbon intensity control target, it is suggested to reasonably distribute CO2 emission-reduction activities among provinces and consider the impact of interprovincial trade, to prevent the outsourcing of CO2 emissions from developed provinces to other provinces, which has already led to difficulties in implementing total CO2 emission reductions in China.
Third, the consumption structure in the production chain needs to be moderately adjusted. As China steps into the “New Normal” development era, which is characterized by a deceleration in growth rate and structural adjustments, this is the time to seize the opportunity to adjust not only its industrial structure but also its consumption structure, to control the growth of CO2 emission-intensive industries. The marginal cost of emission reductions is substantially lower in interior provinces such as Ningxia, Shanxi, and Inner Mongolia, where produced emissions, energy intensity, and coal use are all high relative to the cities and provinces along the central coast. The more lenient intensity targets in the western provinces will necessitate more expensive emission reductions in the coastal provinces, and will encourage additional outsourcing to the western provinces. One suggestion is to adjust the consumption composition of each region in the production chain, and enhance the proportion of low-carbon products in consumption through incentives like a carbon tax. For instance, if a uniform price were imposed on carbon within China, larger emission reductions would occur in western provinces where marginal costs are lower, and the cost of these reductions would be shared by affluent consumers in coastal China, who would pay more for the goods and services imported from the interior. By this means, Beijing would be driven to increase the input of industries with lower CO2 emissions intensities (such as (S8) textiles, clothing, shoes, hats, leather, feather and down products, (S18) electric equipment and machinery, (S20) instruments, meters, cultural and office machinery, etc.).
Last but not least, financial and technical support for CO2 emissions control in the central and western provinces should be strengthened. At present, because of the differences in economic growth, the underdeveloped provinces in western China and the developed provinces in eastern China have difference efficiency levels of CO2 emissions [40,60]. Our research results showed that the provinces in eastern China—such as Beijing—that outsource CO2 emissions, and the provinces in central and western China that generate CO2 emissions, both need to contribute to reducing emissions. In order to help the provinces with relatively inferior ability to reduce carbon emissions to upgrade, it is urgent for the developed provinces to take some responsibility for the transferred CO2 emissions embodied, and to provide appropriate financial, technica59l, and management support to help those provinces improve their CO2 emissions control. For example, to enhance inter-provincial cooperation for energy efficiency improvement, for the energy demand is nowadays growing more and more and the problem of the fossil fuels depletion is becoming increasingly crucial [61]. It is necessary to develop new technologies and strategies in energy consumption management, and to develop green energy sources, such as solar and wind energy [62], both to meet the energy demand and to limit the production of CO2 emission [61]. Unlike the global situation, there are fewer technological and population barriers between different regions inside China, and resources and technology can move freely.

Acknowledgments

This work was supported by the Fund of the National Natural Science Foundation of China (No.41471465). The authors are grateful to anonymous reviewers for their valuable comments and suggestions.

Author Contributions

The two authors contributed equally to the study. Wen Wen and Qi Wang conceived and designed the research; Wen Wen analyzed the data; Wen Wen and Qi Wang wrote and revised the paper.

Conflicts of Interest

The authors declare no conflict of interest.

References

  1. Ahmad, N.; Wyckoff, A. Carbon Dioxide Emissions Embodied in International Trade of Goods; OECD Science, Technology and Industry Working Papers; OECD: Paris, France, 2003. [Google Scholar]
  2. Kander, A.; Jiborn, M.; Moran, D.D.; Wiedmann, T.O. National greenhouse-gas accounting for effective climate policy on international trade. Nat. Clim. Chang. 2015, 5, 431–435. [Google Scholar] [CrossRef]
  3. Munksgaard, J.; Pedersen, K.A. CO2 accounts for open economies: Producer or consumer responsibility? Energy Policy 2001, 29, 327–334. [Google Scholar] [CrossRef]
  4. Rhee, H.C.; Chung, H.S. Change in CO2 emission and its transmissions between Korea and Japan using international input–output analysis. Ecol. Econ. 2006, 58, 788–800. [Google Scholar] [CrossRef]
  5. Copeland, B.R.; Taylor, M.S. North-south trade and the environment. Q. J. Econ. 1994, 109, 755–787. [Google Scholar] [CrossRef]
  6. Paltsev, S.V. The kyoto protocol: Regional and sectoral contributions to the carbon leakage. Energy J. 2001, 22, 53–79. [Google Scholar] [CrossRef]
  7. Barker, T.; Junankar, S.; Pollitt, H.; Summerton, P. Carbon leakage from unilateral environmental tax reforms in Europe, 1995–2005. Energy Policy 2007, 35, 6281–6292. [Google Scholar] [CrossRef]
  8. Babiker, M.H. Climate change policy, market structure, and carbon leakage. J. Int. Econ. 2005, 65, 421–445. [Google Scholar] [CrossRef]
  9. Muradian, R.; O'Connor, M.; Martinez-Alier, J. Embodied pollution in trade: Estimating the environmental load displacement of industrialized countries. Ecol. Econ. 2002, 41, 51–67. [Google Scholar] [CrossRef]
  10. Lenzen, M. A consistent input–output formulation of shared producer and consumer responsibility. Econ. Syst. Res. 2005, 17, 365–391. [Google Scholar]
  11. Iodice, P.; Senatore, A. Appraisal of pollutant emissions and air quality state in a critical Italian region: Methods and results. Environ. Progress Sustain. Energy 2015, 34, 1497–1505. [Google Scholar] [CrossRef]
  12. United Nations Framework Convention on Climate Change (UNFCC). Available online: http://unfccc.int/paris_agreement/items/9485.php (accessed on 26 August 2017).
  13. Liu, Q.; Wang, Q. Reexamine SO2 emissions embodied in China's exports using multiregional input–output analysis. Ecol. Econ. 2015, 113, 39–50. [Google Scholar] [CrossRef]
  14. Wang, T.; Watson, J. China’s carbon emissions and international trade: Implications for post-2012 policy. Clim. Policy 2008, 8, 577–587. [Google Scholar] [CrossRef]
  15. Liang, S.; Zhang, T.; Wang, Y.; Jia, X. Sustainable urban materials management for air pollutants mitigation based on urban physical input–output model. Energy 2012, 42, 387–392. [Google Scholar] [CrossRef]
  16. Liu, X.; Wang, C. Quantitative analysis of CO2 embodiment in international trade: An overview of emerging literatures. Front. Environ. Sci. Eng. China 2009, 3, 12–19. [Google Scholar] [CrossRef]
  17. Peters, G.; Solli, C. Global Carbon footprints - Methods and Import/Export Corrected Results from the Nordic Countries in Global Carbon Footprint Studies; Nordic Council of Ministers: Copenhagen, Denmark, 2010. [Google Scholar]
  18. Wyckoff, A.W.; Roop, J.M. The embodiment of carbon in imports of manufactured products: Implications for international agreements on greenhouse gas emissions. Energy Policy 1994, 22, 187–194. [Google Scholar] [CrossRef]
  19. Chen, Z.M.; Chen, G.Q. Embodied carbon dioxide emission at supra-national scale: A coalition analysis for G7, BRIC, and the rest of the world. Energy Policy 2011, 39, 2899–2909. [Google Scholar] [CrossRef]
  20. Peters, G.P.; Hertwich, E.G. CO2 embodied in international trade with implications for global climate policy. Environ. Sci. Technol. 2008, 42, 1401–1407. [Google Scholar] [CrossRef] [PubMed]
  21. Shui, B.; Harriss, R.C. The role of CO2 embodiment in US-China trade. Energy Policy 2006, 34, 4063–4068. [Google Scholar] [CrossRef]
  22. Ackerman, F.; Ishikawa, M.; Suga, M. The carbon content of Japan−US trade. Energy Policy 2007, 35, 4455–4462. [Google Scholar] [CrossRef]
  23. Li, Y.; Hewitt, C.N. The effect of trade between China and the UK on national and global carbon dioxide emissions. Energy Policy 2008, 36, 1907–1914. [Google Scholar] [CrossRef]
  24. Xu, M.; Allenby, B.; Chen, W. Energy and air emissions embodied in China−US trade: Eastbound assessment using adjusted bilateral trade data. Environ. Sci. Technol. 2009, 43, 3378. [Google Scholar] [CrossRef] [PubMed]
  25. Liu, X.; Ishikawa, M.; Wang, C.; Dong, Y.; Liu, W. Analyses of CO2 emissions embodied in Japan–China trade. Energy Policy 2010, 38, 1510–1518. [Google Scholar] [CrossRef]
  26. Ming, X.; Ran, L.; Crittenden, J.C.; Chen, Y. CO2 emissions embodied in China’s exports from 2002 to 2008: A structural decomposition analysis. Energy Policy 2011, 39, 7381–7388. [Google Scholar]
  27. Machado, G.; Schaeffer, R.; Worrell, E. Energy and carbon embodied in the international trade of Brazil: An input–output approach. Ecol. Econ. 2001, 39, 409–424. [Google Scholar] [CrossRef]
  28. Wiedmann, T.; Lenzen, M.; Turner, K.; Barrett, J. Examining the global environmental impact of regional consumption activities—Part 2: Review of input–output models for the assessment of environmental impacts embodied in trade. Ecol. Econ. 2007, 61, 15–26. [Google Scholar] [CrossRef]
  29. Lin, B.; Sun, C. Evaluating carbon dioxide emissions in international trade of China. Energy Policy 2010, 38, 613–621. [Google Scholar] [CrossRef]
  30. Yan, Y.F.; Yang, L.K. China’s foreign trade and climate change: A case study of CO2 emissions. Energy Policy 2010, 38, 350–356. [Google Scholar]
  31. Chen, G.Q.; Bo, Z. Greenhouse gas emissions in China 2007: Inventory and input–output analysis. Energy Policy 2010, 38, 6180–6193. [Google Scholar] [CrossRef]
  32. Pan, J.; Phillips, J.; Chen, Y. China’s balance of emissions embodied in trade: Approaches to measurement and allocating international responsibility. Oxf. Rev. Econ. Policy 2008, 24, 354–376. [Google Scholar] [CrossRef]
  33. Weber, C.L.; Peters, G.P.; Guan, D.; Hubacek, K. The contribution of Chinese exports to climate change. Energy Policy 2008, 36, 3572–3577. [Google Scholar] [CrossRef]
  34. Fu, J. Carbon leakage in China’s manufacturing trade: An empirical analysis based on the carbon embodied in trade. J. Int. Trade Econ. Dev. 2014, 23, 329–360. [Google Scholar]
  35. Peters, G.P.; Minx, J.C.; Weber, C.L.; Edenhofer, O. Growth in emission transfers via international trade from 1990 to 2008. Proc. Natl. Acad. Sci. USA 2011, 108, 8903. [Google Scholar] [CrossRef] [PubMed]
  36. Davis, S.J.; Caldeira, K. Consumption-based accounting of CO2 emissions. Proc. Natl. Acad. Sci. USA 2010, 107, 5687–5692. [Google Scholar] [CrossRef] [PubMed]
  37. Su, B.; Huang, H.C.; Ang, B.W.; Zhou, P. Input–output analysis of CO2 emissions embodied in trade: The effects of sector aggregation. Ecol. Econ. 2010, 32, 166–175. [Google Scholar] [CrossRef]
  38. Lenzen, M. Aggregation versus disaggregation in input–output analysis of the environment. Econ. Syst. Res. 2011, 23, 73–89. [Google Scholar] [CrossRef]
  39. Su, B.; Ang, B.W. Input–output analysis of CO2 emissions embodied in trade: A multi-region model for China. Ecol. Econ. 2014, 114, 377–384. [Google Scholar] [CrossRef]
  40. Zhong, Z.; Huang, R.; Tang, Q.; Cong, X.; Wang, Z. China’s provincial CO2 emissions embodied in trade with implications for regional climate policy. Front. Earth Sci. 2015, 9, 77–90. [Google Scholar] [CrossRef]
  41. Zhang, Z.; Guo, J.E.; Hewings, G.J.D. The effects of direct trade within China on regional and national CO2 emissions. Energy Econ. 2014, 46, 161–175. [Google Scholar] [CrossRef]
  42. Sanfelix, J.; Rua, C.D.L.; Schmidt, J.H.; Messagie, M.; Mierlo, J.V. Environmental and economic performance of an li-ion battery pack: A multiregional input-output approach. Energies 2016, 9, 584. [Google Scholar] [CrossRef]
  43. Yan, X.; Ge, J. The economy-carbon nexus in China: A multi-regional input-output analysis of the influence of sectoral and regional development. Energies 2017, 10, 93. [Google Scholar] [CrossRef]
  44. Miller, R.E.; Blair, P.D. Input-Output Analysis: Foundations and Extensions; Cambridge University Press: Cambridge, UK, 2009; pp. 1293–1304. [Google Scholar]
  45. Dietzenbacher, E.; Los, B. Structural decomposition techniques: Sense and sensitivity. Econ. Syst. Res. 1998, 10, 307–324. [Google Scholar] [CrossRef]
  46. Hoekstra, R.; van den Bergh, J.C.J.M. Comparing structural decomposition analysis and index. Energy Econ. 2003, 25, 39–64. [Google Scholar] [CrossRef]
  47. National Statistical Bureau of China (NSBC). 2002 China Input-Output Tables; China Statistics Press: Beijing, China, 2008. [Google Scholar]
  48. National Statistical Bureau of China (NSBC). 2007 China Input-Output Tables; China Statistics Press: Beijing, China, 2011. [Google Scholar]
  49. National Statistical Bureau of China (NSBC). 2010 China Input-Output Tables; China Statistics Press: Beijing, China, 2013. [Google Scholar]
  50. Liu, W.D.; Chen, J.; Tang, Z.P.; Liu, H.G.; Han, D. Theories and Practice of Constructing China’s Interregional Input–Output Tables between 30 Provinces in 2007; China Statistics Press: Beijing, China, 2012. [Google Scholar]
  51. Liu, W.D.T.; Tang, Z.P.; Chen, J. China’s 30 Provinces Regional Input-Output Table in 2010; China Statistics Press: Beijing, China, 2014. [Google Scholar]
  52. Guan, D.; Liu, Z.; Geng, Y.; Lindner, S.; Hubacek, K. The gigatonne gap in China’s carbon dioxide inventories. Nat. Clim. Chang. 2012, 2, 672–675. [Google Scholar] [CrossRef]
  53. Liu, Z.; Guan, D.; Wei, W.; Davis, S.J.; Ciais, P.; Bai, J.; Peng, S.; Zhang, Q.; Hubacek, K.; Marland, G. Reduced carbon emission estimates from fossil fuel combustion and cement production in China. Nature 2015, 524, 335–338. [Google Scholar] [CrossRef] [PubMed]
  54. He, J. Economic Determinants for China’s Industrial SO2 Emission: Reduced vs. Structural form and the Role of International Trade; Working Papers; CERDI: Clermont-Ferrand, France, 2005. [Google Scholar]
  55. Feng, K.; Davis, S.J.; Sun, L.; Li, X.; Guan, D.; Liu, W.; Liu, Z.; Hubacek, K. Outsourcing CO2 within China. Proc. Natl. Acad. Sci. USA 2013, 110, 11654–11659. [Google Scholar] [CrossRef] [PubMed] [Green Version]
  56. Guan, D.; Su, X.; Zhang, Q.; Peters, G.P.; Liu, Z.; Lei, Y.; He, K. The socioeconomic drivers of China’s primary PM2.5 emissions. Environ. Res. Lett. 2014, 9, 24010. [Google Scholar] [CrossRef]
  57. Liang, S.; Liu, Z.; Crawford-Brown, D.; Wang, Y.; Xu, M. Decoupling analysis and socioeconomic drivers of environmental pressure in China. Environ. Sci. Technol. 2014, 48, 1103. [Google Scholar] [CrossRef] [PubMed]
  58. Guan, D.; Hubacek, K.; Weber, C.L.; Peters, G.P.; Reiner, D.M. The drivers of Chinese CO2 emissions from 1980 to 2030. Glob. Environ. Chang. 2008, 18, 626–634. [Google Scholar] [CrossRef]
  59. Minx, J.C.; Baiocchi, G.; Peters, G.P.; Weber, C.L.; Guan, D.; Hubacek, K. A carbonizing dragon: China’s fast growing CO2 emissions revisited. Environ. Sci. Technol. 2011, 45, 9144. [Google Scholar] [CrossRef] [PubMed]
  60. Guo, J.E.; Zhang, Z.; Meng, L. China’s provincial CO2 emissions embodied in international and interprovincial trade. Energy Policy 2012, 42, 486–497. [Google Scholar] [CrossRef]
  61. Iodice, P.; Adamo, P.; Capozzi, F.; Di, P.A.; Senatore, A.; Spagnuolo, V.; Giordano, S. Air pollution monitoring using emission inventories combined with the moss bag approach. Sci. Total Environ. 2016, 541, 1410–1419. [Google Scholar] [CrossRef] [PubMed]
  62. Zhang, B.; Chen, G.Q. China’s CH4 and CO2 emissions: Bottom-up estimation and comparative analysis. Ecol. Indic. 2014, 47, 112–122. [Google Scholar] [CrossRef]
Figure 1. Embodied carbon flowed in Beijing from other provinces in 2002, 2007, and 2010 (million tons).
Energies 10 01952 g001
Figure 2. Embodied carbon flowed out from Beijing to other provinces in 2002, 2007, and 2010 (million tons).
Energies 10 01952 g002
Figure 3. Net embodied carbon flowed in Beijing from other provinces in (a) 2002, (b) 2007, and (c) 2010 (million tons).
Energies 10 01952 g003aEnergies 10 01952 g003b
Figure 4. Net embodied carbon flowed in Beijing during the periods of (a) 2002–2007 and (b) 2007–2010 (million tons).
Energies 10 01952 g004
Figure 5. Net trade volume input to Beijing for industries in 2002, 2007, and 2010 (10 thousand yuan).
Energies 10 01952 g005
Figure 6. Net embodied carbon flowed in Beijing for industries in 2002, 2007, and 2010 (10 thousand tons).
Energies 10 01952 g006
Figure 7. Structural decomposition of input embodied carbon during the period of 2002–2007 (ten thousand tons).
Energies 10 01952 g007
Figure 8. Structural decomposition of input embodied carbon during the period of 2007–2010 (ten thousand tons).
Energies 10 01952 g008
Table 1. Administrative regions analyzed in the research.
No.Administrative RegionNo.Administrative Region
1Beijing16Henan
2Tianjin17Hubei
3Hebei18Hunan
4Shanxi19Guangdong
5Inner Mongolia20Guangxi
6Liaoning21Hainan
7Jilin22Chongqing
8Heilongjiang23Sichuan
9Shanghai24Guizhou
10Jiangsu25Yunnan
11Zhejiang26Shaanxi
12Anhui27Gansu
13Fujian28Qinghai
14Jiangxi29Ningxia
15Shandong30Xinjiang
Note: Tibet, Hong Kong, Macau, and Taiwan were excluded from the MRIO table used.
Table 2. Details of merged sectors.
Symbol27-Sector Merge42-Sector Data (CEADs Database)30-Sector Data (MRIO Table)
S1Farming, Forestry, Animal Husbandry, Fishing and Water conservationFarming, Forestry, Animal Husbandry, Fishery and Water conservancy Farming, Forestry, Animal Husbandry, Fishing and Water conservation
S2Coal mining and pressing Coal mining and dressing Coal mining and pressing
S3Petroleum and Natural gas extractionPetroleum and Natural gas extraction Petroleum and Natural gas extraction
S4Metals mining and pressing Ferrous metals mining and dressing; nonferrous metals mining and dressing Metals mining and pressing
S5Nonferrous metals and Other minerals mining and pressingNonferrous metals mining and dressing;
Other minerals mining and dressing
Nonferrous metals mining and pressing
S6Food manufacturing and Tobacco processing Food processing; Food production; Beverage production; Tobacco processingFood manufacturing and Tobacco processing
S7Textile industryTextile industryTextile industry
S8Textile, Clothing, Shoes, Hats, Leather, Feather and Down productsGarments and Other Fiber Products; Leather, Furs, Down and related products Textile, Clothing, Shoes, Hats, Leather, Feather and Down products
S9Wood processing and Furniture manufacturingTimber processing, Bamboo, Cane, Palm fiber & Straw products;
Furniture manufacturing
Wood processing and Furniture manufacturing
S10Paper printing, Stationery, Sports goods manufacturingPapermaking and paper products; Printing and record medium reproduction; Cultural, Educational and Sports articlesPaper printing, Stationery, Sports goods manufacturing
S11Petroleum processing, coking and nuclear fuel processingPetroleum processing and coking Petroleum processing, coking and nuclear fuel processing
S12Chemical industryRaw chemical materials and chemical products; Medical and pharmaceutical products; Chemical fiber; Rubber products; Plastic products Chemical industry
S13Nonmetal mineral products Nonmetal mineral Products Nonmetallic mineral products industry
S14Smelting and pressing of ferrous and nonferrous metalsSmelting and pressing of ferrous metals; Smelting and pressing of nonferrous metalsSmelting and pressing of ferrous metals
S15Metal productsMetal products Metal products
S16General and special equipment manufacturingOrdinary machinery; Equipment for special purposes General and special equipment manufacturing
S17Transportation equipment manufacturing industryTransportation equipment Transportation equipment manufacturing industry
S18Electrical equipment and machineryElectric equipment and machinery Electrical equipment and machinery
S19Communications equipment, computers and other electronic equipment manufacturing industryElectronic and telecommunications EquipmentCommunications equipment, computers and other electronic equipment manufacturing industry
S20Instruments, Meters, Cultural and Office machinery Instruments, Meters, Cultural and Office machinery Instruments, Meters, Cultural and Office machinery
S21Other manufacturing industries Other manufacturing industry Other manufacturing industries
S22Production and supply of electricity and heatProduction and supply of electric power, Steam and hot water Production and supply of electricity and heat
S23Production and supply of gas and waterProduction and supply of gas; Production and supply of tap waterProduction and supply of gas and water
S24ConstructionConstructionConstruction
S25Transportation and storage Transportation, Storage, Post and Telecommunication servicesTransportation and storage
S26Wholesale, and Retail trade services Wholesale, and Retail trade services Wholesale, and Retail trade services
S27Accommodations and cateringOthers servicesAccommodations and catering
Table 3. Input and output volumes of trade, and embodied carbon flowed out from Beijing to other provinces.
200220072010
Trade volume (billion yuan)−772.86234.60822.26
Portion of annual production value of Beijing (%)−8.051.766.26
Embodied carbon(million tons)33.5878.9392.08
Portion of annual CO2 emissions, for Beijing (%)46.9186.42103.14
Dependence degree (%)29.6353.5456.51
Notes: Dependence degree (%) indicates the proportion of net imported embodied carbon assigned to Beijing in the total annual embodied carbon, based on the final demand of Beijing.
Table 4. Comparison of change rates between production-based and consumption-based CO2 emissions intensity.
2002–20072007–20102002–2010
production-based CO2 emissions inte (million tons)19.76−2.0717.69
consumption-based CO2 emissions (million tons)34.1115.5049.61
Change rate of production-based CO2 emissions intenstiy
(%/year)
−49.57−46.26−77.19
Change rate of consumption-based CO2 emissions intensity
(%/year)
−40.5326.5954.38
Table 5. Comparison of CO2 emission intensities, between Beijing and non-Beijing areas (tons/ten thousand yuan).
200220072010
SectorBeijingNon-BeijingBeijingNon-BeijingBeijingNon-Beijing
S10.22 ▲0.170.34 ▲0.210.35 ▲0.21
S20.011.950.012.110.001.34
S30.000.360.90 ▲0.450.230.31
S40.53 ▲0.270.31 ▲0.230.020.21
S50.88 ▲0.240.61 ▲0.270.78 ▲0.22
S60.060.060.070.100.050.09
S70.040.060.060.090.060.09
S80.04 ▲0.020.06 ▲0.030.05 ▲0.03
S90.030.050.040.060.030.06
S100.050.120.060.220.060.20
S110.322.570.471.790.411.63
S120.500.240.39 ▲0.350.270.34
S131.211.711.373.231.093.39
S142.74 ▲1.651.221.464.01 ▲2.04
S150.030.060.030.120.020.10
S160.050.070.030.110.030.09
S170.040.050.020.060.010.05
S180.010.030.010.040.010.03
S190.000.420.000.140.000.09
S200.010.020.010.030.010.03
S210.21 ▲0.040.220.090.09 ▲0.08
S2211.63 ▲9.812.569.691.749.59
S230.020.220.070.390.030.34
S240.030.050.050.060.060.06
S250.74 ▲0.580.741.120.711.23
S260.050.100.140.200.060.22
S270.050.060.060.070.040.09
Average0.720.780.360.840.380.82
Note: “▲” indicates that CO2 emissions intensity for Beijing industry is higher than the national average.
Table 6. Comparison of virtual and actual net embodied CO2 flowed in Beijing in interprovincial trade (million tons).
Embodied CO2 Emissions200220072010
VirtualActualIncreaseVirtualActualIncreaseVirtualActualIncrease
Net influx16.8338.6621.8430.2378.9448.7056.2192.0835.87
Proportion (%)21.1048.4927.3844.14115.2471.1179.34129.9650.62
Note: Net influx indicates the net influx of embodied carbon; proportion (%) indicates the proportion of net influx of embodied carbon to annual CO2 emissions in each year in Beijing.
Table 7. Structural decomposition results of embodied carbon flowed in Beijing (million tons).
PeriodEfficiency EffectTechnical EffectComposition EffectScale EffectTotal Effect
2002–2010−1.6838.70−13.7227.3650.66
Proportion−3.31%76.39%−27.08%54.00%100%
2002–2007−3.351830.8844−12.762027.707042.4777
Proportion−7.89%72.71%−30.04%65.23%100.00%
2007–20107.02552.46540.6224−1.93238.1809
Proportion85.88%30.14%7.61%−23.62%100.00%

