Investigation of the Effect of Physical and Optical Factors on the Optical Performance of a Parabolic Trough Collector


Abstract
:1. Introduction
2. Method of MCRT Simulation
Algorithm of the MCRT
3. Verification of the MCRT Model
4. Results of Parametric Analysis
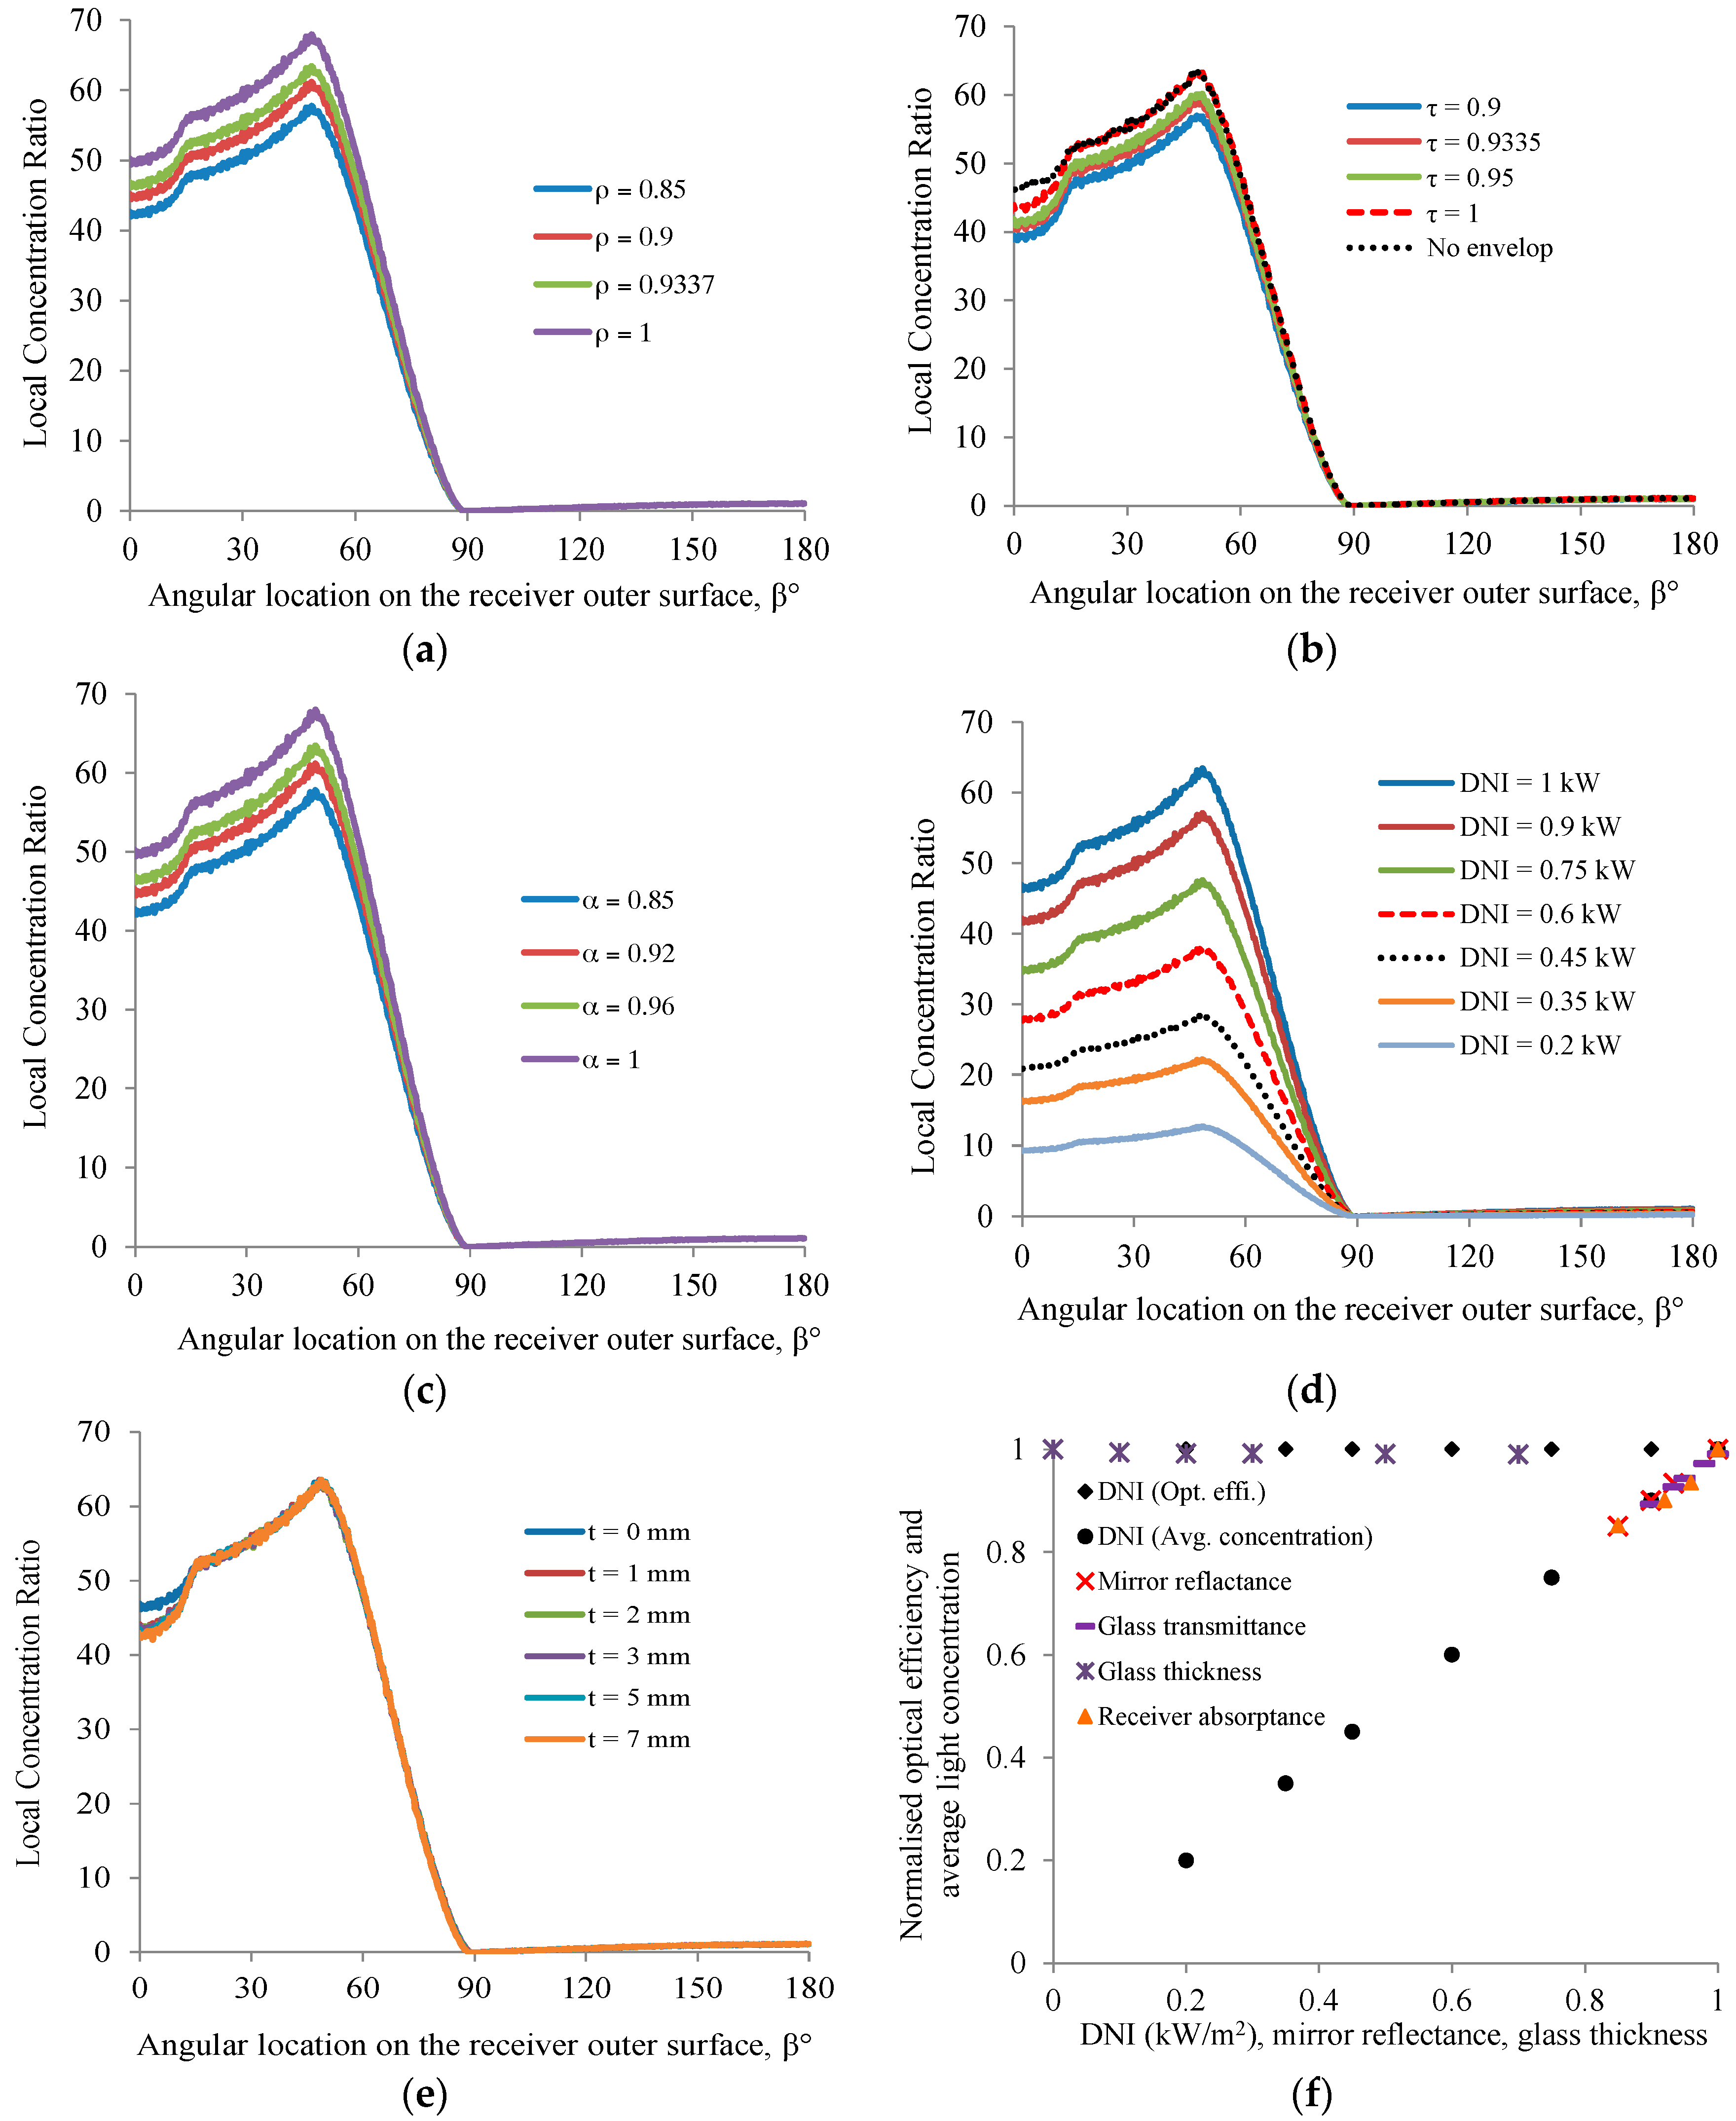
4.1. Effect of Optical Properties of the Collector, DNI and Glass Envelop Thickness
4.2. Effect of Design Parameters of the Collector
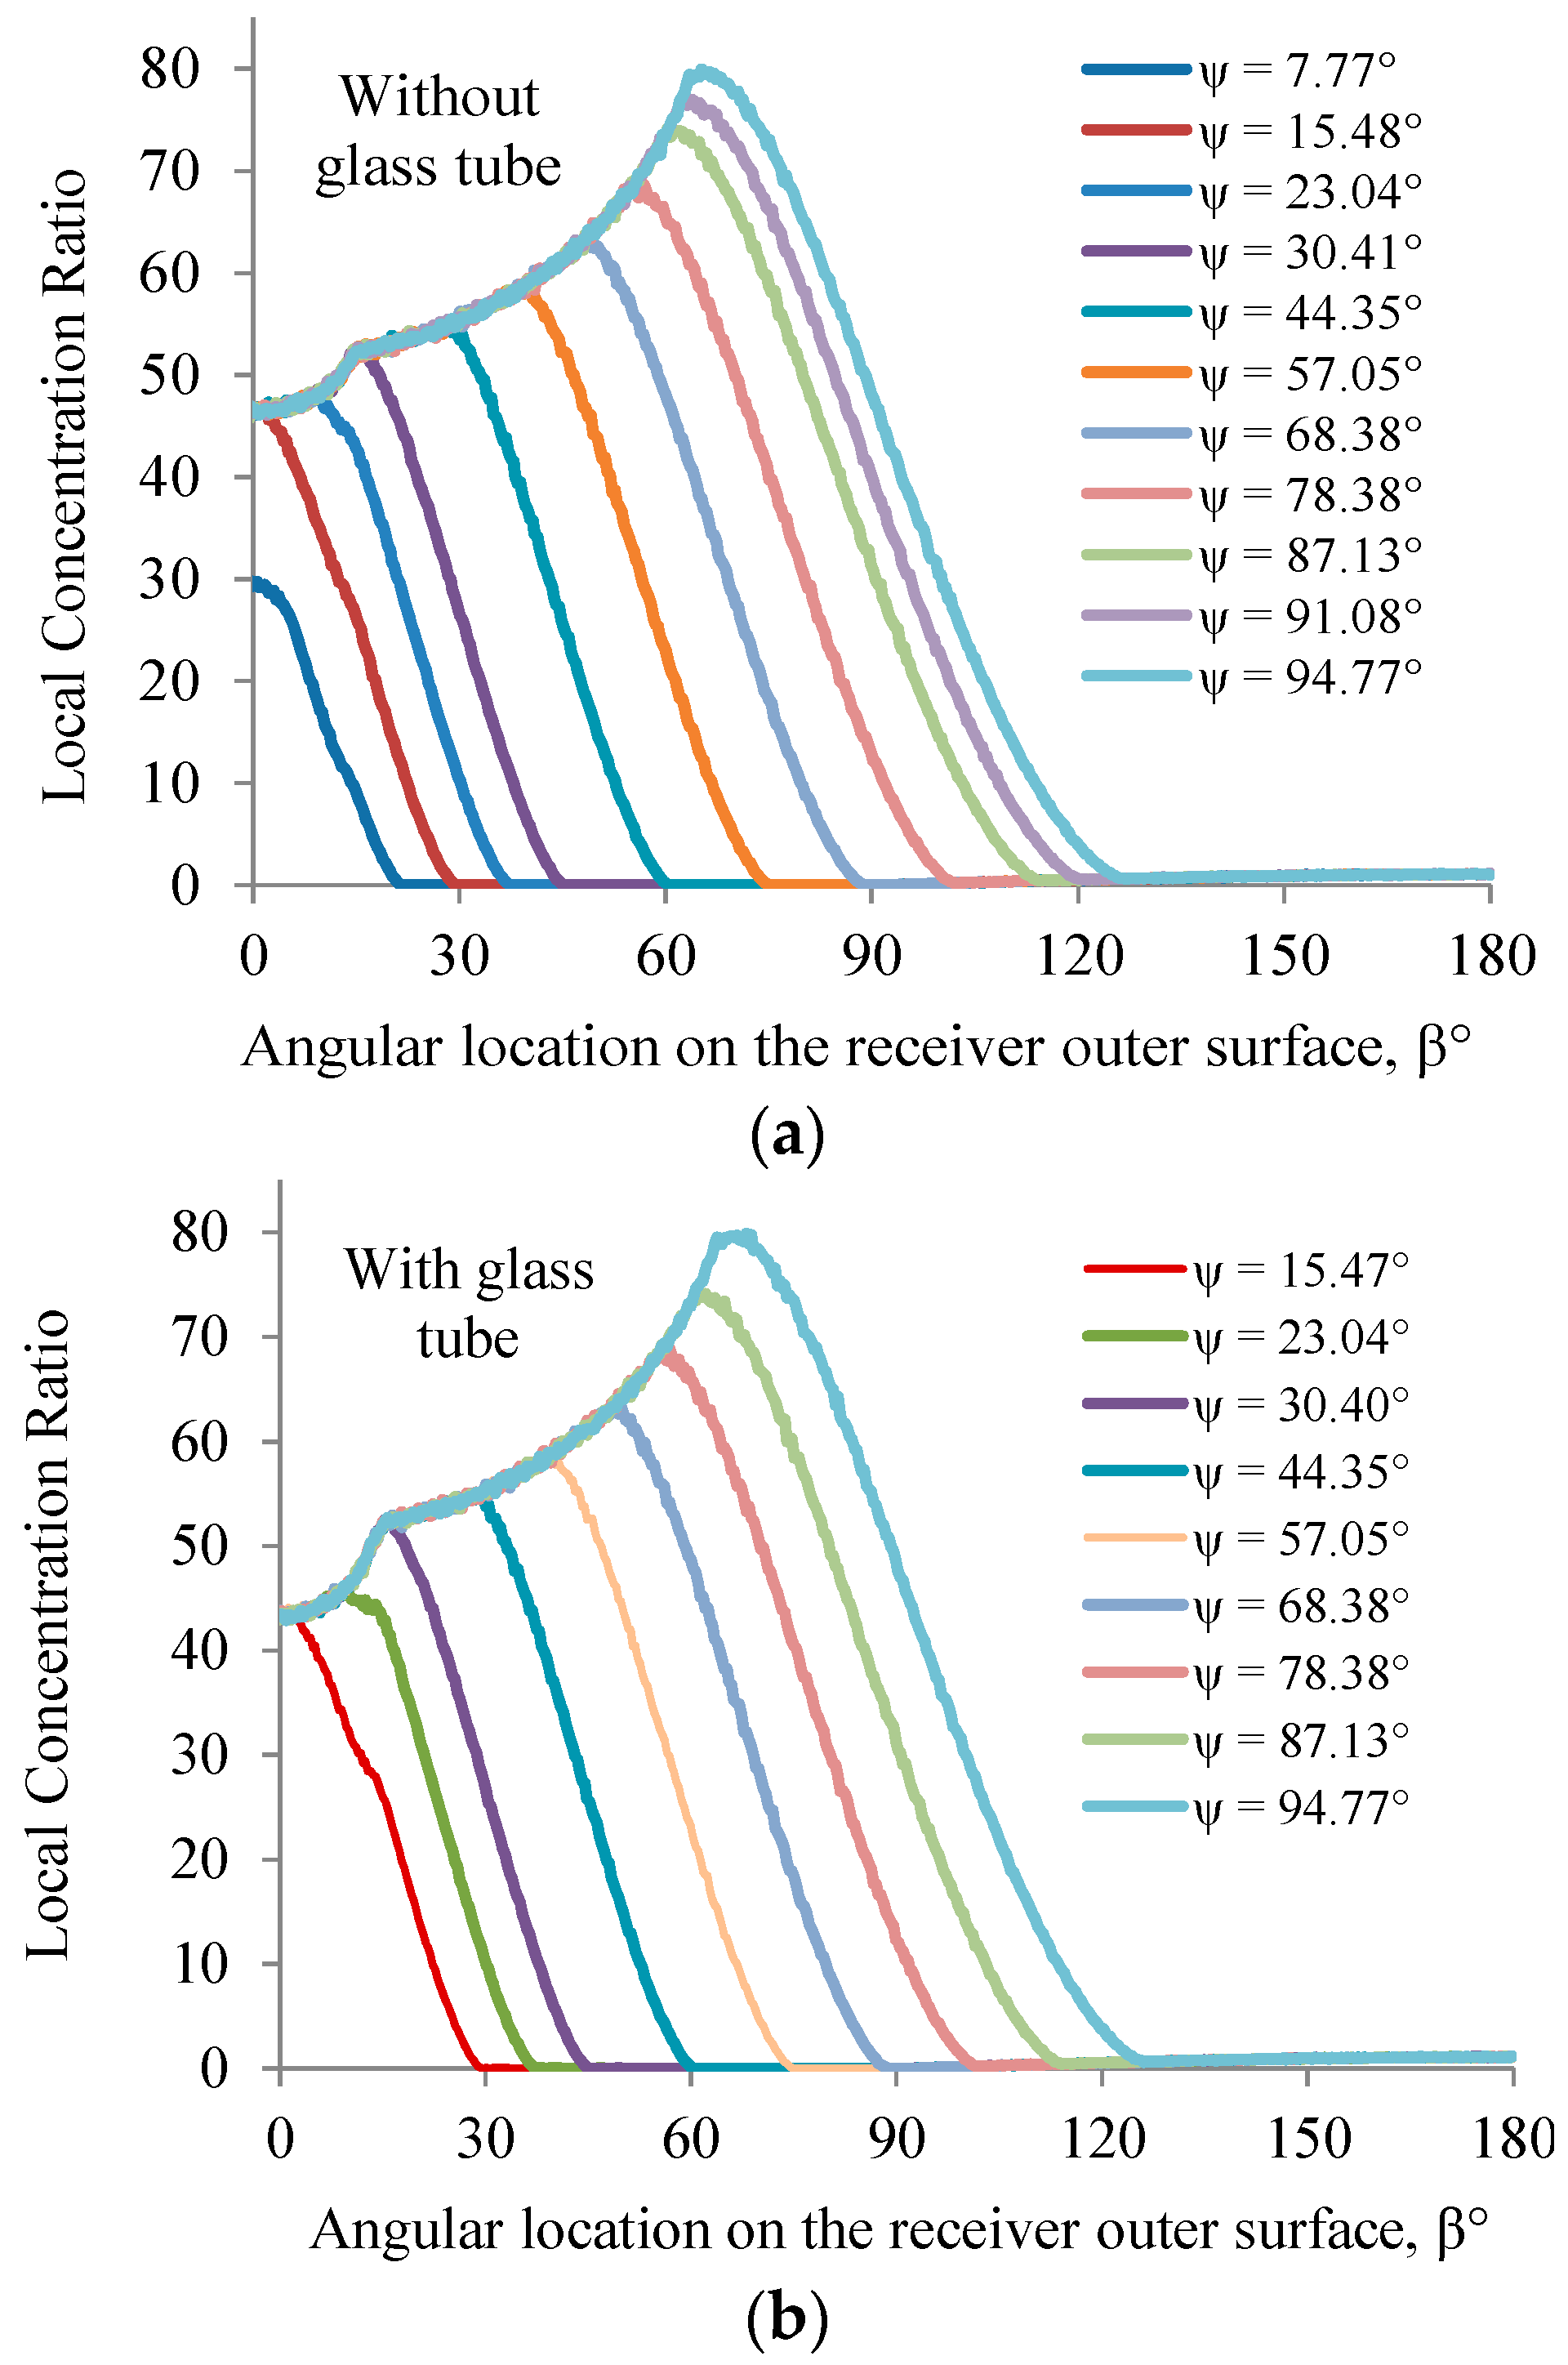
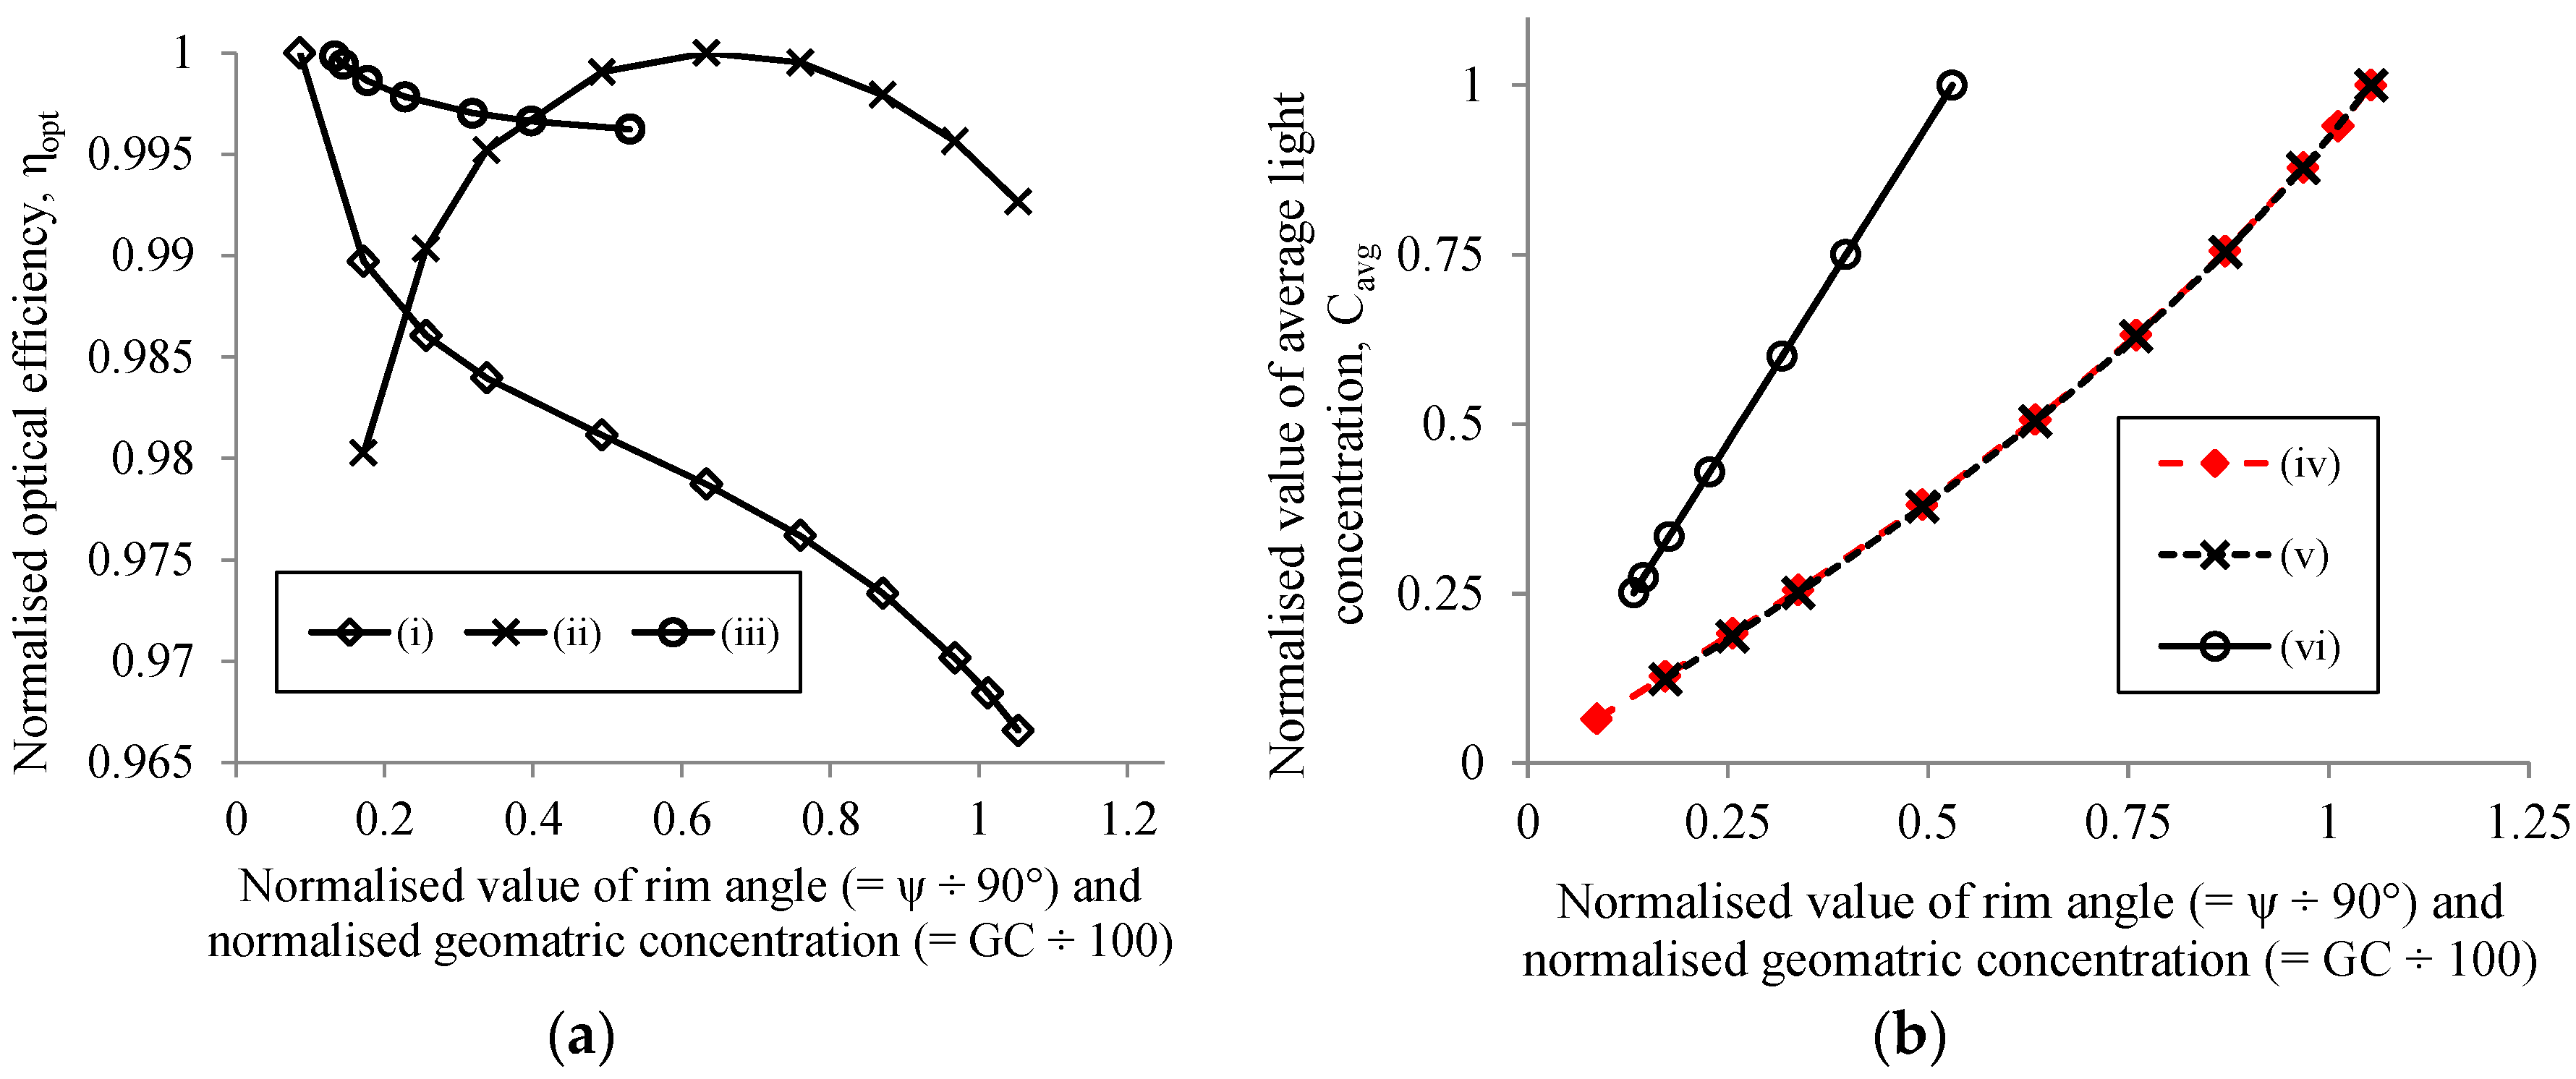
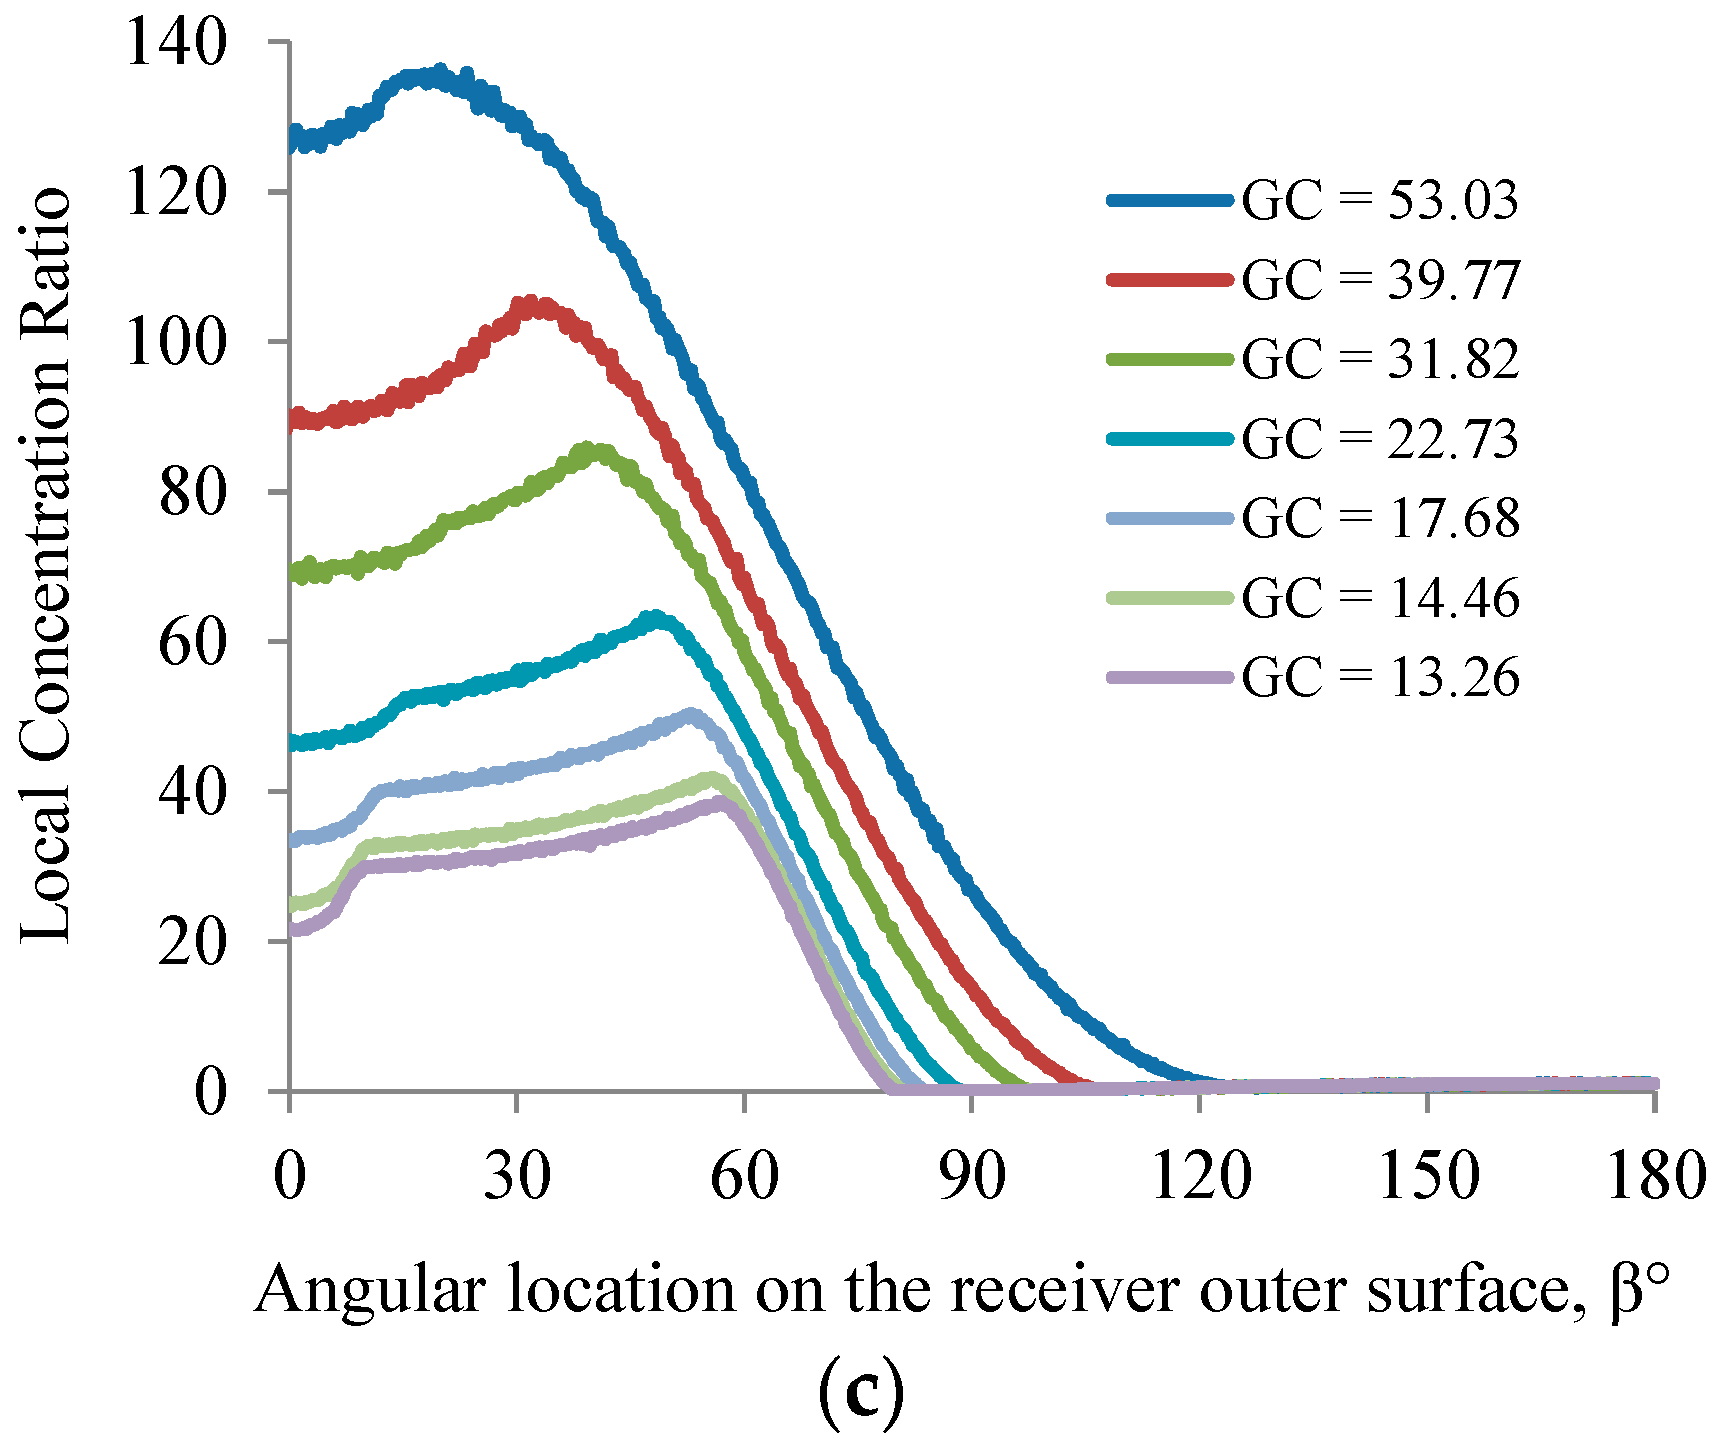
4.2.1. Effect of Rim Angle and GC with a Mirror of Fixed Focal Length
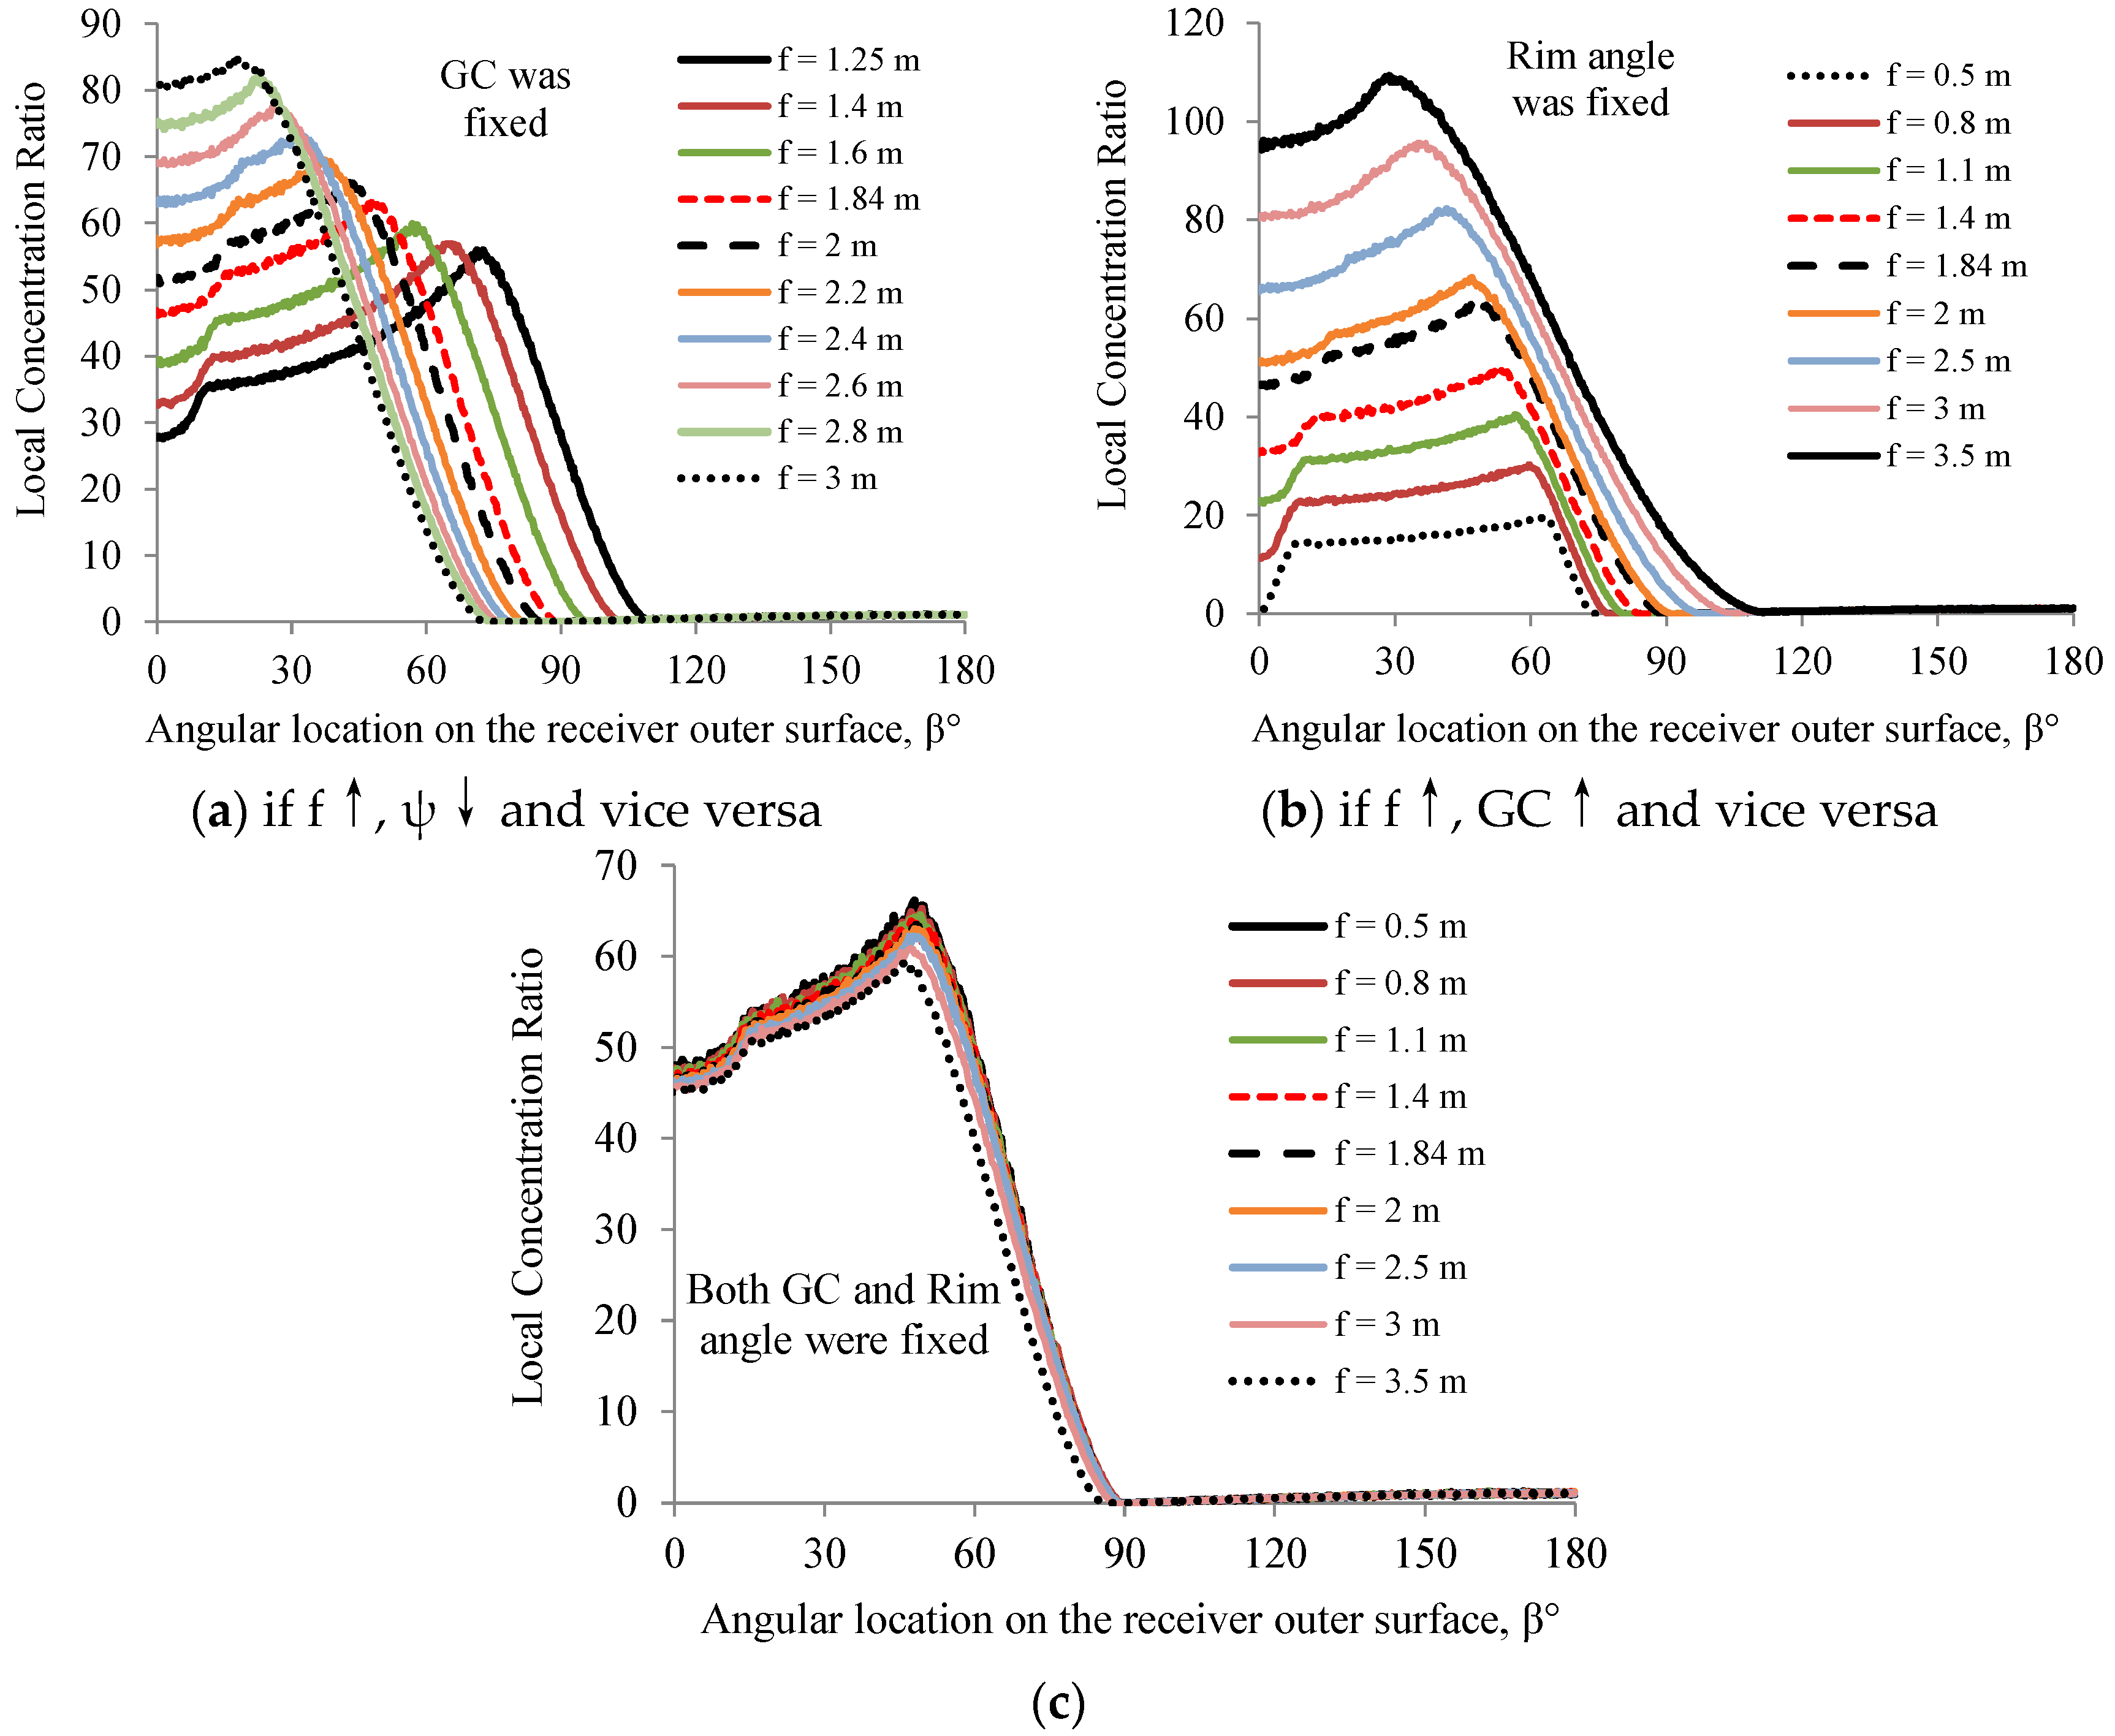
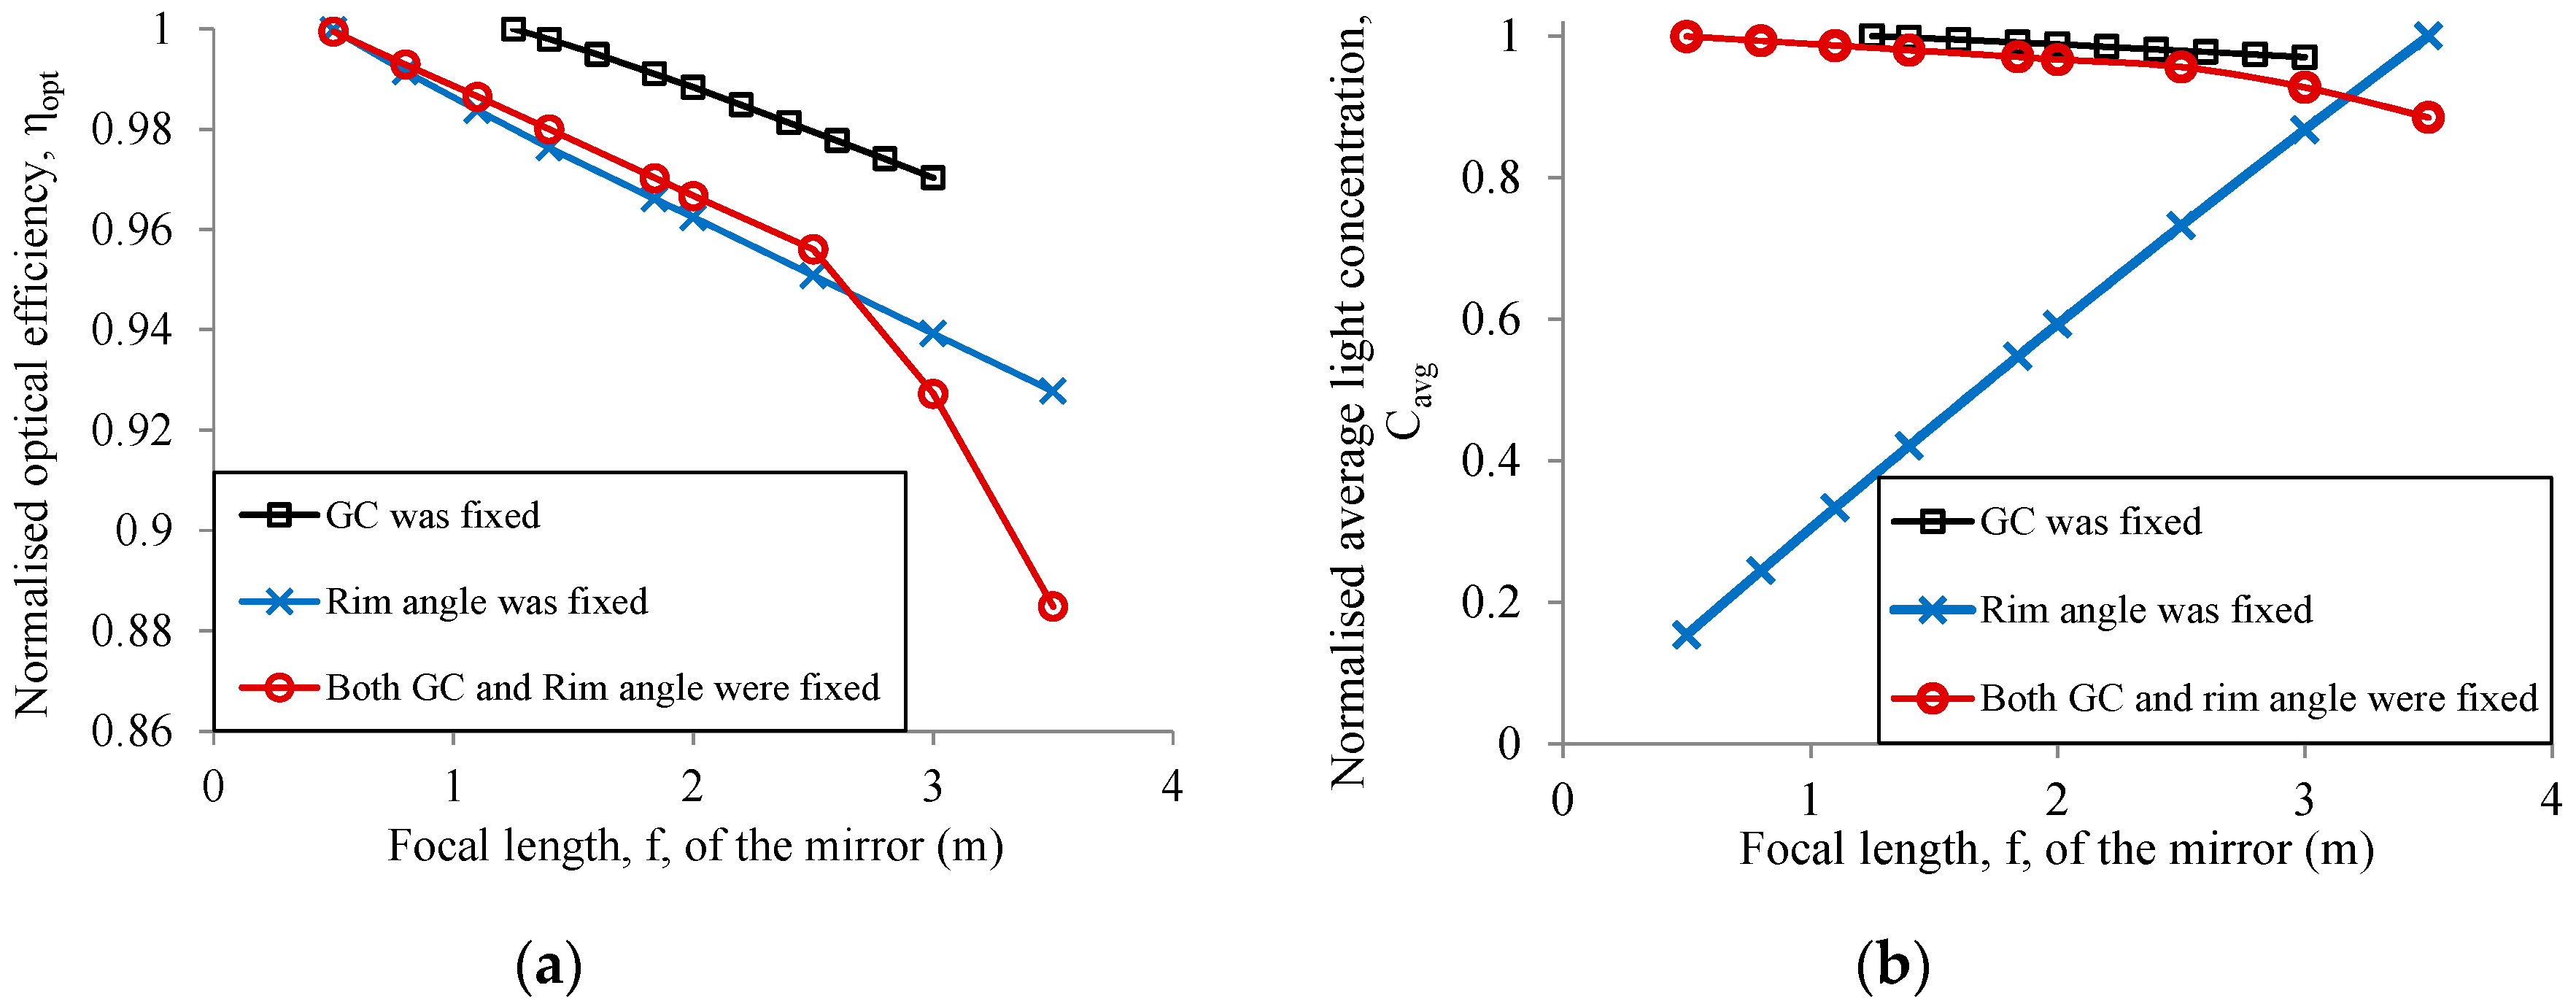
4.2.2. Effect of Mirrors of Different Focal Lengths
4.3. Effect of Optical Errors
4.3.1. Effect of Dislocation of the Receiver
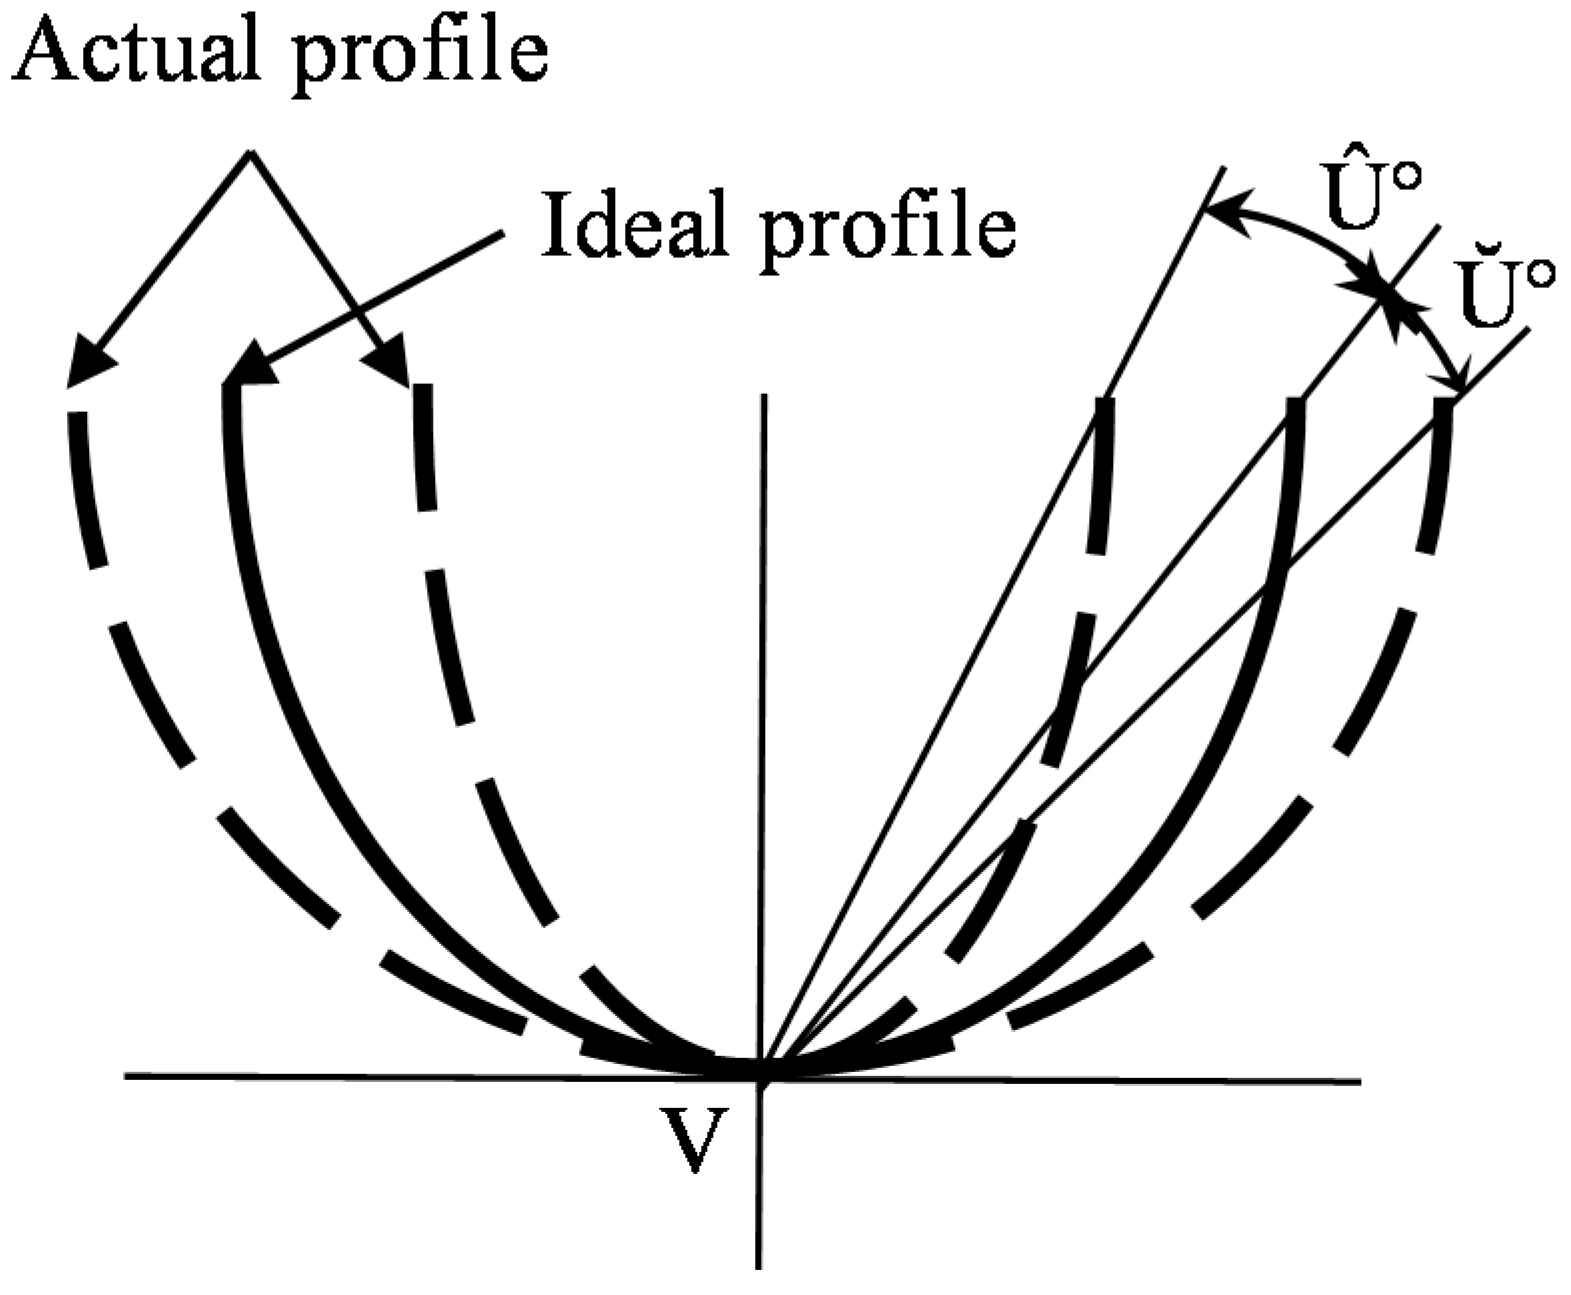
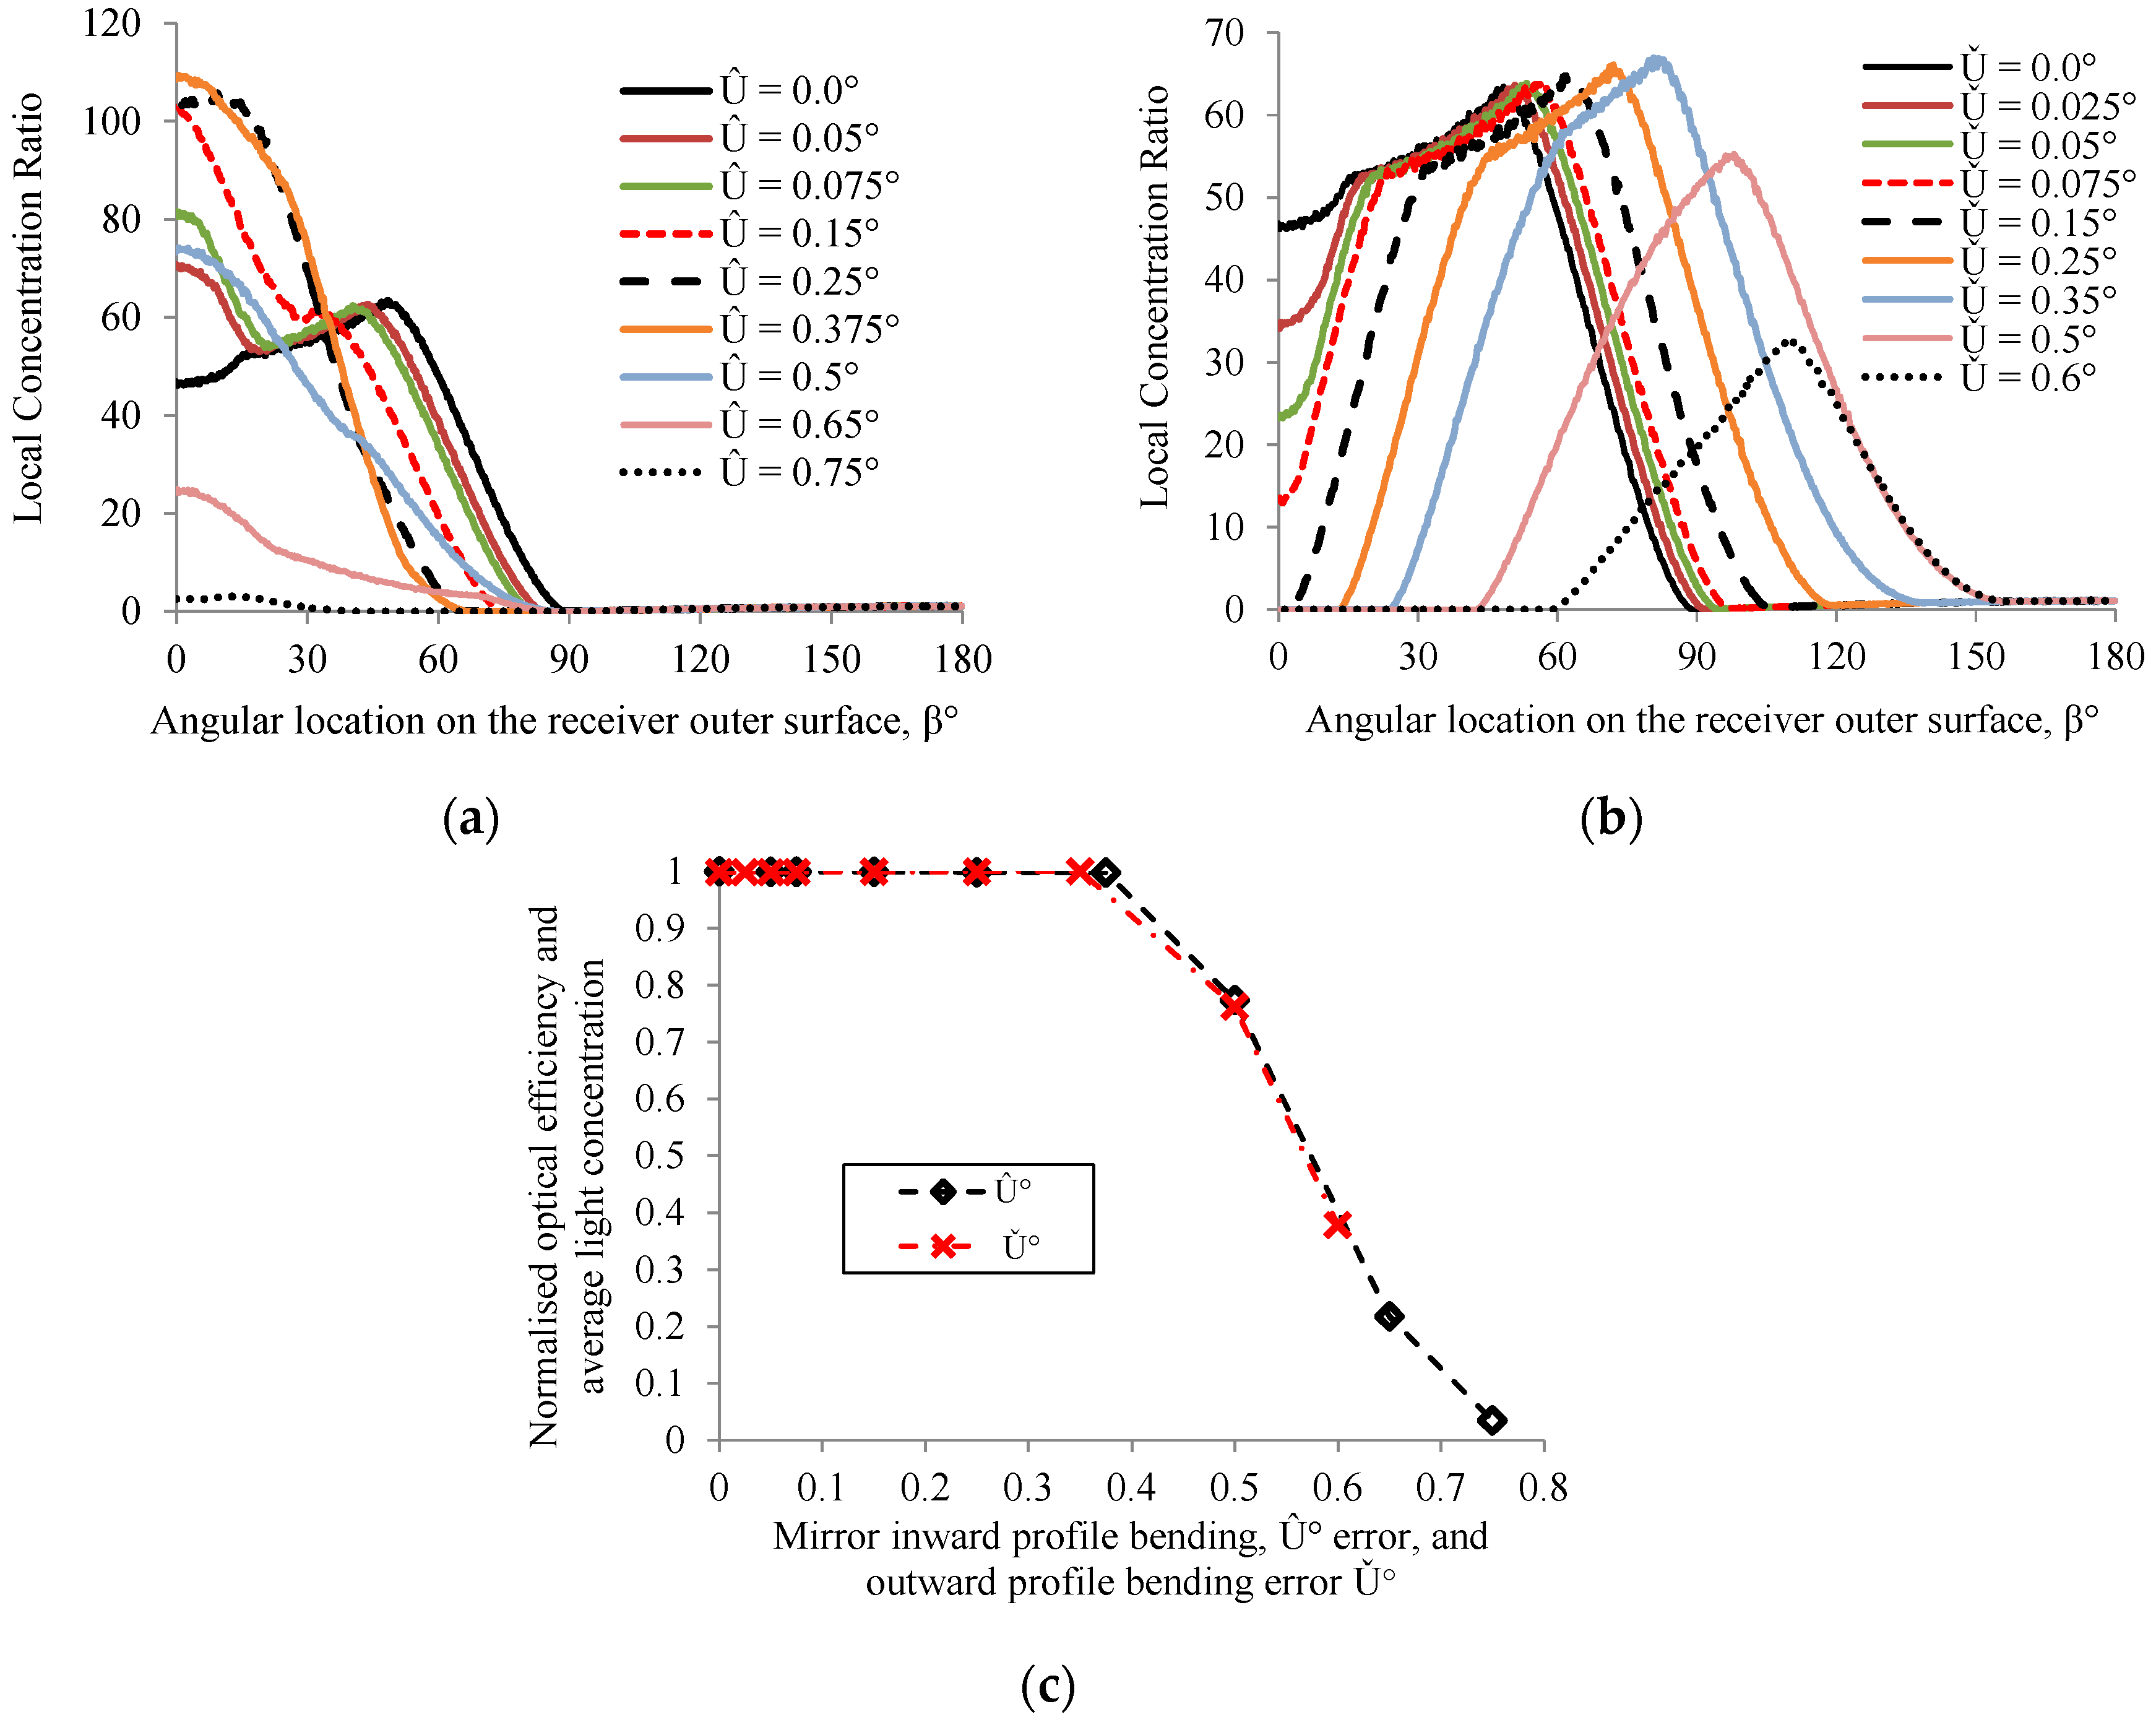
4.3.2. Effect of Deviation of Parabolic Profile of the Mirror
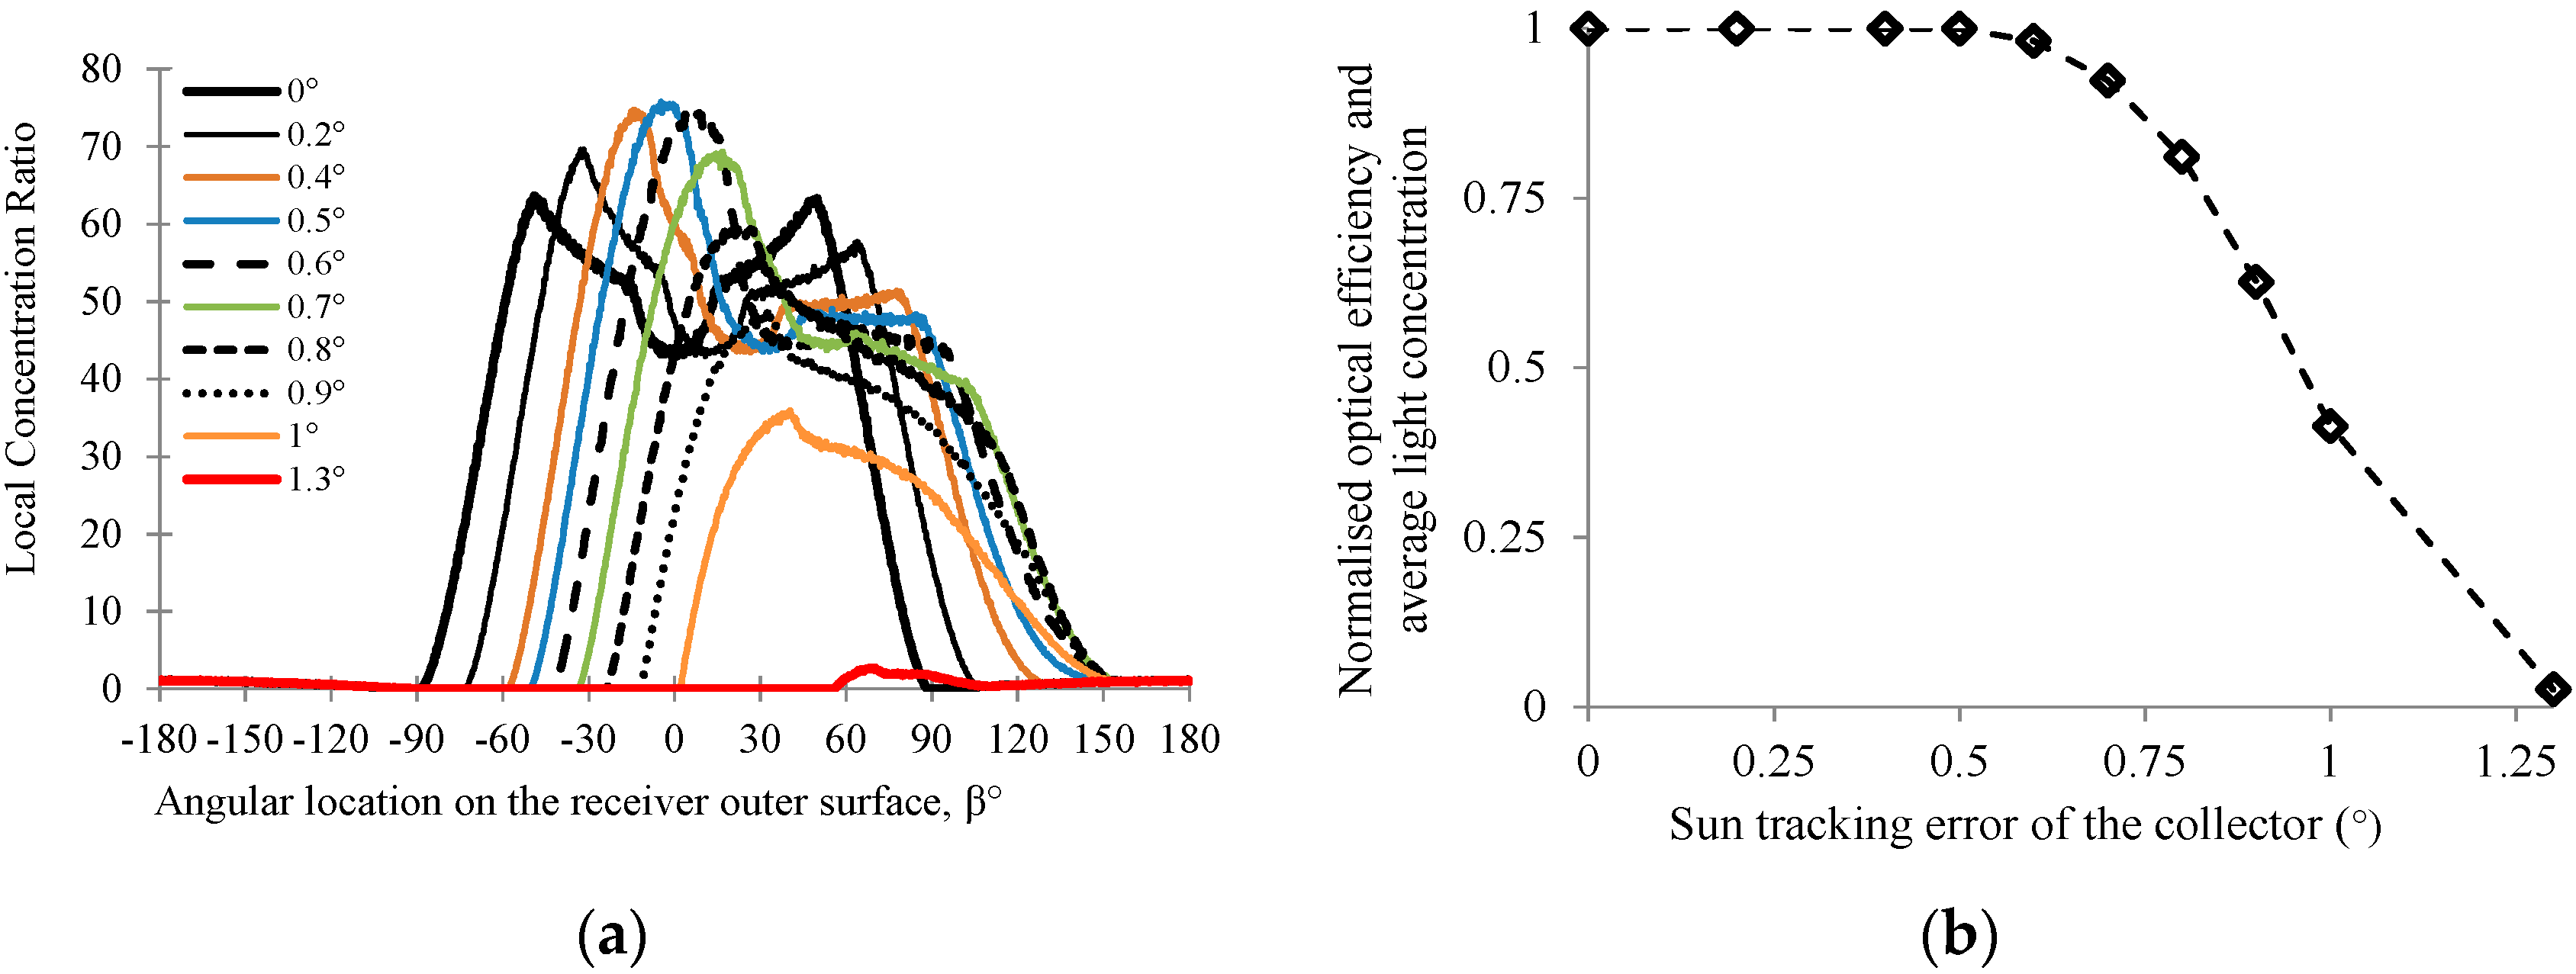
4.3.3. Effect of Tracking Error
5. Conclusions
Acknowledgments
Author Contributions
Conflicts of Interest
Nomenclature
| C | Concentration or Constant |
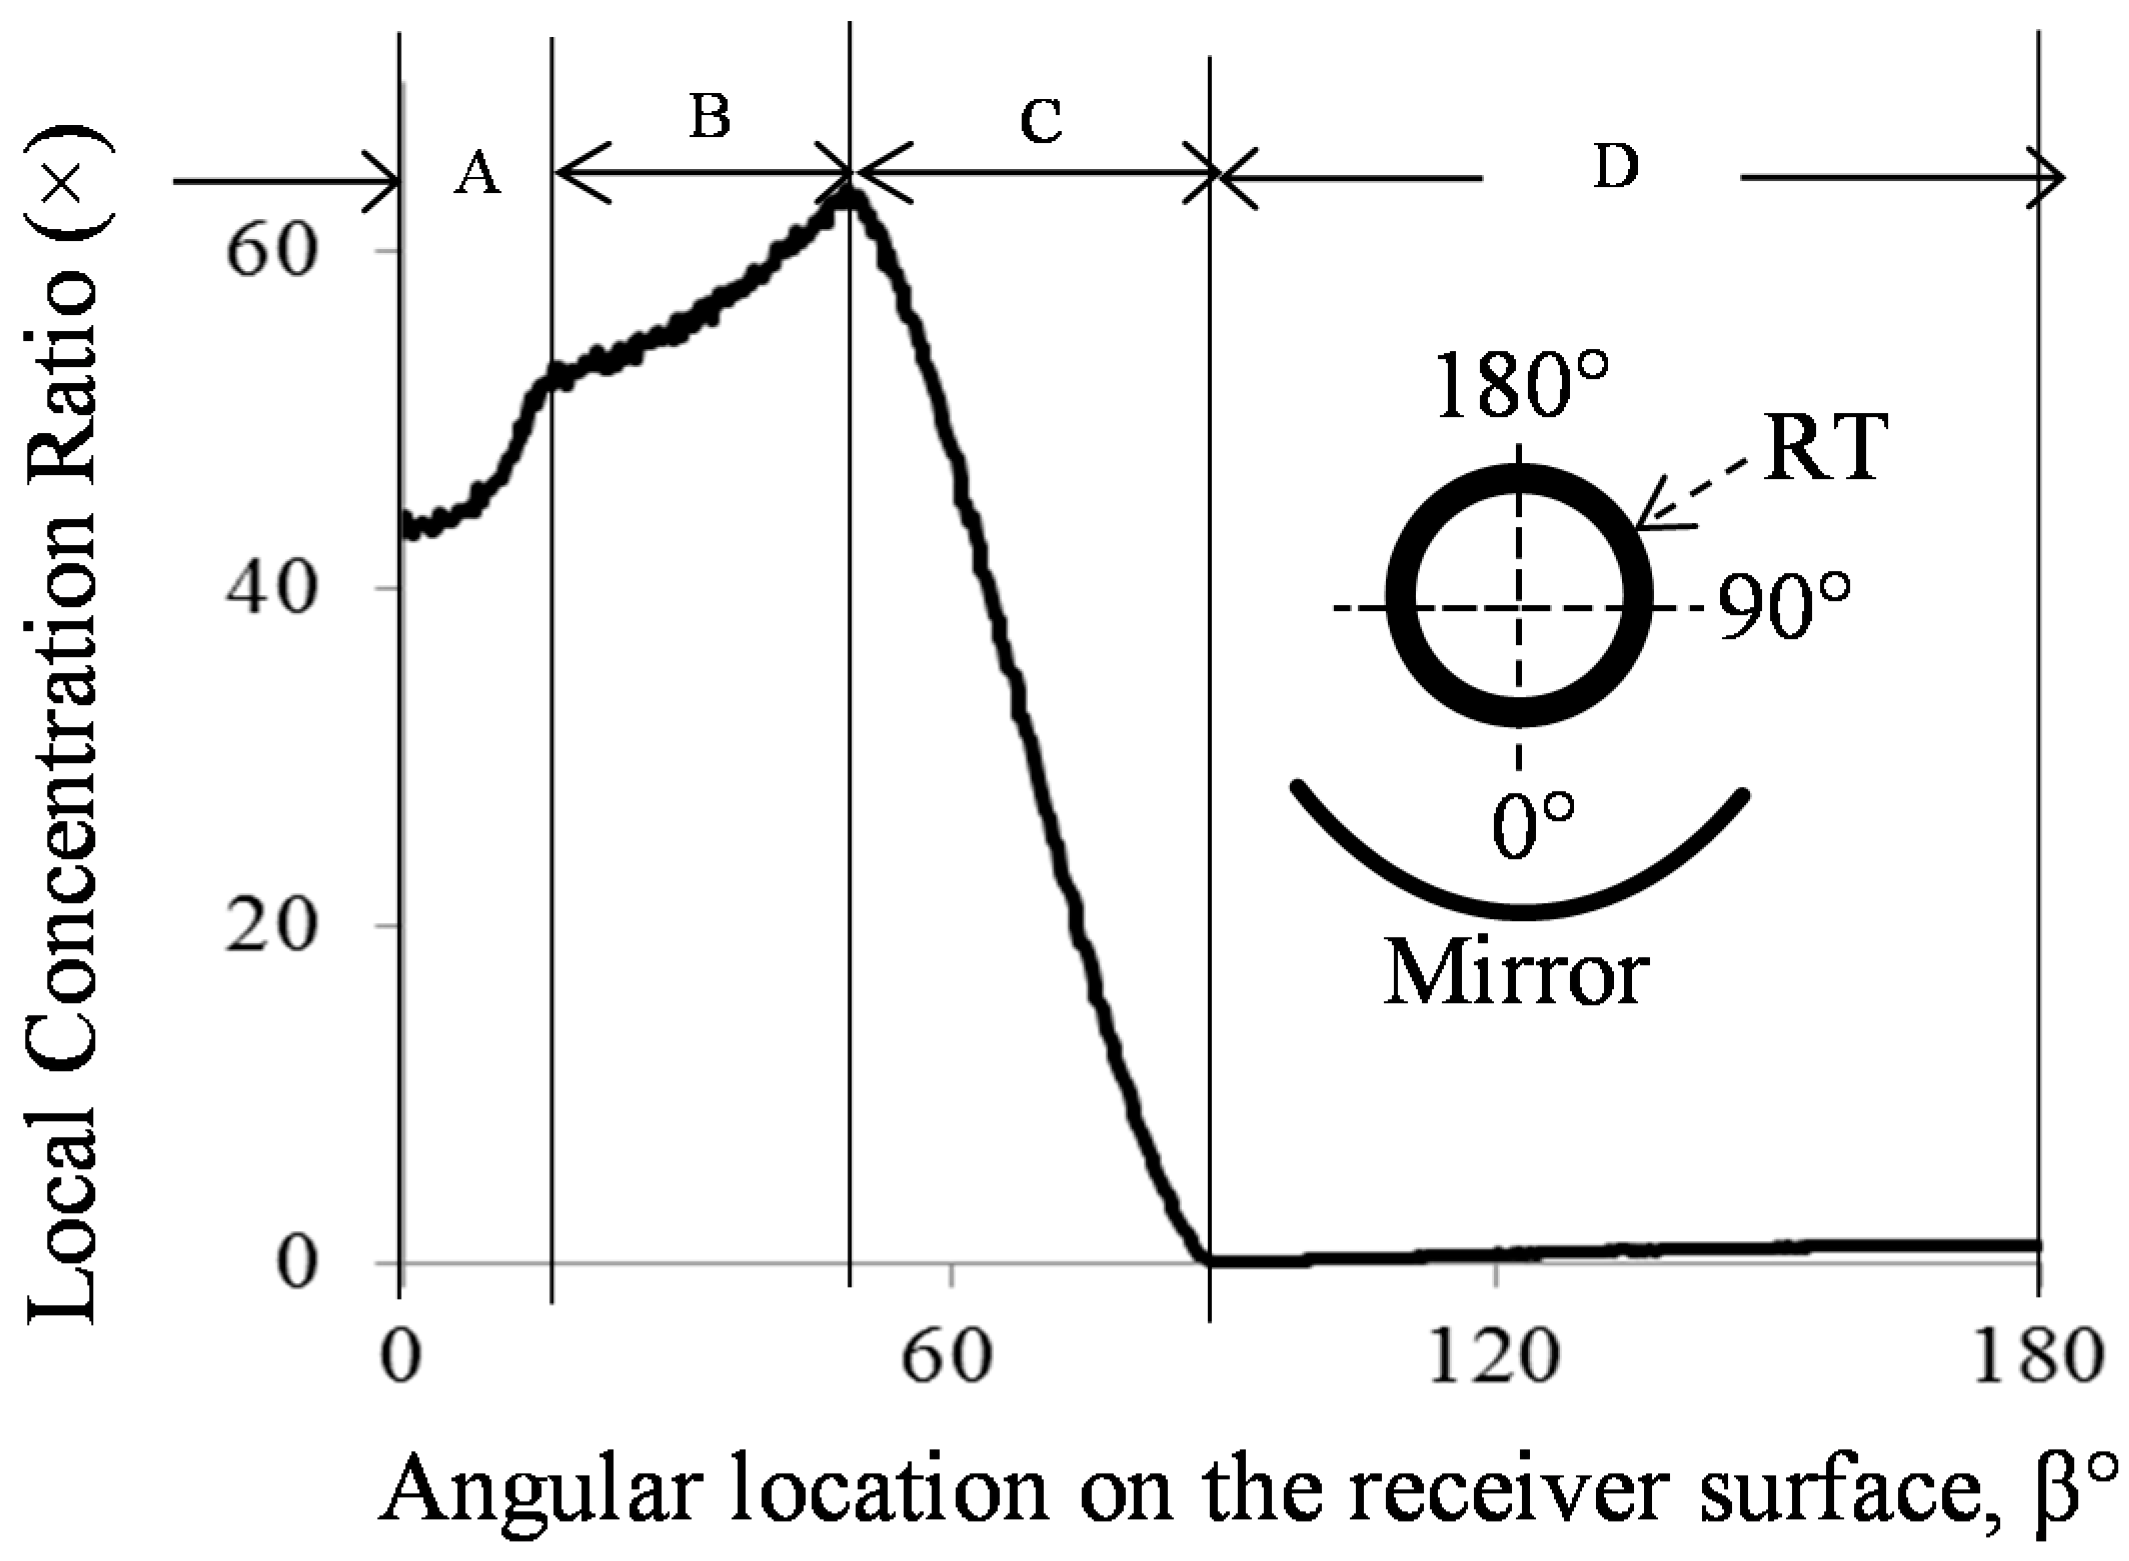
| CF | Concentration Falling zone of a normal LCR profile under ideal condition |
| CI | Concentration Increasing zone of a normal LCR profile under ideal condition |
| DS | Direct Sun zone of a normal LCR profile under ideal condition |
| d | Depth, diameter, deviation, dislocation |
| D | Direction vector |
| DNI | Direct Normal Irradiance |
| E | Error |
| f | Focal length |
| GC | Geometric Concentration (×) (Ratio of mirror aperture area to receiver surface area) |
| GT | Glass Tube |
| I(φ) | Sunshape or light intensity as a function of deflection angle |
| LCR | Local Concentration Ratio (sun) |
| LS2 | Luz Solar 2 collector |
| MAD | Mean Absolute Deviation |
| MC | Monte Carlo |
| MCRT | Monte Carlo Ray Tracing |
| N | Normal vectors, Number of rays per unit aperture area of the sunshape |
| n | Refractive indices of glass and air |
| P | Point of light incidence |
| PT | Parabolic Trough |
| PTC | Parabolic Trough Concentrator |
| r | Radius of the receiver |
| RT | Receiver Tube |
| RS | Receiver Shadowing zone of a normal LCR profile under ideal condition |
| sun | Unit of light concentration (1 kW/m2) |
| t | Thickness |
| TC | Test Conditions |
| W | Half width of the mirror |
| V | Variable or varied |
| X, Y, Z | Cartesian coordinate system |
| X, r, β | Polar coordinate system |
| Symbols | |
| ηopt | Optical efficiency |
| β | Angular location on the receiver |
| ψ | Rim angle (°) of the mirror |
| φ | Deflection angle of sun |
| Û, Ŭ | Inward and outward angular deviation of the mirror profile (°) |
| τGT | Transmittance of glass tube |
| ρPT | Reflectance of mirror |
| ↑, ↓ | Increase or upward, decrease or downward |
| →↔← | lateral direction |
| Suffixes | |
| abs | Absolute |
| avg | Average |
| Expt | Experimental or measured value |
| max | Maximum |
| min | Minimum |
| o | Outer or outside |
References
- Karim, M.A.; Perez, E.; Amin, Z.M. Mathematical modelling of counter flow v-grove solar air collector. Renew. Energy 2014, 67, 192–201. [Google Scholar] [CrossRef]
- Thomas, A.; Guven, H.M. Effect of optical errors on flux distribution around the absorber tube of a parabolic trough concentrator. Energy Convers. Manag. 1994, 35, 575–582. [Google Scholar] [CrossRef]
- Pottler, K.; Lupfert, E.; Johnston, G.H.G.; Shortis, M.R. Photogrammetry: A powerful tool for geometric analysis of solar concentrators and their components. J. Sol. Energy Eng. 2005, 127, 94–101. [Google Scholar] [CrossRef]
- Shortis, M.; Johnston, G. Photogrammetry: An available surface characterization tool for solar concentrators, part II: Assessment of surfaces. J. Sol. Energy Eng. 1997, 119, 286–291. [Google Scholar] [CrossRef]
- Shortis, M.R.; Johnston, G.H.G. Photogrammetry: An available surface characterization tool for solar concentrators, part I: Measurements of surfaces. J. Sol. Energy Eng. 1996, 118, 146–150. [Google Scholar] [CrossRef]
- Riffelmann, K.-J.; Neumann, A.; Ulmer, S. Performance enhancement of parabolic trough collectors by solar flux measurement in the focal region. Sol. Energy 2006, 80, 1303–1313. [Google Scholar] [CrossRef]
- Schiricke, B.; Pitz-Paal, R.; Lupfert, E.; Pottler, K.; Pfander, M.; Riffelmann, K.-J.; Neumann, A. Experimental verification of optical modeling of parabolic trough collectors by flux measurement. J. Sol. Energy Eng. 2009, 131, 11004–11006. [Google Scholar] [CrossRef]
- Jeter, S.M. Analytical determination of the optical performance of practical parabolic trough collectors from design data. Sol. Energy 1987, 39, 11–21. [Google Scholar] [CrossRef]
- Jeter, S.M. Calculation of the concentrated flux density distribution in parabolic trough collectors by a semifinite formulation. Sol. Energy 1986, 37, 335–345. [Google Scholar] [CrossRef]
- Jeter, S.M. The distribution of concentrated solar radiation in paraboloidal collectors. J. Sol. Energy Eng. 1986, 108, 219–225. [Google Scholar] [CrossRef]
- Daly, J.C. Solar concentrator flux distributions using backward ray tracing. Appl. Opt. 1979, 18, 2696–2699. [Google Scholar] [CrossRef] [PubMed]
- Riveros, H.G.; Oliva, A.I. Graphical analysis of sun concentrating collectors. Sol. Energy 1986, 36, 313–322. [Google Scholar] [CrossRef]
- Riveros-Rosas, D.; Sanchez-Gonzalez, M.; Estrada, C.A. Three-dimensional analysis of a concentrated solar flux. J. Sol. Energy Eng. 2008, 130, 14503–14504. [Google Scholar] [CrossRef]
- Cheng, Z.D.; He, Y.L.; Xiao, J.; Tao, Y.B.; Xu, R.J. Three-dimensional numerical study of heat transfer characteristics in the receiver tube of parabolic trough solar collector. Int. Commun. Heat Mass Transf. 2010, 37, 782–787. [Google Scholar] [CrossRef]
- He, Y.-L.; Xiao, J.; Cheng, Z.-D.; Tao, Y.-B. A MCRT and FVM coupled simulation method for energy conversion process in parabolic trough solar collector. Renew. Energy 2011, 36, 976–985. [Google Scholar] [CrossRef]
- Cheng, Z.D.; He, Y.L.; Cui, F.Q. A new modelling method and unified code with mcrt for concentrating solar collectors and its applications. Appl. Energy 2013, 101, 686–698. [Google Scholar] [CrossRef]
- Grena, R. Optical simulation of a parabolic solar trough collector. Int. J. Sustain. Energy 2009, 29, 19–36. [Google Scholar] [CrossRef]
- Wirz, M.; Roesle, M.; Steinfeld, A. Three-dimensional optical and thermal numerical model of solar tubular receivers in parabolic trough concentrators. J. Sol. Energy Eng. 2012, 134, 041012. [Google Scholar] [CrossRef]
- Yang, B.; Zhao, J.; Xu, T.; Zhu, Q. Calculation of the concentrated flux density distribution in parabolic trough solar concentrators by monte carlo ray-trace method. In Proceedings of the 2010 Symposium on Photonics and Optoelectronics, Chengdu, China, 19–21 June 2010. [Google Scholar]
- Kalogirou, S.A.; Lloyd, S.; Ward, J.; Eleftheriou, P. Design and performance characteristics of a parabolic-trough solar-collector system. Appl. Energy 1994, 47, 341–354. [Google Scholar] [CrossRef]
- Coventry, J.S. Performance of a concentrating photovoltaic/thermal solar collector. Sol. Energy 2005, 78, 211–222. [Google Scholar] [CrossRef]
- Kabakov, V.I.; Levin, L.B. A choice of the position of receiver with photocells in parabolic trough concentrator. Sol. Energy Mater. Sol. Cells 1994, 33, 45–49. [Google Scholar] [CrossRef]
- Islam, M.; Karim, M.A.; Saha, S.C.; Miller, S.; Yarlagadda, P.K.D.V. Development of empirical equations for irradiance profile of a standard parabolic trough collector using monte carlo ray tracing technique. Adv. Mater. Res. Energy Dev. 2014, 860–863, 180–190. [Google Scholar] [CrossRef]
- Dudley, V.E.; Kolb, G.J.; Mahoney, A.R.; Mancini, T.R.; Matthews, C.W.; Sloan, M.; Kearney, D. Test Results: SEGS LS-2 Solar Collector; National Technical Information Service, US Department of Commerce: Springfield, VA, USA, 1994; p. 139.
- Buie, D.; Dey, C.J.; Bosi, S. The effective size of the solar cone for solar concentrating systems. Sol. Energy 2003, 74, 417–427. [Google Scholar] [CrossRef]
- Forristall, R. Heat Transfer Analysis and Modeling of a Parabolic Trough Solar Receiver Implemented in Engineering Equation Solver; Technical Report No. NERL/TP-550-34169; National Renewable Energy Laboratory: Golden, CO, USA, 2003.


| TC | DNI | Selective Coatings | Glass Tube Condition | (ηopt)Expt | (Eest)Expt | (ηopt)MCRT | (dabs)MCRT | (dabs)avg |
|---|---|---|---|---|---|---|---|---|
| (W/m2) | (%) | (%) | (%) | (%) | (%) | |||
| 1 | 807.9 | Cermet | Vacuum | 72.63 | 1.91 | 77.89 | 7.24 | 6.19 |
| 2 | 925.1 | Cermet | Air filled | 73.68 | 1.96 | 76.42 | 3.72 | |
| 3 | 954.5 | Cermet | Removed | 77.5 | - | 82.59 | 6.57 | |
| 4 | 850.2 | Black Chrome | Vacuum | 73.1 | 2.36 | 78.38 | 7.22 |
| Variation of Mirror with Different Focal Length | Cmin (sun) | Cmax (sun) | Cavg (sun) | MAD | ||
|---|---|---|---|---|---|---|
| Ideal LS2 collector, GC = 22.74, ψ ≈ 70°, f = 1.84 m | 0 | 63.5 | 21.8 | 23.7 | ||
| Mirror focal length is fixed | do = V ψ = C | GC = 53.03 | 0.5 | 136.8 | 50.9 | 48.7 |
| GC = 13.26 | 0 | 38.7 | 12.8 | 14.2 | ||
| do = C W = V | ψ = 44.35° | 0 | 55.3 | 13.2 | 17.6 | |
| ψ = 87.13° | 0.4 | 74.3 | 30.4 | 26.3 | ||
| Mirror focal length is variable | GC = C ψ = V | f = 1.4 m | 0.2 | 57.4 | 22.0 | 20.5 |
| f = 3 m | 0 | 85.0 | 21.4 | 27.2 | ||
| GC = V ψ = C | f = 1.4 m | 0 | 50.4 | 16.8 | 18.5 | |
| f = 3 m | 0.2 | 96.0 | 34.6 | 35.5 | ||
| GC = C ψ = C | f = 1.4 m | 0 | 64.4 | 22.1 | 23.9 | |
| f = 3 m | 0 | 61.2 | 20.9 | 22.8 | ||
| Error of the Collector Elements | Cmin (sun) | Cmax (sun) | Cavg (sun) | MAD | ||
|---|---|---|---|---|---|---|
| Ideal LS2 collector, GC = 22.74, ψ ≈ 70°, f = 1.84 m | 0 | 63.5 | 21.8 | 23.7 | ||
| Receiver dislocation | Off-focus | d↑ = 0.14r | 0.0 | 69.6 | 21.8 | 25.5 |
| d↑ = 0.77r | 0 | 216.4 | 21.7 | 33.2 | ||
| Defocus | d↓ = 0.14r | 0.116 | 58.9 | 21.9 | 21.9 | |
| d↓ = 0.77r | 1.0 | 41.6 | 21.8 | 12.4 | ||
| Out-focus | d↔ = 0.14r | 0.0 | 102.6 | 21.8 | 23.4 | |
| d↔ = 0.77r | 0 | 13.4 | 2.8 | 3.2 | ||
| Tracking error | 0.2° | 0 | 69.7 | 21.7 | 23.4 | |
| 1° | 0.0 | 35.9 | 9.0 | 10.8 | ||
| Mirror profile deviation | Inward deviation | Û = 0.05° | 0 | 71.0 | 21.8 | 24.8 |
| Û = 0.375° | 0 | 109.8 | 21.8 | 30.0 | ||
| Outward deviation | Ǔ = 0.05° | 0.062 | 64.0 | 21.9 | 22.5 | |
| Ǔ = 0.35° | 0 | 67.0 | 21.9 | 21.9 | ||
© 2017 by the authors. Licensee MDPI, Basel, Switzerland. This article is an open access article distributed under the terms and conditions of the Creative Commons Attribution (CC BY) license (http://creativecommons.org/licenses/by/4.0/).
Share and Cite
Islam, M.; Miller, S.; Yarlagadda, P.; Karim, A. Investigation of the Effect of Physical and Optical Factors on the Optical Performance of a Parabolic Trough Collector. Energies 2017, 10, 1907. https://doi.org/10.3390/en10111907
Islam M, Miller S, Yarlagadda P, Karim A. Investigation of the Effect of Physical and Optical Factors on the Optical Performance of a Parabolic Trough Collector. Energies. 2017; 10(11):1907. https://doi.org/10.3390/en10111907
Chicago/Turabian StyleIslam, Majedul, Sarah Miller, Prasad Yarlagadda, and Azharul Karim. 2017. "Investigation of the Effect of Physical and Optical Factors on the Optical Performance of a Parabolic Trough Collector" Energies 10, no. 11: 1907. https://doi.org/10.3390/en10111907
APA StyleIslam, M., Miller, S., Yarlagadda, P., & Karim, A. (2017). Investigation of the Effect of Physical and Optical Factors on the Optical Performance of a Parabolic Trough Collector. Energies, 10(11), 1907. https://doi.org/10.3390/en10111907