Article

Effect of Charcoal and Kraft-Lignin Addition on Coke Compression Strength and Reactivity

Process Metallurgy Research Unit, University of Oulu, P.O. Box 4300, FI-90014 Oulu, Finland
*
Author to whom correspondence should be addressed.
Energies 2017, 10(11), 1850; https://doi.org/10.3390/en10111850
Submission received: 18 October 2017 / Revised: 7 November 2017 / Accepted: 9 November 2017 / Published: 13 November 2017
(This article belongs to the Special Issue Thermo Fluid Conversion of Biomass)

Abstract

:
The aim of this research was to investigate the effects of charcoal and Kraft-lignin additions on the structure, cold compression strength, and reactivity of bio-cokes produced at the laboratory scale. Bio-cokes were prepared by adding charcoal and Kraft-lignin (2.5, 5.0, 7.5, and 10.0 wt %) to medium-volatile coal and coking the mixture with controlled heating rate (3.5 °C/min) up to 1200 °C. In addition, four particle sizes of charcoal were added with a 5 wt % addition rate to investigate the effect of particle size on the compression strength and reactivity. Thermogravimetric analysis was used to evaluate the pyrolysis behavior of coal and biomasses. Optical microscopy was used to investigate the interaction of coal and biomass components. It was found that by controlling the amount of charcoal and Kraft-lignin in the coal blend, the compression strength of the bio-cokes remains at an acceptable level compared to the reference coke without biomass addition. The cold compression strength of the charcoal bio-cokes was higher compared to Kraft-lignin bio-cokes. The reactivity of the bio-cokes with charcoal addition was markedly higher compared to reference coke and Kraft-lignin bio-cokes, mainly due to the differences in the physical properties of the parental biomass. By increasing the bulk density of the coal/biomass charge, the cold compression strength of the bio-cokes can be improved substantially.

1. Introduction

The sustainability of iron and steel production is heavily dependent on the used fuels. Large quantities of fossil-based carbon, mainly in the forms of coal and coke, is needed in the iron oxide reduction and melting. Coal is considered to be a non-renewable fuel and the emitted CO2 emissions are accumulated in the atmosphere. The use of biomass in metallurgical unit processes has been identified as one of the future technologies to decrease the use of non-renewable fuels, thereby decreasing the CO2 emission accumulation in the atmosphere [1]. The carbon cycle of biomass, such as wood, is short; the CO2 released in the burning of the wood is captured back to the wood as it grows again. This means that the CO2 level in the atmosphere is not growing. Biomass could be used in several applications in iron and steelmaking, including injection to the blast furnace (BF) and use in the coking plant to produce bio-coke [2].
Metallurgical coke production is done with high-temperature carbonization (1000–1200 °C) with the absence of air. When part of the fossil coking coal is replaced with some sort of biomass, it is termed as bio-coke [2]. Several types of biomass-based materials have been added to the coal blend to see their effects on coke quality. Raw biomasses [3,4]; woody components; cellulose and lignin [5]; torrefied biomass [4,6]; and pyrolysis products, such as charcoal, tar, and bio-oil [4,5,7], have been incorporated into the coal blend. Kraft-lignin, which is a by-product from Kraft pulping process black liquor, has been studied as a binder material of anthracite fines [8], as part of semicoke [9] and as carbonized hydrochars added to the coal blend [10].
The use of any kind of biomass-derived material in coal blend weakens the fluidity development during the plastic phase, increases the reactivity of coke, and can also negatively affect its post-reaction strength [2]. The use of raw woody biomasses is likely to be limited to very small amounts (e.g., below 2 wt %). This is due to the large amount of volatiles released before and during the plastic phase of coking, causing strong shrinking and poor connectivity between coal and biomass particles, as well as the release of oxygen, which impairs the fluidity development of the plastic phase [11]. It has been found that coke quality can be better maintained if biomass is pre-carbonized before its addition to the coal blend [2]. By pre-carbonizing the woody biomass at 400 °C or above, the maximum addition could be in the range of 5–10 wt %, while maintaining the reactivity (measured with the coke reactivity index, CRI) and post-reaction strength (measured by the coke strength after reaction, CSR) at reasonable level [12,13]. Larger particle sizes of the biofuel are beneficial to the CRI and CSR values of the bio-coke [14,15]. With smaller-sized biomass particles, the catalyzing effect of finely-dispersed calcium on coke gasification is more intense, resulting in higher reactivity [7].
In this research, two biomass-based raw materials, charcoal produced from young pruned stem wood and Kraft-lignin derived from the pulping process, were added to the coal blend in different proportions. These raw materials were selected since their availability is forecasted to increase in the future. The global forestry residue potential can be up to 35 exajoules (EJ) and the contribution of Kraft-lignin could be 50 million tons a year, i.e., around 1.1 EJ [16,17]. In this study, the impact of biomass addition on bio-coke cold strength development and chemical reactivity of the produced bio-cokes were investigated. The impact of the bulk density on the strength development was also evaluated. Thermogravimetric methods were used to investigate the thermal behavior of raw materials. Cold compression strength was measured at room temperature with a thermomechanical simulator. Chemical reactivity of the coke was measured both in isothermal and non-isothermal conditions in blast furnace shaft gas simulating conditions.

2. Materials and Methods

2.1. Materials

A medium volatile coking coal, charcoal produced from pine chips and Kraft-lignin, recovered from the pulping process were used as raw materials in this study. Bituminous coal with 23.1 wt % volatile matter on a dry basis, maximum Gieseler fluidity 545 ddpm and 10.9 wt % total moisture was used as a basic component of the blends. Pine chips that were used as raw material for charcoal production were produced from young, pruned stems and dried before carbonization. Carbonization of the pine chips was done in an in-house-built slow pyrolysis reactor. The heating rate in the carbonization was 5 °C/min and the heating was terminated when the internal temperature of the sample reached 600 °C. Kraft-lignin was dried before the coking process in 105 °C for 6 h. The chemical analysis of the coking coal was done at the SSAB Europe Raahe steel plant, located in Raahe, Finland. The chemical analysis of the charcoal and Kraft-lignin was done in external certified laboratory service provider (AHMA ympäristö Oy) according to applicable standards. The chemical composition of charcoal ash was determined with X-ray fluorescence (XRF) (Bruker AXS S4 Pioneer, Bruker AXS GmbH, Karlsruhe, Germany) and the chemical composition of Kraft-lignin was conducted by an external certified laboratory. The basicity index, BI (%), of the coal, charcoal, and Kraft-lignin was defined as the ratio between the basic and acid components in the ash (Equation (1)) [10].
BI (%) = (CaO + Fe2O3 + MgO + Na2O + K2O)/(SiO2 + Al2O3) × A
where A is the ash percentage of the sample. Coking coal and charcoal were crushed with a jaw crusher and ground with ring grinder. Kraft-lignin was ground in an agate mortar. After grinding, the samples were sieved to the wanted particle sizes. The particle size of the coking coal was as follows: 70 wt % was sieved to a size range of 0.5–1.0 mm and 30 wt % to smaller than 0.5 mm. Charcoal and Kraft-lignin additions (described in Section 2.3) decreased the proportion of larger coking coal in the blend. For example, in the case of 10 wt % charcoal addition the coal proportions were 60 wt % of 0.5–1.0 mm and 30 wt % of <0.5 mm coal particles.

2.2. Thermogravimetric Analysis

Thermogravimetric and differential thermogravimetric (TG/DTG) analysis of coal, charcoal, and Kraft-lignin was conducted with a Netzsch STA 409 PC Luxx (NETZSCH-Gerätebau GmbH, Selb, Germany). The temperature was raised from room temperature to 1200 °C at a heating rate of 3.5 °C/min in purified nitrogen (99.999%) at a flow rate of (60 mL/min) to maintain an inert atmosphere. The sample size was approximately 15 mg with a particle size of 125–250 μm. Normalized volatile matter evolution up to a specific temperature (VMT) was calculated according to procedure described in [18] (Equation (2)).
VMT = (M0Mi)/(M0Mf) × 100
where VMT denotes the volatile matter evolved up to specific temperature and normalized to 100 wt %. M0, Mf, and Mi are the initial mass, final mass, and mass at time i, respectively.

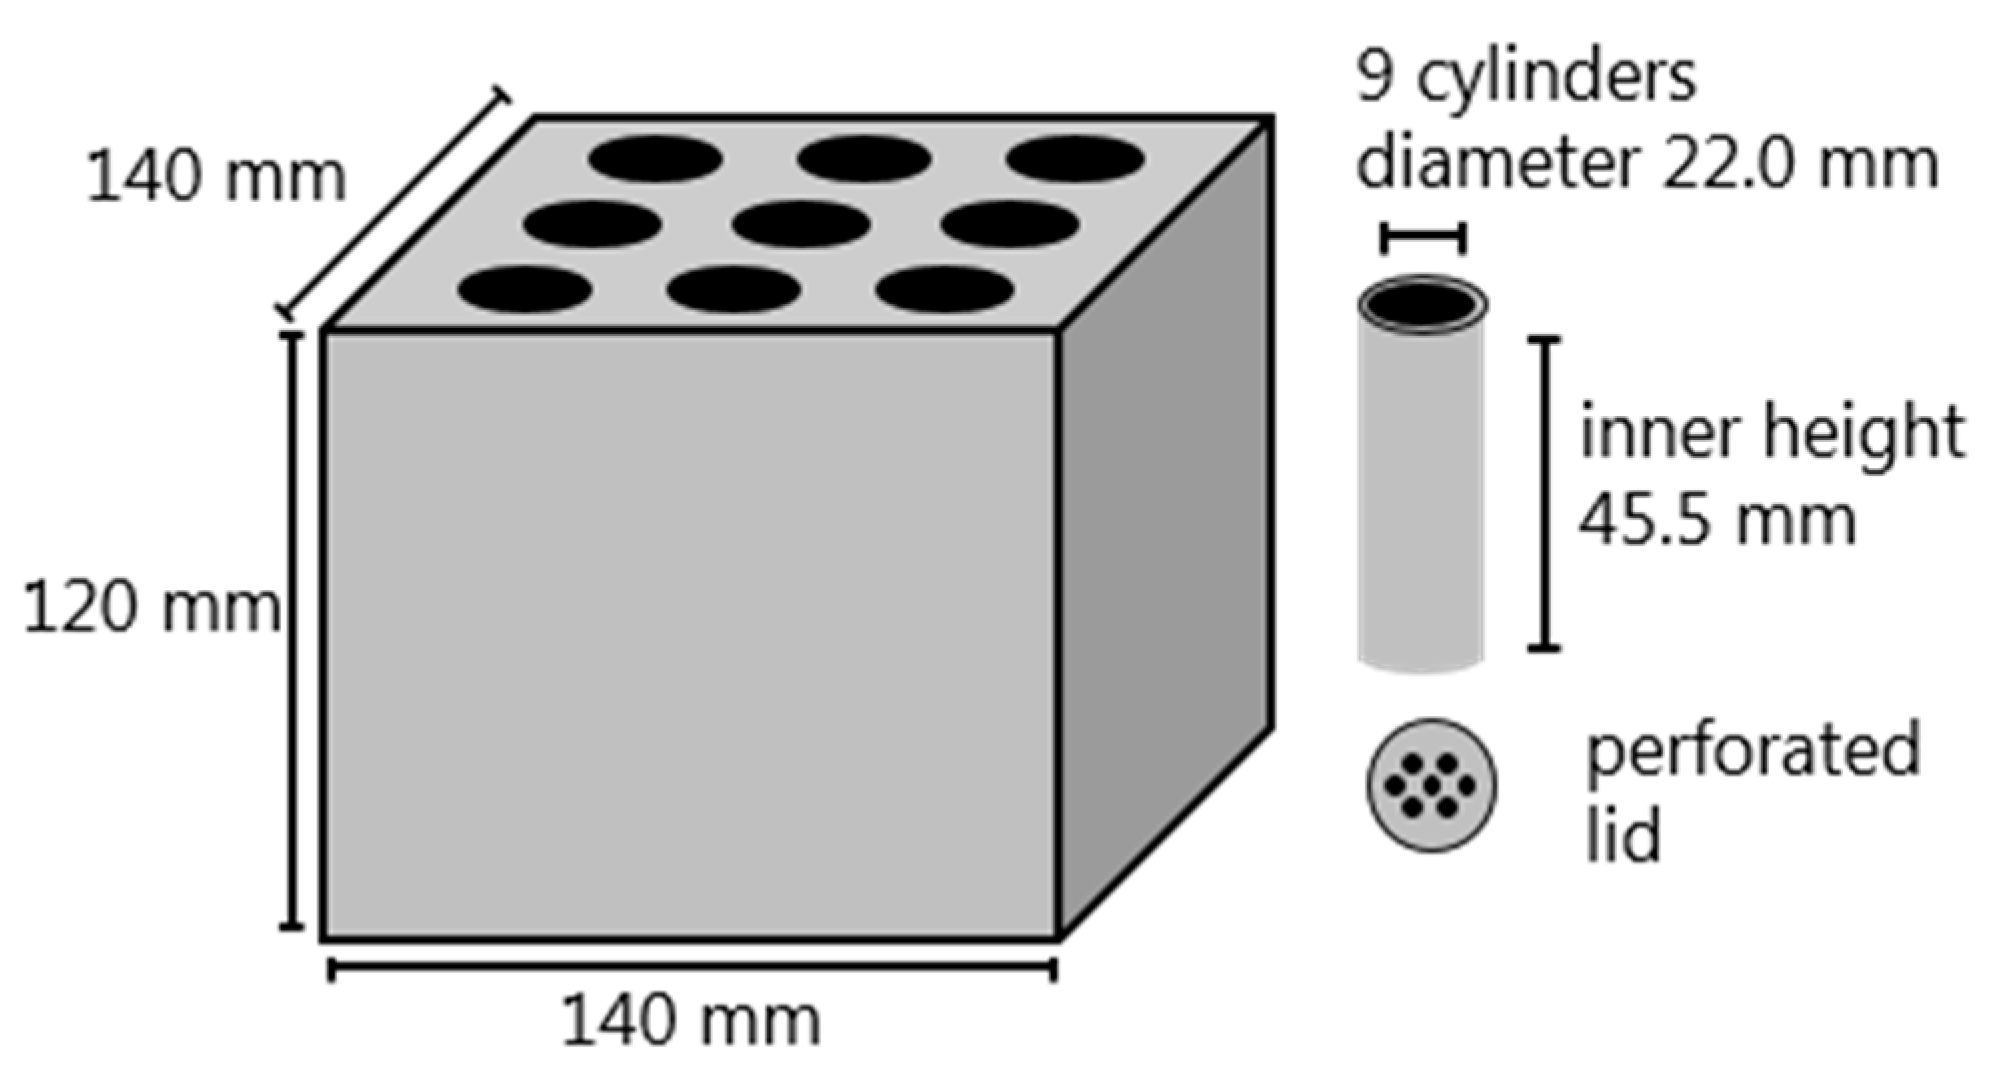
2.3. Coking Experiments

Coking experiments were conducted in a laboratory-scale coking battery (Figure 1). The coking battery is made of a cubical graphite frame and nine coking cylinders made from graphite. The coking cylinders with inner diameters of 22 mm, inner heights of 45.5 mm, and volumes of 17.3 mL were filled with coking coal and biomass. Perforated lids were placed upon the coal charge to avoid excessive coal swelling and to release the gases generated during the coking. Graphite gravel and a lid made from graphite were placed on top of the graphite frame to avoid coke gasification during the coking experiment. The coking battery was placed inside a chamber furnace (Nabertherm HT08/18, Nabertherm GmbH, Lilienthal, Germany). The heating rate of the furnace was 3.5 °C/min and the final temperature 1200 °C after which the quenching of the sample started. Sample heating and cooling were done in inert atmosphere (N2, 2 L/min). The coking battery has been previously used to study the effect of plastic addition to coking coal blends [19] and it has been shown to produce good quality lab-scale coke for analysis.
Composition of the coal and biomass blends in coking experiments are presented in Table 1. Two reference cokes were produced with different masses added to the coking cylinder (reference 1 with 11 g and reference 2 with 13 g). In the case of reference coke 1, the bulk density was 634 kg/m3. In industrial coke production, the bulk density is usually from 650 to 800 kg/m3 [20] or higher, depending on the location in the coking battery. The bulk density in reference coke 2 was 750 kg/m3. The impact of bulk density on the properties of the produced bio-cokes was evaluated with this procedure. The first objective was to evaluate the impact of charcoal particle size on the properties of the bio-cokes (BC). In these coking experiments, 5 wt % of charcoal with different particle sizes was added to the coal blend. The smallest particle size was 45–90 μm and the largest 1.0–2.0 mm. The second objective was to evaluate the effect of charcoal and Kraft-lignin addition rate on bio-coke properties. The selected particle size fraction was 125–250 μm and the addition rate of charcoal and Kraft-lignin was 2.5, 5.0, 7.5, and 10 wt %. The mass of the sample in these coking experiments was 13 g.

2.4. Cold Strength Measurements

Typically, the mechanical strength tests that measure the resistance to size reduction are based on shatter tests, where breakage occurs by impact (ASTM D3038) or revolving drum tests, where breakage and abrasion are covered (MICUM, IRSID, JIS) (ISO 556, ISO 1881, JIS K2151) [21]. Additionally, compression tests have been used to measure coke strength [22,23,24,25]. In this work, a compression test was used to evaluate the cold strength of the bio-cokes. Cold strength tests were done with a Gleeble 3800 thermomechanical simulator (Dynamic Systems Inc., New York, NY, USA). The device has been previously used in coke hot strength measurements [24,25]. The coke cylinders obtained from laboratory coking experiments were cut into three samples. Each formed coke sample had the height of 11 and diameter of 17.3 mm on average. A total of 20 compression strength measurements were done for each coke sample.

2.5. Reactivity Measurements

The reactivity tests were performed in simulated blast furnace shaft conditions including all the relevant gases (CO, CO2, H2, H2O, N2) in realistic ratios. The gas composition, presented in Table 2, was thermodynamically balanced at 1100 °C using thermochemical calculation software, HSC Chemistry 7.0 (Outotec, Pori, Finland) [26]. Coke reactivity was measured using a custom-built thermogravimetric analysis (TGA) furnace, which has been described in more detail in a previous study [27] (Figure 2). Chemical reactivity of the coke grades was measured under both isothermal and non-isothermal conditions. The isothermal reactivity tests were performed at 1100 °C and the duration of the isothermal test was 60 min. The purpose of the isothermal tests was to measure and compare the reactivity of the reference coke and bio-cokes. In the non-isothermal test, the temperature was raised from 800 °C to 1100 °C, at a heating rate of 2 °C/min, so the experiment lasted 2.5 h. The non-isothermal reactivity tests were performed to clarify the differences in the threshold temperature of reference coke and bio-coke gasification. In both reactivity tests, samples were placed into hot furnace and they were pre-heated in N2 gas for 10 min at 800 °C in non-isothermal test and at 1100 °C in isothermal test before the reactivity test started. The coke samples used in reactivity tests were taken from the crushed coke samples from compression strength test. The mass of the coke samples was 1 g and the sample was sieved to a particle size 2–4 mm. Changes in the coke structure due to the stress experienced in the compression tests may affect the reactivity of the coke samples to some extent. However, it is anticipated that these effects are of minor significance and do not compromise the trends of the compression strength measurement results.

2.6. Optical Microscopy

An Olympus BX51 (Olympus, Tokyo, Japan) optical microscope equipped with a digital camera was used to evaluate the interaction of coal, charcoal, and Kraft-lignin in coking process. The polished sections were examined under 10×, 20×, and 50× objective lenses, but the images were taken under 20× lenses.

3. Results and Discussion

3.1. Main Characteristics of the Raw Materials

The characteristics of the coking coal, charcoal, and Kraft-lignin are shown in Table 3. Charcoal has high carbon and low oxygen content compared to virgin wood. The carbon content of the charcoal is markedly higher compared to coking coal. Ash content in charcoal and Kraft-lignin is low compared to coking coal. The ash chemistry of the coal and charcoal differs significantly. Coal ash has a high share of acid components SiO2 and Al2O3, whereas the charcoal ash has a high share of basic components CaO and MgO. The ash chemistry of the biomass depends greatly on the type of the biomass, its origin, and contaminants from handling. The share of alkalis (Na2O, K2O) is higher in charcoal ash. The carbon content of the Kraft-lignin is high compared to raw biomass, but low compared to coal and charcoal. The share of volatiles in Kraft-lignin is high. Sulfur and sodium content are high, because of the chemicals used in the Kraft pulping process. Basicity of the charcoal is around 10 and basicity of the Kraft-lignin three times higher compared to coal.

3.2. Devolatilization Behavior of the Raw Materials

Figure 3 shows the devolatilization behavior of coal, charcoal, and Kraft-lignin. The yields were 77.53%, 87.53%, and 43.16% for coal, charcoal, and Kraft-lignin at 1200 °C, respectively. Medium volatile coal shows a typical devolatilization curve, where the majority of the mass loss occurs in a single step-process in a defined temperature region (from 400 °C to 500 °C). The temperature of the maximum volatile matter loss is 475 °C. Charcoal used in this study was pyrolyzed at high temperature (600 °C) and the majority of the mass loss occurred in pyrolysis. Hemicellulose and cellulose have already been decomposed at temperatures of 200–300 °C and 275–350 °C, respectively [4]. Therefore, the mass loss of the charcoal is low; only 12.47% of the charcoal mass is devolatilized in thermogravimetric experiment. There is a low peak in DTG for charcoal, with a maximum volatile matter loss occurring at 730 °C. According to the literature, this peak could be related to the formation of amorphous carbon and the concentration of aromatic rings [28]. The major fraction of mass loss of Kraft-lignin occurs between 200 °C and 500 °C, the temperature of the maximum volatile matter loss being 372 °C. The rate of the mass loss is considerably higher compared to coal and charcoal.
Volatile matter release at specific temperatures, normalized to 100%, is shown in Figure 4. This graph is feasible when examining the rate of devolatilization of the added biomass fraction in the blend during the plastic deformation stage of the coal. The softening temperature of the sample coal is 423 °C and the resolidification temperature is 492 °C. From Figure 4 it can be seen that around 16% and 70% of the total mass loss of charcoal and Kraft-lignin has occurred before the plastic stage of coal starts, respectively. Even though the majority of the devolatilization of the Kraft-lignin occurs before the plastic stage of coal, around 13% of the Kraft-lignin devolatilizes during the plastic stage of the coal, which means that there is a considerable amount of gaseous compounds affecting the fluidity development. Devolatilization of charcoal during the coal plastic stage is low, only around 2% of the total mass loss. This means that charcoal produced at high temperature affects the coal fluidity mainly through physical interaction. Diez et al. [5] and Montiano et al. [4] have pointed out that high porosity chars are able to adsorb the primary decomposition products, thus reducing the fluidity of the coal.

3.3. Effect of Charcoal and Kraft-Lignin Addition on Coke Cold Compression Strength

The maximum strength of reference coke 1 and bio-cokes with 5% charcoal addition and different particle sizes are presented in Figure 5a. The particle size of the charcoal seems to have some effect on the cold strength of the bio-cokes. Bio-cokes produced in this study have comparable, or higher, cold strength compared to reference coke 1. Qin et al. [29] have reported similar findings with small addition rates, of 3–5%, in which the cold strength can be maintained or improved. Bio-cokes with 125–250 μm charcoal particles showed the highest cold-strength. Ng et al. [30] have also found a similar effect of adding charcoal to coal blends. The cold strength of bio-cokes measured with ASTM and Irsid tumbler tests remained at high levels when the charcoal particle size was considerably smaller than the coking coal particle size. When charcoal having a coarser particle size (particle size similar or larger compared to coking coal particle size) was added to the coal blend, the cold strength of bio-cokes decreased significantly. When using the fine charcoal in the coal blend, charcoal was embedded within the coke structure, thus resulting in a strong matrix [30].
The bulk density of the charge has a substantial impact on the cold compression strength of the coke. This can be seen in Figure 5b. An increase in the bulk density from 634 to 750 kg/m3 resulted in almost 82% cold strength improvement between reference cokes 1 and 2 (from 9.39 to 17.08 MPa). Closer compaction of the coal particles due to the higher bulk density along with the coal expansion properties are significant factors attributing to the strength of the coke [31].
The same trend is seen when charcoal is added to the 13 g coal blend (Figure 5b). The cold compression strength of bio-cokes remains at a high level even when the proportion of charcoal in the blend is 7.5% or 10.0%. The main reason for high cold compression strength of bio-cokes compared to reference coke 1 and 2 is probably the compaction of the coal charge. The bulk density of charcoal is around 250–400 kg/m3. This means that, in the case of 10.0% charcoal addition, more force had to be used to compact the charge into a laboratory-scale coking cylinder. The applied force was not measured in this research and it should be one of the research areas in the future. In the case of Kraft-lignin addition, compacting of the charge could not compensate for the deteriorating effect. The bulk density of dry lignin is around 650–750 kg/m3, which means that when the charge was prepared, the force used in the compacting was not as high as in the case of charcoal addition. Another factor that is different between charcoal and Kraft-lignin is their thermal behavior during the coking process. Charcoal was produced at high temperature, so it does not carbonize further and lose its remaining volatiles until 600 °C, onwards. At this temperature, the coal has already softened and resolidified. Kraft-lignin has high volatile matter content (66.4 wt %), which means that mass loss during the coking process is high. According to TG-analysis, the mass loss is 41.5% when the temperature has reached the softening temperature of the coal, 423 °C, and 47.5% when the temperature has reached the resolidification temperature, 492 °C. This means that empty space has been created before the plastic stage of the coal starts to evolve. Empty space, together with the fact that biomass acts as an inert material in the development of plasticity, results in a weaker coke structure in the case of bio-coke with Kraft-lignin. It has also been stated that lignin undergoes several dilation and shrinking stages at a temperature range from 140 to 600 °C [32], which might also contribute to the formation of a weak matrix.

3.4. Bio-Coke Reactivity in Simulated BF Shaft Conditions

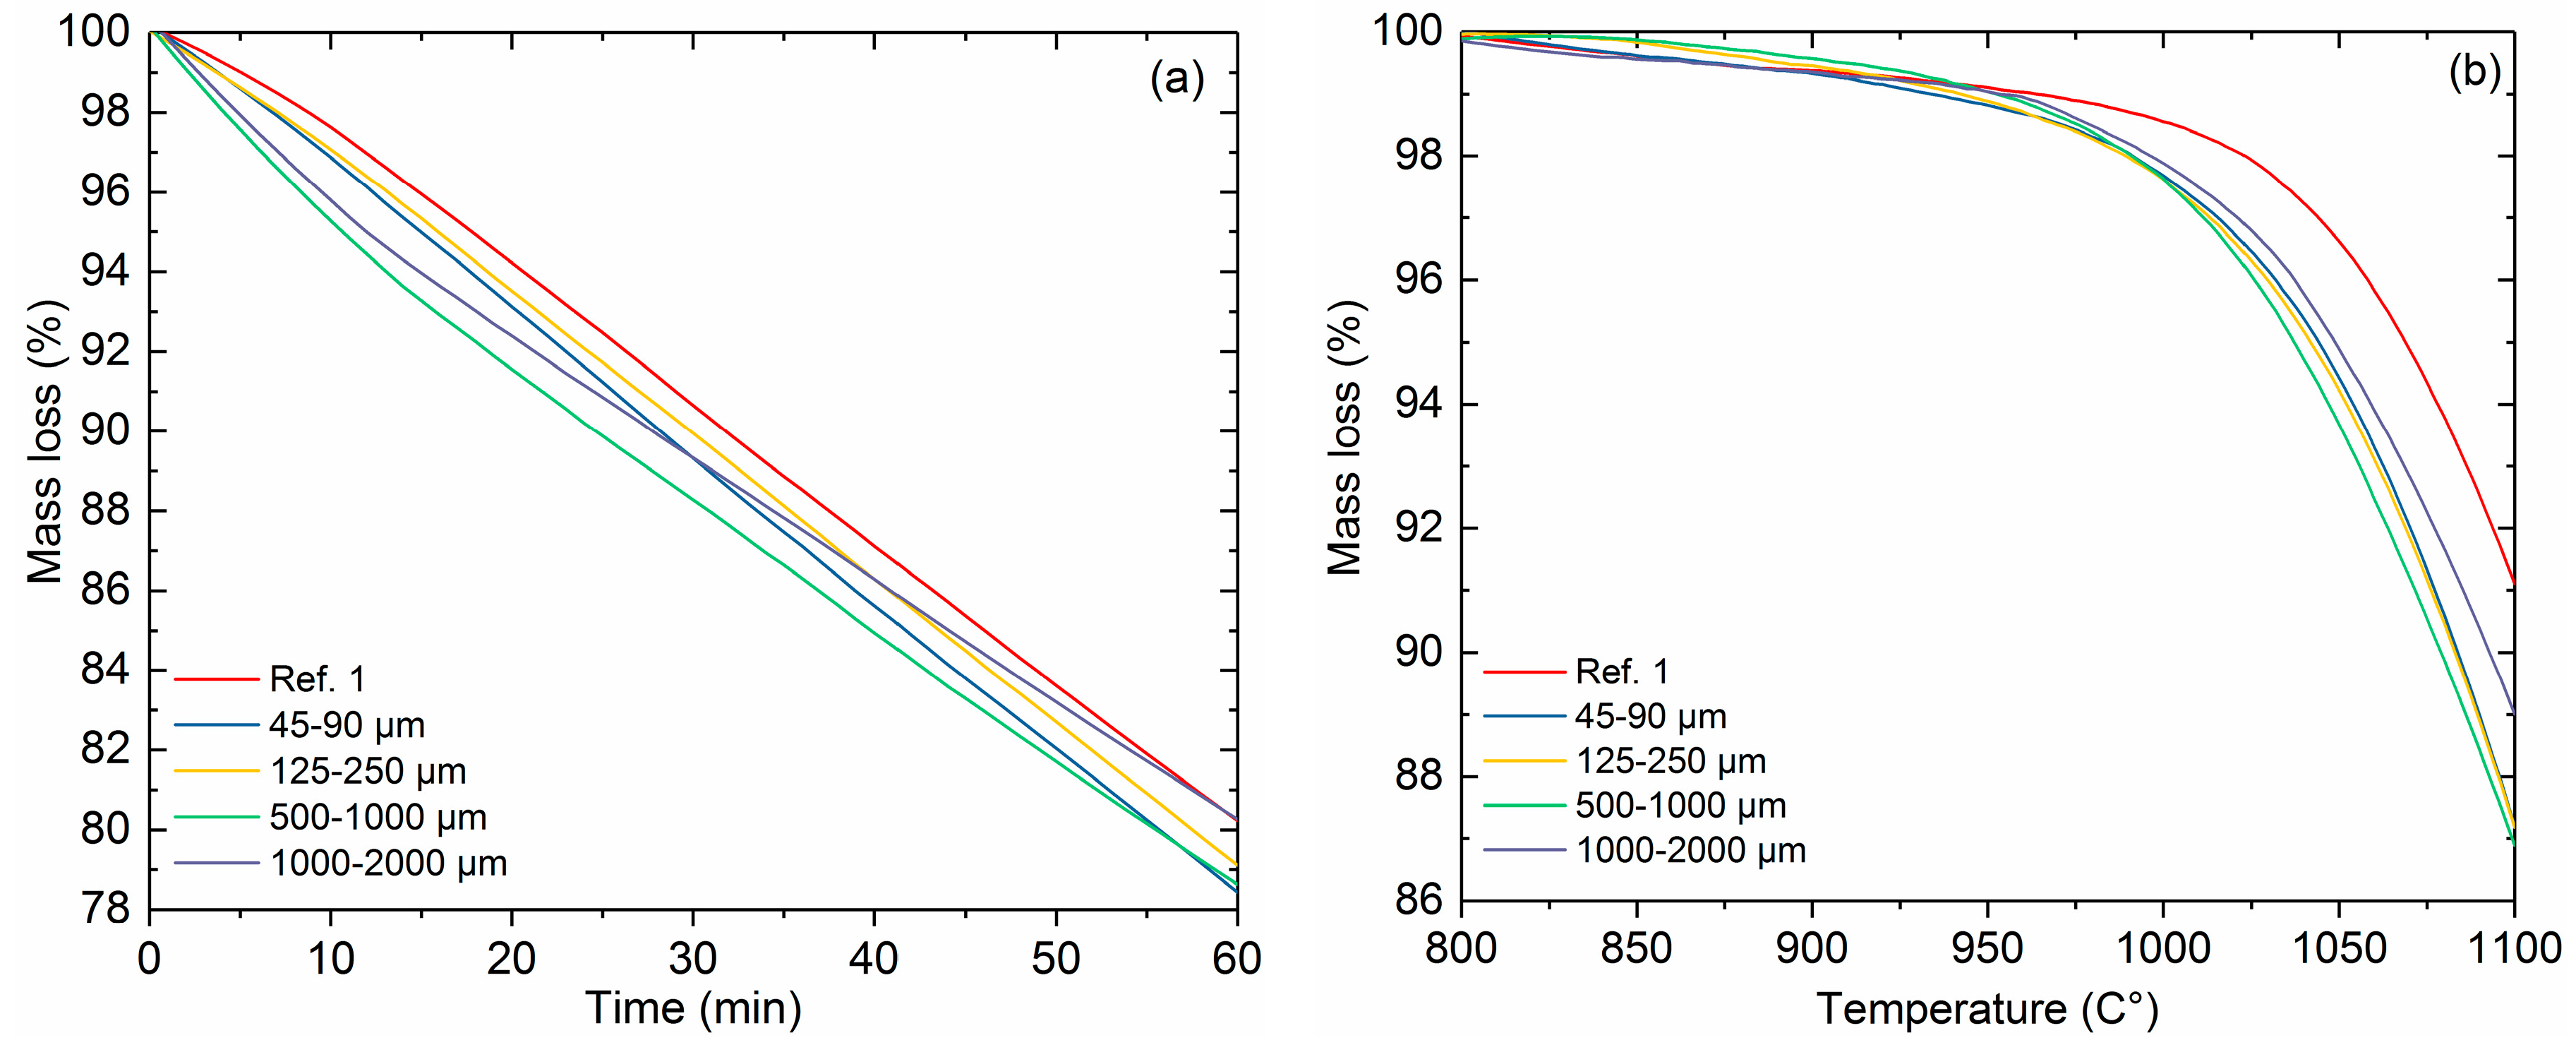
3.4.1. Impact of Charcoal Particle Size on the Reactivity

Isothermal reactivity of reference coke 1 and bio-cokes with 5% charcoal addition and with different charcoal particle sizes is presented in Figure 6a. There is no clear pattern in bio-coke reactivity in relation to charcoal particle size. Reference coke 1 has the lowest reactivity throughout the test. In the beginning it seems that bio-cokes with larger charcoal particle sizes are more reactive. However, at the end of the test, the bio-coke with the smallest charcoal particles (45–90 μm) has the highest mass loss (Figure 6a). In previous literature, it has been presented that a finer particle size of the charcoal in coal blend results in more reactive bio-coke, compared to bio-coke with a coarser particle size [7,30]. These investigations have used the CRI test in which CO2 is used as the gasifying component.
The threshold temperature shows the temperature at which the notable mass loss of the coke begins in the presence of gasifying gas components. The importance of the threshold temperature of coke gasification to the blast furnace process has been thoroughly discussed in [27]. Together with the reduction properties of the iron burden, the threshold temperature of coke gasification determines the temperature of the thermal reserve zone, which has an impact on the energy efficiency of the blast furnace. The common practice to evaluate coke reactivity is to use the CRI test, in which pure CO2 is used as the gasifying gas and the duration of the test is two hours. Previous research by the authors [27] found that it is important to include all of the main gas components present in the blast furnace shaft. In this research with the BF shaft gas composition, the threshold temperature of coke gasification was the highest for reference coke 1, as expected. Figure 6b shows that bio-cokes start to gasify at around 970–990 °C, whereas the gasification starting temperature of reference coke 1 is around 1020 °C. There is no large difference between the bio-cokes, however, it seems that bio-cokes with the smallest charcoal particles (45–90 μm and 125–250 μm) are the most reactive.

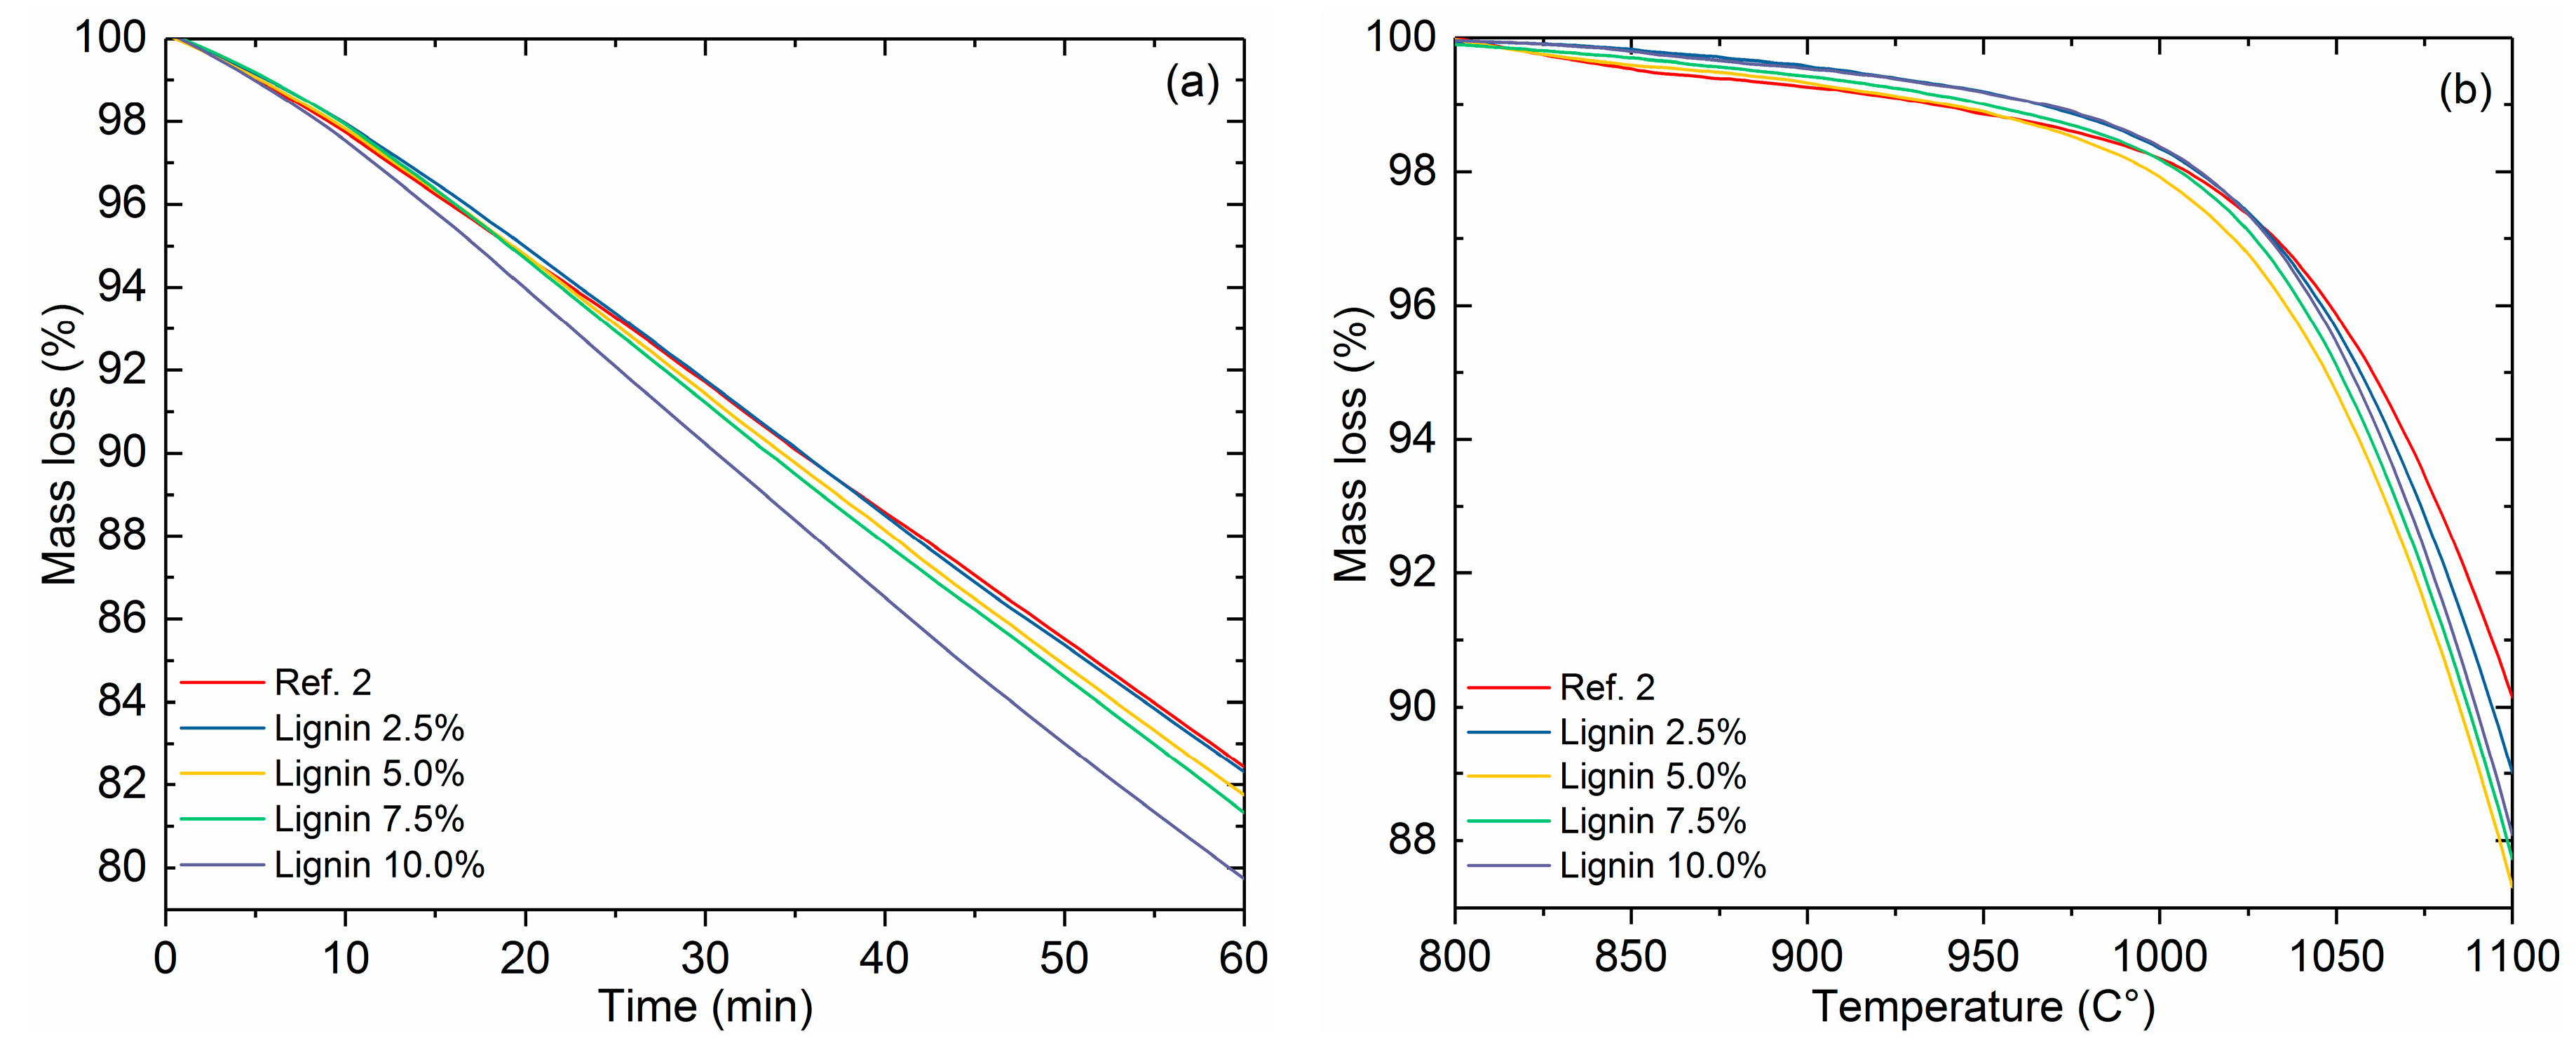
3.4.2. Impact of Charcoal and Kraft-Lignin Addition Rate on the Reactivity

Figure 7a shows the reactivity of reference coke 2 and bio-cokes with charcoal addition (0–10.0%, 125–250 μm particle size) in isothermal conditions. The difference in reactivity between reference coke 2 and bio-cokes is clear. The mass loss in isothermal conditions for reference coke 2 is 17.6% and for bio-coke with 10% charcoal addition (BC 8) is around 23.4% (Figure 7a). The reactivity of the bio-cokes increases when the proportion of charcoal increases. This is in line with the previous research [33,34,35]. The higher reactivity of the bio-cokes is attributed to the ash composition of the raw materials, oxygen content, the inhibition of fluidity development in the carbonized blend, the presence of porous isotropic particles from the biomass, functionality of the biomass material, and the microporosity of the cokes [36]. In this study, the basicity of the bio-coke increases from 0.67 to 0.74 when 10% of coal is replaced by charcoal. This might have an influence on the higher reactivity as indicated by Ng et al. [33]. Bio-cokes have higher surface area compared to coke without biomass addition, which further promotes the gasification [34]. The threshold gasification temperature of bio-cokes is considerably lower compared to reference coke 2 (Figure 7b). The threshold temperature of reference coke 2 gasification is around 1030 °C, whereas for bio-coke with 10% charcoal addition it is around 990 °C. The final mass loss in non-isothermal conditions at 1100 °C is 9.9% for reference coke 2% and 16.7% for bio-coke with 10% charcoal addition (BC 8). This difference can be considered as substantial and will have an effect on blast furnace behavior.
Figure 8a shows the reactivity of reference coke 2 and bio-cokes with Kraft-lignin addition (0–10.0% addition, 125–250 μm particle size) in isothermal conditions. The differences in reactivities between reference coke 2 and bio-cokes with lignin addition are not as notable as in the case of charcoal addition. The final mass loss with reference coke 2 is 17.5% and 20.4% with the most reactive bio-coke, with 10.0% lignin addition. The differences with other bio-cokes is surprisingly small. The smaller difference could be explained by the fact that Kraft-lignin has quite a small yield in bio-coke. This means that there is a smaller amount of lignin-based char left in the bio-coke compared to bio-cokes made from charcoal. The BI (%) of the bio-coke decreases with the increasing share of Kraft-lignin in the coal blend. With 10% Kraft-lignin addition, the BI (%) is 0.64, which is slightly lower than the reference coke at 0.67. This might also have the effect of lowering the reactivity of the bio-coke. In the threshold temperature of coke gasification (Figure 8b), the difference between the threshold temperatures is around 10 °C at maximum. Reactivity results show that bio-cokes, especially bio-cokes with charcoal addition, gasify more rigorously than reference cokes. This implies that the post-reaction strength of bio-cokes would be lower than reference cokes.

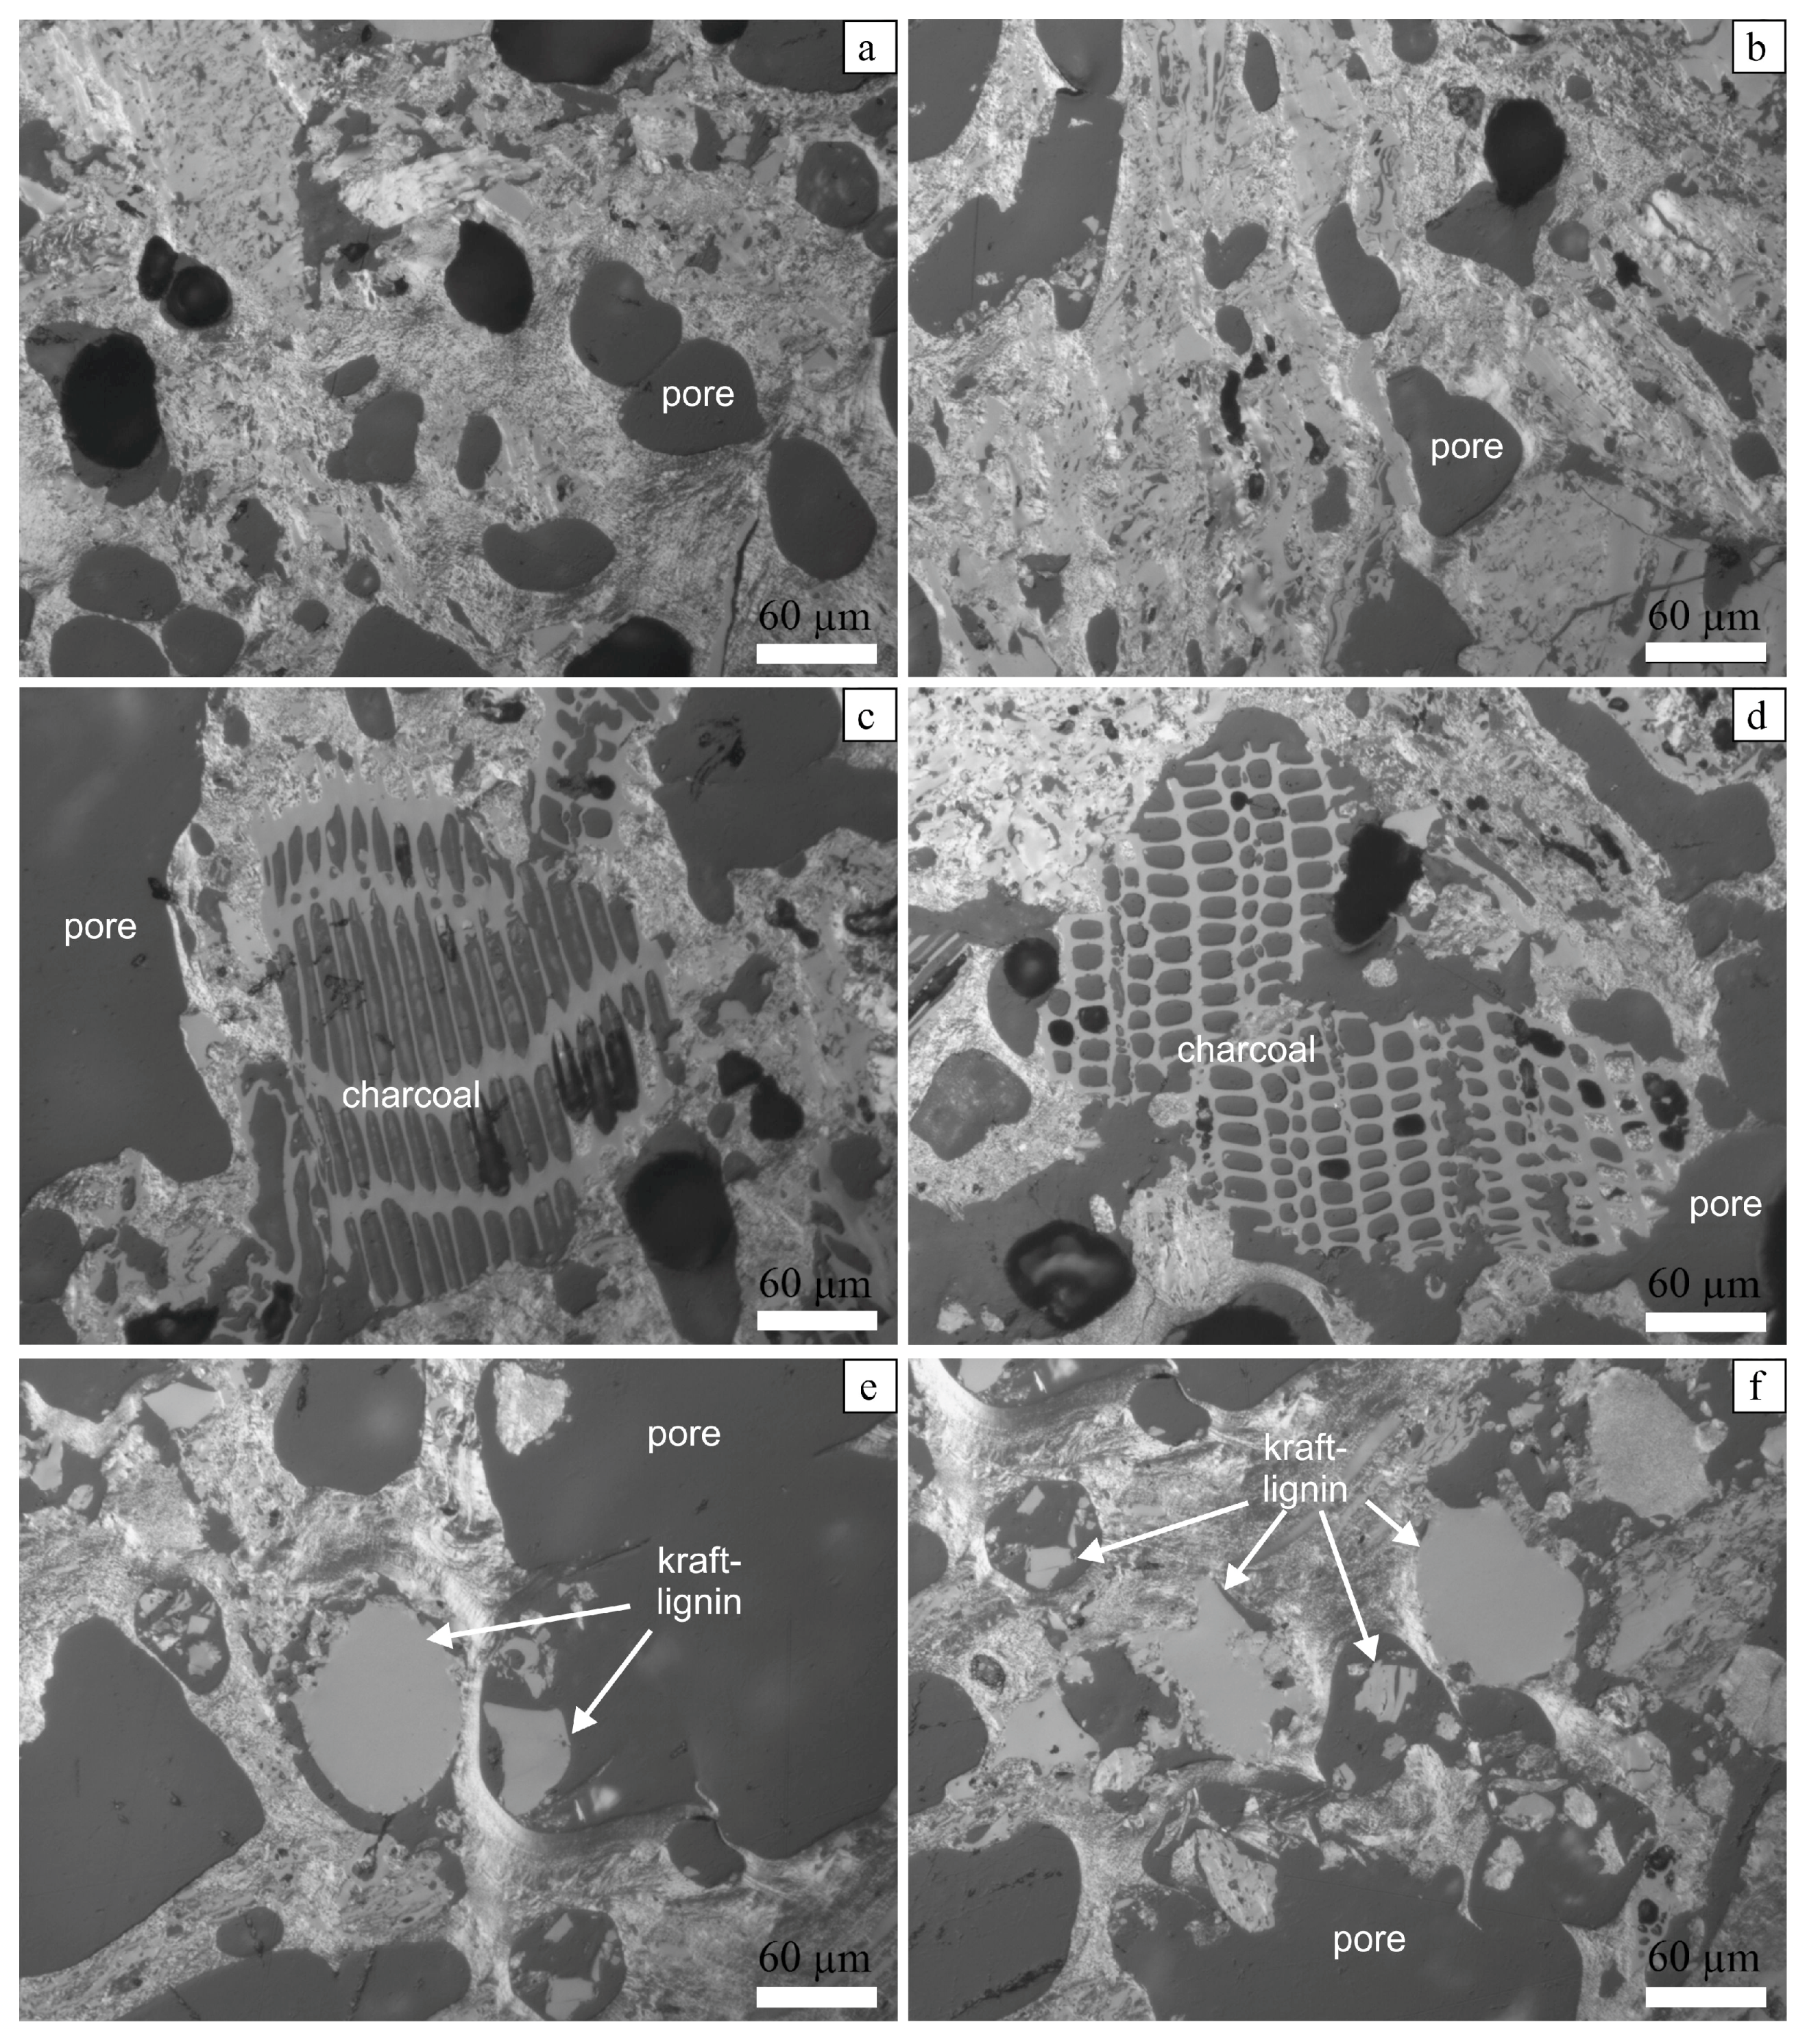
3.5. Texture of the Produced Cokes

Investigations of polished sections under optical microscopy revealed substantial differences in the textures of samples of the reference coke (Figure 9a,b) and the samples prepared with the addition of charcoal (Figure 9c,d) and Kraft-lignin (Figure 9e,f). The texture of reference coke looks quite similar to that of typical industrial coke, and the pore size in this experimental coke varies between 10 and 100 μm, being, on average, about 50–70 μm. The appearance of additive-bearing samples indicates the presence of particles of additives that were not fully destroyed (homogenized) during the coking process. Figure 9c shows relatively large particle of charcoal, which were incorporated in the solid state into the soft coal-related matrix. The soft material has penetrated between the sharp outlines of the charcoal particle (as can be seen on the top of the particle). The particle was fixed in the matrix during the solidification stage of the coke. Figure 9d shows two closely-located elliptically-shaped charcoal pieces, which are enclosed into the matrix and form relatively large (200–350 μm) pore-like spaces around them. These two particles are attached to the matrix only partly and there are empty spaces between them and the matrix. Similar observations were also noticed in samples of coke prepared with Kraft-lignin. The particles of this additive retain their primary outlines and they form pore-like space around them, having partial contact with the surrounding matrix. However, the size of such space is smaller than in the case of charcoal, and it also entirely depends on the size of the particles of the additive.
The interaction of coal and the additives can be described as a physical mixing with penetration of the soft mass into the particles with subsequent solidification (corresponds to coke solidification stage) and fixation of the particles in the matrix. The appearance of irregular, large, pore-like spaces with weak fixation of particles inside them can probably cause anisotropy of properties and, because of this, additive-bearing coke may have lower compression strength, as is generally indicated on Figure 5.

3.6. Implications on the Blast Furnace Process and Further Development Needs

Despite the general standard of using low reactivity coke in blast furnaces, in recent years a significant research interest has been shown towards the utilization of highly-reactive coke [36,37,38,39,40]. The interest for using high reactivity coke arises from theoretical considerations, which show that a decrease in the equilibrium temperature between reducing gas and wüstite (Fe1−xO) in the BF shaft can increase the gas utilization rate (CO2/CO-ratio), resulting in lower fuel consumption [38], which would bring significant economic savings. Utilization of high reactivity coke is one possibility to achieve this. In a Japanese Muroran BF, the use of high-reactivity coke decreased the fuel rate by 10 kg/thm (roughly 2%) [37]. High reactivity coke could also improve the softening and melting properties of iron ore [40].
Bio-cokes produced and evaluated in this research showed higher reactivity compared to reference cokes, thus providing alternative options for high-reactive coke use in the blast furnace. The reactivity of the bio-cokes increases substantially even with small addition rates of biomass-based raw materials, especially with charcoal addition. This finding implies that, from the blast furnace efficiency point of view, a reduction in the thermal reserve zone temperature may be realized with bio-cokes containing a small share of the biomass component. The fossil-based CO2 emissions would be decreased not only by using biomass-based raw materials, but also due to lower reducing agent consumption in the blast furnace.
The main concern related to bio-cokes is their inferior cold strength and strength after reaction compared to metallurgical cokes. Low cold strength contributes to difficulties during the handling and charging of the bio-cokes and excessive dust formation in the upper part of the blast furnace. Low strength after reaction with CO2 and H2O results in reduced furnace permeability and the loss of increased pressure. In this research it was shown that by increasing the bulk density of the coal charge, the cold compression strength of the bio-cokes with charcoal addition can be maintained at a feasible level. Principles of stamp coke production could be applied to bio-coke production to increase the cold and hot strength even further [41]. It has been stated that the strength after reaction decreases with the smaller charcoal particle size [30]. In this research, the strength after reaction was not evaluated but, from the reactivity tests, it can be concluded that with smaller particle sizes the reactivity increases more than with larger particles, thus indicating a lower CSR.
In this research, Kraft-lignin was added to the coal blend after drying and sieving. Carbonization of the Kraft-lignin before adding to the coke blend and compaction of the blend could be viable measures to increase the density of the charge thus providing better circumstances for coke property development. Kraft-lignin addition increased the reactivity of the bio-coke only moderately compared to reference coke, which indicates that its strength after reaction could be maintained at a reasonable level. The share of unwanted elements (e.g., S, Na, K) in the Kraft-lignin is high compared to coking coal. However, with addition rates up to 10%, their total input increases only moderately (S, Na), or even decreases (K) due to the low ash amount. Furthermore, organically-associated sulfur in Kraft-lignin can be partially released in the carbonization stage [42], enhancing its metallurgical properties. In future studies, attention should be placed to the hot strength of the bio-cokes, as done in [24,25] for different coke grades.

4. Conclusions

In this study, the impact of charcoal and Kraft-lignin addition on the cold strength and reactivity of the produced bio-cokes was investigated. The following conclusions can be drawn from the results of the research work:
  • Thermal degradation of the coal, charcoal, and Kraft-lignin differ considerably from each other. Kraft-lignin loses a major share of its mass before the coal starts to soften, thus creating empty spaces that coal has to fill. Together with the fact that oxygen-containing gases are released during the plastic stage of the coal, Kraft-lignin in coal blends has an active role in the final coke formation. Charcoal has lost the majority of its volatiles already in the pyrolysis stage and acts mainly as an inert material in the coal blend.
  • Charcoal addition does not reduce the bio-coke strength compared to reference cokes when the charcoal addition rate was 5% and the particle size of the added charcoal was altered. The highest cold compression strength was obtained with bio-cokes having particle sizes of 125–250 μm. Optical microscope images showed that soft coking mass has, in some cases, penetrated into the charcoal cells and solidified there, thus contributing to cold strength development.
  • Bulk density of the coal blend showed a strong effect on the cold compression strength of the cokes. The cold strength of the reference coke was increased by 83% when the bulk density was increased from 634 to 750 kg/m3. The cold strength of the bio-coke with charcoal addition remained at an acceptable level compared to reference coke 2. Charcoal addition up to 10% (particle sizes of 125–250 μm) maintains the cold strength of the bio-cokes. Bio-cokes with Kraft-lignin addition could not maintain the cold strength. The addition of 2.5 wt % Kraft-lignin to coal blend lowered the cold strength by 26.3%.
  • Bio-cokes with charcoal addition showed higher reactivity compared to reference cokes. The smaller particle size of the charcoal results in higher reactivity bio-coke. The increase in charcoal content in the coal blend increased the reactivity of the coke in isothermal reactivity tests. Non-isothermal reactivity tests revealed that the gasification threshold temperature of bio-cokes with charcoal addition is considerably lower compared to the reference coke. Reactivity of the bio-cokes with Kraft-lignin addition was lower compared to bio-cokes with charcoal addition, but still higher compared to the reference coke. This implies that post-reaction strength of the bio-cokes with Kraft-lignin addition might be maintained better compared to bio-cokes with charcoal addition.

Acknowledgments

This research is a part of the RENEPRO project (project number 20200224) funded by Interreg Nord. Tommi Kokkonen and Riku Mattila with the University of Oulu are acknowledged for their technical support. Juho Haapakangas is acknowledged for his valuable comments to the work.

Author Contributions

Hannu Suopajärvi and Essi Dahl designed the experiments; Essi Dahl performed the sample preparation, and the gasification and cold strength measurements; Stanislav Gornostayev performed the optical microscopy studies; and Hannu Suopajärvi performed the thermogravimetric experiments. All the authors contributed to the data analysis, discussed the results, and contributed to the writing.

Conflicts of Interest

Authors declare no conflict of interest.

References

  1. Suopajärvi, H.; Pongrácz, E.; Fabritius, T. The potential of using biomass-based reducing agents in the blast furnace: A review of thermochemical conversion technologies and assessments related to sustainability. Renew. Sustain. Energy Rev. 2013, 25, 511–528. [Google Scholar] [CrossRef]
  2. Suopajärvi, H.; Kemppainen, A.; Haapakangas, J.; Fabritius, T. Extensive review of the opportunities to use biomass-based fuels in iron and steelmaking processes. J. Clean. Prod. 2017, 148, 709–734. [Google Scholar] [CrossRef]
  3. Castro-Díaz, M.; Zhao, H.; Kokonya, S.; Dufour, A.; Snape, C.E. The effect of biomass on fluidity development in coking blends using high-temperature SAOS rheometry. Energy Fuels 2012, 26, 1767–1775. [Google Scholar]
  4. Montiano, M.G.; Barriocanal, C.; Alvarez, R. Effect of the addition of waste sawdust on thermoplastic properties of a coal. Fuel 2013, 106, 537–543. [Google Scholar] [CrossRef]
  5. Diez, M.A.; Alvarez, R.; Fernández, M. Biomass derived products as modifiers of the rheological properties of coking coals. Fuel 2012, 96, 306–313. [Google Scholar] [CrossRef]
  6. Kokonya, S.; Castro-Díaz, M.; Barriocanal, C.; Snape, C.E. An investigation into the effect of fast heating on fluidity development and coke quality for blends of coal and biomass. Biomass Bioenergy 2013, 56, 295–306. [Google Scholar] [CrossRef]
  7. MacPhee, J.A.; Gransden, J.F.; Giroux, L.; Price, J.T. Possible CO2 mitigation via addition of charcoal to coking coal blends. Fuel Proc. Technol. 2009, 90, 16–20. [Google Scholar] [CrossRef]
  8. Lumadue, M.R.; Cannon, F.S.; Brown, N.R. Lignin as both fuel and fusing binder in briquetted anthracite fines for foundry coke substitute. Fuel 2012, 97, 869–875. [Google Scholar] [CrossRef]
  9. Castro-Díaz, M.; Vega, M.F.; Barriocanal, C.; Snape, C.E. Utilization of Carbonaceous Materials to Restore the Coking Properties of Weathered Coals. Energy Fuels 2015, 29, 5744–5749. [Google Scholar] [CrossRef]
  10. Castro-Díaz, M.; Uguna, C.N.; Florentino, L.; Díaz-Faes, E.; Stevens, L.A. Evaluation of hydrochars from lignin hydrous pyrolysis to produce biocokes after carbonization. J. Anal. Appl. Pyrolysis 2017, 124, 742–751. [Google Scholar] [CrossRef]
  11. Ueki, Y.; Nunome, T.; Yoshiie, R.; Naruse, I.; Nishibata, Y.; Aizawa, S. Effect of woody biomass addition on coke properties. ISIJ Int. 2014, 54, 2454–2460. [Google Scholar] [CrossRef]
  12. Schwarz, M.; Babich, A.; Senk, D.; Sadiku, V.; Gbadebo, P. Usage of biomass in Cokemaking. In Proceedings of the 5th International Conference on Process Development in Iron and Steelmaking (SCANMET V), Luleå, Sweden, 12–15 June 2016. [Google Scholar]
  13. Xing, X.; Rogers, H.; Zhang, G.; Hockings, K.; Zulli, P.; Deev, A.; Mathieson, J.; Ostrovski, O. Effect of charcoal addition on the properties of a coke subjected to simulated blast furnace conditions. Fuel Proc. Technol. 2017, 157, 42–51. [Google Scholar] [CrossRef]
  14. Guerrero, A.; Diez, M.A.; Borrego, A.G. Influence of charcoal fines on the thermoplastic properties of coking coals and the optical properties of the semicoke. Int. J. Coal Geol. 2015, 147–148, 105–114. [Google Scholar] [CrossRef]
  15. Matsumura, T.; Ichida, M.; Nagasaka, T.; Kato, K. Carbonization behaviour of woody biomass and resulting metallurgical coke properties. ISIJ Int. 2008, 48, 572–577. [Google Scholar] [CrossRef]
  16. Slade, R.; Bauen, A.; Gross, R. Global bioenergy resources. Nat. Clim. Chang. 2014, 4, 99–105. [Google Scholar] [CrossRef]
  17. Cannatelli, M.D.; Ragauskas, A.J. Conversion of lignin into value-added materials and chemicals via laccase-assisted copolymerization. Appl. Microbiol. Biotechnol. 2016, 100, 8685–8691. [Google Scholar] [CrossRef] [PubMed]
  18. Barriocanal, C.; Díez, M.A.; Alvarez, R.; Casal, M.D.; Canga, C.S. On the relationship between coal plasticity and thermogravimetric analysis. J. Anal. Appl. Pyrolysis 2003, 67, 23–40. [Google Scholar] [CrossRef]
  19. Gornostayev, S.S.; Heino, J.J.; Kokkonen, T.M.T.; Makkonen, H.T.; Huttunen, S.M.M.; Fabritius, T.M.J. Textural changes in metallurgical coke prepared with polyethylene. Int. J. Miner. Metall. Mater. 2014, 21, 969–973. [Google Scholar] [CrossRef]
  20. Loison, R.; Foch, P.; Boyer, A. Coke: Quality and Production; Butterworth & Co: Cambridge, UK, 1989; pp. 278–352. ISBN 0-408-02870-X. [Google Scholar]
  21. Díez, M.A.; Alvarez, R.; Barriocanal, C. Coal for metallurgical coke production: Predictions of coke quality and future requirements for Cokemaking. Int. J. Coal Geol. 2002, 50, 389–412. [Google Scholar] [CrossRef]
  22. Amanat, N.; Tsafnat, N.; Loo, B.C.E.; Jones, A.S. Metallurgical coke: An investigation into compression properties and microstructure using X-ray microtomography. Scr. Mater. 2009, 60, 92–95. [Google Scholar] [CrossRef]
  23. Kim, S.Y.; Sasaki, Y. Simulation of Effect of Pore Structure on Coke Strength Using 3-dimensional Discrete Element Method. ISIJ Int. 2010, 50, 813–821. [Google Scholar] [CrossRef]
  24. Haapakangas, J.; Uusitalo, J.; Mattila, O.; Kokkonen, T.; Porter, D.; Fabritius, T. A method for evaluating coke hot strength. Steel Res. Int. 2013, 84, 65–71. [Google Scholar] [CrossRef]
  25. Haapakangas, J.A.; Uusitalo, J.A.; Mattila, O.J.; Gornostayev, S.S.; Porter, D.A.; Fabritius, T. The Hot Strength of Industrial Cokes–Evaluation of Coke Properties that Affect Its High-Temperature Strength. Steel Res. Int. 2014, 85, 1608–1619. [Google Scholar] [CrossRef]
  26. Roine, A.; Lamberg, P.; Katiranta, T.; Salminen, J. HSC Chemistry 7 Simulation; Outotec Research: Pori, Finland, 2009. [Google Scholar]
  27. Haapakangas, J.; Suopajärvi, H.; Iljana, M.; Kemppainen, A.; Mattila, O.; Heikkinen, E.P.; Samuelsson, C.; Fabritius, T. Coke Reactivity in Simulated Blast Furnace Shaft Conditions. Metall. Mater. Trans. B 2016, 47, 2357–2370. [Google Scholar] [CrossRef]
  28. Cao, J.; Xiao, G.; Xu, X.; Shen, D.; Jin, B. Study on carbonization of lignin by TG-FTIR and high-temperature carbonization reactor. Fuel Proc. Technol. 2013, 106, 41–47. [Google Scholar] [CrossRef]
  29. Qin, L.; Han, J.; Ye, W.; Zhang, S.; Yan, Q.; Yu, F. Characteristics of Coal and Pine Sawdust Co-carbonization. Energy Fuels 2014, 28, 848–857. [Google Scholar] [CrossRef]
  30. Ng, K.W.; Giroux, L.; MacPhee, J.A.; Todoschuk, T. Incorporation of charcoal in coking coal blend—A study of the effects on carbonization conditions and coke quality. In Proceedings of the AISTech Iron & Steel Technology Conference, Atlanta, GA, USA, 7–10 May 2012. [Google Scholar]
  31. Nomura, S.; Arima, T.; Kato, K. Coal blending theory for dry coal charging process. Fuel 2004, 83, 1771–1776. [Google Scholar] [CrossRef]
  32. Kifani-Sahban, F.; Kifani, A.; Belkbir, L.; Zoulalian, A.; Arauzo, J.; Cardero, T. A physical approach in the understanding of the phenome accompanying the thermal treatment of lignin. Thermochim. Acta 1997, 298, 199–204. [Google Scholar] [CrossRef]
  33. Ng, K.W.; MacPhee, J.A.; Giroux, L.; Todoschuk, T. Reactivity of bio-coke with CO2. Fuel Proc. Technol. 2011, 92, 801–804. [Google Scholar] [CrossRef]
  34. Flores, B.D.; Flores, I.V.; Guerrero, A.; Orellana, D.R.; Pohlmann, J.G.; Diez, M.A.; Borrego, A.G.; Osório, E.; Vilela, A.C.F. Effect of charcoal blending with a vitrinite rich coking coal on coke reactivity. Fuel Proc. Technol. 2017, 155, 97–105. [Google Scholar] [CrossRef]
  35. Montiano, M.G.; Díaz-Faes, E.; Barriocanal, C. Effect of briquette composition and size on the quality of the resulting coke. Fuel Proc. Technol. 2016, 148, 155–162. [Google Scholar] [CrossRef]
  36. Diez, M.A.; Borrego, A.G. Evaluation of CO2-reactivity patterns in cokes from coal and woody biomass blends. Fuel 2013, 113, 306–313. [Google Scholar] [CrossRef]
  37. Nomura, S.; Ayukawa, H.; Kitaguchi, H.; Tahara, T.; Matsuzaki, S.; Naito, M.; Koizumi, S.; Ogata, Y.; Nakayama, T.; Abe, T. Improvement in Blast Furnace Reaction Efficiency through the Use of Highly Reactive Calcium Rich Coke. ISIJ Int. 2005, 45, 316–324. [Google Scholar] [CrossRef]
  38. Babich, A.; Senk, D.; Gudenau, H.W. Effect of coke reactivity and nut coke on blast furnace operation. Ironmak. Steelmak. 2009, 36, 222–229. [Google Scholar] [CrossRef] [Green Version]
  39. Sun, Z.; Li, P.; Guo, R.; Liu, P.; Liang, Y. Preparation of high strength and highly reactive coke by the addition of steel slag. Coke Chem. 2014, 57, 391–397. [Google Scholar] [CrossRef]
  40. Tuo, B.; Wang, J.; Yao, Y.; Yang, J. Influence of Coke Reactivity on Softening-Melting Dropping Behavior of Iron-Bearing Burden. Steel Res. Int. 2015, 86, 1028–1036. [Google Scholar] [CrossRef]
  41. Sh, K.; Guha, M.; Kumar, D.; DP, D. Application of binder in stamp charge coke making. ISIJ Int. 2004, 44, 1150–1156. [Google Scholar]
  42. Johansen, J.M.; Jakobsen, J.G.; Frandsen, F.J.; Glarborg, P. Release of K, Cl, and S during pyrolysis and combustion of high-chlorine biomass. Energy Fuels 2011, 25, 4961–4971. [Google Scholar] [CrossRef] [Green Version]
Figure 1. Schematic presentation of the laboratory-scale coking battery.
Energies 10 01850 g001
Figure 2. Schematic picture of the custom-built thermogravimetric analysis (TGA) furnace (modified from [27]): 1. gas cylinders; 2. gas flow controllers; 3. heated gas lines; 4. peristaltic pump; 5. deionized water; 6. gas inlet; 7. furnace tube (Al2O3); 8. thermocouple; 9. sample holder; 10. heating element (SiC); 11. gas outlet; 12. analytical scale; and 13. computer.
Energies 10 01850 g002
Figure 3. Thermogravimetric (TG) and differential thermogravimetric (DTG) profiles of coal, charcoal, and Kraft-lignin.
Energies 10 01850 g003
Figure 4. Normalized volatile matter release of the studied samples.
Energies 10 01850 g004
Figure 5. Bio-coke cold compression strength with different charcoal particle sizes (a); bio-coke cold compression strength with 0–10% charcoal and Kraft-lignin addition (b).
Energies 10 01850 g005
Figure 6. Reactivity of cokes in isothermal conditions at 1100 °C (a) and in non-isothermal conditions (b) with 5% charcoal addition and varying charcoal particle size.
Energies 10 01850 g006
Figure 7. Reactivity of cokes in isothermal conditions at 1100 °C (a), and in non-isothermal conditions with a 0–10% charcoal addition rate (b).
Energies 10 01850 g007
Figure 8. Reactivity of cokes in isothermal conditions at 1100 °C (a), and in non-isothermal conditions with a 0–10% Kraft-lignin addition rate (b).
Energies 10 01850 g008
Figure 9. Optical microscope images of reference coke (sample Ref. 2: a,b), coke prepared with charcoal (sample BC 5—c,d), and coke prepared with Kraft-lignin (sample BC 11: e,f). Scale bar: 60 μm.
Energies 10 01850 g009
Table 1. Composition of the coal/biomass blends in coking experiments.
Coking BlendBiomass Particle Size (μm)Coal (wt %)Charcoal (wt %)Kraft-Lignin (wt %)Mass (g)Bulk Density (kg/m3)
Reference 1-100.0--11.0634
BC 145–9095.05.0-11.0634
BC 2125–25095.05.0-11.0634
BC 3500–100095.05.0-11.0634
BC 41000–200095.05.0-11.0634
Reference 2-100.0--13.0750
BC 5125–25097.52.5-13.0750
BC 6125–25095.05.0-13.0750
BC 7125–25092.57.5-13.0750
BC 8125–25090.010.0-13.0750
BC 9125–25097.5-2.513.0750
BC 10125–25095.0-5.013.0750
BC 11125–25092.5-7.513.0750
BC 12125–25090.0-10.013.0750
Table 2. Gas composition used in the reactivity tests in both isothermal and in non-isothermal conditions.
Gas speciesN2COCO2H2H2O
Share (vol %)5027.917.12.12.9
Table 3. Chemical composition of coal, charcoal, and Kraft-lignin.
Coking CoalCharcoalKraft-Lignin
Ultimate analysis (wt %, db)C80.091.565.0
H4.82.35.6
O2.44.326.7
N2.20.50.13
S0.53NA1.94
Proximate (wt %, db)Ash9.81.50.7
Volatiles23.16.766.4
Fixed C67.191.832.9
Ash composition (%, db)SiO265.9012.012.6
Al2O325.504.13.4
Fe2O33.529.11.1
TiO21.500.20.073
CaO0.8444.03.0
MgO0.5710.910.5
Na2O0.925.724.4
K2O0.392.85.7
P2O50.516.90.26
Basicity index, BI (%) 0.676.751.96

