Article

Wind Turbine Loads Induced by Terrain and Wakes: An Experimental Study through Vibration Analysis and Computational Fluid Dynamics †

1
Department of Engineering, University of Perugia, Via G. Duranti 93, 06125 Perugia, Italy
2
Department of Engineering, University of Ferrara, Via G. Saragat 1, 44122 Ferrara, Italy
3
Renvico s.r.l., Via San Gregorio 34, 20124 Milano, Italy
*
Author to whom correspondence should be addressed.
This paper is an extended version of our paper published in The Science of Making Torque fromWind (TORQUE 2016), Munich, Germany, 5–7 October 2016.
Energies 2017, 10(11), 1839; https://doi.org/10.3390/en10111839
Submission received: 30 September 2017 / Revised: 6 November 2017 / Accepted: 8 November 2017 / Published: 10 November 2017
(This article belongs to the Special Issue Wind Turbine Loads and Wind Plant Performance)

Abstract

:
A wind turbine is a very well-known archetype of energy conversion system working at non-stationary regimes. Despite this, a deep mechanical comprehension of wind turbines operating in complicated conditions is still challenging, especially as regards the analysis of experimental data. In particular, wind turbines in complex terrain represent a very valuable testing ground because of the possible combination of wake effects among nearby turbines and flow accelerations caused by the terrain morphology. For these reasons, in this work, a cluster of four full-scale wind turbines from a very complex site is studied. The object of investigation is vibrations, at the level of the structure (tower) and drive-train. Data collected by the on-board condition monitoring system are analyzed and interpreted in light of the knowledge of wind conditions and operating parameters collected by the Supervisory Control And Data Acquisition (SCADA). A free flow Computational Fluid Dynamics (CFD) simulation is also performed, and it allows one to better interpret the vibration analysis. The main outcome is the interpretation of how wakes and flow turbulences appear in the vibration signals, both at the structural level and at the drive-train level. Therefore, this wind to gear approach builds a connection between flow phenomena and mechanical phenomena in the form of vibrations, representing a precious tool for assessing loads in different working conditions.

1. Introduction

Energy supply is undergoing a long-term process of conversion towards sustainability, through the exploitation of renewable technologies and low-carbon energy sources. Wind energy is considered one of the most important sources in order to reach the target of halving CO 2 emissions by 2050: an amount from 15% to 18% of global electricity should be produced from wind energy, and this should avoid emissions up to 4.8 gigatonnes of CO 2 per year [1]. In 2016, wind energy covered 4% of the global electricity demand, reaching 487 GW e of capacity [2]. Some European countries (Denmark, Germany, Ireland) cover up to 30% of their global demand with wind energy [1]. In this context, there is a strong industrial demand for improving wind turbine lifetime and optimizing the production output, which meets also ambitious scientific perspectives. The stochastic and very local nature of wind makes it difficult even to comprehend wind flow at the microscale level. Usually, several assumptions are needed in order to solve the Navier–Stokes equations, as for example steadiness. A fortiori, it is challenging to model the behavior of wind turbines with respect to the wind flow. This is a pressing issue because the main cause of producible energy loss in a wind farm is typically given by wake effects between nearby turbines [3,4]. The widespread diffusion of control systems at affordable cost and of storage systems for medium-sized datasets has been an important turning point in the wind energy industry. Data are the keystone of our era, and similarly, SCADA have given a significant boost to the improvement of wind farm practice. Not only the comprehension of wind flow and wakes has obtained an experimental counterpart for model validations [5,6], but also data analysis has become a branch of research in wind energy. Despite SCADA data analysis being believed to highlight anomalies as late-stage indications of occurring mechanical faults, impressive achievements have been reached in the use of SCADA for condition monitoring and prognostics [7,8].
As regards wind turbine faults, gearbox breakdowns are particularly burdensome and frequent. For this reason, noticeable attention is devoted to them, since, for instance, it is estimated [9] that a sudden failure of a 1.5-MW wind turbine during winter (when wind intensity is usually higher) leads to around €50,000 of missed production. Therefore, SCADA data have been employed for gearbox fault diagnosis. For example, in [10], gearbox oil temperatures recorded by SCADA have been used for the detection of incipient gearbox failures. Oil temperature has been exploited in [11] as well for the condition monitoring of wind turbine drive-lines. In [12], a condition monitoring method based on deep neural networks is proposed by using the gearbox lubricant pressure provided by SCADA.
In [10], a bird’s eye view of condition monitoring techniques for the wind turbine gearbox is provided. There are basically three: SCADA-based condition monitoring, oil particle analysis and vibration analysis. SCADA-based condition monitoring and oil particle counting are somehow based on the recognition of some kind of consequence induced by the anomalous motion of any mechanical part in a damaged or degraded system. The most powerful, and at the same time most demanding, technique is the straightforward analysis of the motion itself, in the form of vibration signals acquired by the Turbine Condition Monitoring System (TCMS). The sampling time of TCM systems is of the order of several Hz, but it can also reach the kHz scale. For example, in [13], gearbox vibration data having a 40-Hz frequency are studied. They are collected at the test facility of NREL and are down-sampled to 10 Hz in order to reproduce the most common reality in the industry; component failure identification and monitoring gearbox high-speed stage vibration are addressed, and four different data-driven models are developed. The shortcoming of this study is that the drive-train was fixed to the floor, and so, the relation with the tower and, most of all, with realistic wind flow was disregarded. Dealing with vibration signals for condition monitoring issues, the main point as regards wind turbines is decomposing the non-stationarity induced by the nature of the wind. In [14], a method is proposed combining Ensemble Intrinsic Time-scale Decomposition (EITD) and the Wavelet Packet Transform (WPT) fractal dimension. This is employed for decomposing vibration signals into several proper rotation components, and it is shown that this is capable of appreciable early fault diagnosis. In [15], a method for extracting the fault feature of the wind turbine bearing is proposed, based on Variational Mode Decomposition (VMD) and the Teager Energy Operator (TEO). The method is validated by simulation and experimental signal analysis results, and the authors claim it is superior with respect to empirical mode decomposition and conventional spectrum analysis. In [16], the objective is separating bearing fault signals from drive-train motion signals, and the proposed method is cepstral editing. The method is validated on experimental data from NREL. In [17], feature extraction is tackled by analyzing statistical features measuring the signal energy and Gaussianity from the residual signals between each pair from the first to the fifth tooth mesh frequency of the meshing process in a multi-stage wind turbine gearbox.
This survey of the literature pointed at supporting one reasonable observation: many contributions to the wind energy scientific literature are devoted to the analysis of wind flow at the microscale level (including at least the most straightforward interaction with the turbine: wakes), and many contributions are devoted to the most advanced mechanical aspects of wind turbine functioning. However, the connection between these two main topics is still somehow in the early stages, since it is a very challenging task. Very recently, some first developments, mainly focused on blade loads, have been obtained. In [18], short-term load measurements from a Vestas V66 wind turbine located in Germany are employed for estimating the effect of wakes on fatigue damage and on expected lifetime. In [19], fatigue load prediction is attempted using SCADA data and artificial neural network techniques. Attention is focused on blade bending moments, and it is reported that the proposed method provides an average error between simulations and measurements of the order of 1.5%. In [20], active control of wind turbine yawing is addressed in order to mitigate power losses and mechanical loads induced by wake interactions. This is achieved using a computational framework consisting of an aerodynamic model for wind farm wake, a blade-element-momentum model to compute the power and the loads and a gradient-based optimizer. An example of scientific contribution moving towards a real wind to gear perspective is [21]: the dynamic characteristics of the wind turbine gearbox under random wind excitations are studied. By using the Chebyshev inclusion function and the Welch method, an interval method for predicting the interval bounds of power spectral density for system responses is proposed. Further, in [22], a model of the load of the wind turbine gears for the simulation of real operational conditions is developed. Wind speed is simulated as a time series approximated by the Weierstrass function, and the rotational speed of the main shaft is consequently modeled. It is shown that the model fits nicely with experimental data, and this is claimed to be an important development for understanding how the loading of the drive-train, and therefore, its long-term damage, works.
The scientific motivations of this work are based on this discussion. A cluster of four wind turbines, having 2.3 MW of rated power each, is studied because it is sited in a very complex terrain. In previous works, as for example [23], it is shown that wakes between nearby turbines and effects induced by the terrain conspire in a complex way, resulting in a directional distortion of the wakes and a disruption of the wake front while proceeding downstream. This leads to a faster wake recovery with respect to what would happen in flat terrain, as can be estimated also through CFD simulations. The question addressed in this work is therefore the following: Do the particular unsteady wind flow conditions of this terrain on this cluster resemble somehow the vibration spectra? This question can be tackled because the wind turbines are instrumented with TCMS recording vibrations at the order of kHz. Two sub-objectives are attempted: The first one is analyzing tower structural vibrations, because they are expected to be more sharply responsive to the features of the wind flow and therefore to wakes between nearby wind turbines and to terrain effects. The second objective is the analysis of vibration spectra at the drive-train. This is further motivated by the fact that the drive-train acts as a velocity multiplier, and therefore, it might be very valuable for studying wind turbine wakes at rated power, when manifest symptoms (as power collapse) fade away.
The structure of the paper is the following: in Section 2, the test case and the dataset are described; the methods are introduced in Section 3; the results are collected and discussed in Section 4; the conclusions are finally drawn in Section 5.

2. The Test Case and the Dataset

The wind farm selected for this study is made of 17 turbines. Each of them has a rated power of 2.3 MW. The hub height is 80 m, and the rotor diameter is 93 m. The layout of the wind farm is vast and sited in a very complex terrain: even the comprehension of the free wind flow in this site is challenging. For the purposes of this study, a cluster of four wind turbines is selected. The turbine layout is sketched in Figure 1 with a three-dimensional view that allows one to appreciate the impressive complexity of the terrain.
The turbine layout is represented also by means of a two-dimensional view in Figure 2, highlighting the inter-turbine distances.
The amplitude of the wake sector between two neighboring wind turbines is given in Equation (1), according to the standards from the International Electrotechnical Commission [24]:
α = 1.3 180 arctan 2.5 D L + 0.15 π + 10 ,
where D is the rotor diameter and L is the relative distance between the wind turbines. Using Equation (1) for the couple of turbines SGM10 and SGM11 (see Figure 1), the resulting amplitude of the wake sector is 69.95 , and it is centered on the angle of the straight line connecting the two wind turbines: its value, as computed from wind turbine coordinate positions, is 279.69 . See Figure 2.
The dataset employed for the analysis is constituted of vibration time series acquired by the TCMS. The vibration measurements are provided by seven industrial accelerometers, type GJ1200M8, which are designed for harsh environments. The sensors are placed both on the wind turbine tower and on several critical points of the drive-line. The structural accelerations are recorded through a bi-axial sensor placed on the top of the tower while the drive-line vibrations are measured by means of six mono-axial accelerometers placed on several points of the drive-line housing. Table 1 summarizes the overall accelerometer layout. In this work, particular attention has been devoted to main bearing vibrations. For the sake of clarity, the main bearing is the bearing on which the rotor hub rotates. The schematic of the drive-line is shown in Figure 3. The wind turbine gearbox is a speed multiplier having a transmission ratio of 91 , 137 and is constituted of three stages: an epicyclic stage and two ordinary stages. The position of the main bearing accelerometer is highlighted by the black arrow. All the vibration signals of the main bearing have been acquired with a sampling frequency of 2557.5 Hz and a time length of 25 s. Note that the on-board acquisition system collects data only to a rated power of 2.3 MW, which corresponds to an average speed of the generator shaft of 1450 rpm.
As a support for interpreting the possible wake regime that the wind turbines might be undergoing when vibrations’ time series are recorded, further sources of information are employed. The TCMS provides also the average value of the meteorological conditions and the main working parameters (e.g., wind speed, nacelle positions, pitch angle, rotor revolutions per minute, and so on). Note that the term “average value” refers to quantities without frequency content, but stored just as a mean value over a certain time interval.
In Figure 1, an arrow indicates the main wind direction regime analyzed in this work: wind blowing from the west. Previous studies support this choice as interesting to study. For instance, in [23], it is shown that the wake of the upstream SGM10 wind turbine is directionally distorted by the terrain, and for example, when SGM10 orientates at 270 , SGM11 tends to orient at 260 . This shift, as well as orography singularities encountered while proceeding downstream explain the faster wake recovery along the cluster, with respect to what would happen in flat terrain. Furthermore, from [23], it also arises that the relative importance of wind turbine wakes and terrain-induced complex flow depends on wind speed regime. On these grounds and crosschecking against Equation (1), SGM11 nacelle orientation around 250 and 260 (see Tables 3 and 4) is a very interesting regime to study. The above information about mutual wake effects among wind turbines and about the interaction between wind turbines and terrain suggests that investigating turbines under the same external wind flow conditions could lead to interesting results and considerations. In order to do this, careful data mining must be performed because the vibration time series of each wind turbine is collected independently. In order to investigate the mutual interactions among different wind turbines subjected to turbulent flows, it is pivotal to analyze vibration signals recorded synchronously or in a very short time window. Furthermore, it is interesting to study wind turbines working at rated power, since power collapse symptoms fade away and also the macroscopic response of wind turbines (in the form of working parameters) should be dominated by the free flow (i.e., by the terrain). Therefore, one interesting question is if the gearbox, acting as a velocity multiplier, can somehow trace the different wake regimes and how they can be detected. Another interesting issue is what can be observed through the structural vibrations analysis about the combination of wakes and terrain effects. These questions are addressed in the following sections.

3. Experimental and Numerical Methods

3.1. Tower Vibration Analysis

The TCMS records the structural accelerations through a bi-axial sensor placed on the top of the tower. In this way, both the fore-aft and lateral accelerations can be measured on a plane parallel to the ground. As regards tower oscillations, the Root Mean Square (RMS) of the signal is analyzed as a function of the yaw position. For the purpose of this study, the RMS is a meaningful metric because it describes the overall (root) energy of vibration signals that reflects the global structural vibration of the tower. The yaw position is a meaningful SCADA measurement for the purpose of this work, because, on the grounds of considerations similar to those in [23], it can easily be put in relation to the wake regime described by Equation (1).

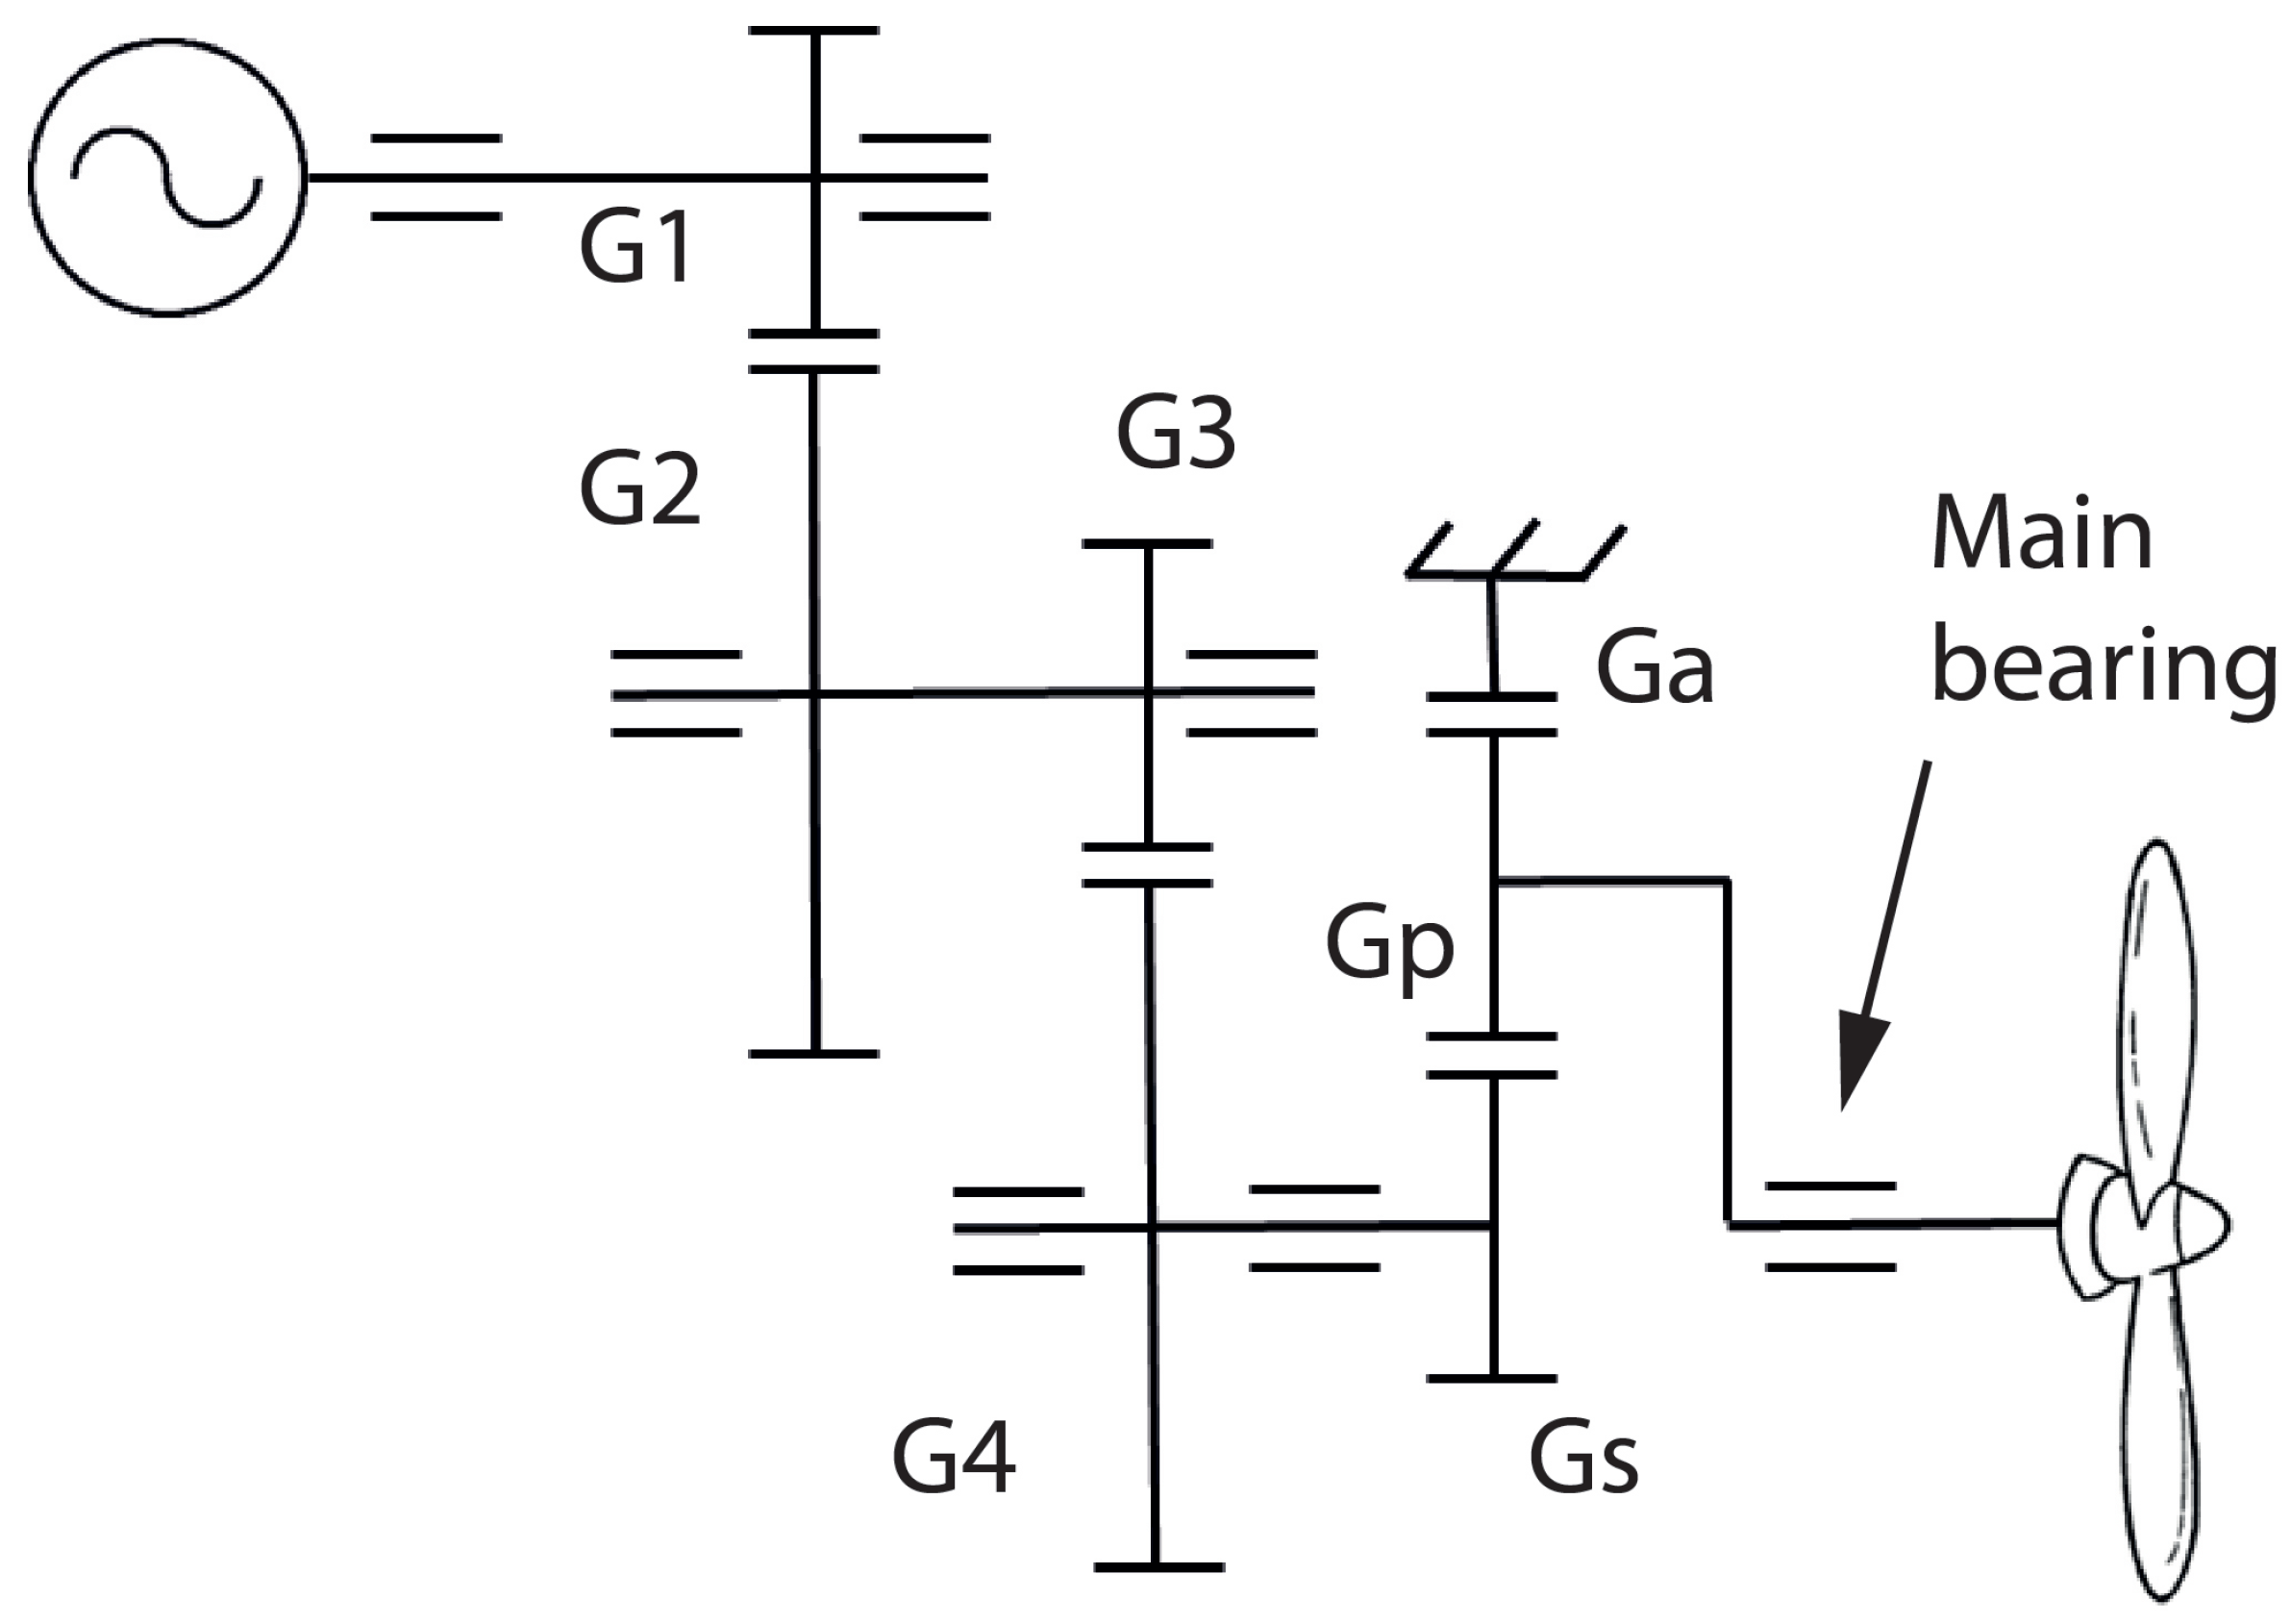
3.2. Gearbox Vibration Analysis

It is reasonable to suppose that the turbulent flows cause an abnormal change of the rotational speed. Thus, the study of drive-line speed variations could be pivotal in order to detect and investigate the wake effects on a wind turbine sub-cluster. Unfortunately, the TCMS does not provide a direct measure of the instantaneous speed of any drive-line shaft. However, the vibration signals can be exploited for extracting the gear speed variations by means of a dedicated signal processing procedure. In this work, the planet carrier speed has been extracted from the main bearing vibration signal by using the method proposed in [25], which is based on the Hilbert transform. Then, the variation severity of the extracted speed has been quantified by means of a scalar index, called the Crest Factor (CF) [26]. The aforementioned approach has been performed on two different datasets. The first dataset is constituted of eleven Time Series (TS) referenced to SGM11 recorded at different times with different average nacelle orientations. The objective, in this case, is highlighting possible peculiarities of the SGM11 wind turbine operating under the wake of upstream SGM10, in terms of vibration spectra and drive-line speed fluctuations. Eventually, the link between phase fluctuations and turbulent flows has been further investigated by analyzing the residual signal [27] of the planetary annulus gear, which exhibits marked modulation phenomena likely caused by the wake effect.
The second dataset is composed of seven TSs recorded in a time interval of less than ten minutes (see Table 4), during which the flow conditions have been considered as reasonably constant, considering all the available turbines of the subcluster. In this case, the goal is inquiring if and how the differences of external wind flows, induced by the wake interactions, resemble differences in the extracted instantaneous speed of the wind turbine drive-line in terms of CF values.

3.3. The CFD Model

As a support for the interpretation of the vibration spectra and their relation with the working parameters of the wind turbine (as for example yaw position), a free flow CFD simulation is performed, using the WindSim numerical tool [28,29] and adopting the Reynolds-Averaged Navier–Stokes (RANS) approach. Despite that in general, the complexity of the terrain and the interplay with wind turbine wakes call for more advanced approaches as for example Large-Eddy Simulations (LES), their use for simulation of full-scale wind turbines in real complex terrain is in the early stages [30]. RANS is nowadays still a widely-employed approach [31,32] even in complex terrain, despite its well-known limitations caused by the steadiness assumption.
The details about the model are reported in the following Table 2, where x is the north-south direction, y is the east-west direction and z is the vertical coordinate. The computational grid is reported in Figure 4, where on the left, there is the x - y grid and on the right the z grid.
Laterally, due to the Cartesian grid, there are two frictionless walls and one inlet and one outlet for the orthogonal sectors and two inlets and two outlets for the skewed sectors. For the ground, there is a wall function for fully-rough regimes developed by the code provider. The complex terrain is handled using the body-fitted coordinates in order to consider the terrain boundary layer. The wind at the inlet is a logarithmic profile according to the roughness length (approximately of the order of 0.003). As indicated in Table 2, the selected turbulence model is RNG (Re-Normalisation Group) k- ϵ . According to some studies in the literature [33], this is a good choice for simulating flow in complex terrain. In [34], the performances of different turbulence models are compared in idealized and real terrains: in particular, for the terrain of Askervein Hill, it arises that, similarly to the idealized cases, RNG k- ϵ is a good choice. The rationale for the use of this CFD model is observing what information is provided from the free flow about the distribution of turbulence intensity at hub height, induced by terrain and roughness. As discussed in [35], in order to precisely estimate the turbulence intensity from CFD models, it is important to take into account the roughness properly and, in this very complex case, especially the terrain.

4. Results

4.1. Tower Vibrations

The RMS of the i-th tower vibration is given by:
R M S i = 1 N i n i = 1 N i | a x i [ n i ] | 2 + | a y i [ n i ] | 2 ,
where a x i and a y i are the two discrete components of the plane vibration. Suppose that there are K vibration time series for a given wind turbine and that the normalized RMS is computed as:
N R M S i = R M S i i = 1 K R M S i K .
The data are grouped by the TCMS in intervals of power with respect to the rated power: for this reason, Figure 5 refers to the range of 75% of rated power, and Figure 6 refers to the rated power regime. In Figure 5 and Figure 6, the normalized RMS is plotted against the average nacelle position measured during the time interval of vibration recording.
In Figure 5, there are several peaks of normalized RMS as regards turbine SGM11 when the nacelle is oriented at around 260 . As discussed in [23] and hinted at in Section 3, the nacelle orientation at 260 is the typical configuration of SGM11 as a response to the wake of turbine SGM10 when the wind blows from the west. This picture, therefore, supports the idea that the turbulence induced by the wake can be observed through the structural vibrations. The situation is somehow reversed when dealing with the rated power regime (Figure 6). The most evident peaks now regard turbine SGM13, and they thicken around 240 . Following a SCADA data filtering procedure, analogous to the one in [23] on the same dataset of two years of measurements, it arises that when SGM13 is oriented at 240 and is producing rated power, the nacelle of SGM10 is on average oriented at 252 . The SGM10 yaw position at 252 indicates, on the grounds of Equation (1), a partial wake hitting the rest of the cluster. Further, the 240 direction sector is peculiar because it is characterized by the highest terrain complexity along the cluster: this point has been discussed, for example, in [36], where the complexity of the terrain has been quantified through the RIX values (Ruggedness Index) [37,38] computed at a given point through the Wind Atlas Analysis and Application Program as the fractional extent of the surrounding terrain, which is steeper than a certain critical slope. In particular, at the site of SGM13, the directional RIX at 240 is the highest, and it is 50% higher than the average non-directional RIX. On these grounds, the thrust regime (weaker at rated power), the partial rather than full wake regime and the RIX values support that the peaks of RMS of the SGM13 tower vibrations in Figure 6 are due to the flow acceleration induced by the terrain.
Therefore, summarizing, the plots of Figure 5 and Figure 6 allow highlighting, with a structural vibration viewpoint, the most important phenomena characterizing the cluster of interest, depending on the regime of interest: wake on SGM11 at medium-high powers and terrain effects at rated power.

4.2. CFD

In Figure 7, the simulated wind speed and pressure fields at hub height are reported on the whole computational domain. Three wind direction sectors have been selected, for brevity: 30 , 60 and 270 . These three sectors have been selected according to the wind direction measured when the experimental vibration time series here on analyzed have been collected (see Figure 8). From SCADA data analysis, it arises that these sectors occur respectively 13.5%, 8% and 20.5% of the time. Looking at the contours reported in Figure 7, it is clear that the simulated field conditions lead to wind speed on the rotor for rated power production; also, some differences in the inflow conditions for each position arise.
The picture arising from the results collected in the previous subsection is supported by the following analysis, focused on turbine SGM11 and concerning the crosscheck against the numerical model. The procedure is as follows. The TCMS keeps stored a certain number of the latest tower vibration time series in their raw form, only at rated power. The frequency of the acquisition is 40 Hz, and the time series are long more than 6 min. These have been analyzed, post-processed using a band-pass filter in the [ 0.1 , 2 ] Hz interval, and the normalized RMS has been computed. The numerical model has been employed for computing the turbulence intensity at hub height. For each average nacelle position of each time series, the turbulence intensity is extrapolated at the corresponding direction at the site of the SGM11 wind turbine. These two quantities (RMS and turbulence intensity) are juxtaposed in Figure 8.
From Figure 8, it arises that the turbulence intensity of the free flow increases approaching 260 . The behavior is similar as regards the normalized RMS . This can be considered a qualitative result supporting that, at rated power, the behavior of the free flow (and therefore, the importance of the terrain) is fundamental in order to understand structural vibrations. The definitive crosscheck would be simulating the free flow and the wind turbines together, for example using the actuator disc approach as in [23], and comparing the values and distribution of turbulence intensity. Unfortunately, the employed model allows one only to consider orthogonal disc orientations, and the behavior in Figure 8 therefore cannot be reproduced accounting also for the presence of wind turbines.

4.3. Main Bearing

The wake effect of turbine SGM10 on the rest of the cluster is now investigated from two different standpoints. The first one concerns the vibration analysis of the gearbox of turbine SGM11 in terms of the instantaneous speed variation, as well as the annulus gear vibration. This analysis concerns the use of eleven time series (TS1 to TS11), devoted only to wind turbine SGM11. Some details of the working parameters during the acquisitions are reported in Table 3. The second approach is the study of the interactions of SGM10, SGM11, SGM12 and SGM13 by comparing their instantaneous speed variations. Since the acquisition system does not allow the synchronous measurements of different turbines, the available dataset has been carefully inspected in search of a (small) time window where the main bearing vibrations have been recorded in all the wind turbines. More details about the related time series (TS12 to TS18) can be found in Table 4. As regards TS12 to TS18, data have been also selected taking into account a yaw position around 260 , in particular of the SGM11 wind turbine. This position is interesting to study because it is a typical configuration characterized by the wake effect, or better, by the combination of the wake effect and terrain-induced effects [23] of SGM10 on the rest of the cluster. An example of some raw vibration signals acquired on the main bearing is given in Figure 9. For the sake of clarity, Table 5 collects the meshing frequencies of the gearbox referenced to a generator speed of 1445.8 rpm.
The RMS values of the main bearing are reported in Figure 10. The trend of the RMS values does not reveal any information about the wake effect on SGM11. Indeed, the RMS related to TS5 (which is the time series of the dataset that is characterized by the minimum distance with respect to the center of the wake sector, Equation (1)) is at the same level of the other RMS values. This preliminary result points out that RMS is not a good indicator to possibly capture the information about the turbulent flow phenomena due to the wake effect.
However, useful information can be deduced by extracting the instantaneous phase of the planetary gear from the vibration signals. By looking at the spectra represented in Figure 11, the high level components correspond to the gear mesh frequencies. Again, no significant remarks can be made by comparing such components in terms of amplitudes. Moreover, it should be noted that the periodic components related to the meshing gears are not concentrated in a precise frequency bin, but they spread around small frequency ranges centered in the corresponding gear mesh frequencies (see Figure 11b). This behavior is due to fluctuations of the rotational speed, which is not surprising since wind turbines generally operate in non-stationary conditions. However, the turbulent flows should induce a general rise of the shaft speed variations. Thus, the study of the instantaneous speed of the drive-train should lead to interesting implications about the wake effect. By virtue of these considerations, the comparison of phase variations is addressed hereafter since the speed variations could be meaningful for the quantification of the wake effect.
Commonly, speed variations are investigated by means of the measured speeds by using dedicated tachometers. Unfortunately, since the tachometer signal is not available in the provided dataset, the instantaneous phase must be estimated indirectly from a vibration signal. In detail, the instantaneous phase of the shaft can be extracted from the spectral information given by the meshing components.
In this work, the instantaneous phase extracted from the main vibration signal and referenced to the planetary gear is computed following the method presented in [25]. Briefly, the method involves the use of the Hilbert transform for the estimation of the analytic signal [39]. The analytic signal is a complex signal where the imaginary part refers to the instantaneous phase, while the real part refers to the envelope. A definition of analytic signal is given by the following equation:
x a ( t ) = x ( t ) + i x ˜ ( t )
where i is the imaginary unit, x ( t ) is the time signal and x ˜ ( t ) is the Hilbert transform of x ( t ) . Thus, Equation (4) evaluated on a filtered signal around a meshing frequency f m becomes:
x a ( t ) = X n ( t ) e i ( 2 π f m t + ϕ n ( t ) )
where X n ( t ) is the amplitude of the n-th meshing component and ϕ n ( t ) is the phase angle of the n-th meshing component. The degree of phase fluctuation due to the turbulent flow has been quantified by means the CF. The CF is a general scalar measure of a waveform, which is defined as the ratio between the maximum of a given time series and its RMS value:
C F = max | s ( t ) | R M S ( s ( t ) )
where s ( t ) is an arbitrary time series. From the physical standpoint, the CF of the instantaneous phase reflects the severity of the planet carrier speed variation. Thus, it is reasonable to assume that the greater the flow turbulence (due to the wake effect), the greater is the CF value.
Finally, the following procedure has been adopted:
Step 1:
the (very) low frequency components have been removed by using a high-pass filter;
Step 2:
three gear mesh harmonics have been separately filtered by means of a band-pass filter and considering eight sidebands (four each side);
Step 3:
the instantaneous phase is computed for each filtered gear mesh component by means of the Hilbert transform;
Step 4:
the overall CF is computed by taking the sum of the individual CFs estimated from each filtered gear mesh component.
Note that Step 1 is a pre-processing step for the removal of low frequency components unrelated to the phenomena of interest.
As reported in Figure 12, computing the overall CF of the same TSs used in Figure 10, it can be seen that the maximum value corresponds to TS5, as expected. This result confirms that the turbulent flow induces a prominent change in the rotational speed of the turbine gearbox, with specific reference to the planet carrier shaft.
It is a matter of fact [27] that speed fluctuations in gearboxes take the form of sidebands around the meshing frequency in the frequency spectrum. In order to make a clearer representation of the results reported in Figure 12, the Time Synchronous Average (TSA) [40] of the vibration signal referenced to the planetary annulus gear has been computed. Then, the residual signal has been estimated by removing the fundamental gear mesh component and its harmonics. The resulting signal is a signal that owns mainly the amplitude/phase modulations, which comprise the information of interest. As done previously, the CF has been computed on the residual signal, and the results are reported in Figure 13. This approach better highlights the modulation phenomena occurring in TS5, which could be induced by the wake effect.
A further confirmation of this behavior is given by some results on the TS12 to TS18 time series (Figure 14), thus switching to the approach of observing as simultaneously as possible the vibrations of the wind turbines under a regime that is associated to the wake of SGM10 on the rest of the subcluster [23]. The details of the time series employed for this analysis are reported in Table 4.
The recording time has been included in order to show that this dataset regards the vibration signals acquired in a limited time window in which all the turbines are oriented in a wake configuration. Further, a crosscheck against the SCADA dataset is useful: the standard deviation on a 10-min basis of the data is available. It results that, during each of the 10-min intervals containing the time stamps in Table 4, the standard deviation of the nacelle position of each turbine is of the order of 2.5 . Therefore, it is completely reasonable to juxtapose the time series of Table 4 to compare their properties, because they are collected during time intervals displaying very similar flow regimes.
As regards Figure 14, it is immediately clear that, in all the considered datasets, the degree of phase fluctuation of SGM11 is higher than the one of SGM10. This observation is in complete agreement with the previous results. Some other considerations can be drawn by observing the results of SGM12 and SGM13. Assuming (on the grounds of the arguments in [23]) that the wake effect should be maximum for SGM11, the vibrational behavior of the other turbines should be a compromise between SGM10 and SGM11. Moreover, the wake effect should become more and more random according to the number of the turbines in series. The results confirm this hypothesis since the overall CF of SGM13 and the average results of SGM12, namely TS15 and TS17, are collocated in between the results of SGM10 and SGM11. Note also that the yaw position angle is according to the angular position typical of a wake configuration, as supported by experimental data in Section 4.1.
Eventually, this investigation using the main bearing vibration signals has highlighted that the wake effect is detectable also by means of gearbox vibration analysis (with specific reference to the main bearing). This approach involves a more complex signal processing treatment with respect to the tower structural vibrations analysis, but allows for a deeper insight about the link between the nacelle vibrations and the turbulent flows. Despite the restrictions of the acquisition system, the available data have shown consistent results with respect to the previous work on the topic, as well as the assumptions made.

5. Conclusions

This work has been devoted to the study of tower and structural vibrations of four full-scale wind turbines operating in a very complex terrain. The analysis of experimental vibration data has been empowered by the analysis of the SCADA data of the wind turbines and by a CFD model of the wind flow over the terrain.
The test case has been selected because it is characterized by a peculiar combination of wake effects between nearby turbines and terrain-induced flow acceleration, as discussed in previous papers from the authors (especially [23]).
The main question that this work aimed to answer is: Based on the knowledge of the wind flow at this site and of the operating behavior of the wind turbines, is it possible to see that the particular unsteady conditions, which are due to the mixing of wakes and complex flow, resemble the vibration spectra? The answer is yes, and further, the methods proposed in this work are general and can be expected to work for any test case. The main findings of this work are therefore the following: as regards structural vibrations, the analysis of their normalized RMS as a function of wind turbine nacelle position at different power regimes gives an indication of the relative importance of wakes and terrain effects. The effect of wakes is more clearly visible at medium-high powers, and that of terrain is better highlighted at rated power.
Concerning the drive-train vibrations, the research has focused on the main bearing vibration signal. Two different aspects have been addressed: the first one is the vibrational behavior of the wind turbine being more involved with the wake effect (SGM11) of the upstream SGM10; the second one regards the interactions due to the wake effect on the whole cluster, as observed at the closest possible times available in the dataset. A total of 18 TSs has been considered, demonstrating a consistent link between the turbulent flows and the speed variations of the drive-line. As expected, the greater the wake effect, the greater the speed fluctuations. Moreover, the wake effect becomes more stochastic and less severe for the furthest wind turbines (SGM12 and SGM13). These results support the picture of the wake recovery along the cluster that has been proposed in [23]. It is further interesting that this kind of analysis, exploiting the fact that the drive-train acts as a velocity multiplier, allows one to detect symptoms of wake effects at rated power (all the TSs analyzed in this work are collected at rated power; see Table 3 and Table 4), when the most manifest symptoms are not visible.
As discussed also in Section 1, impressive achievements have been obtained in vibration analysis for condition monitoring and early fault diagnosis of the gearbox of wind turbines. These methods, however, usually consider the gearbox by itself: actually, the main technical issue is exactly cleaning the signal from the unsteadiness induced by the varying flow. The approach of this work is somehow opposite: employing the techniques of non-stationary vibration signal analysis for building a connection with the wind flow. This kind of information about loads, stresses, possible long-term degradation of drive-train components under peculiar regimes, as wake or complex flow, could be used for wind farm optimization, for individuating advantageous sector management with the aim of wake mitigation, and so on. This task has been recently attracting much interest in the scientific community dealing with wind energy: the expected lifetime of a component is gradually becoming a parameter depending on the history of the operation of a wind turbine, rather than an estimate provided at the design phase. This connects the present work to an important future development: the analysis and modeling of fatigue loads [41,42]. In the perspective that in the future, it could be possible to formulate and connect careful modelings of the rotor, drive-train and wind field for wake and non-waked operation, in order to build a theoretical framework from wind to gear and from gear to wind, it is certainly valuable to start from the experimental evidence, as has been done in this work.

Author Contributions

Francesco Castellani conceived the research, performed the CFD simulations and analysed tower vibrations; Marco Buzzoni analysed the main bearing vibrations and wrote the paper; Davide Astolfi analysed SCADA data and tower vibrations and wrote the paper; Gianluca D’Elia developed the signal analysis techniques; Giorgio Dalpiaz conceived and supervised the research; Ludovico Terzi provided the experimental data.

Conflicts of Interest

The authors declare no conflict of interest.

References

  1. Philibert, C.; Holttinen, H. Wind Energy Technology Roadmap. In Technical Report; OECD/IEA: Paris, France, 2013. [Google Scholar]
  2. Marti, I. IEA Wind TCP 2016 Annual Report. In Technical Report; IEA: Paris, France, 2017. [Google Scholar]
  3. Vermeulen, P. An experimental analysis of wind turbine wakes. In Proceedings of the 3rd International Symposium on Wind Energy Systems, Lyngby, Denmark, 26–29 August 1980; pp. 431–450. [Google Scholar]
  4. Shen, W.Z.; Sørensen, J. Numerical modeling of wind turbine wakes. J. Fluids Eng. 2002, 124, 393–399. [Google Scholar]
  5. Barthelmie, R.J.; Hansen, K.; Frandsen, S.T.; Rathmann, O.; Schepers, J.; Schlez, W.; Phillips, J.; Rados, K.; Zervos, A.; Politis, E.; et al. Modelling and measuring flow and wind turbine wakes in large wind farms offshore. Wind Energy 2009, 12, 431–444. [Google Scholar] [CrossRef]
  6. Barthelmie, R.J.; Pryor, S.C.; Frandsen, S.T.; Hansen, K.S.; Schepers, J.; Rados, K.; Schlez, W.; Neubert, A.; Jensen, L.; Neckelmann, S. Quantifying the impact of wind turbine wakes on power output at offshore wind farms. J. Atmos. Ocean. Technol. 2010, 27, 1302–1317. [Google Scholar] [CrossRef]
  7. Yang, W.; Tavner, P.J.; Crabtree, C.J.; Feng, Y.; Qiu, Y. Wind turbine condition monitoring: Technical and commercial challenges. Wind Energy 2014, 17, 673–693. [Google Scholar] [CrossRef] [Green Version]
  8. Wilkinson, M.; Darnell, B.; van Delft, T.; Harman, K. Comparison of methods for wind turbine condition monitoring with SCADA data. IET Renew. Power Gener. 2014, 8, 390–397. [Google Scholar] [CrossRef]
  9. Windpower Monthly. Exploring the Innovations, Challenges and Potential of the Products and Services that Keep Wind Turbines Operating; Windpower Monthly, Haymarket Media Group: London, UK, 2013. [Google Scholar]
  10. Feng, Y.; Qiu, Y.; Crabtree, C.J.; Long, H.; Tavner, P.J. Monitoring wind turbine gearboxes. Wind Energy 2013, 16, 728–740. [Google Scholar] [CrossRef]
  11. Wang, Y.; Infield, D. Supervisory control and data acquisition data-based non-linear state estimation technique for wind turbine gearbox condition monitoring. IET Renew. Power Gener. 2013, 7, 350–358. [Google Scholar] [CrossRef]
  12. Wang, L.; Zhang, Z.; Long, H.; Xu, J.; Liu, R. Wind turbine gearbox failure identification with deep neural networks. IEEE Trans. Ind. Inf. 2017, 13, 1360–1368. [Google Scholar] [CrossRef]
  13. Zhang, Z.; Verma, A.; Kusiak, A. Fault analysis and condition monitoring of the wind turbine gearbox. IEEE Trans. Energy Convers. 2012, 27, 526–535. [Google Scholar] [CrossRef]
  14. Hu, A.; Yan, X.; Xiang, L. A new wind turbine fault diagnosis method based on ensemble intrinsic time-scale decomposition and WPT-fractal dimension. Renew. Energy 2015, 83, 767–778. [Google Scholar] [CrossRef]
  15. Zhao, H.; Li, L. Fault diagnosis of wind turbine bearing based on variational mode decomposition and Teager energy operator. IET Renew. Power Gener. 2016, 11, 453–460. [Google Scholar] [CrossRef]
  16. Peeters, C.; Guillaume, P.; Helsen, J. Vibration-based bearing fault detection for operations and maintenance cost reduction in wind energy. Renew. Energy 2017, 116, 74–87. [Google Scholar] [CrossRef]
  17. Skrimpas, G.A.; Ursin, T.; Sweeney, C.; Marhadi, K.; Mijatovic, N.; Holboell, J. Residual signal feature extraction for gearbox planetary stage fault detection. Wind Energy 2017. [Google Scholar] [CrossRef]
  18. Karlina-Barber, S.; Mechler, S.; Nitschke, M. The effect of wakes on the fatigue damage of wind turbine components over their entire lifetime using short-term load measurements. J. Phys. Conf. Ser. 2016, 753, 072022. [Google Scholar] [CrossRef]
  19. Vera-Tudela, L.; Kühn, M. Analysing wind turbine fatigue load prediction: The impact of wind farm flow conditions. Renew. Energy 2017, 107, 352–360. [Google Scholar] [CrossRef]
  20. Van Dijk, M.T.; van Wingerden, J.W.; Ashuri, T.; Li, Y. Wind farm multi-objective wake redirection for optimizing power production and loads. Energy 2017, 121, 561–569. [Google Scholar] [CrossRef]
  21. Wei, S.; Han, Q.; Peng, Z.; Chu, F. Dynamic analysis of wind turbine gearboxes with unknown-but-bounded parameters under random wind excitation. IET Renew. Power Gener. 2016, 11, 433–442. [Google Scholar] [CrossRef]
  22. Bielecki, A.; Barszcz, T.; Wójcik, M. Modelling of a chaotic load of wind turbines drivetrain. Mech. Syst. Signal Process. 2015, 54, 491–505. [Google Scholar] [CrossRef]
  23. Castellani, F.; Astolfi, D.; Mana, M.; Piccioni, E.; Becchetti, M.; Terzi, L. Investigation of terrain and wake effects on the performance of wind farms in complex terrain using numerical and experimental data. Wind Energy 2017, 20, 1277–1289. [Google Scholar]
  24. Gasch, R.; Twele, J. Wind Power Plants: Fundamentals, Design, Construction and Operation; Springer Science & Business Media: Berlin, Germany, 2011. [Google Scholar]
  25. Coats, M.; Randall, R. Single and multi-stage phase demodulation based order-tracking. Mech. Syst. Signal Process. 2014, 44, 86–117. [Google Scholar] [CrossRef]
  26. Sawalhi, N.; Randall, R.B. Gear parameter identification in a wind turbine gearbox using vibration signals. Mech. Syst. Signal Process. 2014, 42, 368–376. [Google Scholar] [CrossRef]
  27. Assaad, B.; Eltabach, M.; Antoni, J. Vibration based condition monitoring of a multistage epicyclic gearbox in lifting cranes. Mech. Syst. Signal Process. 2014, 42, 351–367. [Google Scholar] [CrossRef]
  28. Moreno, P.; Gravdahl, A.; Romero, M. Wind flow over complex terrain: Application of linear and CFD models. In Proceedings of the European Wind Energy Conference and Exhibition, Madrid, Spain, 16–19 June 2003; pp. 16–19. [Google Scholar]
  29. Dhunny, A.; Lollchund, M.; Rughooputh, S. Wind energy evaluation for a highly complex terrain using Computational Fluid Dynamics (CFD). Renew. Energy 2017, 101, 1–9. [Google Scholar] [CrossRef]
  30. Berg, J.; Troldborg, N.; Sørensen, N.; Patton, E.; Sullivan, P. Large-Eddy Simulation of turbine wake in complex terrain. J. Phys. Conf. Ser. 2017, 854, 012003. [Google Scholar] [CrossRef]
  31. Nedjari, H.D.; Guerri, O.; Saighi, M. CFD wind turbines wake assessment in complex topography. Energy Convers. Manag. 2017, 138, 224–236. [Google Scholar] [CrossRef]
  32. Murali, A.; Rajagopalan, R. Numerical simulation of multiple interacting wind turbines on a complex terrain. J. Wind Eng. Ind. Aerodyn. 2017, 162, 57–72. [Google Scholar] [CrossRef]
  33. Peralta, C.; Nugusse, H.; Kokilavani, S.; Schmidt, J.; Stoevesandt, B. Validation of the simpleFoam (RANS) solver for the atmospheric boundary layer in complex terrain. In ITM Web of Conferences; EDP Sciences: In Lees, France, 2014; Volume 2, p. 01002. [Google Scholar]
  34. Abdi, D.S.; Bitsuamlak, G.T. Wind flow simulations on idealized and real complex terrain using various turbulence models. Adv. Eng. Softw. 2014, 75, 30–41. [Google Scholar] [CrossRef]
  35. Abdi, D.; Bitsuamlak, G.T. Numerical evaluation of the effect of multiple roughness changes. Wind Struct. 2014, 19, 585–601. [Google Scholar] [CrossRef]
  36. Castellani, F.; Astolfi, D.; Terzi, L.; Hansen, K.S.; Rodrigo, J.S. Analysing wind farm efficiency on complex terrains. J. Phys. Conf. Ser. 2014, 524, 012142. [Google Scholar] [CrossRef]
  37. Bowen, A.J.; Mortensen, N.G. WAsP Prediction Errors Due to Site Orography; Risø National Laboratories: Roskilde, Denmark, 2004. [Google Scholar]
  38. Mortensen, N.G.; Landberg, L.; Troen, I.; Lundtang Petersen, E.; Rathmann, O.; Nielsen, M. Wind Atlas Analysis and Application program (WAsP): Vol. 3: Utility Programs; Technical Report; Risø National Laboratory: Roskilde, Denmark, 1999. [Google Scholar]
  39. Feldman, M. Hilbert transform in vibration analysis. Mech. Syst. Signal Process. 2011, 25, 735–802. [Google Scholar] [CrossRef]
  40. Braun, S. The synchronous (time domain) average revisited. Mech. Syst. Signal Process. 2011, 25, 1087–1102. [Google Scholar] [CrossRef]
  41. Tibaldi, C.; Henriksen, L.C.; Hansen, M.H.; Bak, C. Wind turbine fatigue damage evaluation based on a linear model and a spectral method. Wind Energy 2016, 19, 1289–1306. [Google Scholar] [CrossRef]
  42. Kim, S.H.; Shin, H.K.; Joo, Y.C.; Kim, K.H. A study of the wake effects on the wind characteristics and fatigue loads for the turbines in a wind farm. Renew. Energy 2015, 74, 536–543. [Google Scholar] [CrossRef]
Figure 1. The layout and the inter-turbine distance of the subcluster under investigation. The four turbines are labelled with their names: SGM10, SGM11, SGM12 and SGM13. The terrain is represented with a contour line resolution of 20 m.
Energies 10 01839 g001
Figure 2. The two-dimensional representation of the layout of the cluster. Inter-turbine distances are indicated.
Energies 10 01839 g002
Figure 3. Schematic overview of the gearbox.
Energies 10 01839 g003
Figure 4. The horizontal (left) and vertical (right) distribution of the computational grid with the refinement around the turbine area and near the terrain boundary.
Energies 10 01839 g004
Figure 5. Normalized root mean square of tower vibrations vs. nacelle position (75% rated power).
Energies 10 01839 g005
Figure 6. Normalized root mean square of tower vibrations vs. nacelle position (rated power).
Energies 10 01839 g006
Figure 7. Results from (a) the simulated wind field speed at hub height 30 ; (b) the simulated free pressure field at hub height 30 ; (c) the simulated wind field speed at hub height 60 ; (d) the simulated free pressure field at hub height 60 ; (e) the simulated wind field speed at hub height 270 ; (f) the simulated free pressure field at hub height 270 .
Energies 10 01839 g007
Figure 8. Normalized RMS (root mean square) vs. nacelle position for SGM11 (red scale) and numerical TI (turbulence intensity) extrapolated at the corresponding wind direction (blue scale) at the site of SGM11.
Energies 10 01839 g008
Figure 9. Raw vibration signals referenced to (a) Time Series 5 (TS5), (b) TS6 and (c) TS8.
Energies 10 01839 g009
Figure 10. RMS values estimated by using the main bearing vibration signals.
Energies 10 01839 g010
Figure 11. (a) Spectra of TS5, TS6 and TS8; (b) detail of a planetary meshing frequency.
Energies 10 01839 g011
Figure 12. Overall Crest Factor (CF) values of the instantaneous phases of the first three harmonics of the planetary gear meshes.
Energies 10 01839 g012
Figure 13. Overall CF of the annulus residual signals.
Energies 10 01839 g013
Figure 14. Overall CF values of the instantaneous phases of all the available turbines in the same time window.
Energies 10 01839 g014
Table 1. Accelerometer layout.
Number of SensorsDirection
main bearing1radial
gearbox3radial
generator bearing1radial
tower1axial and traversal
Table 2. The setup of the CFD model.
FeatureSet Up
Number of cells in the x direction104
Number of cells in the y direction90
Number of cells in the z direction61
Resolution in the x direction3.1 m. min. to 66.9 m. max.
Resolution in the y direction3.1 m. min. to 52 m. max.
Resolution in the z direction3.1 m. min. to 159.8 m. max.
Extension of the domain in the x direction2500 m.
Extension of the domain in the y direction1700 m.
Extension of the domain in the z direction2380 m.
Boundary layer height400 m.
Speed above boundary layer16 m/s
Top boundary conditionsFixed pressure
SolverGeneral Collocated Velocity (GCV)
Turbulence modelRNG (Re-Normalisation Group) k- ϵ
Table 3. Working condition of turbine SGM11 during TS recording.
Time-Series (TS)Active Power (kW)Generator Rotation Speed (rpm)Yaw Position (deg)
TS123031463252
TS223091456244
TS322861444246
TS422791441354
TS522941446265
TS623121453255
TS72308145125
TS8222414319
TS923101458250
TS10233314587
TS112294147329
Table 4. Working conditions of turbines SGM10, SMG11, SMG12 and SMG13 related to the results shown in Figure 14.
Time-Series (TS)Active Power (kW)Generator Rotation Speed (rpm)Yaw Position (deg)Time (hh:mm)
TS12 (SGM10)2313146725420:14
TS13 (SGM10)2303144825420:14
TS14 (SGM11)2321146125020:06
TS15 (SGM11)2310146025020:06
TS16 (SGM12)2326147525020:19
TS17 (SGM12)2295147625020:19
TS18 (SGM13)2307145224320:06
Table 5. Meshing frequencies of the gearbox operating at 1445.8 rpm.
Gear PairMeshing Frequency (Hz)
G1/G2530.13
G3/G4110.96
Planetary22.98

