Article

Moderate Collapse in a Shale Cap of a Nearly Depleted Reservoir

1
College of Petroleum Engineering, Xi’an Shiyou University, Xi’an 710065, China
2
Shaanxi Key Laboratory of Advanced Stimulation Technology for Oil & Gas Reservoirs, Xi’an Shiyou University, Xi’an 710065, China
3
Department of Petroleum and Geosystems Engineering, The University of Texas at Austin, Austin, TX 78712, USA
*
Authors to whom correspondence should be addressed.
Energies 2017, 10(11), 1820; https://doi.org/10.3390/en10111820
Submission received: 29 September 2017 / Revised: 6 November 2017 / Accepted: 8 November 2017 / Published: 9 November 2017

Abstract

:
Reservoir depletion will cause the safe equivalent circulation density (ECD) operating window of drilling fluids to narrow, or even disappear. Previous studies have proposed a set of two specific casings at the top and bottom of the depleted reservoir, respectively, or conducted wellbore strengthening to increase fracture pressure, but these will cause a waste of time and costs, or differential pressure sticking. Aiming at resolving this problem, a novel concept and evaluation method of moderate collapse in the shale cap was developed and case calculations were performed. The results show that the degree of collapse is different for wells drilled in different types of fault regimes, and it can be controlled by optimizing the well trajectory. The collapse pressure within the shale cap was decreased due to reservoir depletion, and when a certain degree of collapse was acceptable, the collapse pressure can be even lower and a safe operating window will appear which can be beneficial to optimizing the casing program and drilling design. The research results provide a theoretical basis and new design idea for successfully and economically drilling into new untapped reservoirs in deeper horizons through depleted zones in the future.

1. Introduction

At present, more than 70% hydrocarbon resources are being obtained from secondary and tertiary recovery [1]. The development of mature oil fields is playing an important role in energy sources and has attracted increasing attention in recent years [2]. Long-term production from hydrocarbon reservoirs can lead to decreases in the pore pressures over the lifetime of the field unless sufficient pressure support is supplemented [3]. For example, the reservoir pressure in the Sirte Basin in Libya was depleted into 2200 psi from an initial 3800 psi after less than 40 years [4]. Oil and gas production was seriously reduced, and accompanying reservoir depletion forced the drilling of new horizontal wells as producers or injectors or drill into new untapped reservoirs in deeper horizons through highly-depleted reservoirs. Hence, successfully and economically drilling through depleted zones becomes significant either in maintaining oil production levels or in reaching new hydrocarbon targets. However, a variety of drilling accidents happen frequently, such as differential pressure sticking, lost circulation, and so on, which seriously restrict the drilling efficiency and successfully reaching untapped reservoirs [5,6,7,8].
In order to overcome this problem, extensive studies have been conducted. These studies showed that a reduction in reservoir pressure will result in a reduction in the stresses acting within the reservoir. In turn, the fracture gradient will be decreased [3,9,10,11,12,13]. Thus, when using the same drilling fluid density as in the early stage of oilfield development, significant lost circulation and sticking problems will be experienced during the drilling process due to the current lower pore pressure and fracture pressure in depleted reservoirs. Hence, new well designs, such as underbalanced drilling (UBD) technology, were implemented which can reduce formation damage and avoid differential sticking and lost circulation due to lower ECD application [4,14,15]. However, due to the higher collapse pressure in the shale cap above the depleted reservoir, a contradiction existed between maintaining the mechanical stability in the overlaying shale cap and controlling fluid losses in the depleted reservoir caused by hydraulic fracturing [16]. Thus, the specific casing should be set above the depleted reservoir to isolate the shale cap. Although the approach can allow a lower ECD application and enable successful drilling, a waste of time and costs will be caused by running the specific casing. In order to avoid the specific casing set and make it allowable that the shale cap and depleted reservoir be in the same open hole, new ideas, such as wellbore strengthening, have come into being which can enhance the fracture gradient in the depleted reservoir to extend the drilling margin [6,17,18,19,20,21,22,]. Although the approach can reduce the risk of lost circulation, the required higher ECD to maintain the mechanical stability in the overlaid shale cap may trigger differential pressure sticking in the depleted reservoir due to its lower pore pressure. By this time, it is hoped that the ECD to be as low as possible. Extensive studies on wellbore stability in shale have been conducted [23,24,25,26,27,28], but conventional collapse pressure in shale, which was usually referred to as ECD design, was often evaluated by assuming the wellbore is completely stable [29,30], and the recommended results were relatively conservative. In fact, some studies have showed that a certain amount of collapse can be acceptable due to the self-stabilization effect during the collapsing process, and a lower ECD than collapse pressure can be used, which may have a number of advantages, such as increasing the drilling rate, reducing formation damage, and so on [31,32]. Based on this, the moderate collapse concept and design method in the shale cap near the depleted reservoir were proposed in this paper so as to extend the allowable drilling margin and provide a reference for drilling design in depleted reservoirs.

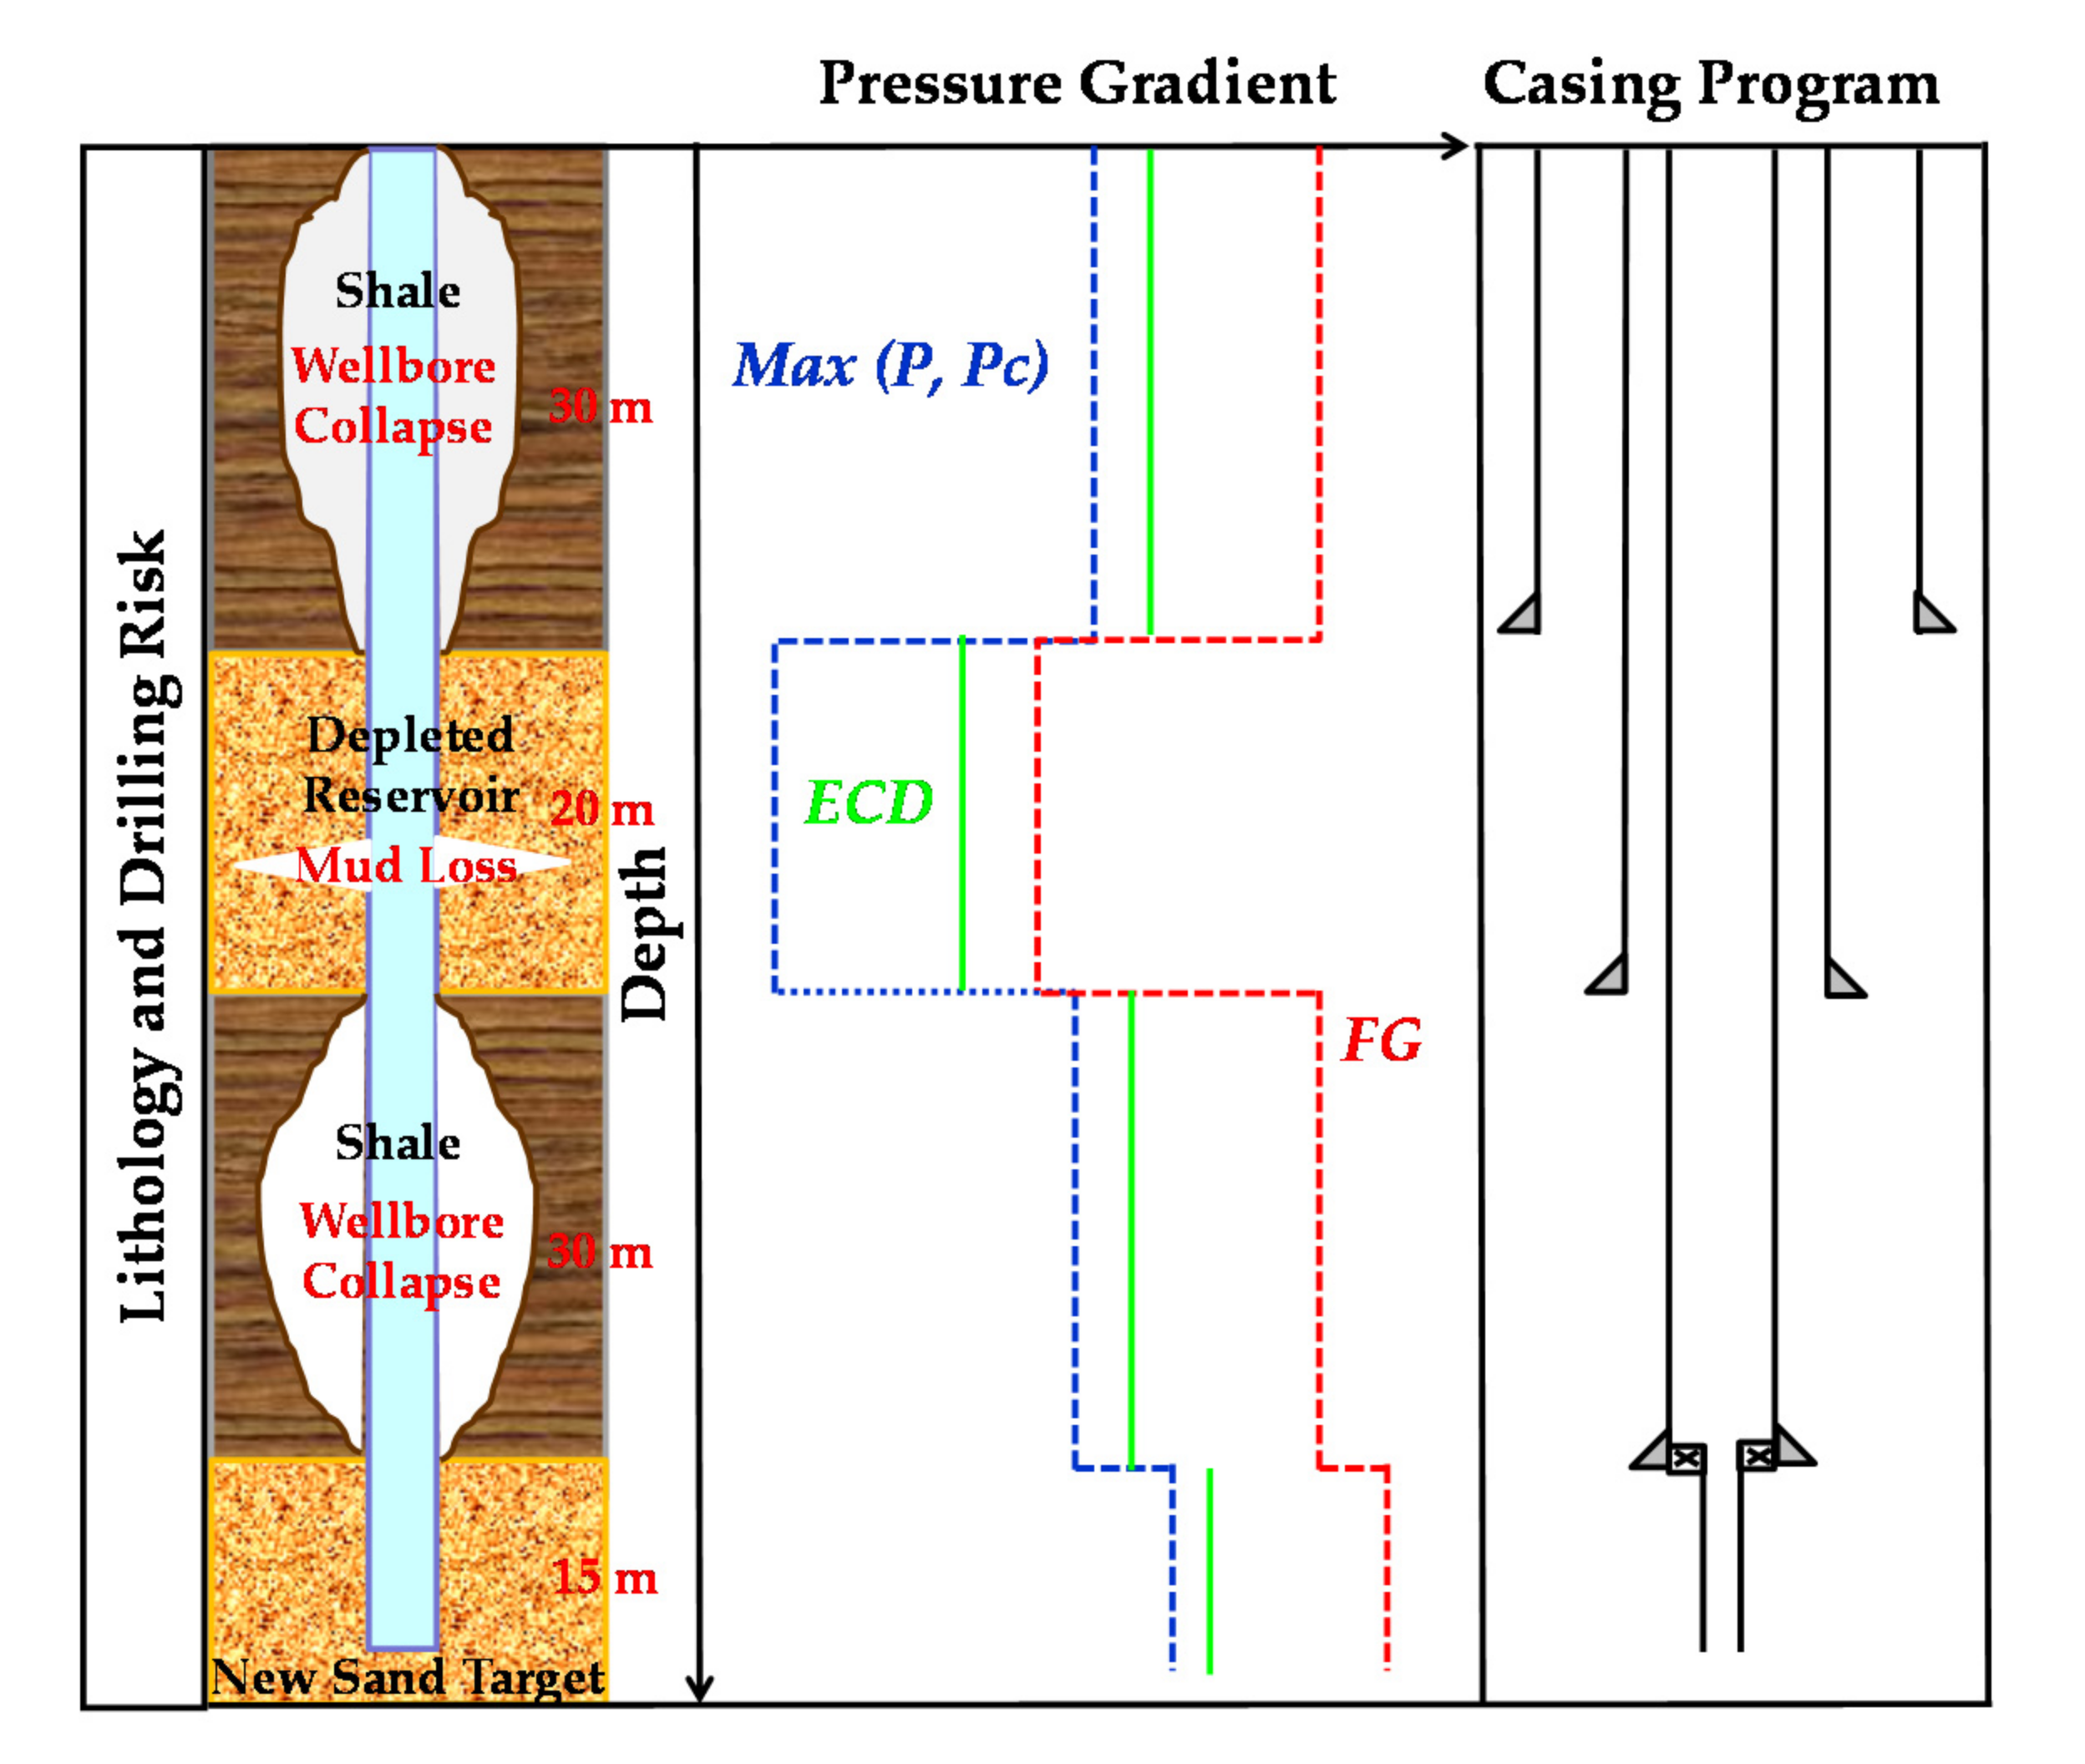
2. Conventional Wellbore Stability Analysis and Design in a Depleted Reservoir

The purpose of wellbore stability analysis is to create a safe operating window of ECD such that the designed ECD will be high enough to avoid wellbore collapse and blowout or low enough to avoid mud loss during the drilling process [33]:
M a x ( P , P c ) < E C D < F G
where, P is the pore pressure gradient (g/cm3); Pc is the collapse pressure gradient, g/cm3; and FG is the fracture gradient (g/cm3).
In a depleted reservoir, pressure depletion will extend over the majority of the reservoir from the near borehole region with time. In turn, a magnitude change of in situ ground stress is caused and, consequently, wellbore stability is significantly altered. The studies showed that the drilling risks of wellbore collapse and blowout will be decreased and mud loss risk will be increased in the depleted reservoir [1,3,6]. Therefore, the fracture gradient in depleted reservoir was the emphasis of research in previous studies.
The fracture gradient (FG) of a particular well consists of two components, which are the fracture initiation gradient (FIG) and the fracture propagation gradient (FPG), respectively [3]. FIG is the well pressure gradient required to initiate a fracture in the wellbore wall, which is the fracture breakdown pressure gradient in a leak-off test (LOT). FPG is the well pressure gradient required to propagate the initiated fracture into the far-field away from borehole, and FPG is commonly equal to the minimum principal in situ stress or fracture closure pressure which can be observed on the decline curve of a leak-off test following the breakdown pressure [3,34]. In the ECD design, FPG is often referred to as the lower bound of the fracture gradient and FIG as the upper bound. According to the Kirsch’s solution, mud circulation loss only occurred after tensile failure was caused in the wellbore, so FIG can be derived through making the minimum tangential stress around the borehole equal to the tensile strength [34,35]. For a vertical well, FIG can be written as:
F I G = ( 3 σ h σ H δ P + T 0 ) × 10 3 g H
where, σ h and σ H are the minimum and maximum principal in situ stress, respectively, MPa; δ is Biot’s coefficient; T 0 is the tensile strength, MPa; g is the gravitational acceleration, g/cm3; and H is the buried depth, m.
By definition, FPG does not include any accommodation for the stress concentration around the borehole and the tensile strength of the rock, so it can be written as follows:
F P G = σ h × 10 3 g H
After reservoir depletion, minimum and maximum principal in situ stress will also be decreased, and the relations between stress changes and pore pressure depletion can be described as follows:
Δ σ h = Δ σ H = δ ( 1 2 ν ) ( 1 ν ) Δ P
where, ν is Poisson’s ratio.
Then, the change of FIG and FPG after reservoir depletion can be derived by inserting Equation (4) into Equations (2) and (3):
{ Δ F I G = δ ( 1 3 ν ) ( 1 ν ) Δ P × 10 3 g H Δ F P G = δ ( 1 2 ν ) ( 1 ν ) Δ P × 10 3 g H
The above equation implies that FPG will be decreased with reservoir depletion, which will increase mud loss risk during the drilling process.
However, FIG will present two opposite variations: (1) when ν < 1 / 3 , FIG was decreased with reservoir depletion, which will increase the risk of hydraulic fracturing; (2) when ν > 1 / 3 , FIP will be increased. Furthermore, the smaller the ν , the reduction of both FPG and FIG will be greater. Therefore, when drilling through hard ( ν is smaller) and highly-depleted reservoirs into a new, untapped reservoir, the following challenge will be confronted: the reduction of FG in the depleted reservoir is greater, and the collapse pressure in the shale above and below the depleted reservoir is higher, so there will no longer be a safe ECD operating window. Aiming at this problem, conventional drilling design would set two specific casings at the top and bottom of the depleted reservoir, respectively, and individual ECD was used in each of the intervals according to the results of wellbore stability analysis (Figure 1). Although the approach can allow lower ECD application and enable drilling successfully, a waste of time and costs will be caused by running the two specific casings. Furthermore, since the casing program was increased, more sizes of drilling bits and pipes, and more types of drilling fluids were needed which may make planning and staging the wells a more significant challenge [36]. Thus, optimizing conventional design methods was imperative.

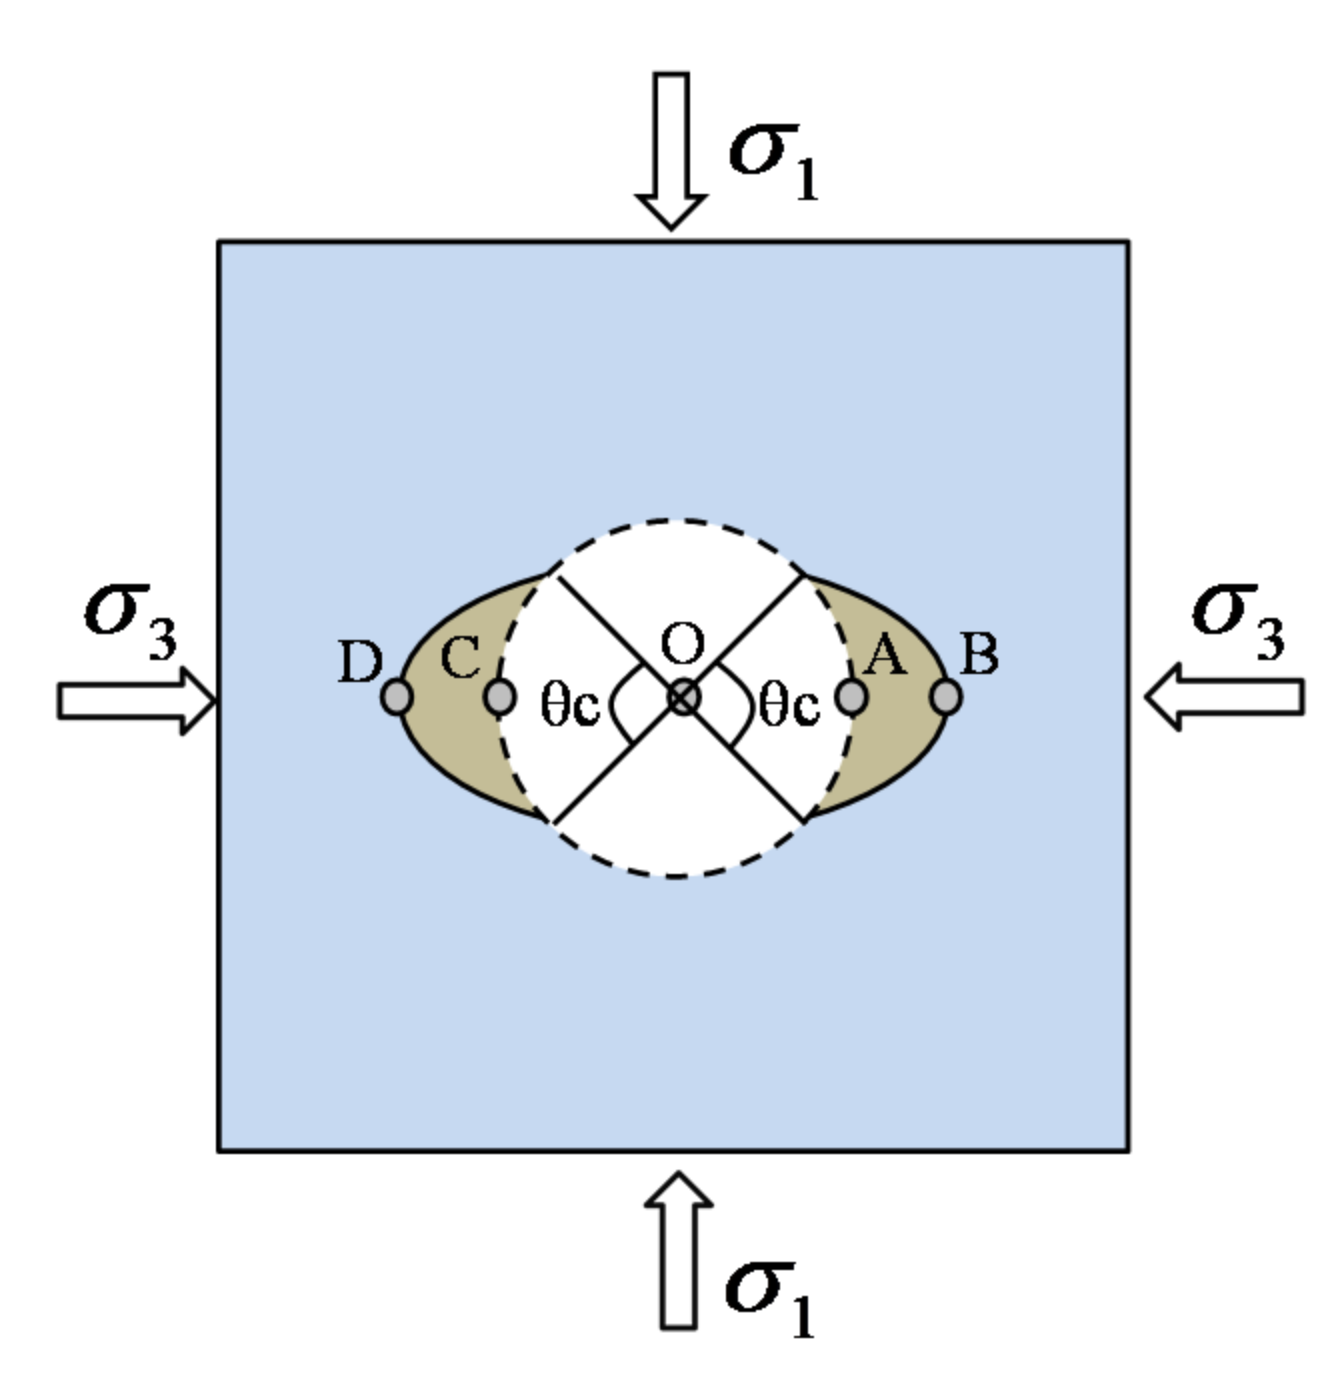
3. Concept for Moderate Collapse and Quantitative Evaluation in the Shale Cap.

The borehole will form a stable elliptical shape after 4–6 collapses (Figure 2). The borehole degree of collapse can be described by the collapse angle ( θ c ) and the borehole diameter enlargement rate ( γ ), where γ can be written as follows:
γ = R O B R O A R O A
where, R O A is the radius of the bit, mm; and R O B is the radius of borehole, mm.
The studies showed that when the borehole degree of collapse was controlled within a reasonable range, no serious drilling accidents will be triggered since the borehole can form a stable elliptic shape, however, when the borehole degree of collapse is outside the scope, there will be an unstable borehole which is unacceptable. Therefore, wellbore stability can be designed under the condition of moderate collapse [31,32]. In general, the case θ c < 90 ° can be acceptable for a vertical well, and for a horizontal well, θ c < 30 ° was acceptable due to the influence of borehole cleaning and other factors, and the value can be determined according to the actual situation. In actual drilling practice, the more common data collected were borehole diameter and bit size, so it is more convenient to describe the borehole degree of collapse with γ ; for example, 5–10% of the borehole degree of collapse can be stipulated as acceptable, and the value can be determined according to the actual situation.
According to the elastic mechanics theory of porous media, the borehole degree of collapse can be quantitatively evaluated. Concentrated stress was induced surrounding the borehole due to stress redistribution after well drilling. Various authors have addressed the method for calculating the concentrated stress state under the effect of in situ ground stress and bottom-hole pressure [37,38]. Many wells being drilled for oil and gas production are either horizontal, highly deviated from vertical, or have complex trajectories, and for an arbitrarily-deviated well, the principal stresses acting in the vicinity of the wellbore wall are generally not aligned with the wellbore axis, so the stress state surrounding an arbitrarily-deviated well should be calculated though coordinate system transformation. The stress components in borehole coordinate system can be given through transforming in situ ground stresses:
{ σ x x = σ H cos 2 α cos 2 β + σ h cos 2 α sin 2 β + σ v sin 2 α σ y y = σ H sin 2 β + σ h cos 2 β σ z z = σ H sin 2 α cos 2 β + σ h sin 2 α sin 2 β + σ v cos 2 α σ x y = σ H cos α cos β sin β + σ h cos α cos β sin β σ x z = σ H cos α sin α cos 2 β + σ h cos α sin α sin 2 β σ v cos α sin α σ y z = σ H sin α cos β sin β + σ h sin α cos β sin β
where, σ v is the vertical principal in situ stress, MPa; α is the well deviation angle; and β is the well azimuth angle relative to the maximum horizontal principal stress orientation.
Assuming the plane strain is normal to the borehole axis, concentrated stress component solutions surrounding an arbitrarily-deviated well in terms of cylindrical polar coordinates can be written as follows:
{ σ r = R 2 r 2 P i + ( σ x x + σ y y ) 2 ( 1 R 2 r 2 ) + ( σ x x σ y y ) 2 ( 1 + 3 R 4 r 4 4 R 2 r 2 ) cos 2 θ + σ x y ( 1 + 3 R 4 r 4 4 R 2 r 2 ) sin 2 θ σ θ = R 2 r 2 P i + ( σ x x + σ y y ) 2 ( 1 + R 2 r 2 ) ( σ x x σ y y ) 2 ( 1 + 3 R 4 r 4 ) cos 2 θ σ x y ( 1 + 3 R 4 r 4 ) sin 2 θ σ z = σ z z μ [ 2 ( σ x x σ y y ) ( R r ) 2 cos 2 θ + 4 σ x y ( R r ) 2 sin 2 θ ] σ r θ = σ x y ( 1 3 R 4 r 4 + 2 R 2 r 2 ) cos 2 θ ( σ x x σ y y ) 2 ( 1 3 R 4 r 4 + 2 R 2 r 2 ) sin 2 θ σ θ z = σ y z ( 1 + R 2 r 2 ) cos θ σ x z ( 1 + R 2 r 2 ) sin θ σ z r = σ x z ( 1 R 2 r 2 ) cos θ + σ y z ( 1 R 2 r 2 ) sin θ
where r represents the distance from the borehole axis, mm; θ represents the azimuth angle relative to the x-axis; and P i is the bottom hole pressure, MPa.
Shear failure will be generated when the Mohr’s circle constituted by the maximum and minimum effective principal stress on the wellbore wall exceeds the shear strength; at this time, borehole collapse occurs. Generally, the Mohr–Coulomb strength criterion is selected to describe the shear failure as follows [39,40,41]:
( σ 1 δ P ) = ( σ 3 δ P ) tan 2 ( 45 + ϕ 2 ) + 2 C tan ( 45 + ϕ 2 )
where σ 1 and σ 3 represent maximum and minimum principal stresses, respectively, MPa; C represent cohesive strength, MPa; and ϕ represents the internal friction angle.
It is known by the Mohr–Coulomb failure criterion that shear failure in the borehole wall occurs firstly in the location where the stress difference between the maximum and minimum principal stresses is maximal. Therefore, shear failure will occur firstly at points A and C in Figure 2. Furthermore, the direction of the major axis of the borehole ellipse is consistent with that of the line OA, so the location of points B and D with the largest borehole diameter have the same polar angle with points A and C.
Putting r = R into Equation (8), the stress components on the borehole wall can be derived as follows:
{ σ r = P i σ θ = A σ h + B σ H + C σ v P i σ z = D σ h + E σ H + F σ v σ θ z = G σ h + H σ H + J σ v σ r θ = σ r z = 0
where
{ A = cos α [ cos α ( 1 2 cos 2 θ ) sin 2 β + 2 sin 2 β sin 2 θ ] + ( 1 + 2 cos 2 θ ) cos 2 β B = cos α [ cos α ( 1 2 cos 2 θ ) cos 2 β 2 sin 2 β sin 2 θ ] + ( 1 + 2 cos 2 θ ) sin 2 β C = ( 1 2 cos 2 θ ) sin 2 α D = sin 2 β sin 2 α + 2 μ sin 2 β cos α sin 2 θ + 2 μ cos 2 θ ( cos 2 β sin 2 β cos 2 α ) E = cos 2 β sin 2 α 2 μ sin 2 β cos α sin 2 θ + 2 μ cos 2 θ ( sin 2 β cos 2 β cos 2 α ) F = cos 2 α 2 μ sin 2 α cos 2 θ G = ( sin 2 β sin α cos θ + sin 2 β sin 2 α sin θ ) H = sin 2 β sin α cos θ cos 2 β sin 2 α sin θ J = sin 2 α sin θ
Since the values of σ r are the same in all locations on the borehole wall, the principal stress difference is maximal when σ θ is maximal. At this point, the corresponding polar angle on the borehole wall is that of the major axis of the borehole ellipse:
θ O B = θ ( max ( σ θ ) )
Equation (8) indicates that none of the normal stress components including σ θ , σ r , σ z , at a point away from the deviated well wall is the principal stress; the principal stresses should be calculated by solving the three roots of the characteristic equation:
σ n 3 I 1 σ n 2 + I 2 σ n I 3 = 0
where
I 1 = σ r + σ θ + σ z I 2 = σ r σ θ + σ θ σ z + σ z σ r τ r θ 2 τ θ z 2 τ z r 2 I 3 = | σ r τ r θ τ r z τ θ r σ θ τ θ z τ z r τ z θ σ z |
The cubic characteristic equation has three solutions: they are the three principal stresses, respectively, and are denoted as σ 1 , σ 2 , σ 3 from large to small values. The largest borehole diameter is located at points B and D in Figure 2, and the two points should be in a critical state of failure and stability, so the stress state should satisfy the shear failure criterion, and then the diameter enlargement rate for the arbitrary well can be derived by inserting solutions σ 1 and σ 3 into Equation (9). In return, the needed ECD to maintain moderate borehole collapse can also be derived.
The analyses showed that borehole degree of collapse mainly depends on formation parameters (including in situ stress, pore pressure and rock strength) and drilling parameters (including ECD and borehole geometry). The stress parameters within the shale cap will be changed after reservoir depletion, which can influence the valuation of moderate collapse.
Fluids will flow into the adjoining shale cap under the gradually increasing pressure differences driven between the depleted reservoir pressure and the cap pressure. Although the permeability of the shale cap is generally very low, pore fluid can drain over time into the depleted reservoir due to large pressure differences, and the pore pressure decline in the shale cap can be approximately evaluated by a crude diffusivity equation [42]:
2 P z 2 = ϕ μ c c 1 k P t
Initial conditions are given as follows, assuming a linear depletion in the reservoir pressure with time:
P = P o f o r 0 < z < , t = 0
P | z = 0 = P o ( P o P r ) t t c f o r z = 0 , t > 0
Then, pore pressure depletion at any time tc in the shale cap can be derived via solving Equations (15)–(17) comprehensively as follows:
P 1 = P o ( P o P r ) [ ( 1 + z 2 2 λ t c ) e r f c ( z 2 λ t c ) z π λ t c e z 2 4 λ t c ]
where P 1 and P o are the current and original pore pressures in the shale cap, respectively, psi; P r is the depleted reservoir pressure, psi; z is the vertical distance from shale cap to the reservoir/cap interface, ft; λ = ( c 1 k ) / ( f μ c ) ; c is the fluid plus pore compressibility, 1/psi; c 1 is the unit conversion contrast; k is the shale permeability, md; μ is the fluid viscosity, cp; and f is the shale porosity.
After pressure depletion in the shale cap, minimum and maximum principal in situ stress will be also decreased, and the current minimum and maximum principal in situ stress can be derived by inserting Equation (18) into Equation (4):
{ σ h 1 = σ h δ ( 1 2 ν ) ( 1 v ) { ( P o P r ) [ ( 1 + z 2 2 λ t c ) e r f c ( z 2 λ t c ) z π λ t c e z 2 4 λ t c ] } σ H 1 = σ H δ ( 1 2 ν ) ( 1 v ) { ( P o P r ) [ ( 1 + z 2 2 λ t c ) e r f c ( z 2 λ t c ) z π λ t c e z 2 4 λ t c ] }
Moderate collapse in shale cap can be quantitative evaluated by inserting the current pore pressure and in situ principal stress into the above evaluation method.

4. Discussion and New Design Idea

The above studies suggested that the borehole degree of collapse in the shale cap depends not only on the depletion degree, but also other factors, such as the mechanical parameters of the shale and borehole geometry. Based on this, the borehole stability in the shale cap near the depleted reservoir and the moderate collapse were analysed in depth later by case calculation. The fundamental parameters were selected for the calculations as follows:
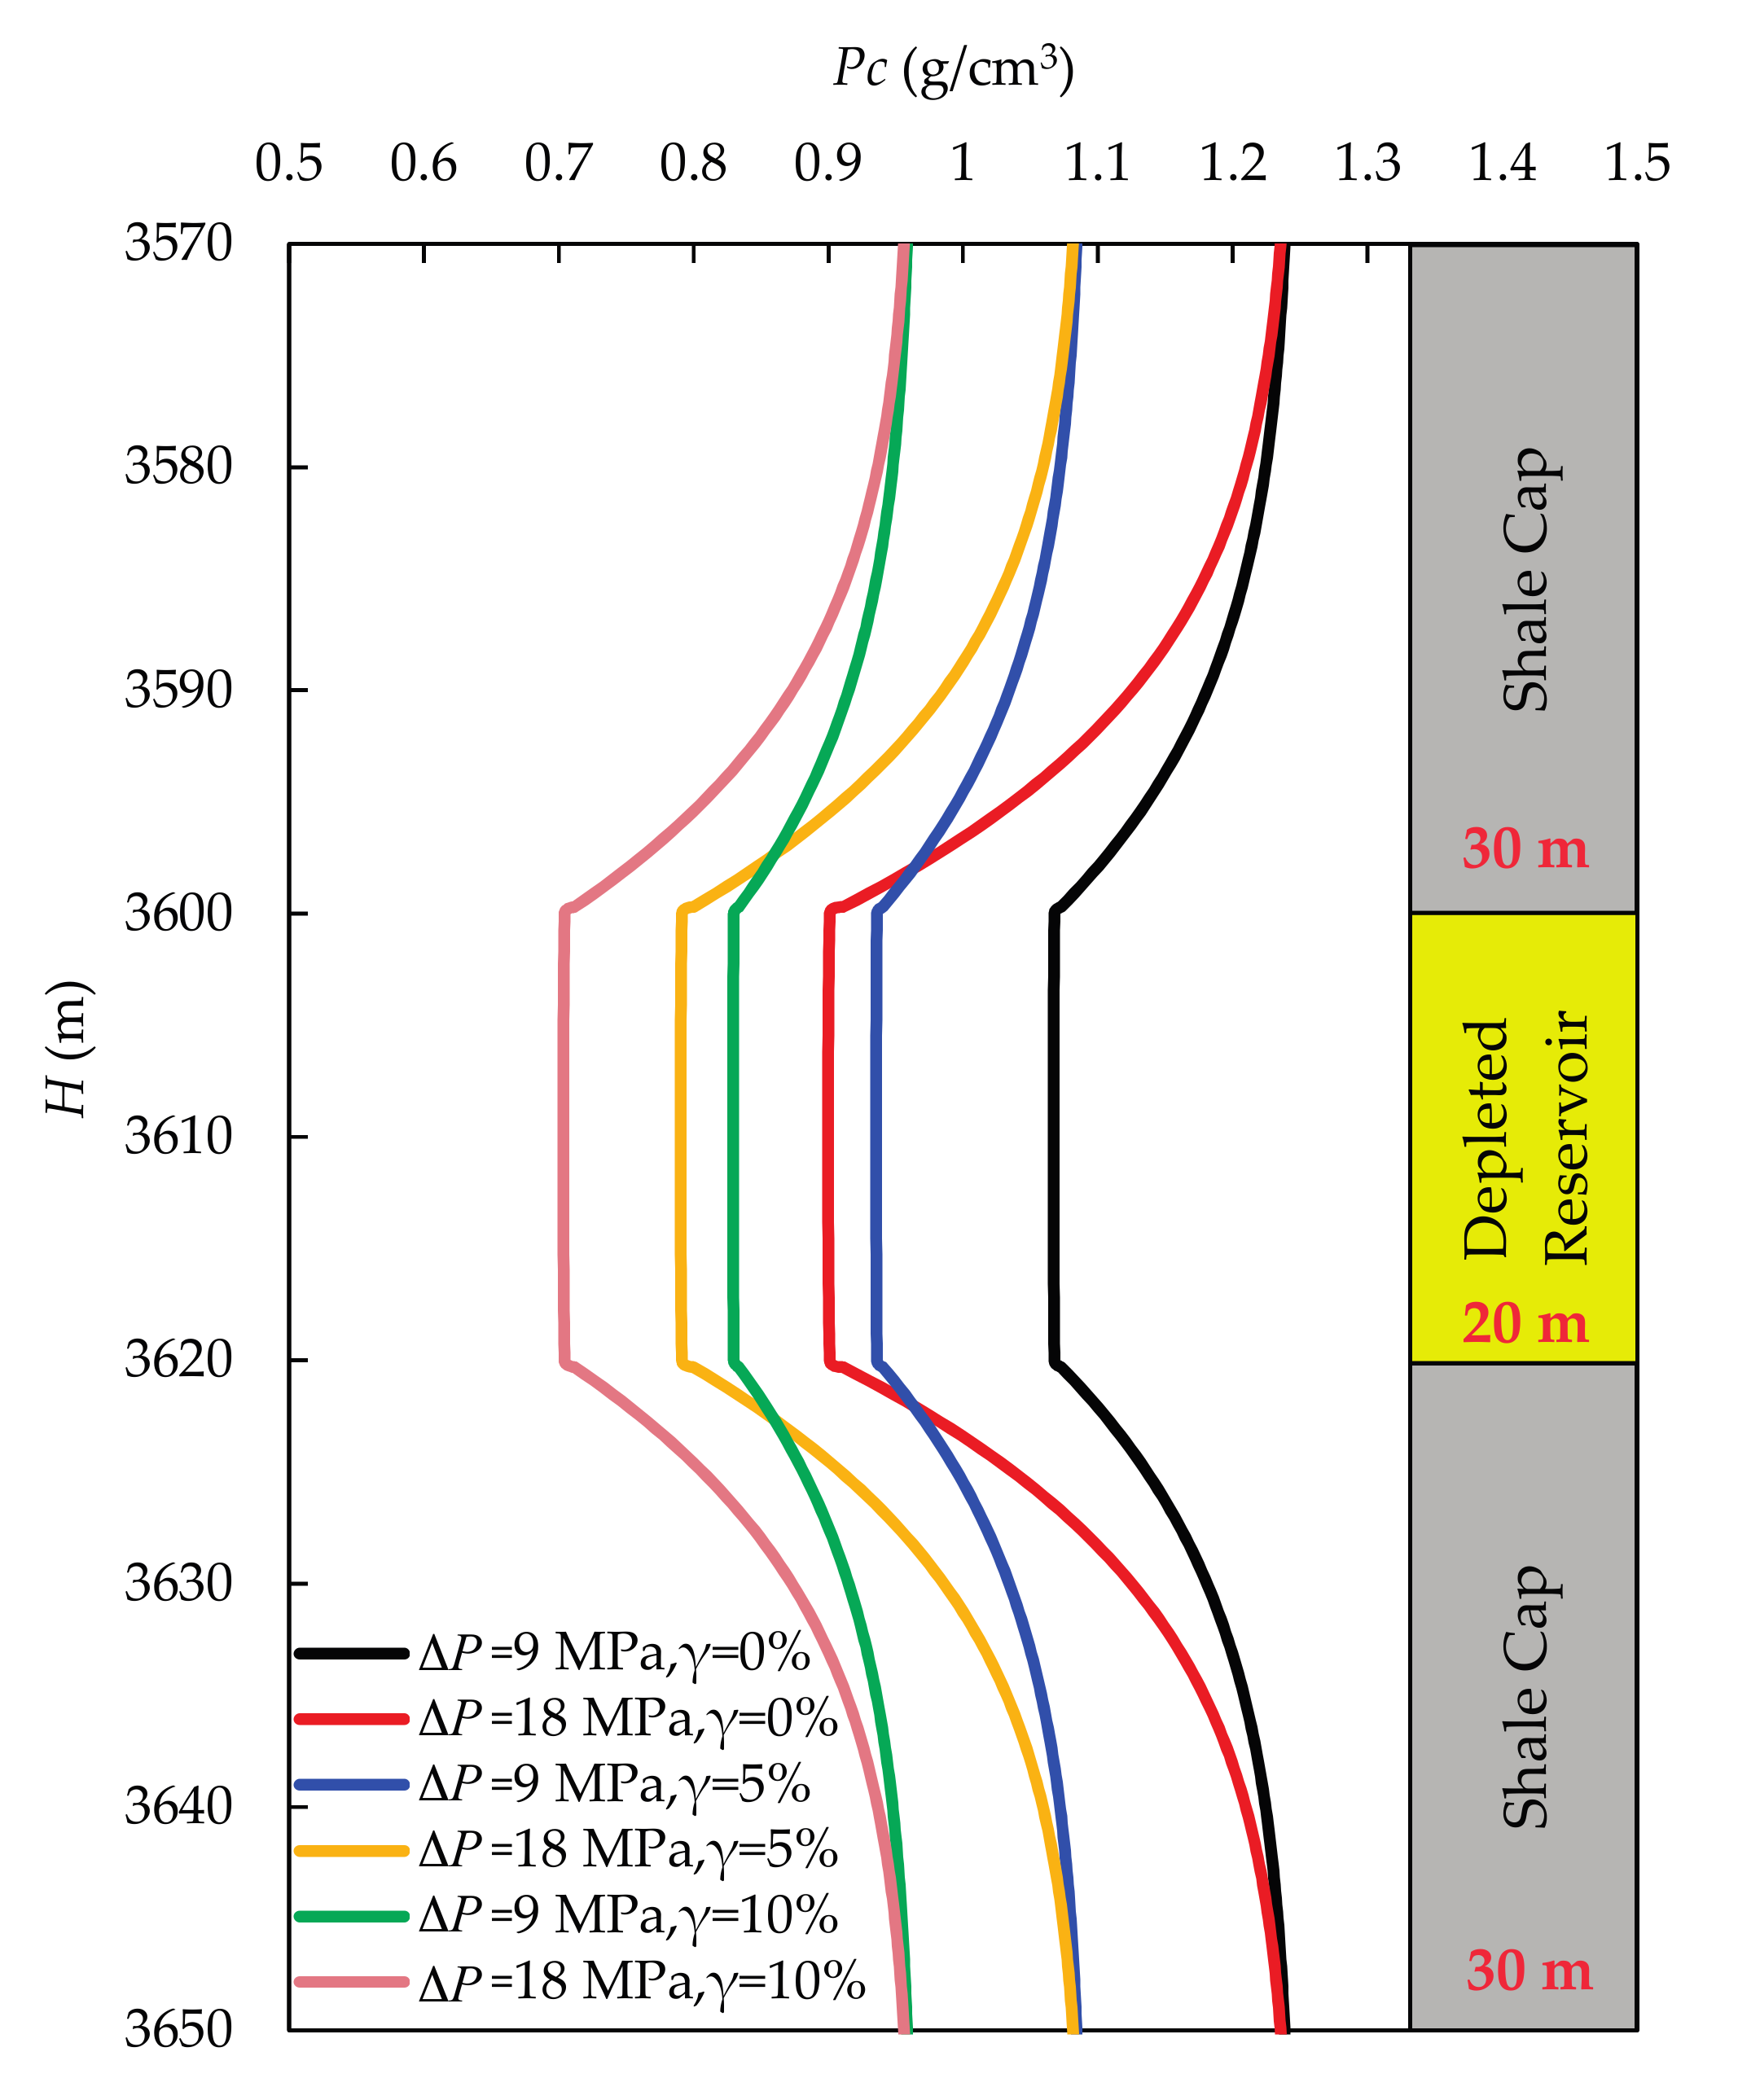
  • Initial reservoir pressure: 36 MPa; Buried depth: 3600~3620 m.
  • Elastic and strength parameters in the shale cap: Poisson’s ratio = 0.25; Biot’s coefficient = 0.8; cohesive strength = 5 MPa; internal friction angle = 30°.
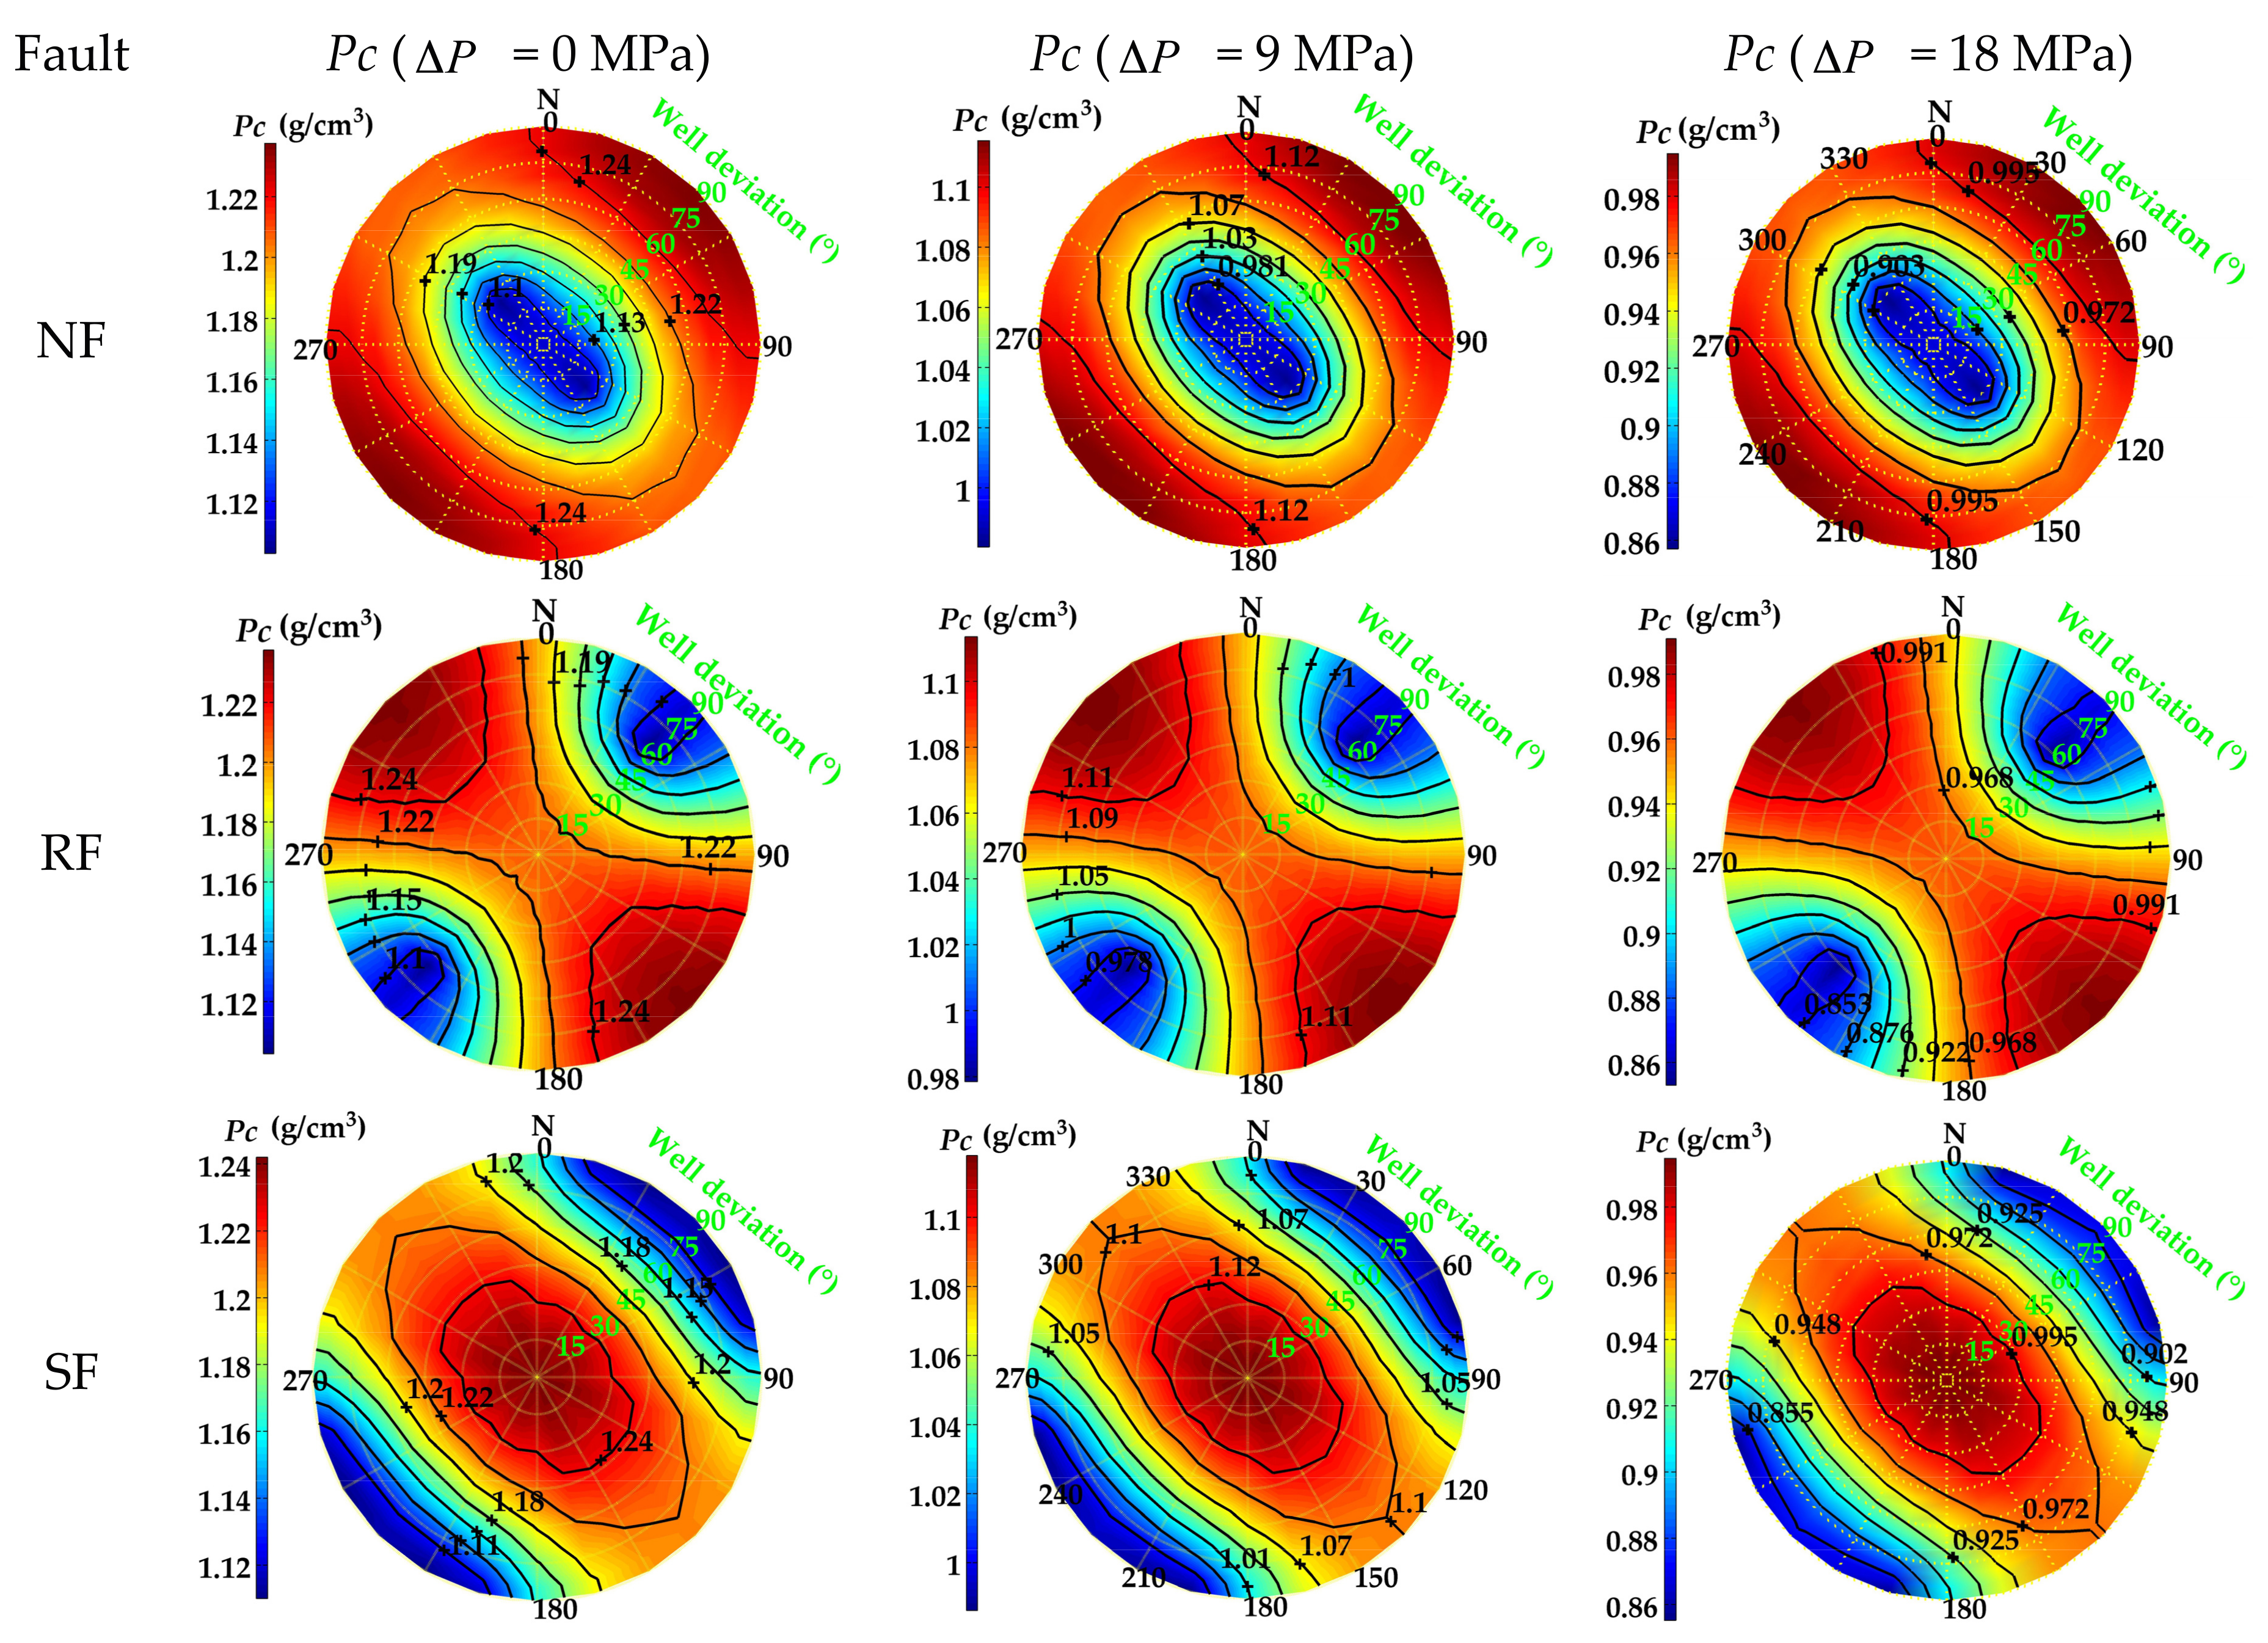
  • According to the Anderson fault classification, the stress state in different types of faults can be given as (1) normal fault (NF): σ H = 65 MPa, σ h = 55 MPa, σ V = 76 MPa; (2) reverse fault (RF): σ H = 76 MPa, σ h = 65 MPa, σ V = 55 MPa; and (3) strike-slip fault (SF): σ H = 76 MPa, σ h = 55 MPa, σ V = 65 MPa. Maximum principal in situ stress azimuth: N45° E.

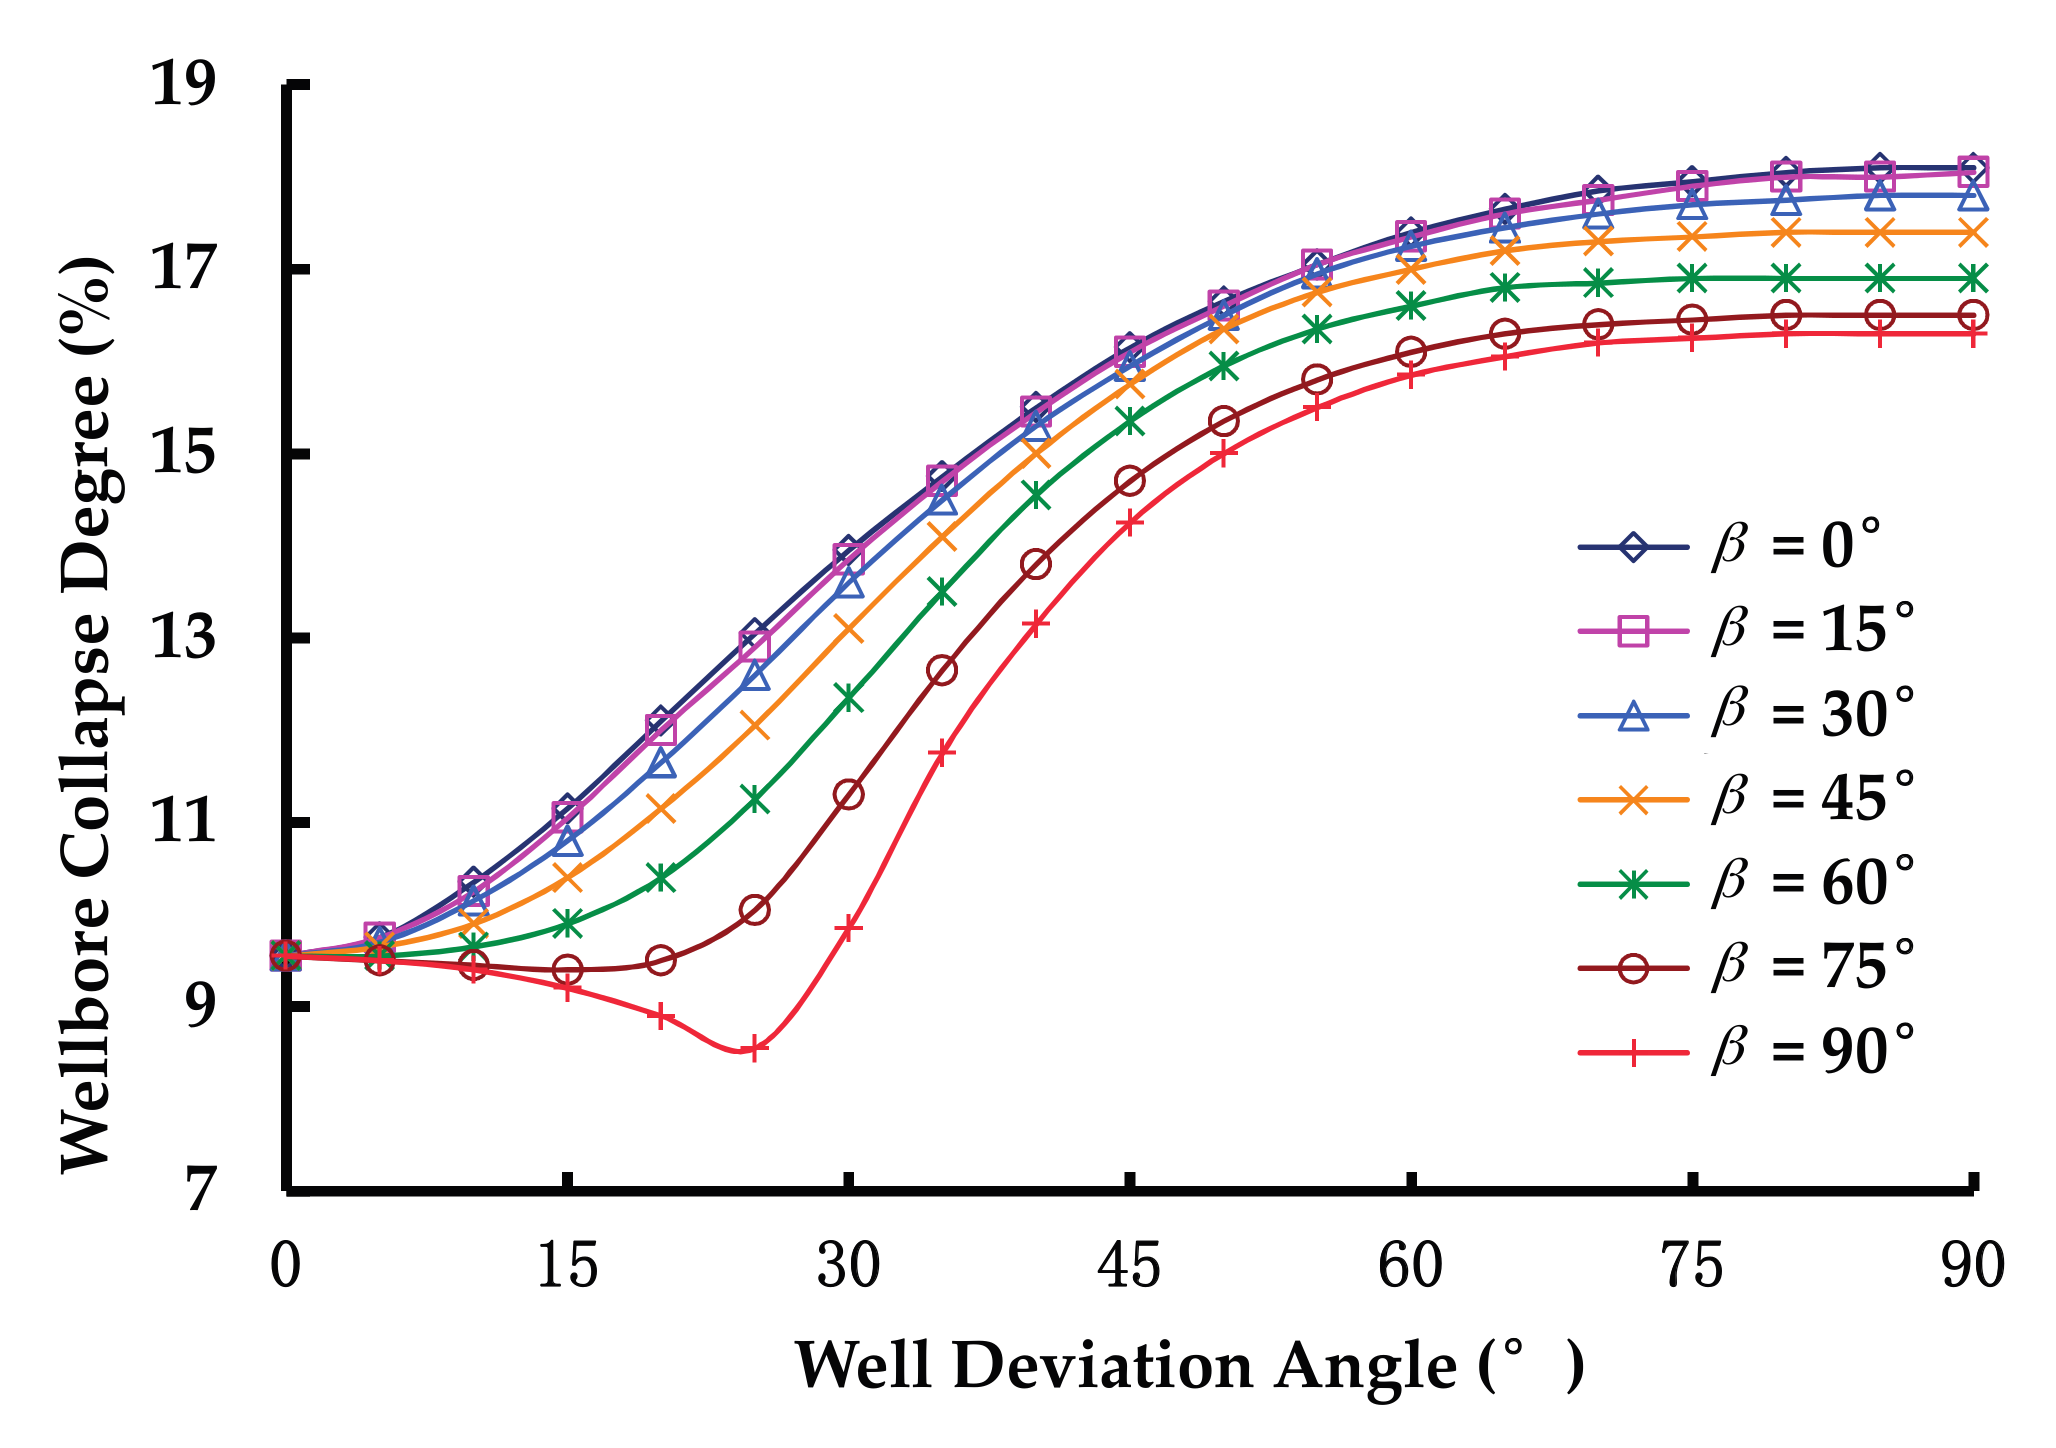
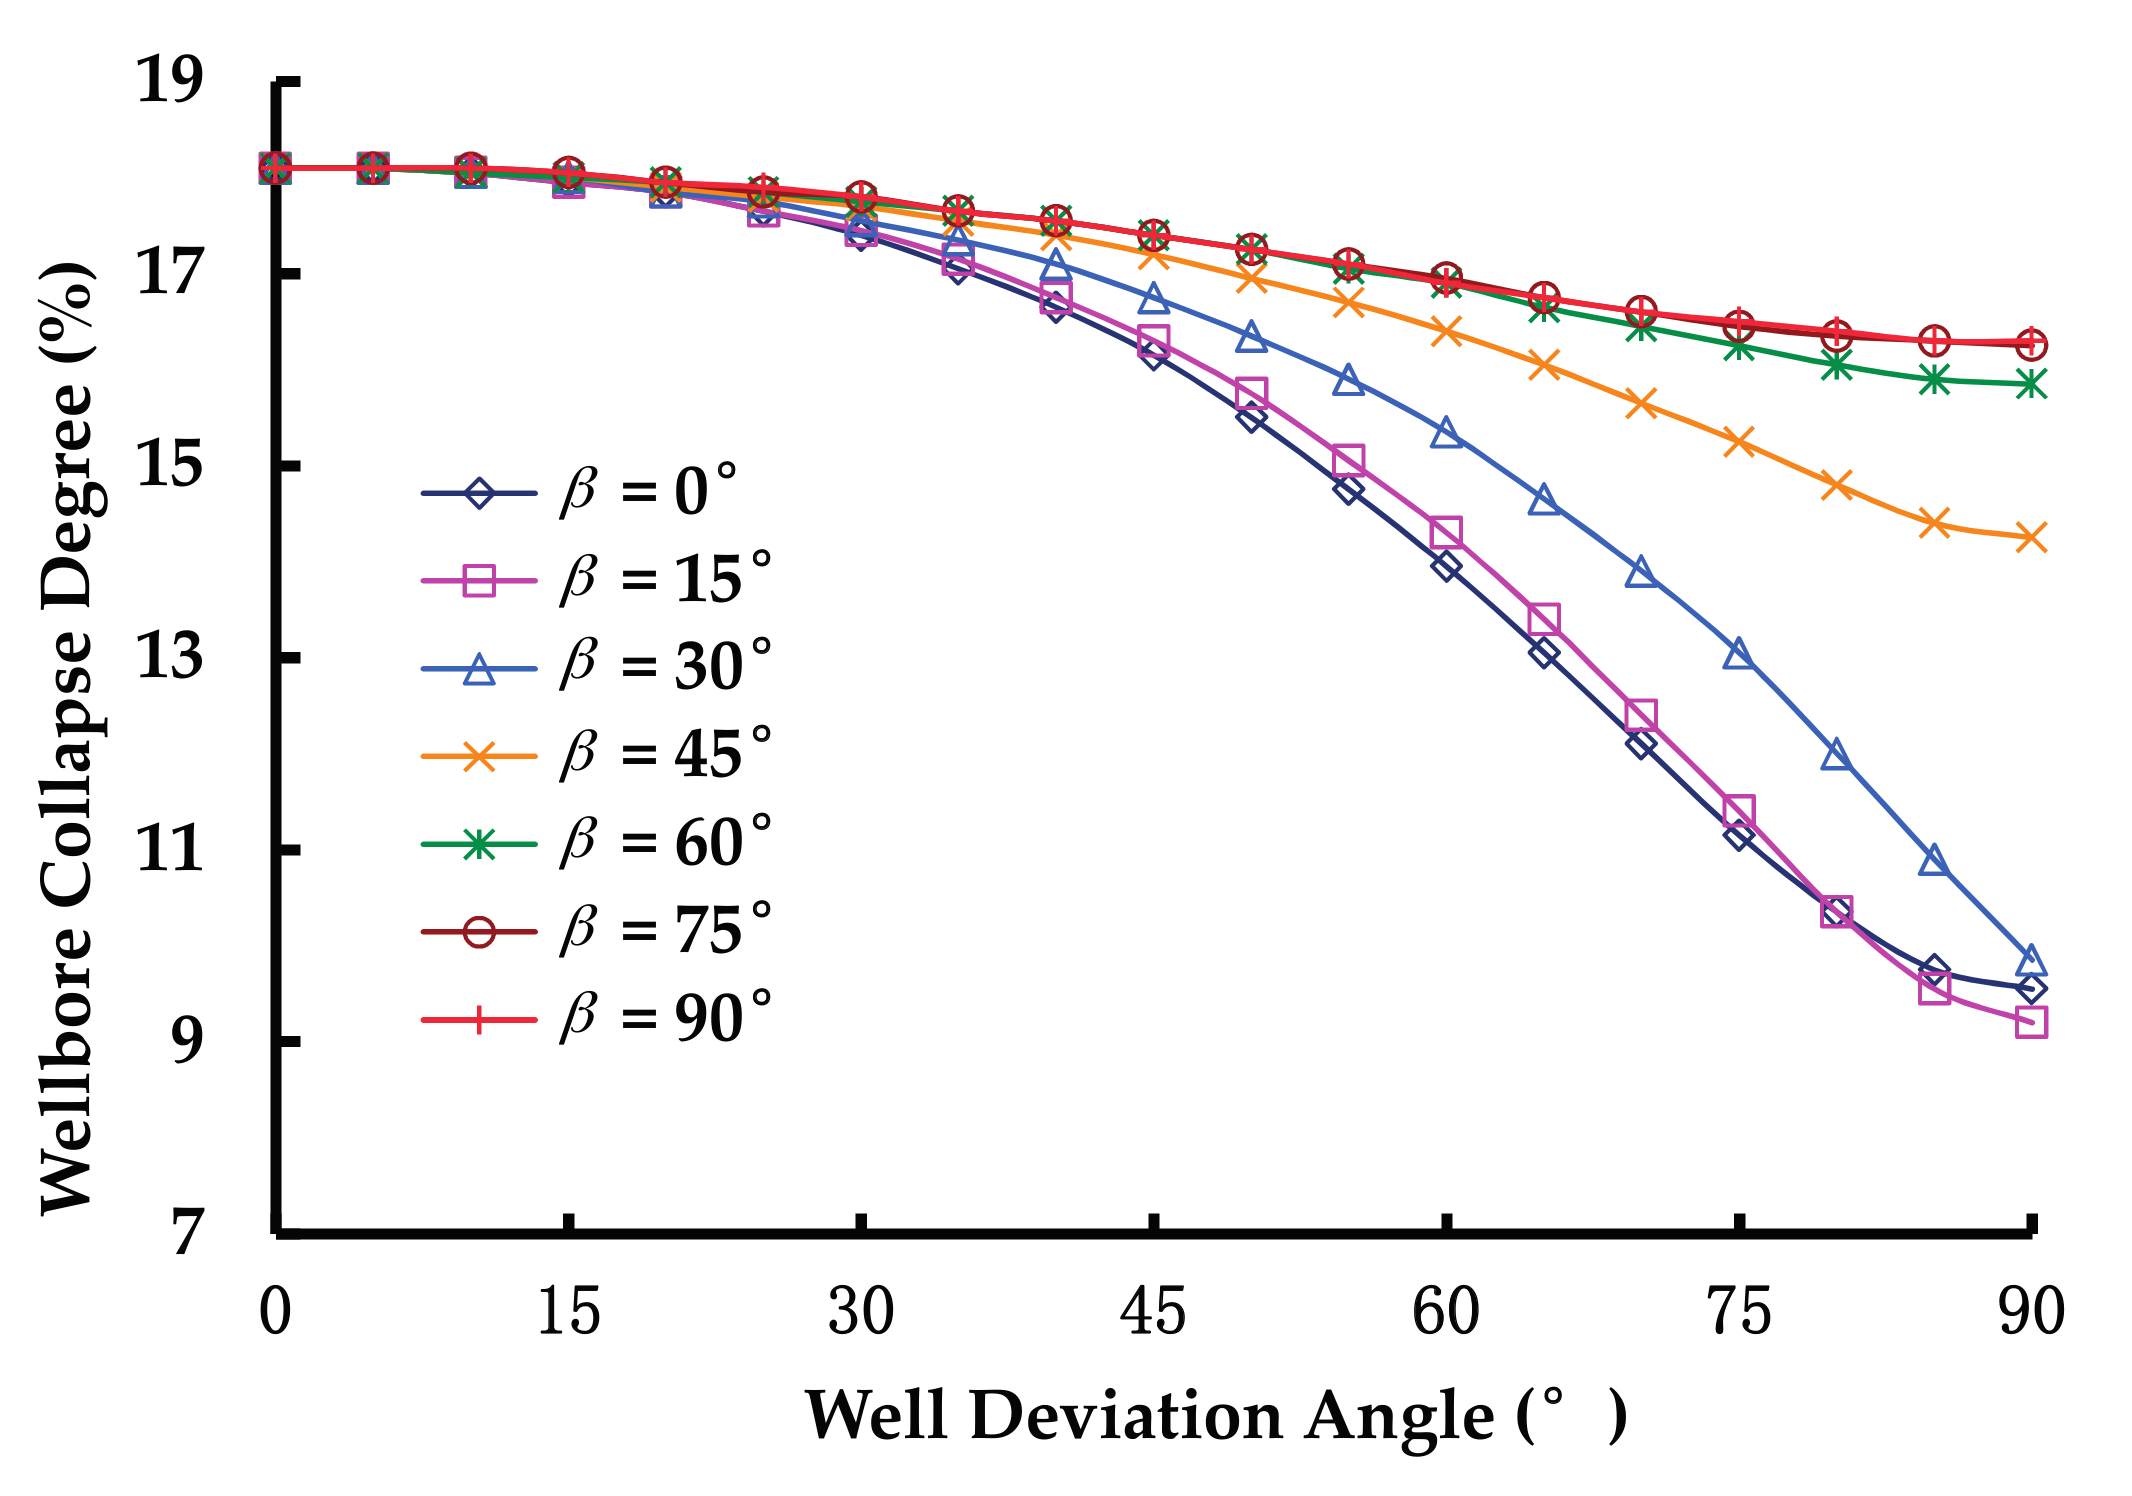
4.1. Wellbore Degree of Collapse Evaluation

The degree of collapse of the wellbore drilled in different types of fault regimes if ECD is equal to 1.10 g/cm3 were evaluated, as shown in Figure 3, Figure 4 and Figure 5.

4.1.1. Normal Fault Regimes

The results present that the degree of collapse showed two types of trends when the well deviation angle increased: When β < 90°, the degree of collapse will increase when the well deviation angle increases, but when β > 60°, the degree of collapse will decrease firstly, and then increase, and the well deviation angle corresponding to the inflection point is about 30°. When the well is drilled with the same deviation angles, the degree of collapse is lower if the well is drilled away from the orientation of the maximum horizontal principal stress.

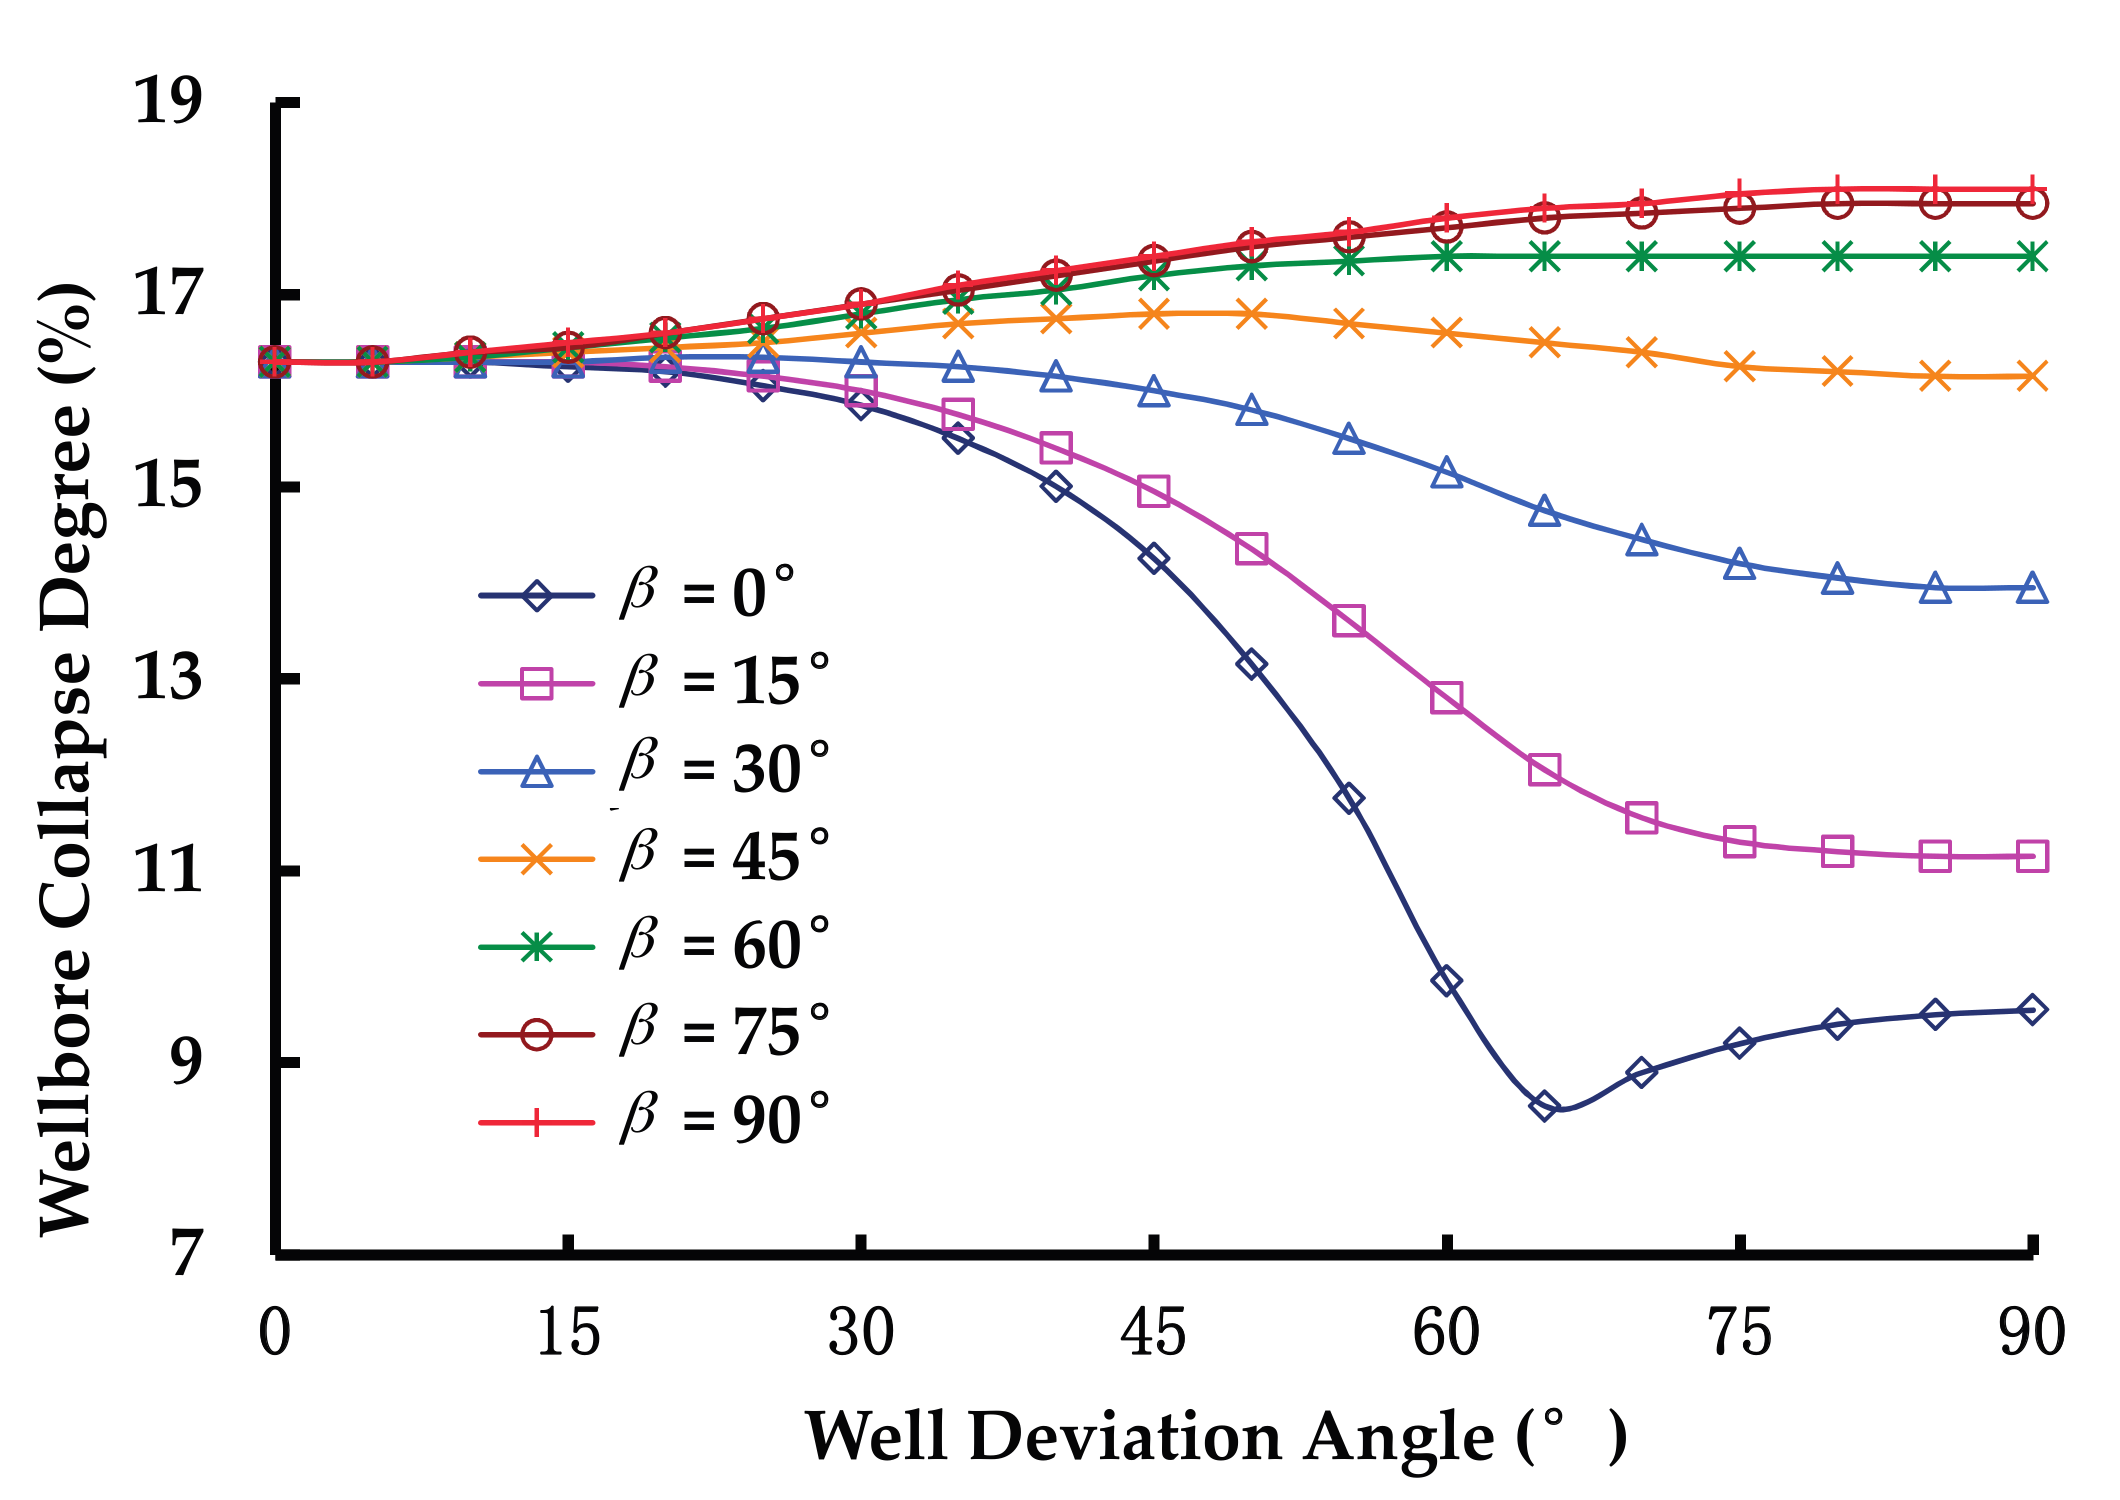
4.1.2. Reverse Fault Regimes

The results indicates that the degree of collapse showed two types of trends when well deviation angle increase: when β > 45°, the degree of collapse will increase when the well deviation angle increases, but when β < 45°, the degree of collapse will decrease, and the degree of collapse of the vertical well is higher than that of the horizontal well. When the well is drilled with the same deviation angles, the degree of collapse is lower if the well is drilled close to the orientation of the maximum horizontal principal stress.

4.1.3. Strike-Slip Fault Regimes

The results show that the degree of collapse will decrease for an arbitrary azimuth of the well when the well deviation angle increases, but the trend is more obvious when the well is drilled close to the orientation of the maximum horizontal principal stress, and the degree of collapse of horizontal wells is lower when β < 30°.

4.2. Collapse Pressure Gradient under Moderate Collapse Condition

If a 10% wellbore degree of collapse is acceptable, the collapse pressure gradient under the moderate collapse condition in different stages of reservoir depletion can be calculated using the above methods and the results are shown in Figure 6, in which the polar angle represents the well azimuth and the polar radius represents the well deviation angle. The results indicate that for all the wells drilled in different types of fault regimes, the collapse pressure gradient will be gradually decreased with the reservoir depletion, and when 50% reservoir pressure is depleted, the collapse pressure gradient will be decreased by about 20%. When the wells are drilled in different types of fault regimes, the safest well trajectory (the blue areas in Figure 6) will make a difference: (1) in the normal fault regime, the wells towards the horizontal minimum stress orientation with a deviation angle of less than 30° are safest due to the collapse pressure gradient being the lowest; (2) in the reverse fault regime, the wells towards the horizontal maximum stress orientation with a deviation angle of more than 60° are safest; and (3) in the strike-slip fault regime, the wells towards N5° E–N85° E with a deviation angle of more than 75° are the safest.

4.3. Collapse Pressure Gradient in the Shale Cap at Different Locations away from the Depleted Reservoir

Collapse pressure gradients in the shale cap at different locations away from the depleted reservoir are shown in Figure 7.
The results present that when the reservoir pressure is depleted, the collapse pressure gradient in the shale cap will decrease, the influence range is about 30 m near the depleted reservoir, and the reduction of the collapse pressure gradient is greater for the shale cap closer to depleted reservoir.
The collapse pressure gradients could be lower if the wellbore collapse is controlled within an acceptable degree, and if 10% wellbore degree of collapse is acceptable, the collapse pressure gradient can be decreased by 20%.

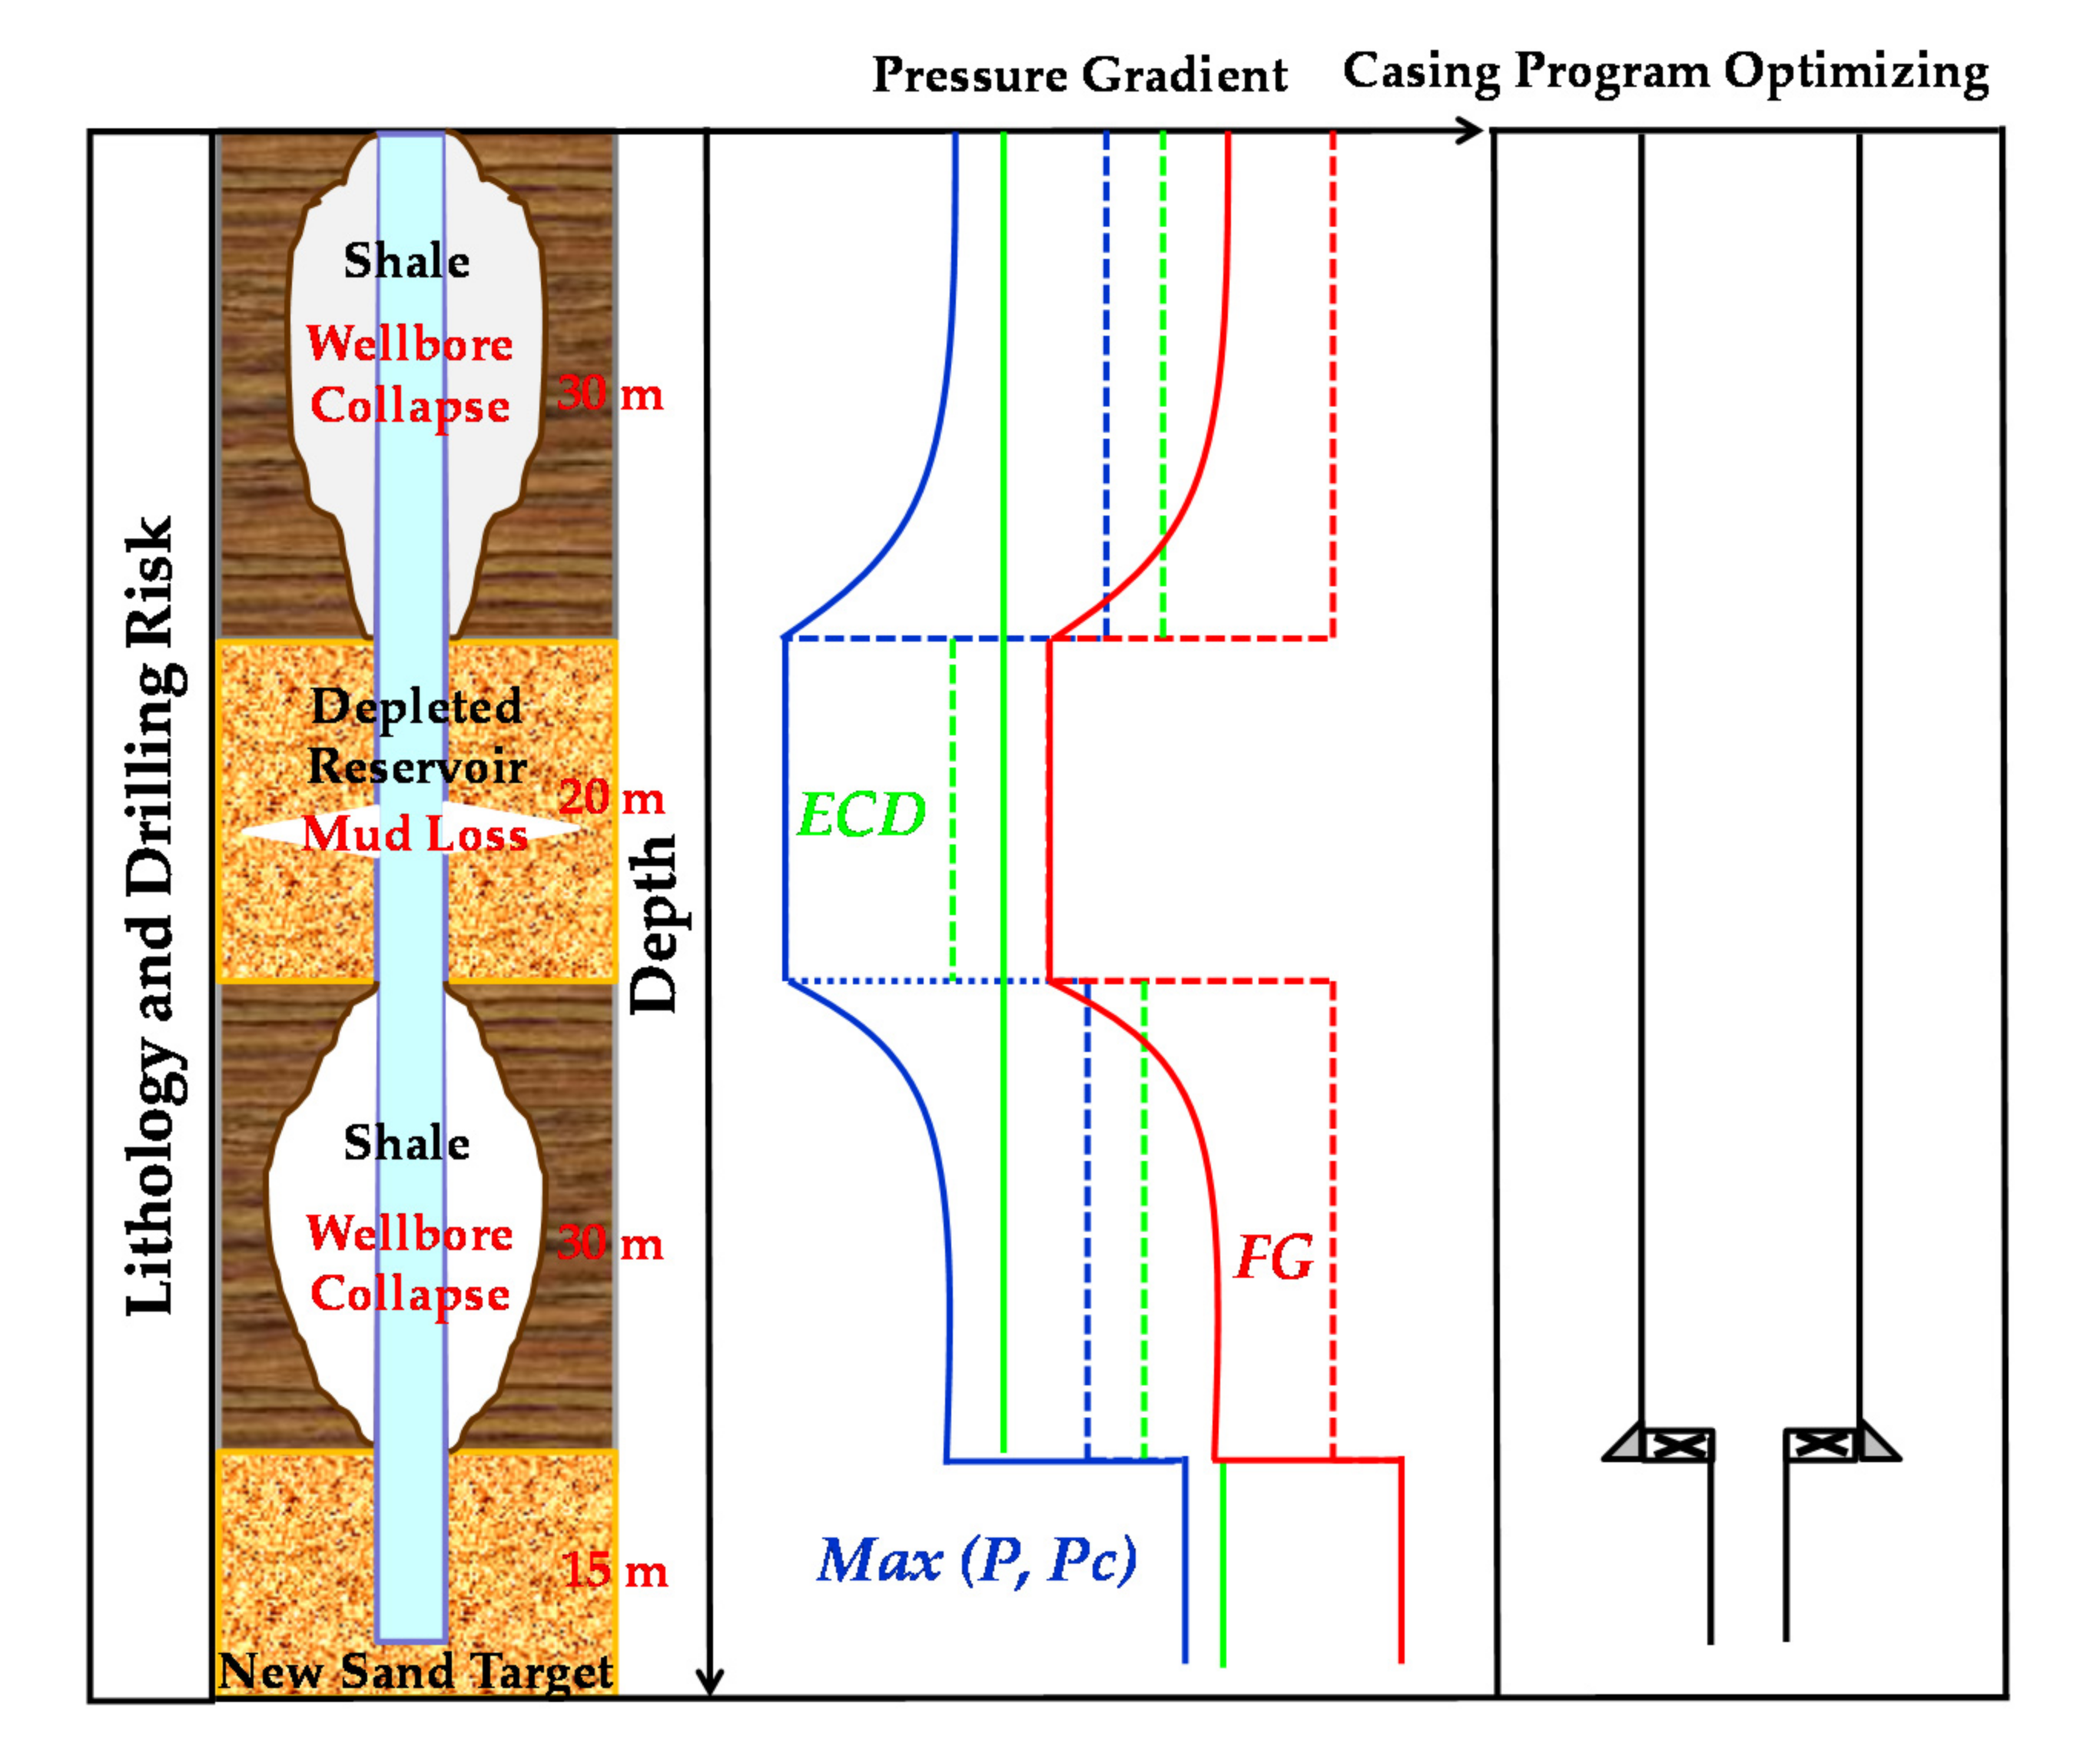
4.4. New Wellbore Stability Evaluation and Drilling Design Optimization

The collapse pressure gradients could be lower under a moderate collapse condition. Hence, a certain degree of collapse was designed into the shale cap with a higher initial collapse pressure gradient when drilling through the depleted reservoir into the new targets. Then the corresponding pressure gradients were evaluated and the casing program was optimized, which are shown in Figure 8. Compared with the original results, the new results of the wellbore stability evaluation are relatively radical where the collapse pressure in the shale cap was lower. Under this condition, the fracture gradient in the depleted reservoir is greater than the collapse pressure gradient in the shale cap near the depleted reservoir, thus, there will be a safe ECD operating windowf. As a result, the depleted reservoir and shale cap can be allowed in the same open hole, the two specific casings in Figure 1 set at the top and bottom of the depleted reservoir respectively can be omitted as shown in Figure 8, which will significantly reduce the waste of time and costs caused by running the two specific casings, and fewer sizes of drilling bits and pipes, and fewer types of drilling fluids can be applied.

5. Conclusions

Production from hydrocarbon reservoirs can lead to a decrease in pore pressure unless pressure support is provided from a gas cap or an aquifer. Hence, a multi-pressure system was developed where the lower pressure zones are prone to mud loss in depleted reservoir, and the higher pressure zones prone to wellbore collapse in the shale cap above and below the depleted reservoir. The valuation on wellbore stability is the key of safe drilling, which is the basis of drilling design. The previous evaluation on wellbore stability is relatively conservative under the assumptions that wellbore should be completely stable and there is no pressure transmission between the shale cap and the depleted reservoir. However, the existing research results showed that a certain degree of wellbore collapse was acceptable due to its self-stabilization effect during the collapsing process. Furthermore, pore pressure also declined in the shale cap above and below the depleted reservoir. Combining the two findings, a novel concept and quantitative evaluation methods of moderate collapse in shale cap was developed, and case calculations were performed. The results indicated that the degree of collapse is different for the wells drilled in different types of fault regimes, and it can be controlled by optimizing the well trajectory. In the normal fault regime, the degree of collapse is lowest when the wells are drilled towards e σ h with a small deviation angle; in reverse and strike-slip fault regimes, the degree of collapse is lowest when the wells are drilled towards σ H with a high deviation angle. Furthermore, the decreasing of the fracture pressure caused by reservoir depletion will cause a safe ECD operating window to disappear when the fracture pressure in the depleted reservoir is lower than the collapse pressure in the shale cap, but if the effect of pressure transmission was considered, the collapse pressure within the shale cap was also decreased and the influence range is about 30 m near the depleted reservoir. When a certain degree of collapse was acceptable, the collapse pressure can be even lower and a safe operating window of ECD appeared which can optimize the casing program and drilling design. The new concept and evaluation methods of moderate collapse can provide a theoretical basis and a new design idea for future drilling operations in old oilfields.

Acknowledgments

The authors gratefully acknowledge the support of National Natural Science Foundation of China (Grant No. 51604225 and Grant No. 51604224).

Author Contributions

K.Z. and Y.F. conceived the concept; K.Z. and Y.F. established the evaluation method; K.Z. and Y.F. performed the calculation and design; J.H. and L.D. analyzed the data; K.Z. wrote the paper.

Conflicts of Interest

The authors declare no conflict of interest.

References

  1. Meng, F.; Fuh, G.F. Reservoir Depletion Effect on In-Situ Stresses and Mud Weight Selection. In Proceedings of the 44th U.S. Rock Mechanics Symposium and 5th U.S.-Canada Rock Mechanics Symposium, Salt Lake City, UT, USA, 27–30 June 2010. [Google Scholar]
  2. Hu, W.R. Necessity and feasibility of PetroChina mature field redevelopment. Pet. Explor. Dev. 2008, 35, 1–5. [Google Scholar] [CrossRef]
  3. Addis, M.A. Reservoir depletion and its effect on wellbore stability evaluation. Int. J. Rock Mech. Min. Sci. 1997, 34, 1–17. [Google Scholar] [CrossRef]
  4. Qiu, K.B.; Gherryo, Y.; Tan, C.P.; Marsden, R. Underbalanced Drilling of a Horizontal Well in Depleted Reservoir: A Wellbore Stability Perspective. SPE Drill. Complet. 2008, 23, 159–167. [Google Scholar] [CrossRef]
  5. Reid, P.; Santos, H. Novel Drilling, Completion and Workover Fluids for Depleted Zones: Avoiding Losses, Formation Damage and Stuck Pipe. In Proceedings of the SPE/IADC Middle East Drilling Technology Conference and Exhibition, Abu Dhabi, UAE, 20–22 October 2003. [Google Scholar]
  6. Jones, J.F.; Taylor, G.D.; Barree, R.D. Successfully Managing Drilling-Fluid Losses in Multiple, Highly Depleted Sands. SPE Drill. Complet. 2003, 18, 182–187. [Google Scholar] [CrossRef]
  7. Benaissa, S.; Bachelot, A.; Ricaud, J.; Arquey, G.; Yi, X.; Ong, S. Preventing Differential Sticking and Mud Losses Drilling through Highly Depleted Sands. Fluids and Geomechanics Approach. In Proceedings of the SPE/IADC Drilling Conference, Amsterdam, The Netherlands, 23–25 February 2005. [Google Scholar]
  8. Al-Ajmi, A.M.; Al-Rushoud, A.S.; Gohain, A.K.; Al-Haj, H.A.; Khatib, F.I.; Al-Mutawa, F.M.; Al-Gharib, M.A.; Soliman, A.H.; Ibrahim, A.S.; Al-Mujalhem, M.Q. Nanotechnology Improves Wellbore Strengthening and Minimizes Differential Sticking Problems in Highly Depleted Formations. In Proceedings of the Abu Dhabi International Petroleum Exhibition & Conference, Abu Dhabi, UAE, 7–10 November 2016. [Google Scholar]
  9. Bui, T.A.; Hung, N.V.; Duong, T.T.; Duong, H.L.; Nguyen, H.T.; Truong, M.H. Sanding Onset for Offshore Depleted Using Critical Drawdown Pressure: A Case Study for Well X Cuulong Basin in Vietnam. In Proceedings of the 4th Congres International de Geotechnique-Ouvrages-Structures, Ho Chi Minh City, Vietnam, 21 October 2017. [Google Scholar]
  10. Davison, J.M.; Leaper, R.; Cauley, M.B.; Bennett, B.; Mackenzie, A.; Higgin, C.J.; Shuttleworth, N.; Wilkinson, D. Extending the Drilling Operating Window in Brent: Solutions for Infill Drilling in Depleting Reservoirs. In Proceedings of the IADC/SPE Drilling Conference, Dallas, TX, USA, 2–4 March 2004. [Google Scholar]
  11. Zhang, R.; Shi, X.Y.; Zhu, R.F.; Zhang, C.; Fang, M.Z.; Bo, K.H.; Feng, J.X. Critical drawdown pressure of sanding onset for offshore depleted and water cut gas reservoirs: Modeling and application. J. Nat. Gas Sci. Eng. 2016, 34, 159–169. [Google Scholar] [CrossRef]
  12. Addis, M.A.; Last, N.C.; Yassir, N.A. Estimation of horizontal stresses at depth in faulted regions and their relationship to pore pressure variations. SPE Form. Eval. 1996, 11, 11–18. [Google Scholar] [CrossRef]
  13. Kang, X.Q.; Xue, Y.J. Applied Rock Mechanics in Drilling of Depleted Reservoirs in Deepwater Gulf of Mexico. Petrophysics 2009, 50, 231–236. [Google Scholar]
  14. Parra, J.G.; Celis, E.; De Gennaro, S. Wellbore Stability Simulations for Underbalanced Drilling Operations in Highly Depleted Reservoirs. SPE Drill. Complet. 2003, 18, 146–151. [Google Scholar] [CrossRef]
  15. Qutob, H. Underbalanced Drilling: Remedy for Formation Damage, Lost Circulation, and Other Related Conventional Drilling Problems. In Proceedings of the Abu Dhabi International Conference and Exhibition, Abu Dhabi, UAE, 10–13 October 2004. [Google Scholar]
  16. Alberty, M.W.; McLean, M.R. Fracture Gradients in Depleted Reservoirs-Drilling Wells in Late Reservoir Life. In Proceedings of the SPE/IADC Drilling Conference, Amsterdam, The Netherlands, 27 February–1 March 2001. [Google Scholar]
  17. Van Oort, E.; Friedheim, J.E.; Pierce, T.; Lee, J. Avoiding Losses in Depleted and Weak Zones by Constantly Strengthening Wellbores. SPE Drill. Complet. 2011, 26, 519–529. [Google Scholar] [CrossRef]
  18. Bassey, A.; Dosunmu, A.; Iorkam, A.; Otutu, F.; Ukoha, J.; Awe, A.S.; Alabi, T. A New (3D MUDSYST Model) Approach to Wellbore Strengthening While Drilling in Depleted Sands: A Critical Application of LCM and Stress Caging Model. In Proceedings of the Nigeria Annual International Conference and Exhibition, Lagos, Nigeria, 6–8 August 2012. [Google Scholar]
  19. Fett, J.D.; Martin, F.; Dardeau, C.; Rignol, J.; Benaissa, S.; Adachi, J.; Pastor, J.A.S.C. Case History: Successful Wellbore Strengthening Approach in a Depleted and Highly Unconsolidated Sand in Deepwater Gulf of Mexico. SPE Drill. Complet. 2010, 25, 500–508. [Google Scholar] [CrossRef]
  20. Mehrabian, A.; Abousleiman, Y. Wellbore Geomechanics of Extended Drilling Margin and Engineered Lost-Circulation Solutions. SPE J. 2017, 22, 38–51. [Google Scholar] [CrossRef]
  21. Wang, H.; Towler, B.F.; Soliman, M.Y. Near Wellbore Stress Analysis and Wellbore Strengthening for Drilling Depleted Formations. In Proceedings of the Rocky Mountain Oil & Gas Technology Symposium, Denver, CO, USA, 16–18 April 2007. [Google Scholar]
  22. Otutu, F. Novel Wellbore Strengthening Enables Drilling of Exploration Well in a Highly Depleted Formation. In Proceedings of the SPE/IADC Middle East Drilling Technology Conference and Exhibition, Muscat, Oman, 24–26 October 2011. [Google Scholar]
  23. Van Oort, E. On the Physical and Chemical Stability of Shales. J. Pet. Sci. Eng. 2003, 38, 213–235. [Google Scholar] [CrossRef]
  24. Song, J.; Yuan, Y.; Gu, S.; Yang, X.; Yue, Y.; Cai, J.; Jiang, G. 2D Numerical Simulation of Improving Wellbore Stability in Shale Using Nanoparticles Based Drilling Fluid. Energies 2017, 10, 651. [Google Scholar] [CrossRef]
  25. Nguyen, V.X.; Abousleiman, Y.N.; Hoang, S. Analyses of Wellbore Instability in Drilling Through Chemically Active Fractured-Rock Formations. SPE J. 2009, 14, 283–301. [Google Scholar] [CrossRef]
  26. Yu, M.; Chenevert, M.E.; Sharma, M.M. Chemical–mechanical wellbore instability model for shales: Accounting for solute diffusion. J. Pet. Sci. Eng. 2003, 38, 131–143. [Google Scholar] [CrossRef]
  27. Bol, G.M.; Wong, S.W.; Davidson, C.J.; Woodland, D.C. Borehole Stability in Shales. SPE Drill. Complet. 1994, 9, 87–94. [Google Scholar] [CrossRef]
  28. Roegiers, J.C. Well Modeling: An Overview. Oil Gas Sci. Technol. 2002, 57, 569–577. [Google Scholar] [CrossRef]
  29. Yuan, J.L.; Deng, J.G.; Tan, Q.; Yu, B.H.; Jin, X.C. Borehole stability analysis of horizontal drilling in shale gas reservoirs. Rock Mech. Rock Eng. 2013, 46, 1157–1164. [Google Scholar] [CrossRef]
  30. Liu, Y.S. Collapse pressure and precautions for stability of wellbore wall. Chin. J. Rock Mech. Eng. 2004, 23, 2421–2423. [Google Scholar]
  31. Liu, S.J.; Zhou, J.L.; He, B.S.; Deng, J.G. The prediction technology of hole enlargement ratio in the condition of underbalanced drilling. China Offshore Oil Gas 2007, 19, 335–337. [Google Scholar]
  32. Zoback, M.D.; Moos, D.; Mastin, L. Wellbore breakouts and in situ stress. J. Geophys. Res. 1985, 90, 5523–5530. [Google Scholar] [CrossRef]
  33. Dac, T.N.; My, D.D.T.; Ahmed, A.; Thai, H.P.; Rehman, S.; Truong, S.N.; Hong, G.K. Combining Sonic While Drilling and Formation Pressure While Drilling for Pore Pressure Analysis to Reduce Drilling Risk: A Case Study in Offshore Vietnam. In Proceedings of the Offshore Technology Conference Asia, Kuala Lumpur, Malaysia, 22–25 March 2016. [Google Scholar]
  34. Zhang, J. Pore pressure prediction from well logs Methods, modifications, and new approaches. Earth-Sci. Rev. 2011, 108, 50–63. [Google Scholar] [CrossRef]
  35. Zhang, J.; Roegiers, J.C. Discussion on “Integrating borehole-breakout dimensions, strength criteria, and leak-off test results, to constrain the state of stress across the Chelungpu Fault, Taiwan”. Tectonophysics 2010, 492, 295–298. [Google Scholar] [CrossRef]
  36. Shaughnessy, J.; Fuqua, R.; Romo, L. Successfully Drilling Highly Depleted Sands. In Proceedings of the SPE/IADC Drilling Conference, Amsterdam, The Netherlands, 27 February–1 March 2001. [Google Scholar]
  37. Aadnoy, B.S.; Larson, K. Method for fracture-gradient prediction for vertical and inclined boreholes. SPE Drill. Eng. 1989, 4, 99–103. [Google Scholar] [CrossRef]
  38. Abousleiman, Y.; Ekbote, S. Solutions for the inclined borehole in a porothermoelastic transversely isotropic medium. J. Appl. Mech. 2005, 72, 102–114. [Google Scholar] [CrossRef]
  39. Sofianos, A.I.; Nomikos, P.P. Equivalent Mohr–Coulomb and generalized Hoek–Brown strength parameters for supported axisymmetric tunnels in plastic or brittle rock. Int. J. Rock Mech. Min. Sci. 2006, 43, 683–704. [Google Scholar] [CrossRef]
  40. Al-Ajmi, A.M.; Zimmerman, R.W. Stability analysis of vertical boreholes using the Mogi–Coulomb failure criteria. Int. J. Rock Mech. Min. Sci. 2006, 43, 1200–1211. [Google Scholar] [CrossRef]
  41. Yan, C.L.; Deng, J.G.; Yu, B.H.; Li, W.L.; Chen, Z.J.; Hu, L.B.; Li, Y. Borehole Stability in High-Temperature Formations. Rock Mech. Rock Eng. 2013, 46, 1157–1164. [Google Scholar] [CrossRef]
  42. Morita, N.; Fuh, G.F. Parametric Analysis of Stress Reduction in the Cap Rock above Compacting Reservoirs. SPE Drill. Complet. 2009, 24, 659–670. [Google Scholar] [CrossRef]
Figure 1. Schematic diagram for conventional wellbore stability analysis and drilling design. The leftmost column represents the stratum and corresponding drilling risks, the middle column represents pressure gradient where the blue and red dashed lines represent lower and upper limit of ECD respectively, and green solid line respects the recommended ECD, the rightmost column represents casing program designed to isolate the multi-pressure system.
Energies 10 01820 g001
Figure 2. Schematic diagram for the geometric shape of the collapsed borehole. The dotted circle in the centre represents the ideal shape of the borehole, the ellipse drawn by the grey solid line represents the collapsed shape of the borehole, and the blue square region represents the stratum under the action of non-uniform ground stress around the borehole.
Energies 10 01820 g002
Figure 3. Degree of collapse for an arbitrary wellbore drilled in a normal fault regime. β represents the well azimuth angle relative to the maximum horizontal principal stress orientation.
Energies 10 01820 g003
Figure 4. Degree of collapse for an arbitrary wellbore drilled in a reverse fault regime.
Energies 10 01820 g004
Figure 5. Degree of collapse for an arbitrary wellbore drilled in a strike-slip fault regime.
Energies 10 01820 g005
Figure 6. Collapse pressure gradients under a moderate collapse condition in different stages of reservoir depletion. The first column represents Pc when the reservoir depletion is zero and the first line represents Pc when the borehole is drilled in a stress area associated with normal faults. For every picture, the colour represents the value of Pc, where red represents higher Pc, the polar angle represents the well azimuth, and the polar radius represents the well deviation angle.
Energies 10 01820 g006
Figure 7. Collapse pressure gradients in the shale cap at different locations away from the depleted reservoir. The shale cap is located above and below the depleted reservoir, respectively. Δ P represents the reservoir depletion, and γ represents the wellbore degree of collapse, and the rightmost column represents the stratum and their thickness.
Energies 10 01820 g007
Figure 8. Schematic diagram for new wellbore stability evaluation and drilling design optimizing. The leftmost column represents the stratum and corresponding drilling risks, the middle column represents pressure gradient where the dotted line and solid line represent the original and new results of the wellbore stability evaluation, respectively, and the rightmost column represents casing program optimizing based the pressure gradient.
Energies 10 01820 g008

