Cost Assessment Methodology and Economic Viability of Tidal Energy Projects


Abstract
1. Introduction
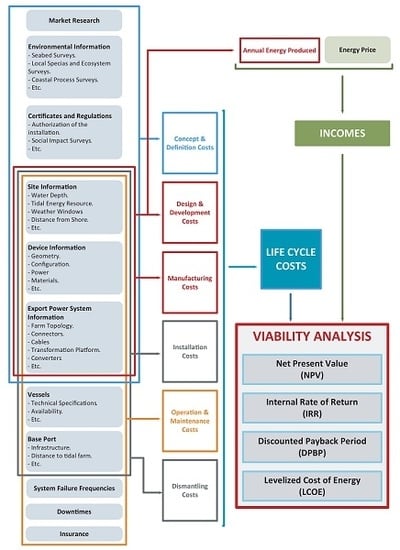
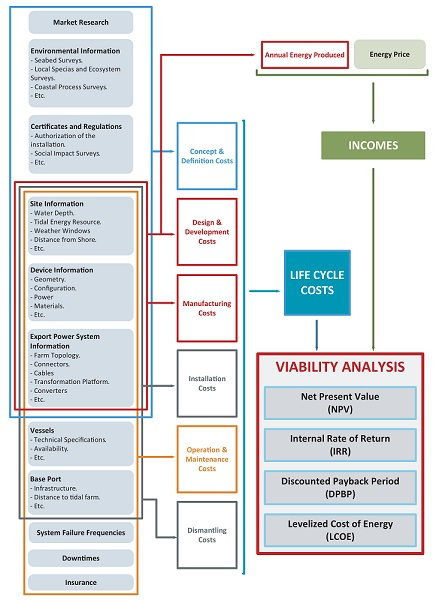
2. Proposed Methodology of the Evaluation of Tidal Energy Projects
2.1. Concept and Definition Costs ()
- Market research costs (): It is necessary to determine the current state of the market as regards tidal energy generation and to analyze the economic viability of the tidal energy project on the basis of environmental information, site information (water depth, tidal energy resource, weather windows, distance from shore, etc.), device information (geometry, configuration, power, materials, etc.), export power system information (farm topology, connectors, cables, transformation platform, converters, etc.), and so on. This cost is modeled as a constant value, i.e.,where is defined as a constant value.
- Project management costs (): These include the completion and obtaining of certificates and regulations, such as environmental studies (seabed surveys, local species and ecosystem surveys, coastal process surveys, etc.), social impact surveys and the authorization of the installation. These costs are usually constant, with the exception of the authorization of the installation of the tidal farm, which depends on the surface required to install the tidal energy project. These costs are, therefore, modeled as:where denotes a constant value in €, expresses the cost per m in €/m and defines the surface required to install the tidal energy project in m.
- Conception of the tidal farm and design analysis costs (): This comprises the cost of obtaining the preliminary solution for the tidal energy project. One or more possible solutions are synthesized at this stage and are then evaluated with regard to the restrictions imposed. This cost is modeled as a constant value, i.e.,where denotes a constant value in €.
- Project requirements’ specification costs (): At this stage, the main components of the tidal energy project and their interactions are determined in sufficient detail to be able to carry out an objective evaluation of the project proposal. In the particular case of tidal farms, it is necessary to consider site information (water depth, tidal energy resource, weather windows, distance from shore, etc.), device information (geometry, configuration, power, materials, etc.), export power system information (farm topology, connectors, cables, transformation platform, converters, etc.), and so on. This cost is again modeled as a constant value, i.e.,where expresses a constant value in €.
2.2. Design and Development Costs ()
2.3. Manufacturing Costs ()
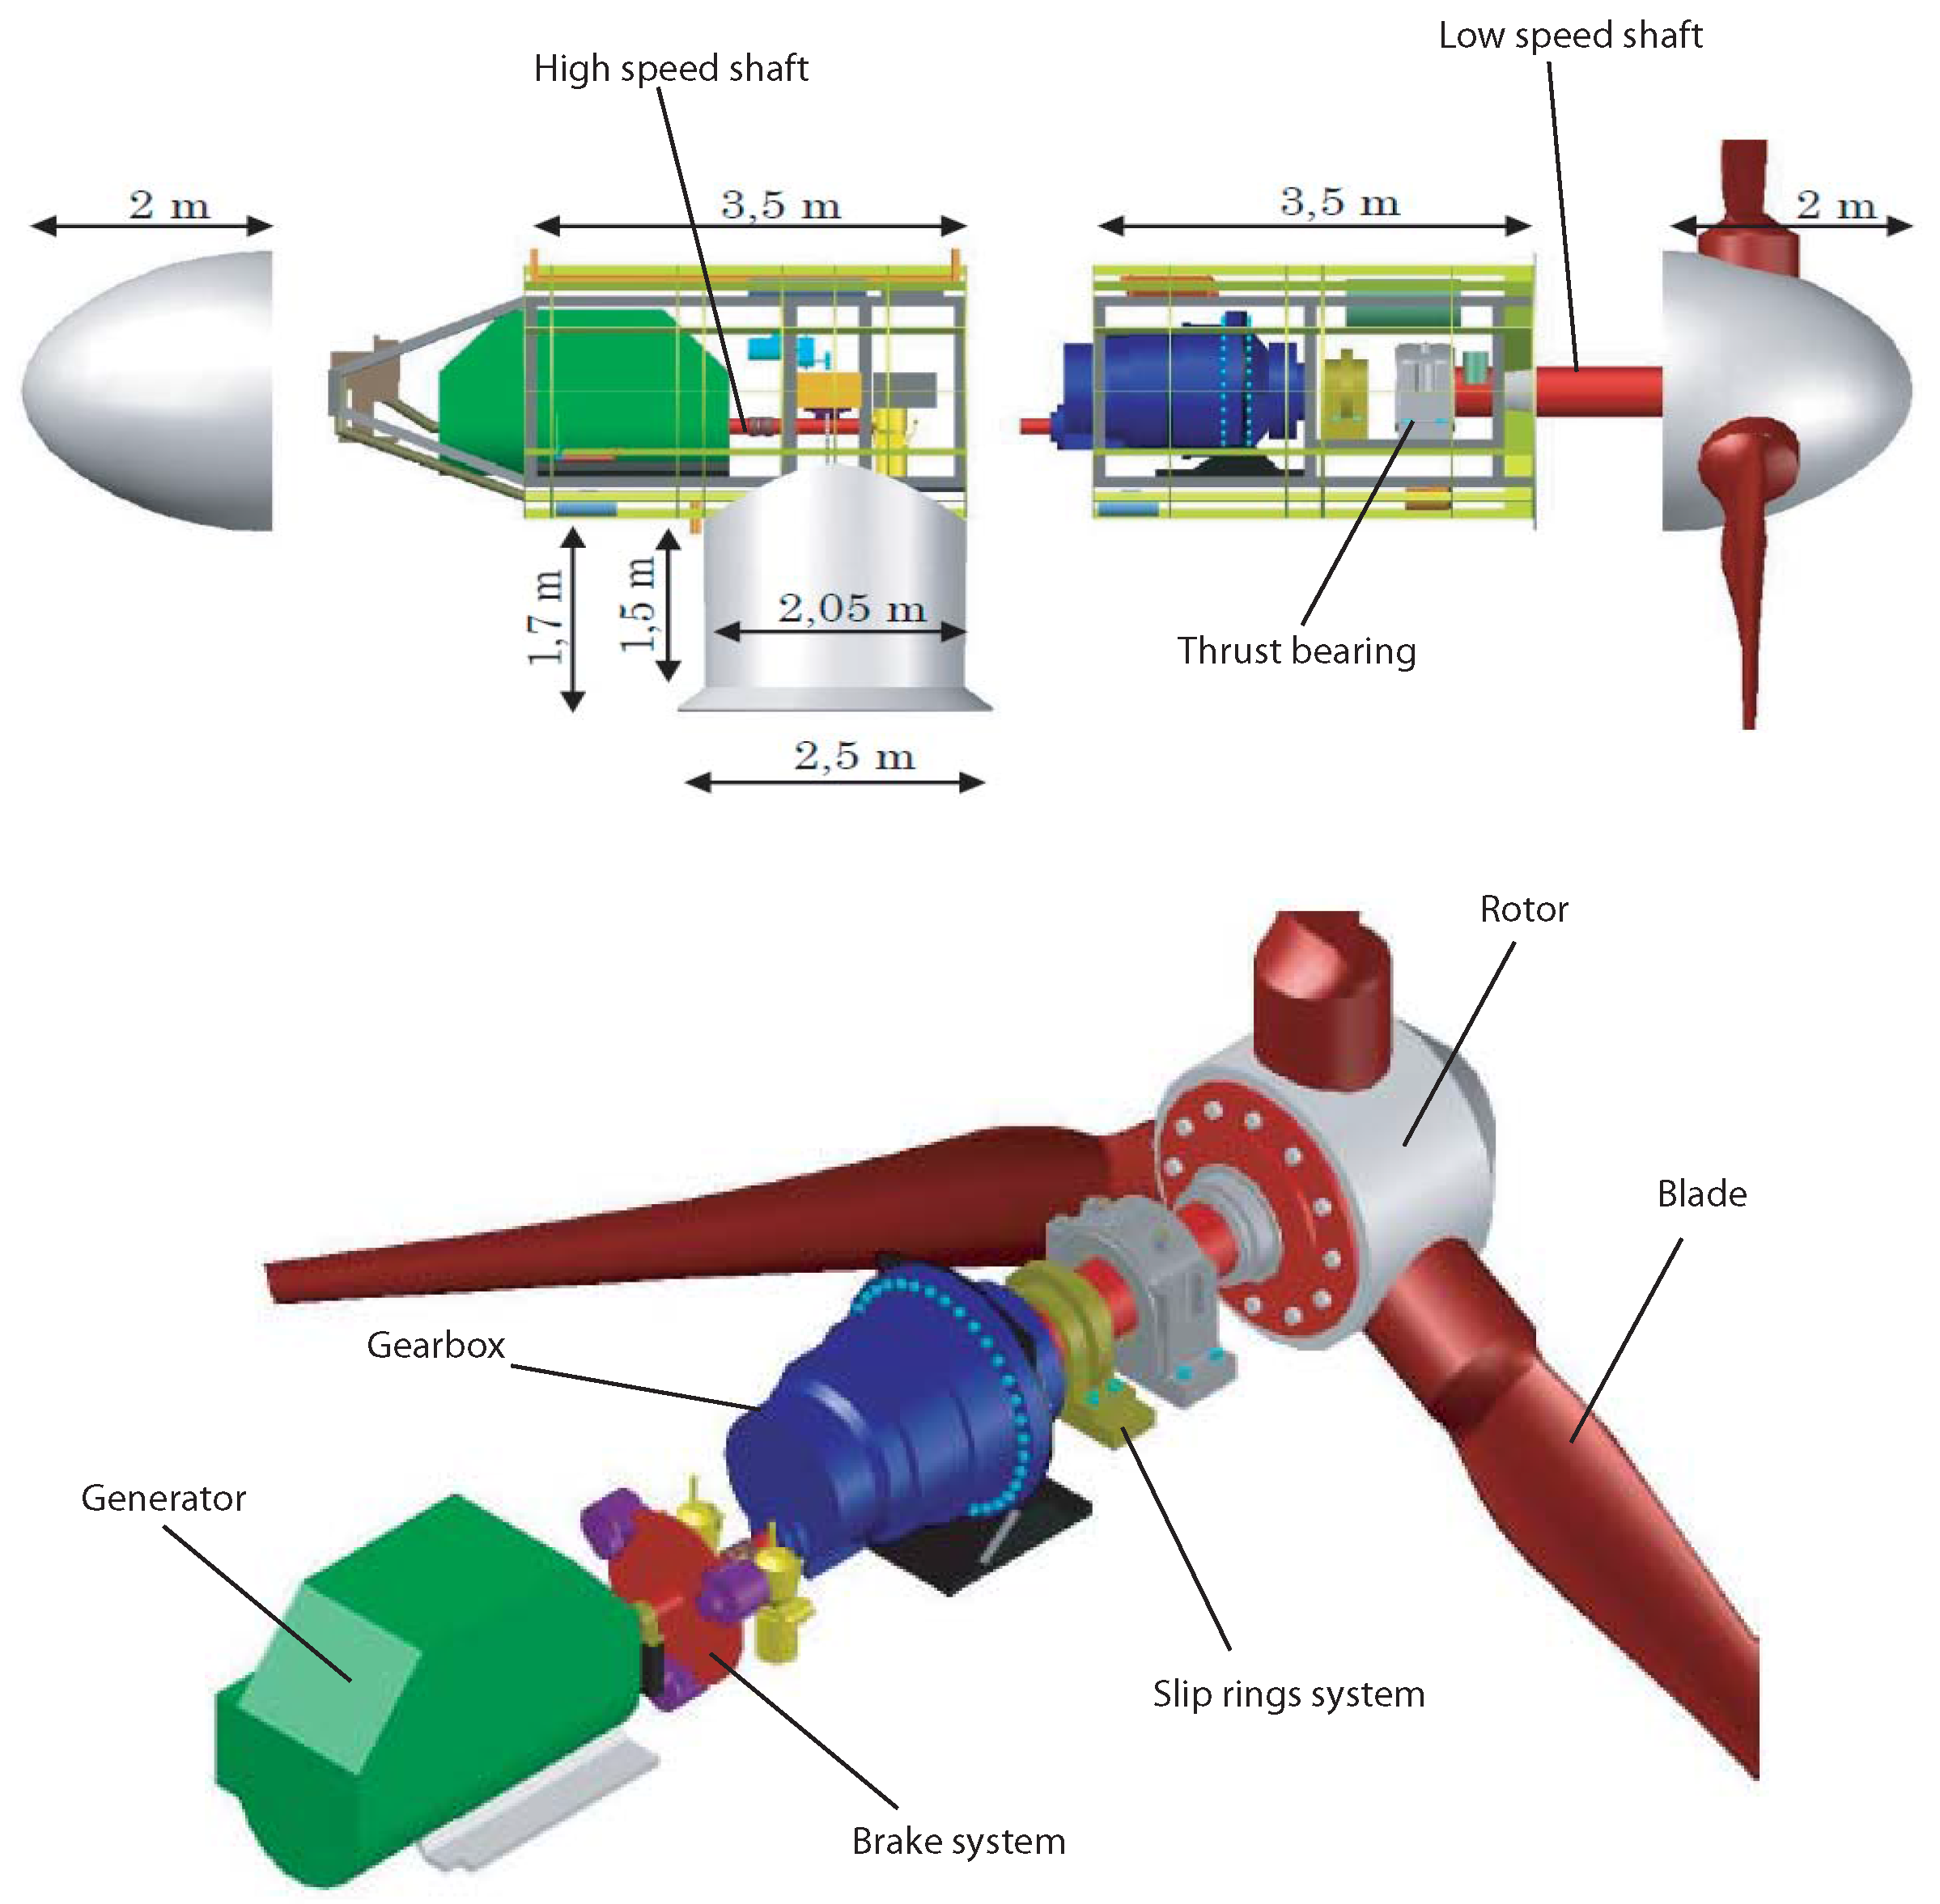
- Nacelle (): This cost (see Figure 2) is estimated by considering the following sub-costs associated with the structure of the nacelle (): power take off (PTO) frame (), fairing (), PTO (), auxiliary systems () and rotor (). They are estimated as follows:
- −
- Structure of the nacelle (): This cost is estimated by considering the number of TECs manufactured, , the cost per kg of the carbon steel produced, , in €/kg, and the mass of the structure (front cover, horizontal and vertical cylinders, longitudinal and transversal reinforcements, etc.) of the nacelle, , in kg, i.e.,
- −
- PTO frame (): This cost is estimated by considering the number of TECs manufactured, the cost per kg of the carbon steel produced for this element, , in €/kg, and the mass of this element, , in kg, i.e.,
- −
- Fairing (): This cost is estimated by considering the number of TECs manufactured, the cost per kg of the fiberglass produced for this element, , in €/kg, and the mass of this element, , in kg, i.e.,
- −
- PTO (): This cost considers the number of TECs manufactured and the costs of the thrust bearing, the gearbox, the high-speed shaft, the slip ring system, the brake system, the electrical generator, etc., of each TEC [35,36,37,38]. The main variables required to estimate these costs are included in a nonlinear function depending on the number of TECs manufactured, the power of each TEC, , the cost per MW of the thrust bearing, , in €/MW, the cost per MW of the high-speed shaft, , in €/MW, the cost per MW of the gearbox, , in €/MW, the cost per MW of the brake system, , in €/MW, and the cost per MW of the electrical generator, , in €/MW, i.e.,
- −
- Auxiliary systems (): This cost considers the number of TECs manufactured and the costs of the yaw system, cooling system, pressure oil system, protection and connection switches, bilge system, compressed air system, circuit board, control system, condition monitoring systems and added elements. The main variables required to estimate this cost are the number of TECs manufactured, the power of each TEC, the mass of the yaw system, , in kg, the cost per kg for this element, , in €/kg, the cost per MW of the cooling system, , in €/MW, the cost per MW of the pressure oil system, , in €/MW, the mass of the protection and connection switches in kg, the cost per kg of these elements, , in €/kg, the mass of the bilge system in kg, the cost per kg of this element, , in €/kg, the mass of the compressed air system in kg, the cost per kg of this element, , in €/kg, the mass of the circuit board in kg, the cost per kg of this element, , in €/kg, the mass of the control system in kg, the cost per kg of these elements, , in €/kg, the cost per MW of the condition monitoring system, , in €/MW, the mass of the added elements in kg, and the cost per kg of this element, , in €/kg, i.e.,
- −
- Rotor (): This cost is estimated by considering the number of TECs manufactured, the costs of the blades, the pitch system and the core of the rotor. The main variables required to estimate these costs are included in a nonlinear function depending on the number of TECs manufactured, the radius of the rotor, , in m, the cost per m of each blade, , in €/m, the number of blades per TEC, , the cost per m of the pitch system, , in €/m, the cost per m of the low-speed shaft, in €/m, and the cost per m of the core of the rotor, , in €/m, i.e.,
- Supporting TEC structure (): This cost is estimated by considering the following sub-costs (see Figure 3) associated with the base support (), the transition structure (), the vertical column (), the concrete ballasts () and the special concrete bags (). They are estimated as follows:
- −
- Base support (): This cost is estimated by considering the number of TECs installed, , the cost per kg of the steel produced, , in €/kg, and the mass of the structure, , in kg, i.e.,
- −
- Transition structure (): This cost is estimated by considering the number of TECs installed, the cost per kg of the steel produced, , in €/kg, and the mass of the structure, , in kg, i.e.,
- −
- Vertical column (): This cost is estimated by considering the number of TECs installed, the cost per kg of the steel produced, , in €/kg, and the mass of the structure, , in kg, i.e.,
- −
- Concrete ballasts (): This cost is estimated by considering the number of TECs installed, the amount of concrete ballast per TEC, , the cost per kg of the concrete produced, , in €/kg, and the mass of the ballast, , in kg, i.e.,
- −
- Special concrete bags (): This cost is estimated by considering the number of TECs installed, the amount of special concrete bags per TEC, , the cost per kg of the concrete contained in the special bags, , in €/kg, and the mass of the concrete produced for the special bags, , in kg, i.e.,
- Export power system (): This cost is estimated by considering the following sub-costs associated with the electrical equipment in the nacelle (), the electrical equipment in the base support (), the umbilical cables (), the transformation platform and the converters () and the exportation cable (). They are estimated as follows:
- −
- Electrical equipment in the nacelle (): This cost is estimated by considering the number of TECs manufactured, the power of each TEC, the cost per MW of the protection switch, , in €/MW, the mass of the submarine connector, , in kg, and the cost per kg of this element, , in €/kg, i.e.,
- −
- Electrical equipment in the base support (): This cost is estimated by considering the number of TECs installed, the mass of the submarine connector installed in the base, , in kg, the cost per kg of this element, , in €/kg, the mass of the internal wiring, , in kg, the cost per kg of this element, , in €/kg, the mass of the connection box, , in kg and the cost per kg of this element, , in €/kg, i.e.,
- −
- Umbilical cables (): This cost is estimated by considering the length of the umbilical cables, , in m, and the cost per m of this element, , in €/m, i.e.,
- −
- Transformation platform and converters (): This cost is estimated by considering the number of TECs installed, the power of each TEC, the cost per MW of the rectifiers, , in €/MW, the cost per MW of the inverters, , in €/MW, the cost per MW of the electrical boxes, , in €/MW, the number of transformers, , the cost per MW of the transformers, , in €/MW, the mass of the transformation platform, , in kg, and the cost per kg of this element, , in €/kg, i.e.,
- −
- Exportation cables (): This cost is estimated by considering the number of submarine exportation cables, , the length of the submarine exportation cables, , in m, the cost per m of this element, , in €/m, the length of the ground exportation cables, , in m, and the cost per m of this element, , in €/m, i.e.,
2.4. Installation Costs ()
- Specialized vessels: The evolution of offshore wind farms and the development of advanced offshore technologies result in progressions in infrastructure and the attainment of specific solutions for these particular sectors. When designing the installation and O&M procedures, it is therefore essential to search for specialized vessels with which to perform these activities. Without the existence of these specialized vessels, the costs of these operations would be so high that the economic viability of these offshore systems might be seriously compromised.
- Base port: When studying of the implementation of a tidal farm, it is very important to determine the location of nearby industrial base ports. These ports need to be equipped with sufficient means for the reception of materials and components and have the capabilities to load and upload these materials and components, along with the means to perform TEC maintenance tasks. The location of the port base has a great influence as regards ensuring a reduction in the installation and O&M costs.
- Weather windows: Weather phenomena, such as wind velocity, wave height and tidal current velocity, need to be studied in order to perform the installation and the O&M procedures in safe conditions. The definition of favorable weather windows throughout the different seasons of the year is fundamental if an adequate and a safe planning of the installation and the O&M tasks is to take place.
- Installation of the transformation platform and converters (): In order to evaluate this activity, it is necessary to include the cost of leasing the vessels (specialized installation vessel, cable-laying vessel, remotely-operated vehicles (ROVs), etc.), , the cost of technical labor (technical specialist, divers, etc.), , the cost of operations in the port (excavators, winches, trucks, etc), , which depend on the distance from the tidal farm to the base port, , and the weather windows, ; i.e.,
- Installation of the submarine cables (): This cost has a similar structure to that explained previously. In order to estimate this activity, it is necessary to include the cost of leasing the vessels, , the cost of technical labor, , the cost of operations in the port, , which depend on the distance from the tidal farm to the base port, and the weather windows; i.e.,
- Installation of the ground exportation cable (): In order to evaluate this activity, it is again necessary to include the cost of leasing the vessels, , the cost of technical labor, , the cost of operations in the port, , which depend on the distance from the tidal farm to the base port, and weather windows:
- Installation of the TECs (): Finally, and using a similar procedure to that described above, the evaluation of this cost structure is the following (cost of leasing the vessels, , the cost of technical labor, , the cost of operations in the port, , which depend on the distance from the tidal farm to the base port, and weather windows):
2.5. Operation and Maintenance Costs ()
- Blade cleaning (): This concerns the removal of algae, microorganisms and fouling from the blades of the TEC. This cost depends on the number of TECs manufactured, the downtimes spent on this process, , the weather windows, the transport costs, , the labor costs, , and the costs incurred as the result of production losses, , i.e.,
- Light preventive maintenance (): This involves light general maintenance (grease changes, review of painting defects, etc.) in the TECs (nacelle + supporting structure) and the export energy system. The estimation of this cost category is carried out by considering the number of TECs manufactured, the downtimes spent on this process, , the weather windows, , the transport costs, , the labor costs, , the material costs, , and the costs incurred as the result of production losses, , i.e.,
- High preventive maintenance (): This implies more in-depth maintenance (bearing replacements, inspection of the nacelle and the structure components, etc.) in the TECs (nacelle + supporting structure) and the export energy system. As in the previous category, the estimation of this cost category is carried out by considering the number of TECs manufactured, the downtimes spent on this process, , the weather windows, , the transport costs, , the labor costs, , the material costs, , and the costs incurred as the result of production losses, , i.e.,
- Corrective maintenance (): This concerns repairing the TECs (nacelle + supporting structure) and the export energy system, The computation of this cost category is developed by including the number of TECs manufactured, the failure probability of the i-component of the tidal farm, , the downtimes spent on this process, , the weather windows, , the transport costs, , the labor costs, , the material costs, , and the costs incurred as the result of production losses, , i.e.,
- Insurance costs and fixed expenses (): The estimation of this cost is an area that needs to be studied in depth within the offshore renewable energy sector. According to the scientific literature, two possible metrics can be used to estimate these costs [17]: (a) % of the total capital expenditure (CAPEX, an expenditure whose benefit extends beyond one year; this concept will be explained in detail in Section 2.8); or (b) €/MWh. For example, in [45], the cost of insurance is estimated as 2% of the CAPEX, while [46] includes an estimation of the insurance cost of 15,000 €per MW. In our case, the insurance costs and fixed expenses have been estimated as a percentage of the CAPEX.
2.6. Decommissioning Costs ()
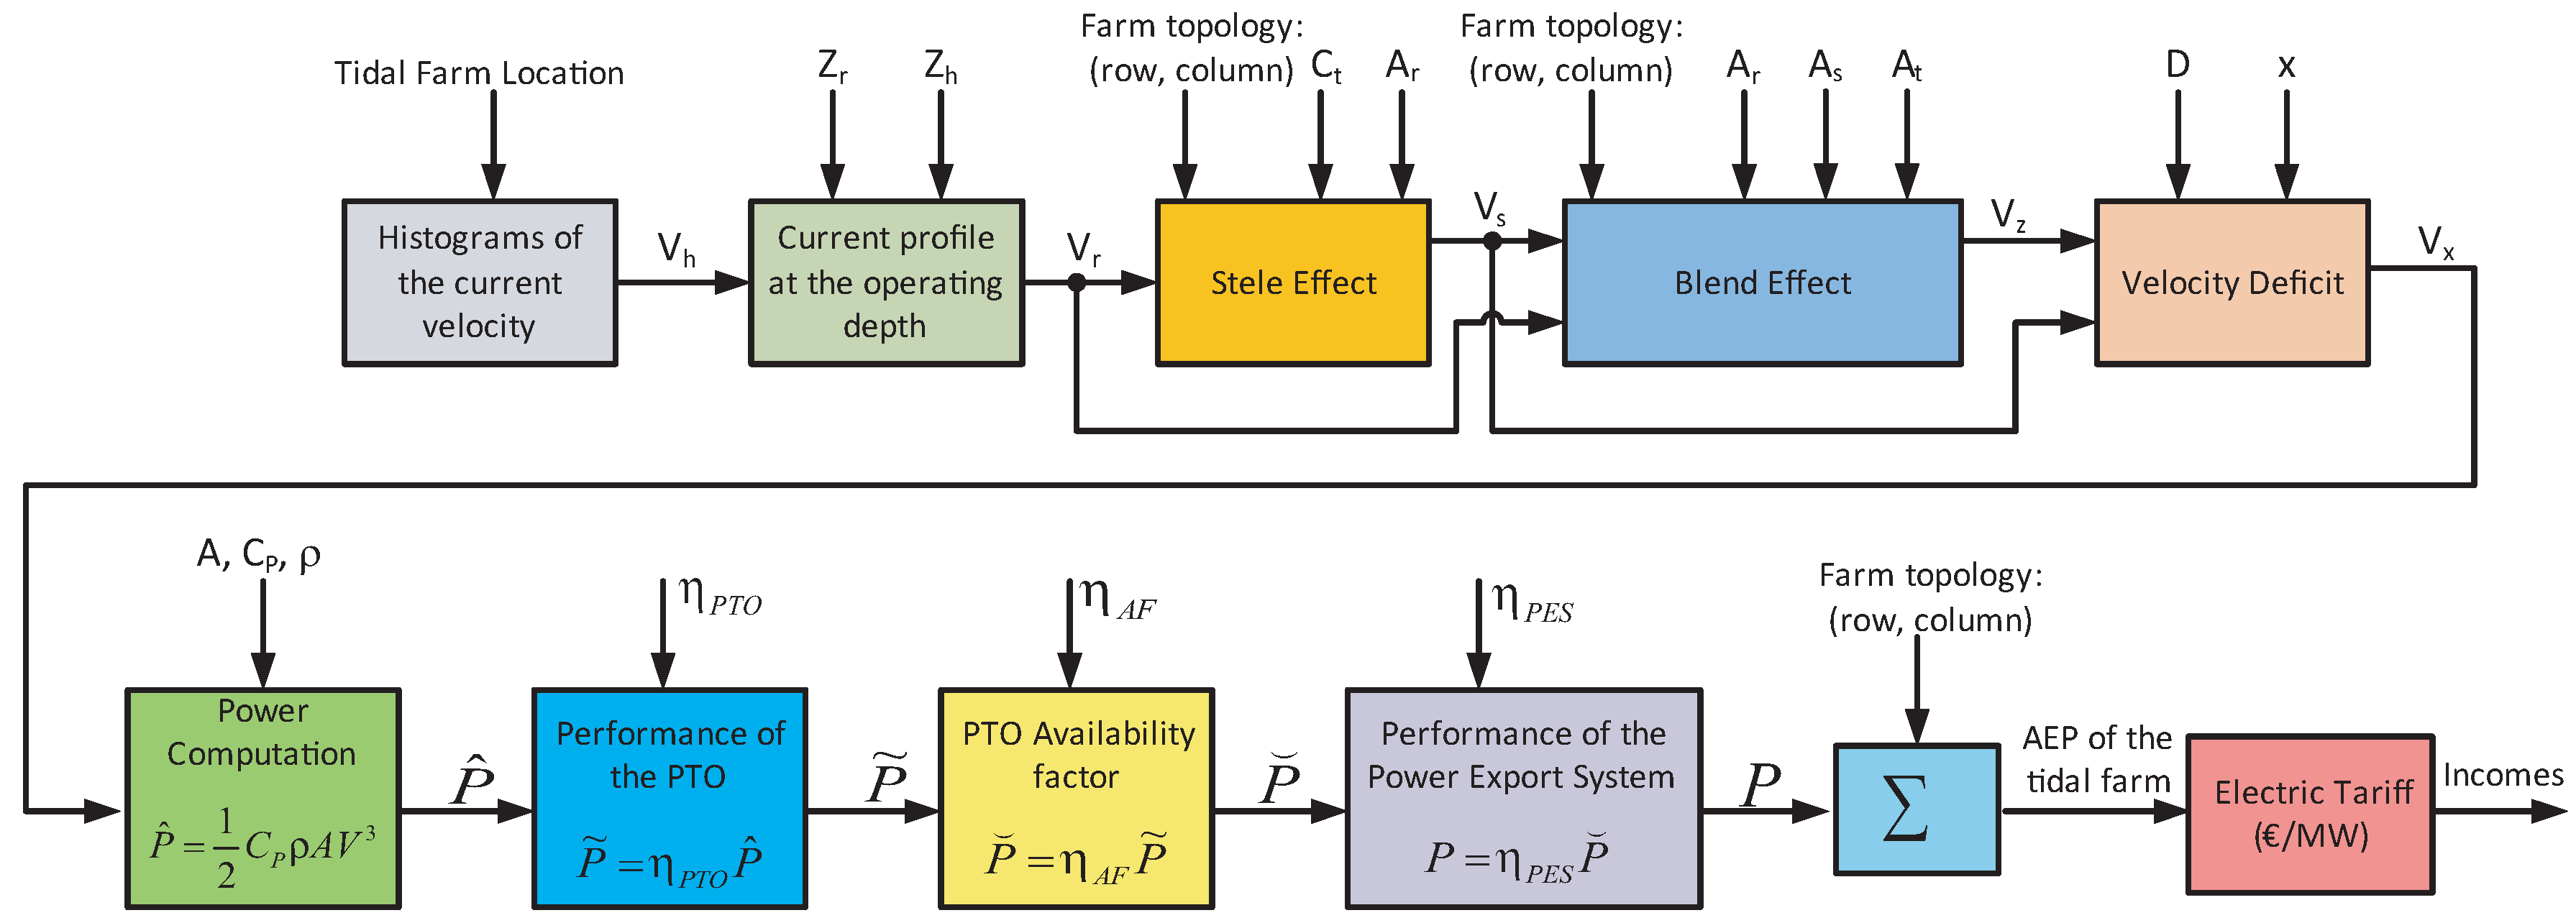
2.7. Annual Energy Produced
- Estimation of the current velocity at the depth of the rotor. During the computation of this parameter, it is necessary to consider the following aspects:
- −
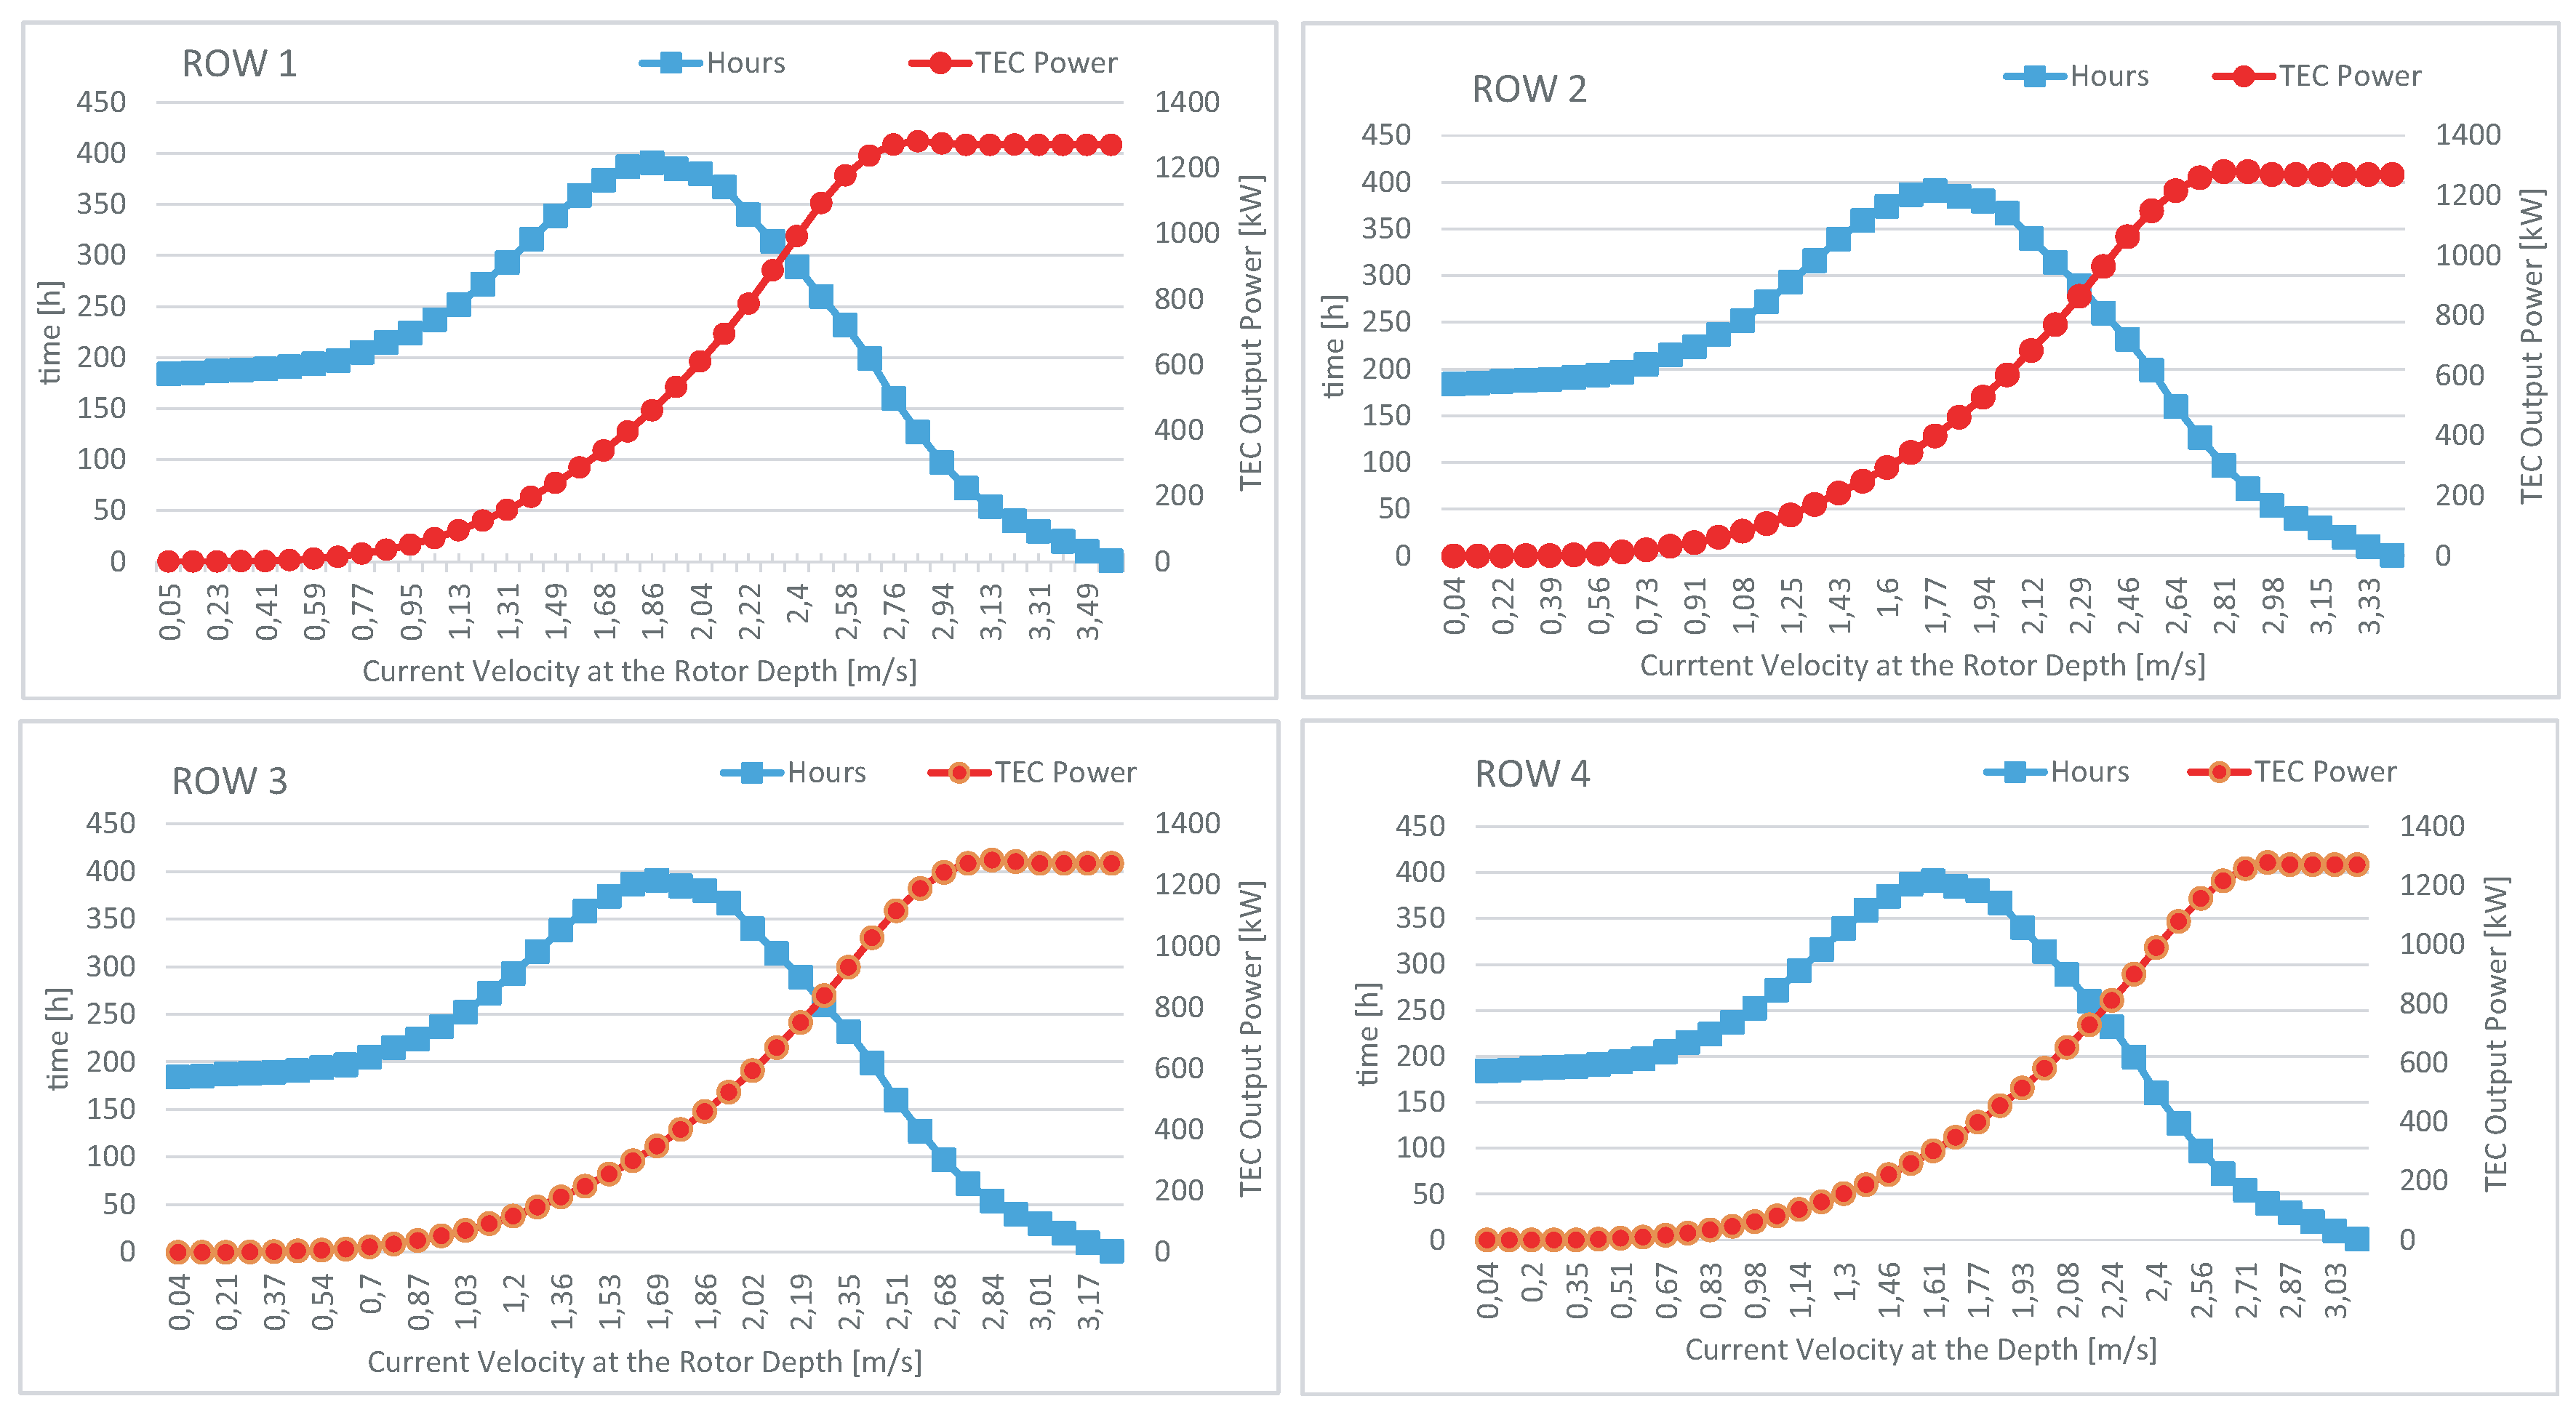
- Histograms of the current velocity: These histograms provide information about the frequency (number of hours) with which a given current velocity is repeated in a year. They provide useful information as regards estimating the energy produced by a TEC [48].
- −
- Current profile at the operating depth: A relation of is used to adapt the measured current velocities at the surface (represented in the aforementioned histograms) to the operating depth [49].where represents the rotor velocity in m/s, denotes the velocity at the sea surface in m/s, is the rotor depth in m and expresses the depth of the water column.
- −
- Stele effect, blend effect and velocity deficit: When the flow passes through the rotor, it transfers energy to it, but it simultaneously undergoes diverse hydrodynamic phenomena that result in a flow speed deficit downstream of the rotor. It additionally generates a stele with a great turbulence that causes disturbances in the flow. This effect appears when the flow passes through each TEC and, consequently, when it passes each row of the tidal farm. The last rows of the tidal farms will, therefore, receive a lower quality flow, signifying that the TECs will capture less energy [50]. This is obtained by employing the following expression:where a is the stele coefficient, represents the buoyancy coefficient, denotes the input flow velocity in m/s, is the surface of the rotor in m, denotes the output flow velocity in m/s and expresses the output flow surface in m. Once this effect has been estimated, it is necessary to take into account the blend effect between the perturbed flow and the free flow downstream of the rotor by considering the configuration of the tidal farm and applying the energy conservation law. The following result is obtained:where denotes the total frontal surface of the device and expresses the final velocity of the blended flow in m/s. The velocity deficit is then computed as:with an exponential decay model for an intermediate point (x, ) located between the rotor output (stele effect) and the blend flow downstream and where D denotes the diameter of the rotor [51]. The usual values of velocity deficit are around 5% when the flow passes through a row of TECs.
- Performance of the PTO: When the tidal current velocity is small, the PTO of the TEC is working in a partial regime that only captures a part of its nominal power, and its performance is, therefore, considerably reduced. This effect needs to be considered in order to estimate a realistic value of the AEP and to characterize the cut-in velocity (the cut-in velocity of a TEC can be defined as the minimum velocity required to generate energy with which to feed at least the auxiliary systems that allow the TEC to operate) of the device.
- Additional requirements when estimating the total energy produced: Several requirements need to be considered when estimating a realistic value of the total energy:
- −
- Availability factor: The TEC does not always work properly owing to device breakdowns and maintenance periods. This availability factor needs to be estimated on the basis of the information obtained from the maintenance procedures used, weather windows, and so on.
- −
- Tidal farm topology: This influences the final value of the AEP, and it is necessary to evaluate the performance of each TEC on the basis of the position (row, column) that it occupies within the tidal farm.
- −
- Performance of the power export system: The last stage involved in obtaining the AEP for the tidal farm is its exportation and conversion into quality energy. The performance of the export power system from the generators of the TECs to the water-to-wire point therefore needs to be included.
2.8. Viability Analysis
2.8.1. Net Present Value
2.8.2. Internal Rate of Return
2.8.3. Discounted Payback Period
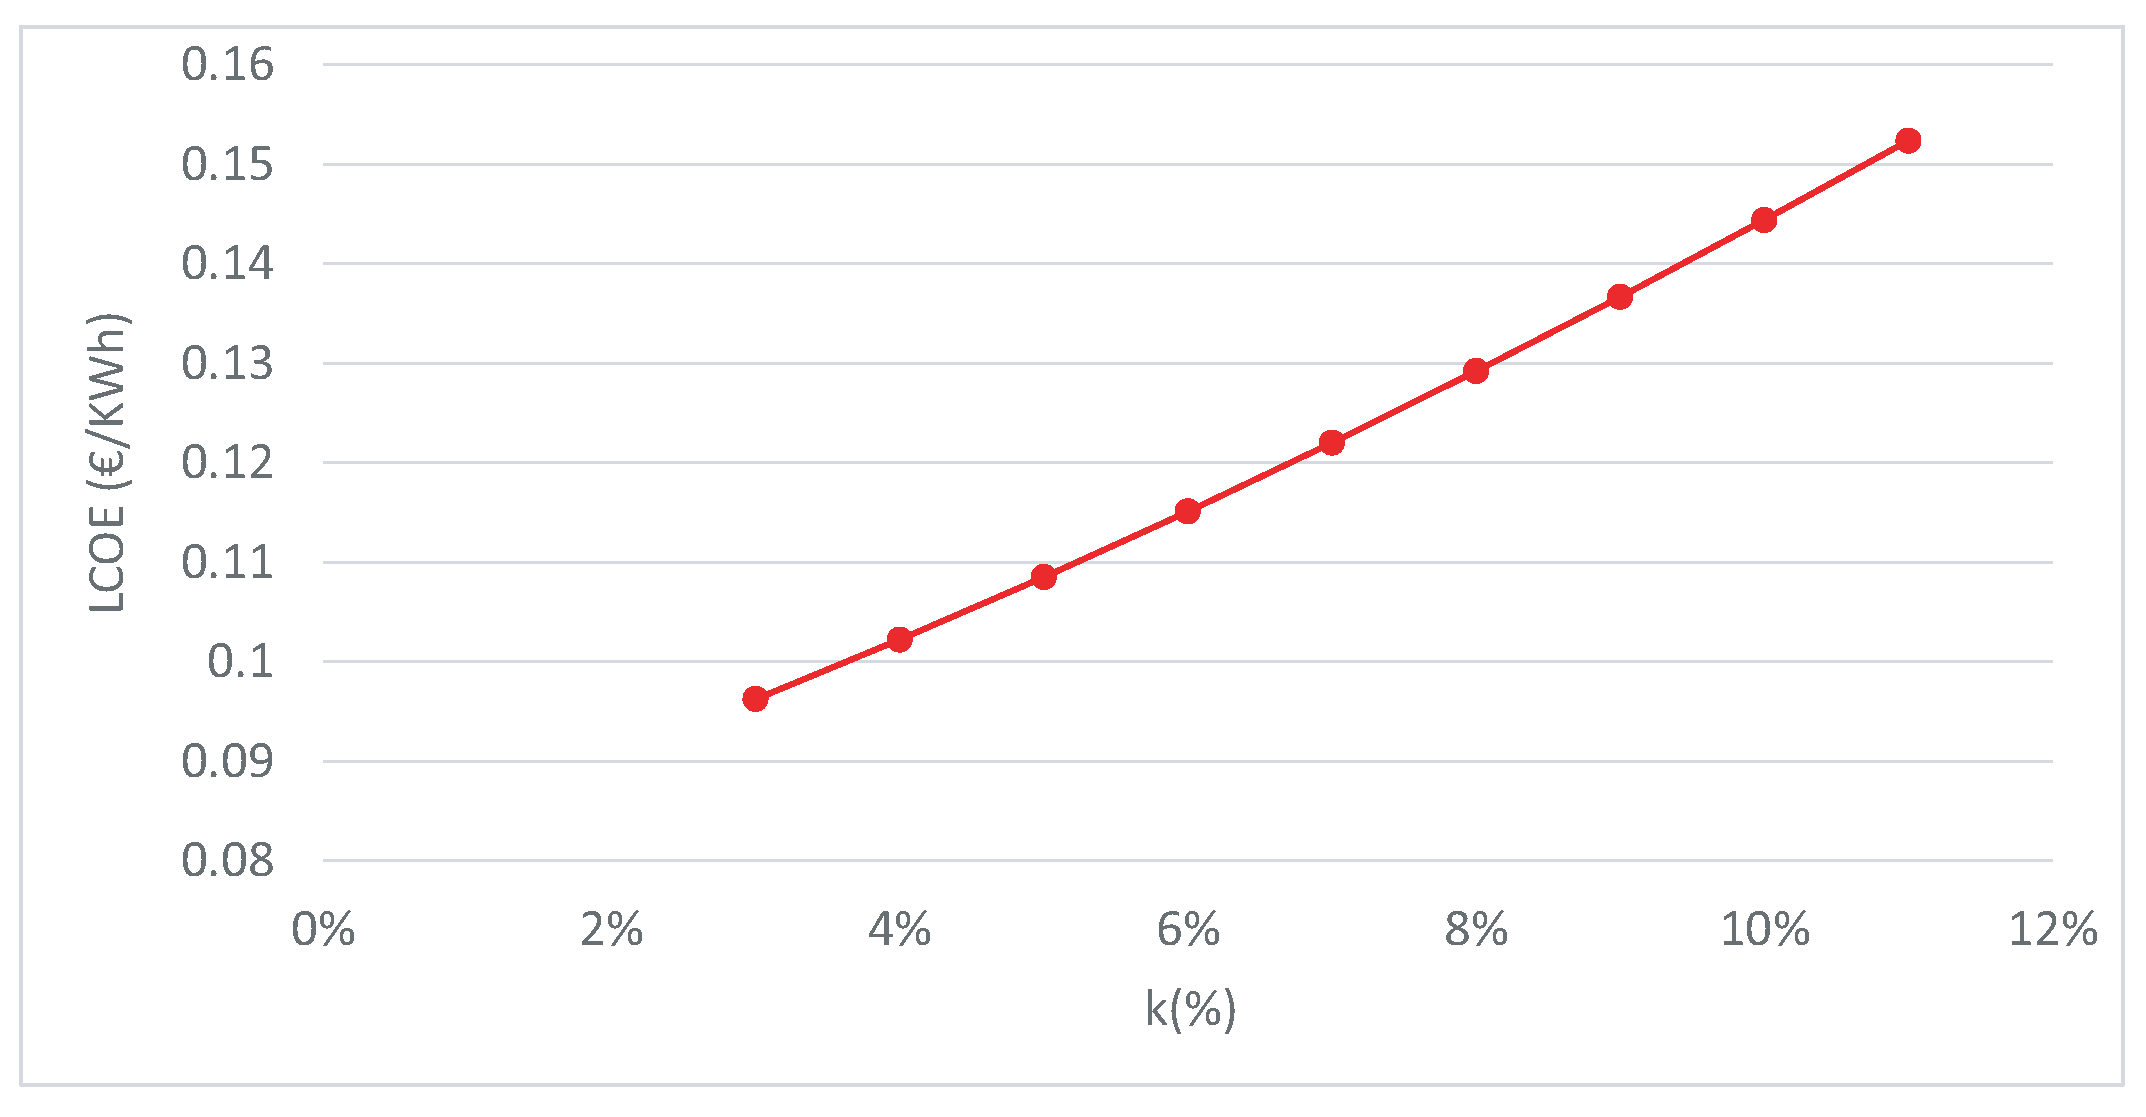
2.8.4. Levelized Cost of Energy
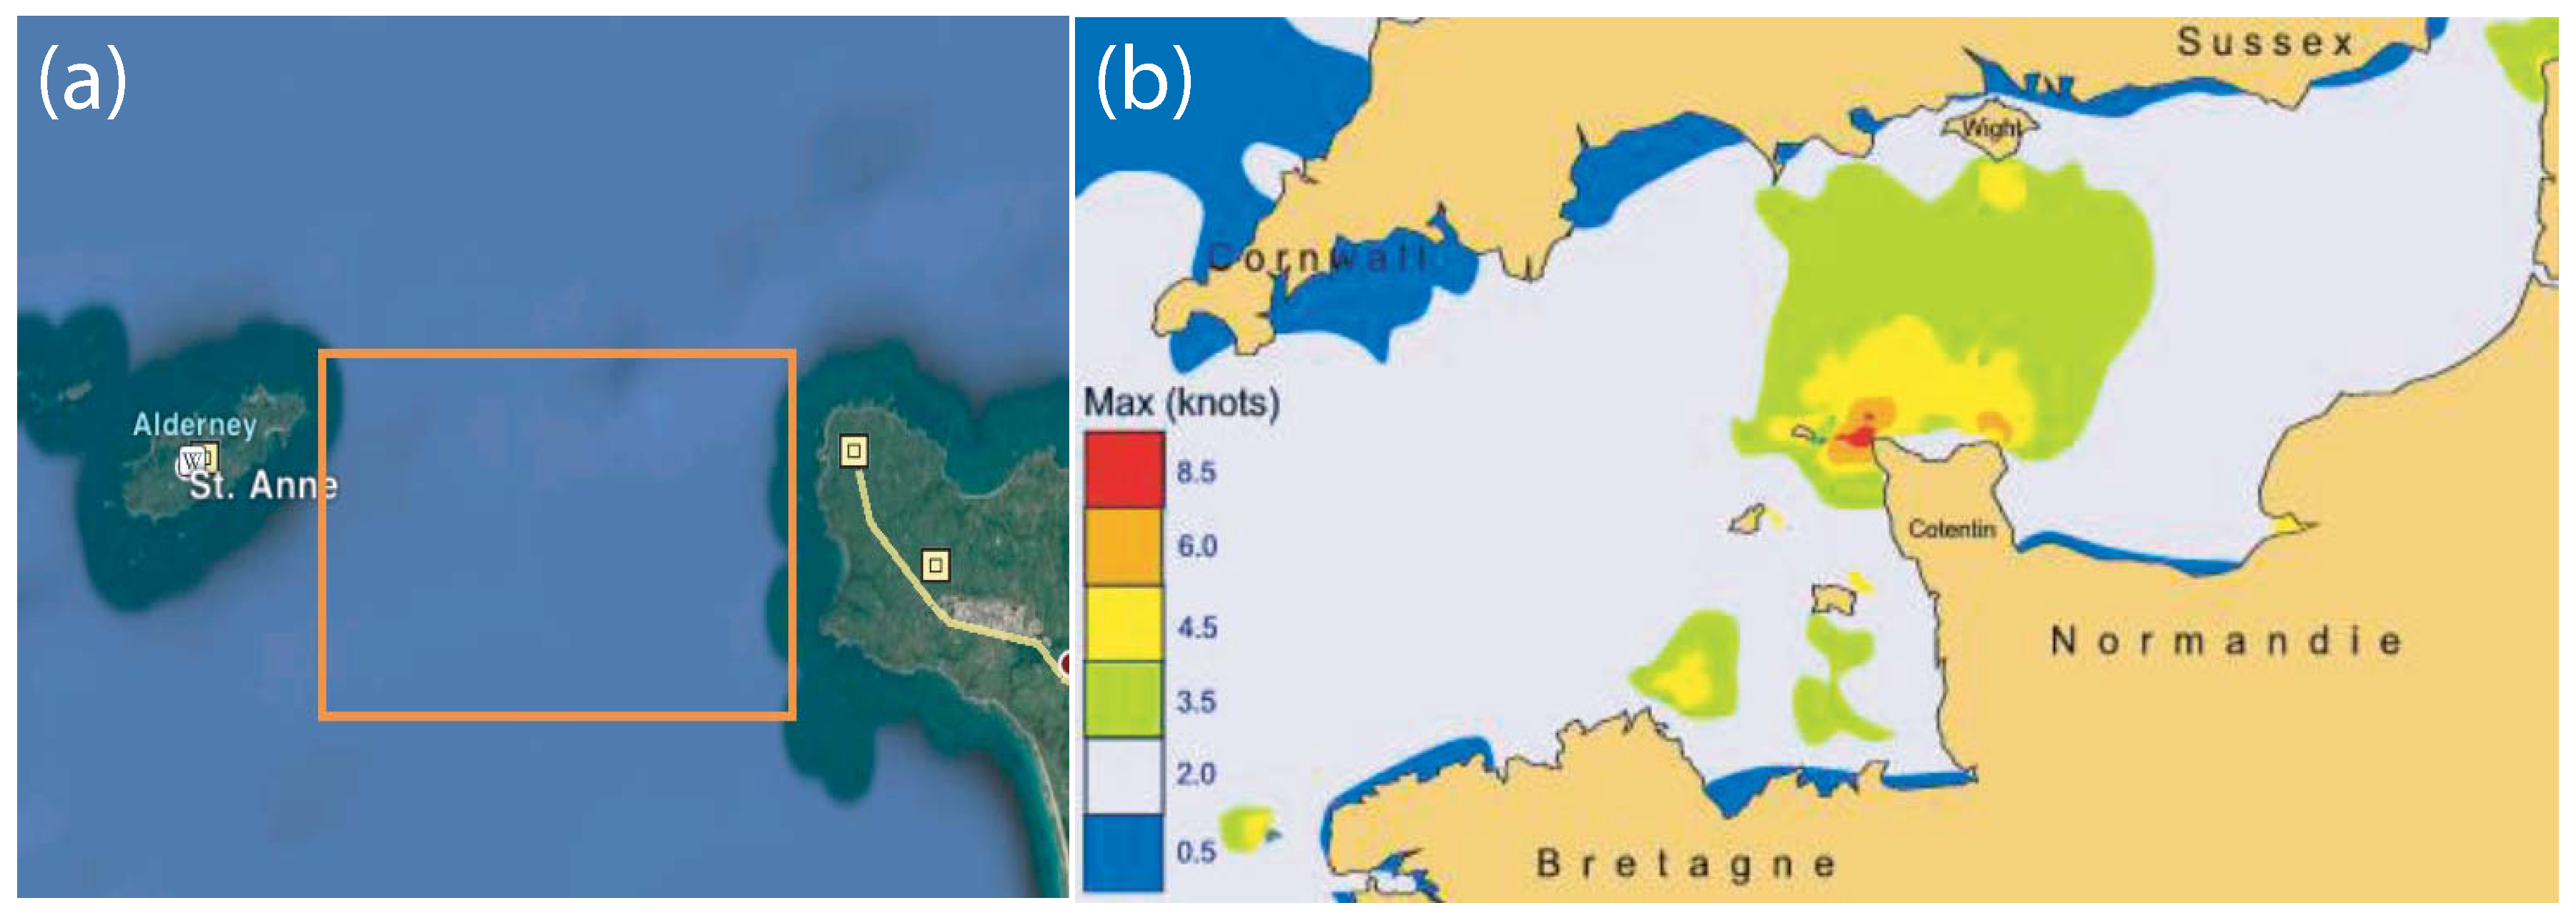
3. Case Study in the Alderney Race
3.1. The Alderney Race
3.2. Configuration of the Proposed First Generation Tidal Farm
3.3. Installation Procedures
3.3.1. Previous Considerations
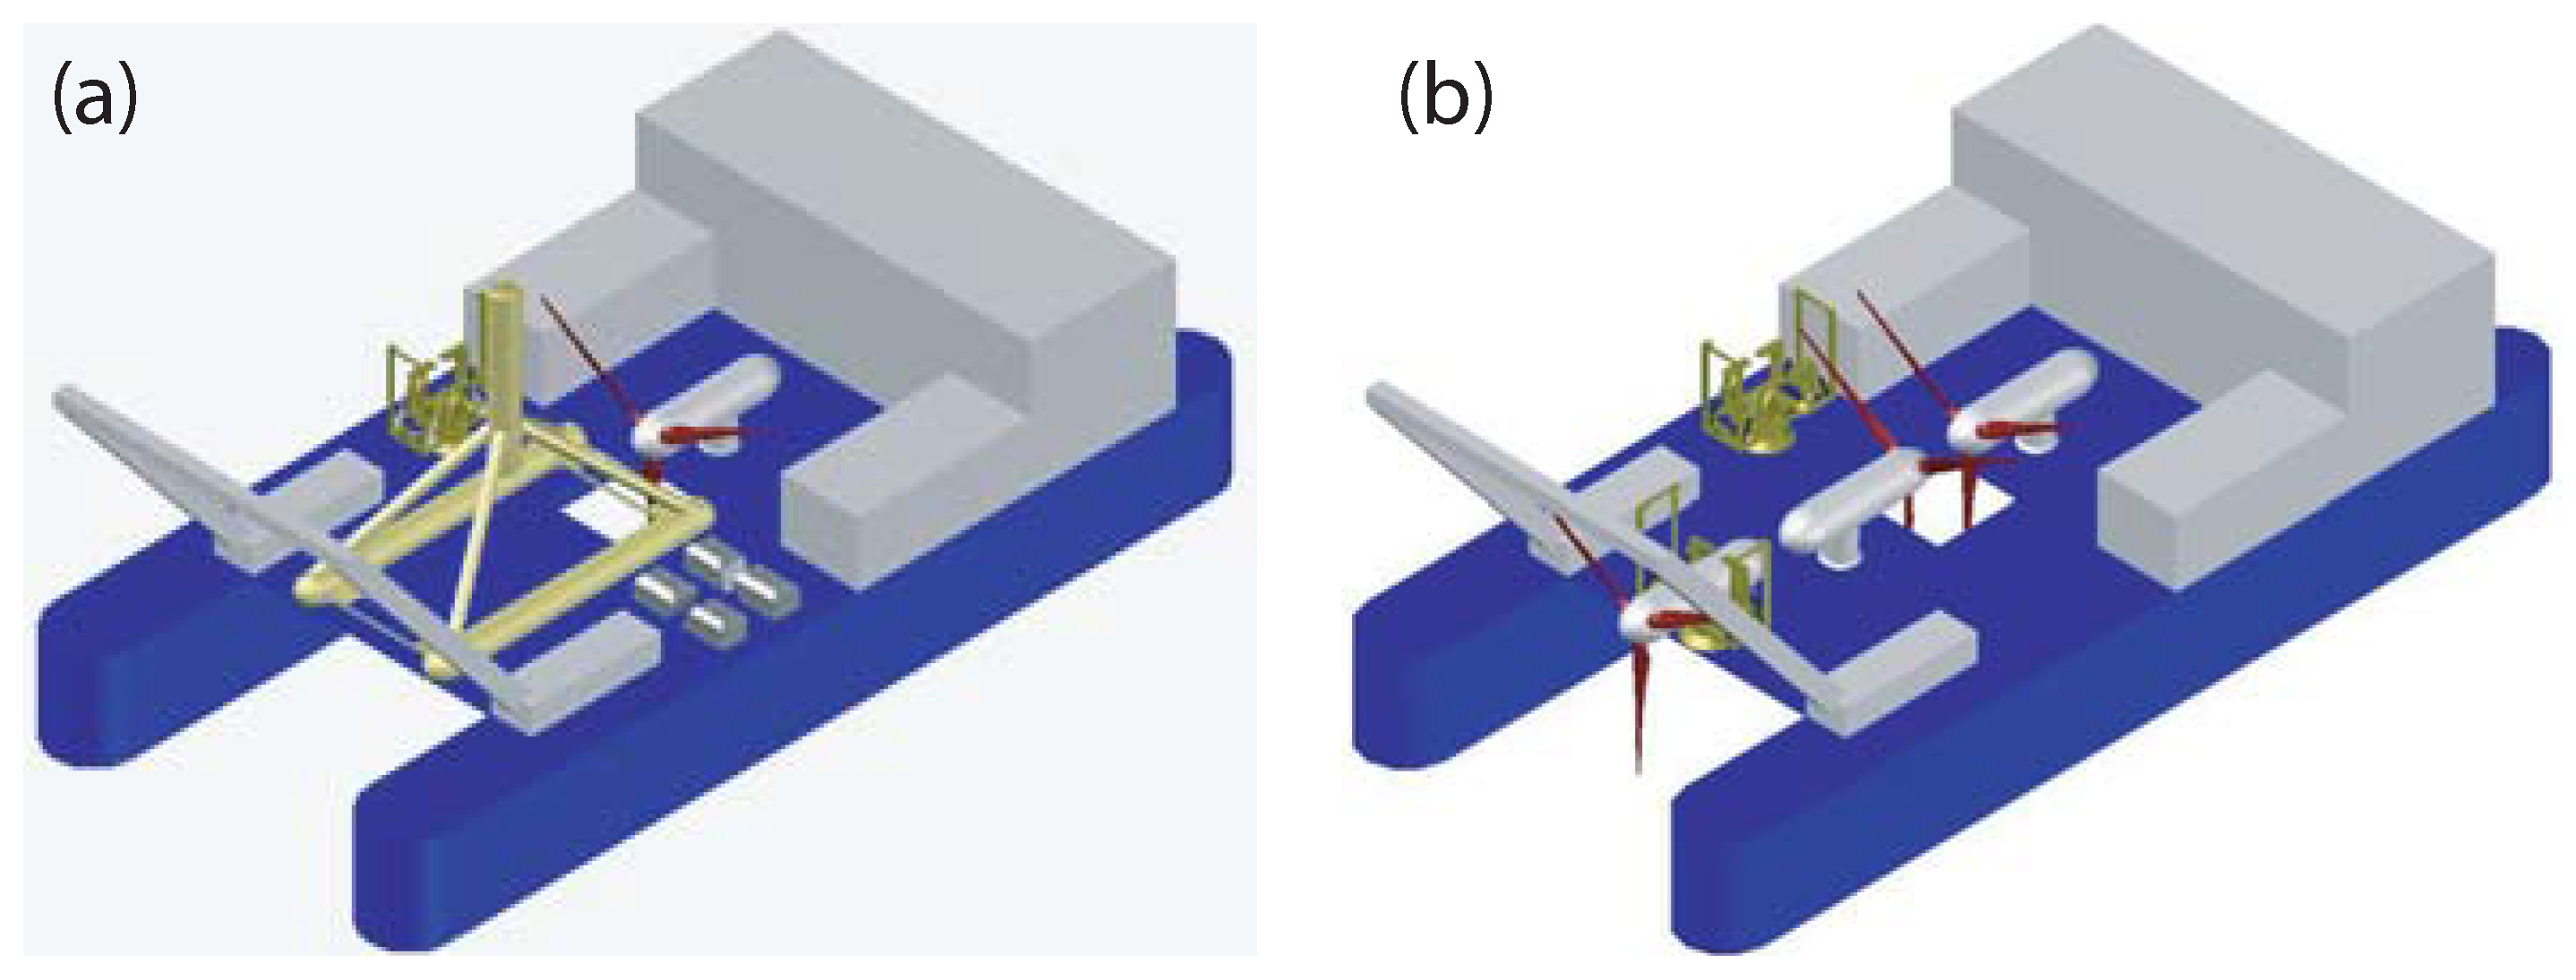
- Vessels: We have selected the HF4 vessel designed by MojoMaritime® for this purpose. This vessel is characterized by its dynamic positioning and the fact that it is able to work under extreme conditions. The use of this vessel makes it possible to obtain larger weather windows for the development of the installation and O&M procedures and, consequently, helps substantially reduce the total life-cycle costs. An additional advantage of the vessel selected is that it allows the transportation of all the equipment required to install one TEC or the transportation of three nacelles at the same time (see Figure 7), which helps reduce the maintenance tasks.
- Base port: The port selected for its operative qualities is the Port of Cherburg in France. The distance from the base port to the location of the tidal farm is approximately 39 km. This distance, although small, cannot be ignored since, owing to the nominal velocity of the vessel selected (14 knots), it would spend 1.5 h on the displacements.
- Weather windows: Bearing the vessel characteristics and the climatological considerations in mind, we have obtained the percentages of time during which operations can be performed in each season. These are the following: (a) spring: 75% (68 days); (b) summer: 95% (87 days); (c) autumn: 50% (46 days); and (d) winter: 15% (14 days). These percentages show that it is possible to operate around 215 days a year, which is sufficient time to satisfy the installation and maintenance procedures of the tidal farm.
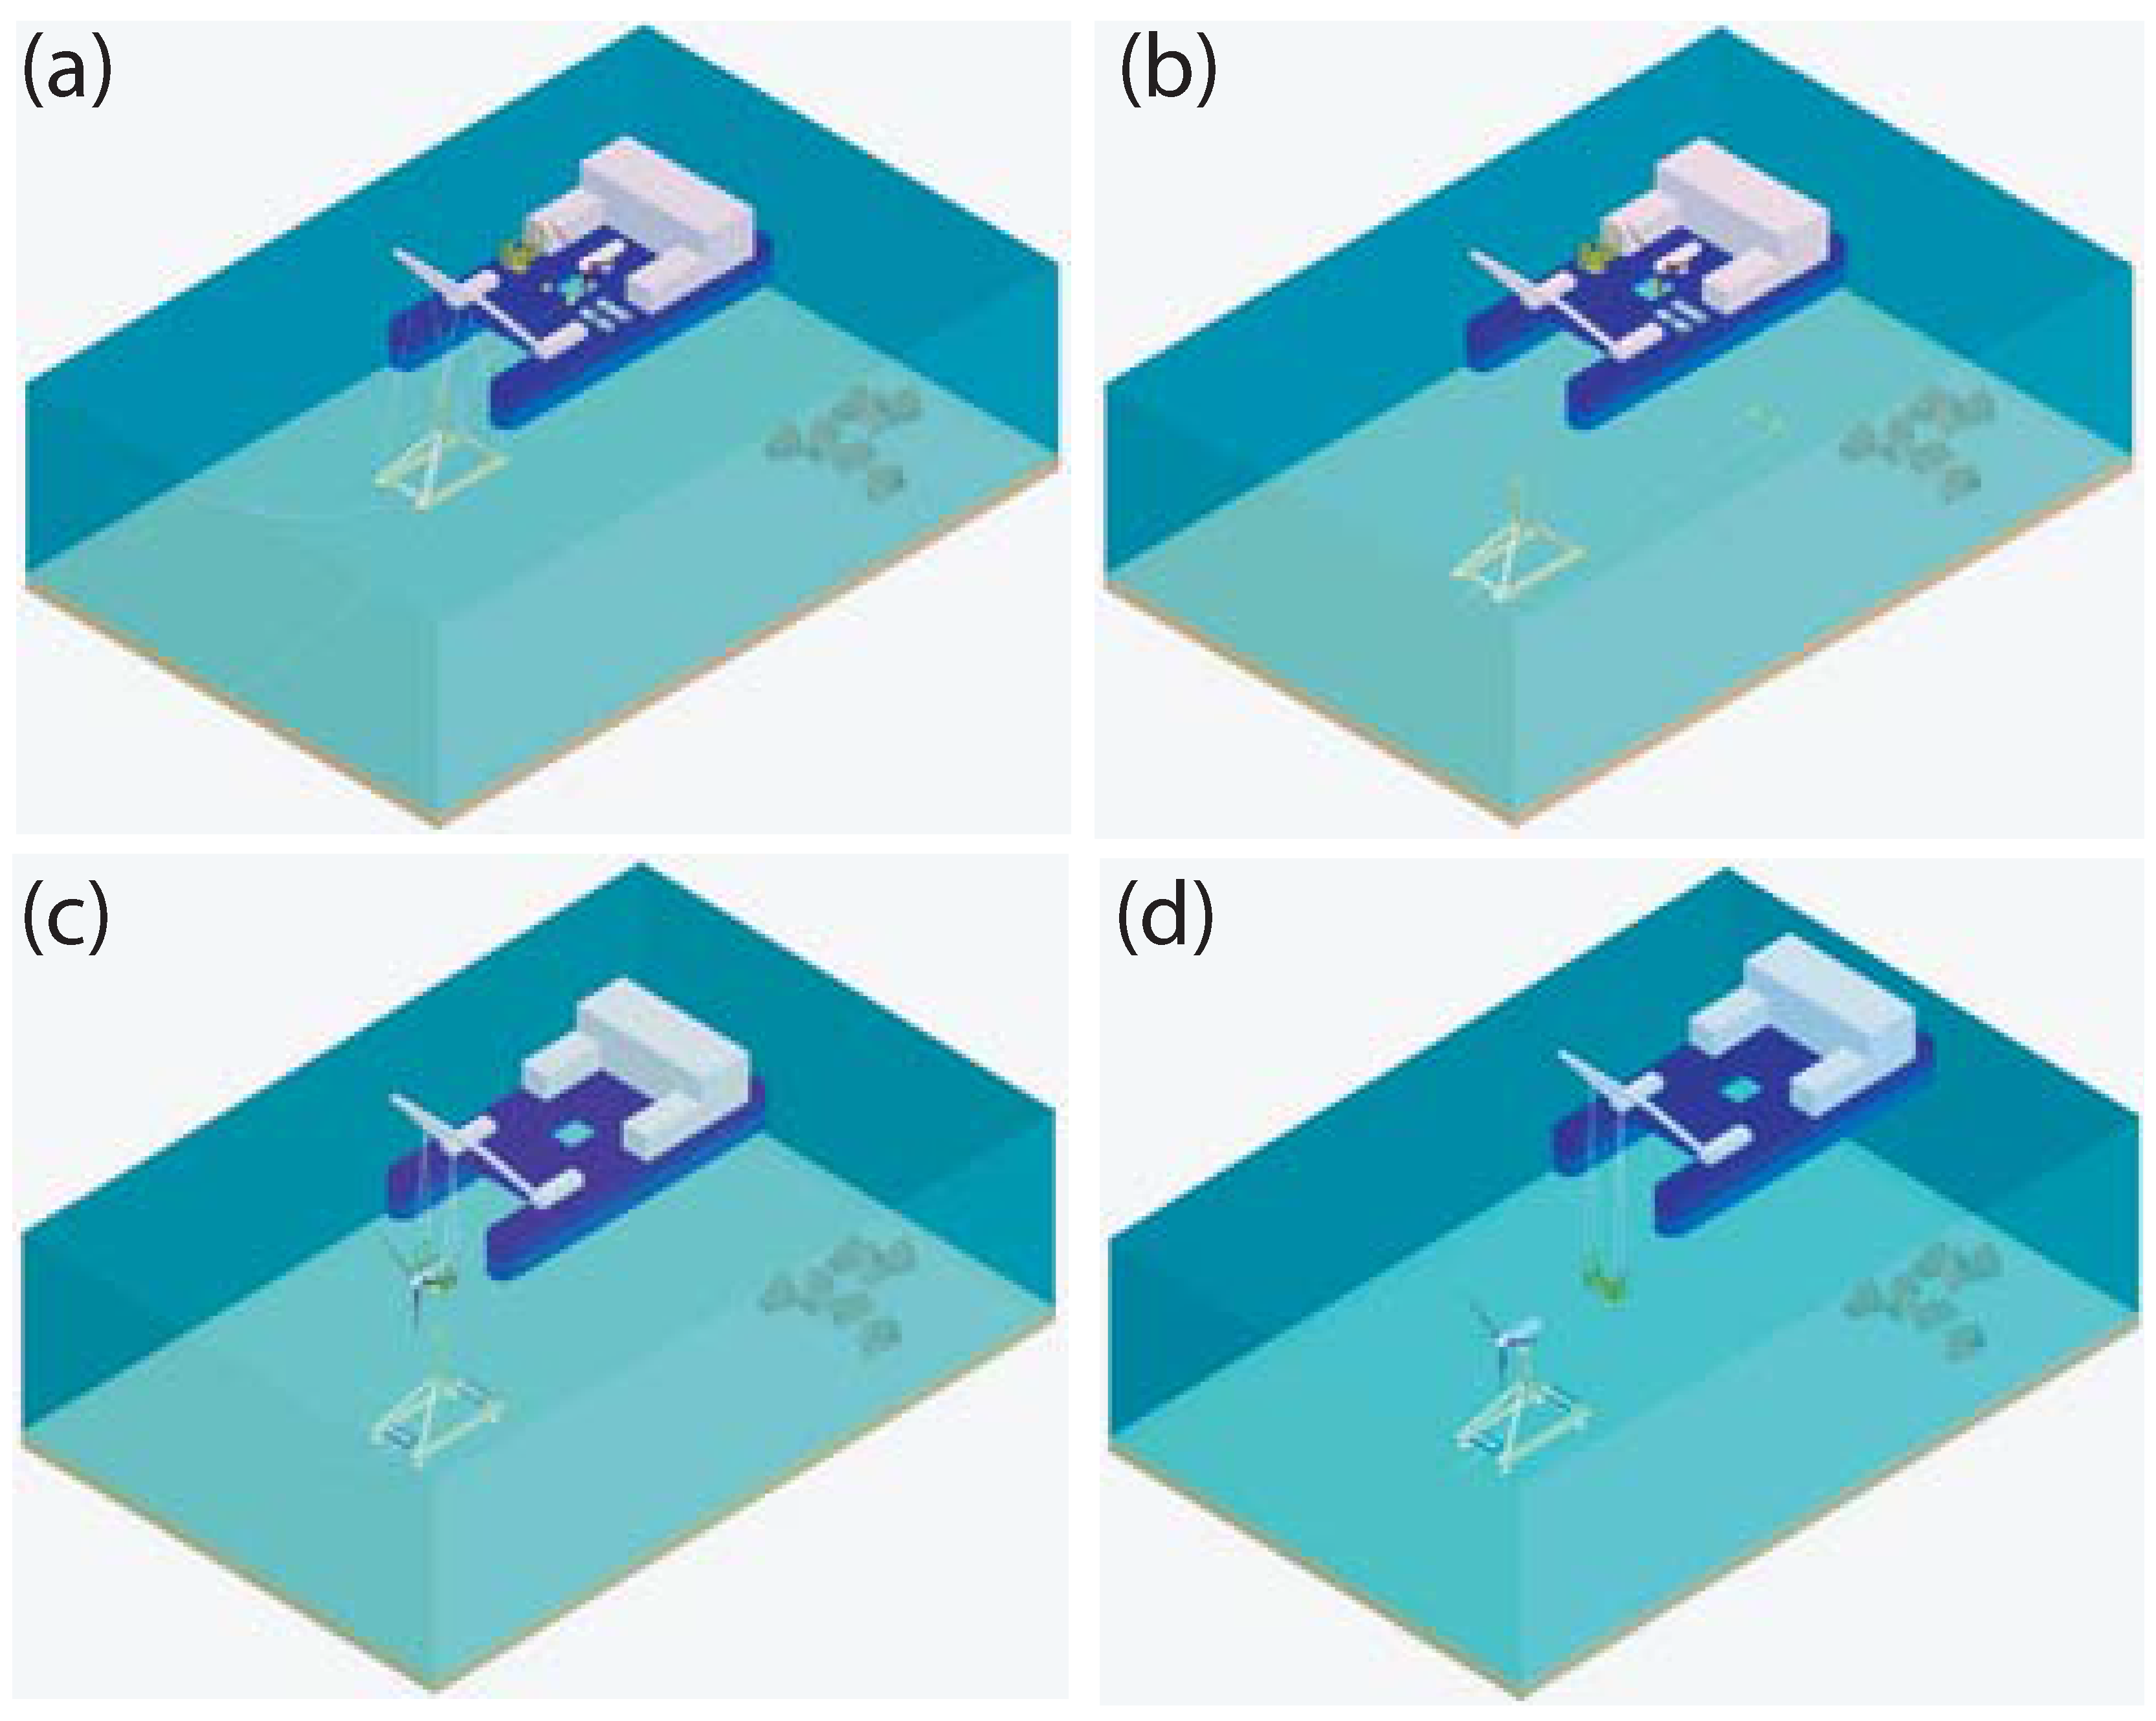
3.3.2. Installation Sequence
3.4. Maintenance Procedures
3.4.1. Blade Cleaning
3.4.2. Light Preventive Maintenance
3.4.3. High Preventive Maintenance
3.4.4. Corrective Maintenance
3.5. Annual Energy Produced
4. Numerical Results
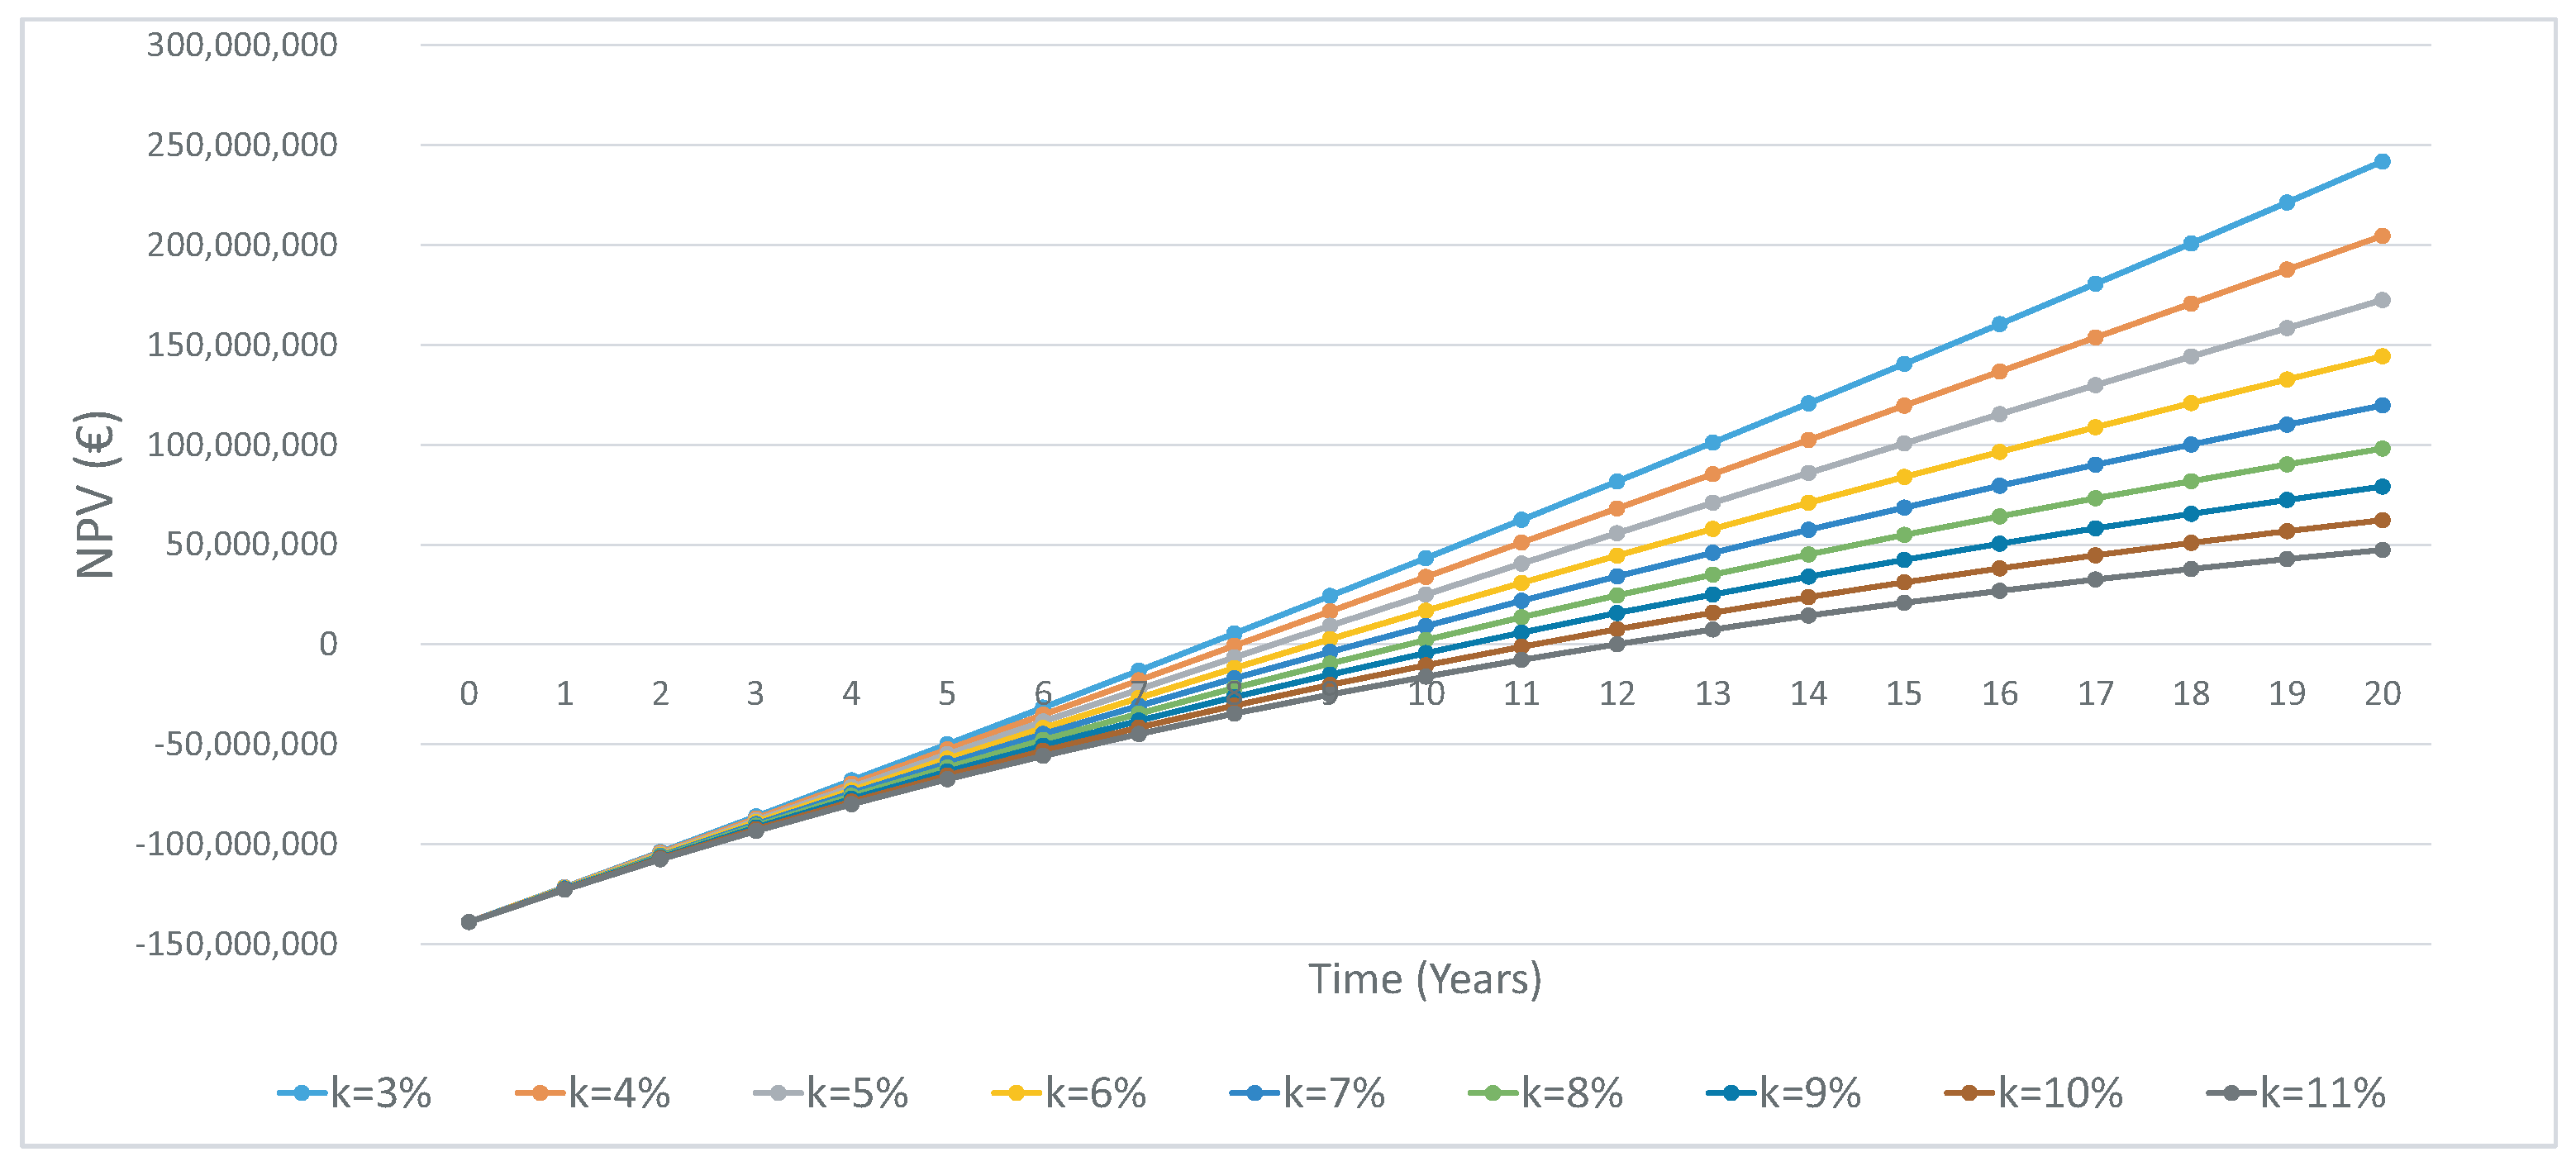
- Although the current inflation values are lower than normal (typical values are between 1% and 3%), in this study, a value of 2% has been considered for the rate of inflation. This term is taken into consideration in the computation of the cash-flows through the use of the following expression [58]:where i denotes the inflation rate and represents the nominal annual discount rate.
- In order to attain the cash-flows, the electric tariff considered is 0.09 €/kWh, and this increases by 1.5% every year.
- All the costs are increased by 1.5% each year.
- The service life of the tidal farm considered is 20 years, although, as explained previously, if conditions for the continuation of its exploitation are favorable, it could last up to five more years.
5. Conclusions
Acknowledgments
Author Contributions
Conflicts of Interest
Appendix A. Values of the Variables Used in the Case Study

| Variable | Concept | Value | Units |
|---|---|---|---|
| Market research costs | 250,000 | € | |
| Cost of certificates and surveys | 4,000,000 | € | |
| Cost per m of the surfaces of the farm | 2.0 | €/m | |
| Surface of the tidal energy farm in m | 1,000,000 (1000 m width × 1000 m length) | m | |
| Cost of conception and design analysis | 600,000 | € | |
| Cost of project requirements specifications | 500,000 | € | |
| Cost of design and development | 200,000 | € | |
| Number of TECs manufactured | 43 | ||
| Cost per kg of the carbon steel manufactured for the structure of the nacelle | 8.0 | €/kg | |
| Mass of the structure of the nacelle | 23,830 | kg | |
| Cost per kg of the manufactured carbon steel for the PTO frame | 4.0 | €/kg | |
| Mass of the PTO frame | 3600 | kg | |
| Cost per kg of the manufactured fiberglass for the fairing | 10.0 | €/kg | |
| Mass of the fairing | 1240 | kg | |
| Power of each TEC | 1.2 | MW | |
| Cost per MW of the thrust bearing | 40,000 | €/MW | |
| Cost per MW of the brake system | 2000 | €/MW | |
| Cost per MW of the electrical generator | 180,000 | €/MW | |
| Cost per MW of the gearbox | 35,000 | €/MW | |
| Cost per MW of the high-speed shaft | 3000 | €/MW | |
| Cost per kg of the yaw system | 12 | €/kg | |
| Mass of the yaw system | 60 | kg | |
| Cost per MW of the cooling system | 15,000 | €/MW | |
| Cost per MW of the pressure oil system | 15,000 | €/MW | |
| Cost per MW of the condition monitoring system | 110,000 | €/MW | |
| Cost per kg of the protection and connection switches | 12 | €/kg | |
| Mass of the protection and connection switches | 124 | kg | |
| Cost per kg of the control system | 12 | €/kg | |
| Mass of the control system | 30 | kg | |
| Cost per kg of the bilge system | 12 | €/kg | |
| Mass of the bilge system | 260 | kg | |
| Cost per kg of the compressed air system | 12 | €/kg | |
| Mass of the compressed air system | 110 | kg | |
| Cost per kg of the circuit board | 12 | €/kg | |
| Mass of the circuit board | 90 | kg | |
| Cost per kg of the added elements | 3 | €/kg | |
| Mass of the added elements | 1000 | kg | |
| Number of blades per TEC | 3 | ||
| Radius of the rotor | 10 | m | |
| Cost per m of each blade | 40 | €/m | |
| Cost per m of the pitch system | 500 | €/m | |
| Cost per m of the core of the rotor | 1000 | €/m | |
| Cost per m of the low-speed shaft | 500 | €/kg | |
| Number of TECs installed | 42 | ||
| Cost per kg of the base support of the TEC structure | 3 | €/kg | |
| Mass of the base support of the TEC structure | 87,200 | kg | |
| Cost per kg of the transition structure of the TEC | 3 | €/kg | |
| Mass of the transition structure of the TEC | 39,500 | kg | |
| Cost per kg of the vertical column of the TEC | 3 | €/kg | |
| Mass of the vertical column of the TEC | 29,800 | kg | |
| Number of concrete ballast per TEC | 2 | ||
| Cost per kg of the elaborated concrete of the ballast | 0.2 | €/kg | |
| Mass of the concrete of the ballast | 113,200 | kg | |
| Number of special concrete bags per TEC | 4 | ||
| Cost per kg of the special concrete bags | 0.3 | €/kg | |
| Mass of the special concrete bags | 6300 | kg | |
| Cost per MW of the protection switch | 25,000 | €/MW | |
| Cost per kg of the submarine connector | 25 | €/kg | |
| Mass of the submarine connector | 300 | kg | |
| Cost per kg of the submarine connector installed in the base of the TEC | 12 | €/kg | |
| Mass of the submarine connector installed in the base of the TEC | 300 | kg | |
| Cost per kg of the internal wiring | 12 | €/kg | |
| Mass of the internal wiring | 150 | kg | |
| Cost per kg of the connection box | 12 | €/kg | |
| Mass of the connection box | 150 | kg | |
| Cost per m of the umbilical cables | 250 | €/m | |
| Length of the umbilical cables | 11,350 | m | |
| Cost per MW of the rectifiers | 100,000 | €/MW | |
| Cost per MW of the inverters | 100,000 | €/MW | |
| Cost per MW of the electrical boxes | 20,000 | €/MW | |
| Number of transformers per TEC | 4 | ||
| Cost per MW of the transformers | 40,000 | €/MW | |
| Mass of the transformation platform | 4,000,000 | kg | |
| Cost per kg of the transformation platform | 3 | €/kg | |
| Number of submarine exportation cables | 2 | ||
| Cost per m of the submarine exportation cables | 500 | €/m | |
| Length of the submarine exportation cables | 11,000 | m | |
| Cost per m of the ground exportation cables | 150 | €/m | |
| Length of the ground exportation cables | 5000 | m | |
| Cost of leasing the vessels (installation of the transformation platform) | 2,900,000 | € | |
| Cost of technical labor (installation of the transformation platform) | 300,000 | € | |
| Cost of operations in the port (installation of the transformation platform) | 500,000 | € | |
| Cost of leasing the vessels (installation of the submarine cables) | 3,150,000 | € | |
| Cost of technical labor (installation of the submarine cables) | 150,000 | € | |
| Cost of operations in the port (installation of the submarine cables) | 300,000 | € | |
| Cost of leasing the vessels (installation of the ground exportation cable) | 3,150,000 | € | |
| Cost of technical labor (installation of the ground exportation cable) | 150,000 | € | |
| Cost of operations in the port (installation of the ground exportation cable) | 300,000 | € | |
| Cost of leasing the vessels (installation of the TECs) | 14,700,000 | € | |
| Cost of technical labor (installation of the TECs) | 700,000 | € | |
| Cost of operations in the port (installation of the TECs) | 1,400,000 | € | |
| Transport costs (blade cleaning) | 81,120 | € | |
| Labor costs (blade cleaning) | 4080 | € | |
| Cost incurred as result of production losses (blade cleaning) | 1256.4 | € | |
| Transport costs (light preventive maintenance) | 533,512.45 | € | |
| Labor costs (light preventive maintenance) | 53,659.63 | € | |
| Material costs (light preventive maintenance) | 142,293.45 | € | |
| Cost incurred as result of production losses (light preventive maintenance) | 32,394.14 | € | |
| Transport costs (high preventive maintenance) | 777,458.31 | € | |
| Labor costs (high preventive maintenance) | 39,454.02 | € | |
| Material costs (high preventive maintenance) | 22,1784.22 | € | |
| Cost incurred as result of production losses (high preventive maintenance) | 25,669.26 | € | |
| Transport costs (corrective maintenance) | 197,122.85 | € | |
| Labor costs (corrective maintenance) | 7068.15 | € | |
| Material costs (corrective maintenance) | 0 | € | |
| Cost incurred as result of production losses (corrective maintenance) | 10,918.47 | € |
References
- Fernández, L. A diversified portfolio: Joint management of non-renewable and renewable resources offshore. Resour. Energy Econ. 2005, 27, 65–82. [Google Scholar] [CrossRef]
- Considine, T.J.; Heo, E. Price and inventory dynamics in petroleum product markets. Energy Econ. 2000, 22, 527–548. [Google Scholar] [CrossRef]
- Castro-Santos, L.; Prado, G.; Díaz-Casas, V. Methodology to study the life cycle cost of floating offshore wind farms. In Proceedings of the 10th Deep Sea Wind R&D Conference, Trondheim, Norway, 24–25 January 2013. [Google Scholar]
- Directive 2009/28/EC of the European Parliament and of the Council of 23 April 2009 on the promotion of the use of energy from renewable sources and amending and subsequently repealing directives 2001/77/EC and 2003/30/EC. Official Journal of the European Union, 5 June 2009; 16–60.
- Orlandini, V.; Pierobon, L.; Schløer, S.; De Pascale, A. Dynamic performance of a novel offshore power system integrated with a wind farm. Energy 2016, 109, 236–247. [Google Scholar] [CrossRef]
- Bacelli, G.; Coe, R.G.; Patterson, D.; Wilson, D. System Identification of a Heaving Point Absorber: Design of Experiment and Device Modeling. Energies 2017, 10, 472. [Google Scholar] [CrossRef]
- Luo, Y.; Liu, X.; Wang, Z.; Xiao, Y.; He, C.; Zhang, Y. Optimization of the Runner for Extremely Low Head Bidirectional Tidal Bulb Turbine. Energies 2017, 10, 787. [Google Scholar] [CrossRef]
- Younesian, D.; Alam, M.-R. Multi-stable mechanisms for high-efficiency and broadband ocean wave energy harvesting. Appl. Energy 2017, 197, 292–302. [Google Scholar] [CrossRef]
- Stegman, A.; de Andres, A.; Jeffrey, H.; Johanning, L.; Bradley, S. Exploring Marine Energy Potential in the UK Using a Whole Systems Modelling Approach. Energies 2017, 10, 1251. [Google Scholar] [CrossRef]
- Giorgi, S.; Ringwood, J.V. Can Tidal Current Energy Provide Base Load? Energies 2013, 6, 2840–2858. [Google Scholar] [CrossRef]
- MacGillivray, A.; Jeffrey, H.; Hanmer, C.; Magagna, D.; Raventos, A.; Badcock-Broe, A. Ocean Energy Technology: Gaps and Barriers; Strategic Initiative for Ocean Energy (SI Ocean): Brussels, Belgium, 2013. [Google Scholar]
- Badcock-Broe, A.; Flynn, R.; George, S.; Gruet, R.; Medic, N. Wave and Tidal Energy Market Deployment Strategy for Europe; Strategic Initiative for Ocean Energy (SI Ocean): Brussels, Belgium, 2014. [Google Scholar]
- Mofor, L.; Goldsmith, J.; Jones, F. Ocean Energy. Technology Readiness, Patents, Deployment Status and Outlook; International Renewable Energy Agency (IRENA): Abu Dhabi, UAE, 2014. [Google Scholar]
- Mofor, L.; Goldsmith, J.; Jones, F. Annual Report-2014. Implementing Agreement on Ocean Energy Systems; Ocean Energy Systems, International Energy Agency OES-IEA: Lisboa, Portugal, 2014. [Google Scholar]
- Somolinos, J.A.; López, A.; Núñez, L.R.; Morales, R. Dynamic model and experimental validation for the control of emersion maneuvers of devices for marine currents harnessing. Renew. Energy 2017, 107, 333–345. [Google Scholar] [CrossRef]
- Morris, C.E.; O’Doherty, D.M.; O’Doherty, T.; Mason-Jones, A. Kinetic energy extraction of a tidal stream turbine and its sensitivity to structural stiffness attenuation. Renew. Energy 2016, 88, 30–39. [Google Scholar] [CrossRef]
- O’Connor, M.; Lewis, T.; Dalton, G. Operational expenditure costs for wave energy projects and impacts on financial returns. Renew. Energy 2013, 50, 1119–1131. [Google Scholar] [CrossRef]
- Mueller, M.; Wallace, R. Enabling science and technology for marine renewable energy. Energy Policy 2008, 36, 4376–4382. [Google Scholar] [CrossRef]
- Segura, E.; Morales, R.; Somolinos, J.A.; López, A. Techno-economic challenges of tidal energy conversion systems: Current status and trends. Renew. Sustain. Energy Rev. 2017, 77, 536–550. [Google Scholar] [CrossRef]
- Trapero, J.R.; Horcajada, L.; Linares, J.J.; Lobato, J. Is microbial fuel cell technology ready? An economic answer towards industrial commercialization. Appl. Energy 2017, 185, 698–707. [Google Scholar] [CrossRef]
- Castro-Santos, L.; Díaz-Casas, V. Life-cycle cost analysis of floating offshore wind farms. Renew. Energy 2014, 16, 41–48. [Google Scholar]
- Castro-Santos, L.; Díaz-Casas, V. Sensitivity analysis of floating offshore wind farms. Energy Convers. Manag. 2015, 101, 271–277. [Google Scholar] [CrossRef]
- Magagna, D.; Uihlein, A. Ocean energy development in Europe: Current status and future perspectives. Int. J. Mar. Energy 2015, 11, 84–104. [Google Scholar] [CrossRef]
- Kleyner, A.; Sandborn, P. Minimizing life cycle cost by managing product reliability via validation plan and warranty return cost. Int. J. Prod. Econ. 2008, 112, 796–807. [Google Scholar] [CrossRef]
- Wee, H.; Lee, M.; Yu, J.C.P. Optimal replenishment policy for a deteriorating green product: Life cycle costing analysis. Int. J. Prod. Econ. 2011, 133, 603–611. [Google Scholar] [CrossRef]
- Castro-Santos, L.; Filgueira-Vizoso, A.; Carral-Couce, L.; Fragela-Formoso, J.A. Economic feasibility of floating offshore wind farms. Energy 2016, 112, 868–883. [Google Scholar] [CrossRef]
- Radfar, S.; Panahi, R.; Javaherchi, T.; Filim, S.; Mazyaki, A.R. A comprehensive insight into tidal stream energy farms in Iran. Renew. Sustain. Energy Rev. 2017, 79, 323–338. [Google Scholar] [CrossRef]
- Neary, V.S.; Lawson, M.; Previsic, M.; Copping, A.; Hallett, K.C.; LaBonte, A.; Rieks, J.; Murray, D. Methodology for design and economic analysis of marine energy conversion (MEC) technologies. In Proceedings of the 2nd Marine Energy Technology Symposium (METS2014), Seattle, WA, USA, 15–18 April 2014. [Google Scholar]
- Maslov, N.; Charpentier, J.-F.; Claramunt, C. A modelling approach for a cost-based evaluation of the energy produced by a marine energy farm. Int. J. Mar. Energy 2015, 9, 1–19. [Google Scholar] [CrossRef]
- National Standards Authority of Ireland. Dependability Management Part 3-3: Application Guide—Life Cycle Costing; IEC 60300-3-3:2004; National Standards Authority of Ireland: Ireland, UK, 2004. [Google Scholar]
- Barringer, H.P. A Life Cycle Cost Summary. In Proceedings of the International Conference of Maintenance Societies (ICOMS 2003), Perth, Australia, 20–23 May 2003; pp. 1–10. [Google Scholar]
- Fabrycky, W.; Blanchard, B. A Life Cycle Cost Summary. In Life-Cycle Cost and Economic Analysis; Prentice-Hall: Upper Saddle River, NJ, USA, 1991. [Google Scholar]
- Dhillon, B.S. Life-Cycle Costing for Engineers; CRC Press, Taylor and Francis Group: Boca Raton, FL, USA, 2010. [Google Scholar]
- Vail Farr, J. Systems Life Cycle Costing—Economic Analysis, Estimation and Management; CRC Press, Taylor and Francis Group: Boca Raton, FL, USA, 2011. [Google Scholar]
- Fingersh, L.; Hand, M.; Laxson, A. Wind Turbine Design Cost and Scaling Model; NREL/TP-500-40566; National Renewable Energy Laboratory: Golden, CO, USA, 2006.
- Ricci, P.; López, J.; Villate, J.L.; Stallard, T. Deliverable D7.1. Summary of Attributes of Cost Models Used by Different Stakeholders; Commission of the European Communities: Brussels, Belgium, 2009. [Google Scholar]
- Acorn Bearings Web Page. 2017. Available online: www.acornbearings.co.uk/price-lists/skf/page/12 (accessed on 15 August 2017).
- BVG Associates. A Guide to an Offshore Wind Farm; The Crown Estate: London, UK, 2010. [Google Scholar]
- Astariz, S.; Iglesias, G. The economics of wave energy: A review. Renew. Sustain. Energy Rev. 2015, 45, 397–408. [Google Scholar] [CrossRef]
- Lyding, P.; Faulstich, S.; Hahn, B.; Callies, D. Offshore–WMEP: Monitoring offshore wind energy use European Offshore Wind. In Proceedings of the European Offshore Wind 2009 Conference & Exhibition, Stockholm, Sweden, 14–16 September 2009. [Google Scholar]
- Abdulla, K.; Skelton, J.; Doherty, K.; O’Kane, P.; Doherty, R.; Bryans, G. Statistical Availability Analysis of Wave Energy Converters. In Proceedings of the The Twenty-first International Offshore and Polar Engineering Conference, Maui, HI, USA, 19–24 June 2011; pp. 572–578. [Google Scholar]
- Brook, J. Wave Energy Conversion; Elsevier Ltd: Oxford, UK, 2003. [Google Scholar]
- O&M Aspects of the 500 MW Offshore Wind Farm at NL7. Available online: https://www.ecn.nl/fileadmin/ecn/units/wind/docs/dowec/10090_001.pdf (accessed on 15 August 2017).
- Obdam, T.; Braam, H.; Van De Pieterman, R.; Rademakers, L. O&M Cost Estimation & Feedback of Operational Data, Wind Farm—Technical Regulations, Potential Estimation and Siting Assessment; InTech: Vienna, Austria, 2011. [Google Scholar]
- Carbon Trust. Oscillating water column wave energy converter evaluation report. In The Carbon Trust; ARuP: London, UK, 2005. [Google Scholar]
- The Irish Wind Energy Association (IWEA) Web Page. Available online: www.iwea.com/index.cfm/page/planning_regulationsandadminis (accessed on 15 August 2017).
- Det Norske Veritas (DNV). DNV–OS–J101 Design of Offshore Wind Turbine Structures; Det Norske Veritas: Hovik, Norway, 2010; pp. 1–142. [Google Scholar]
- ABPmer, Atlas for UK Marine Renewables. Available online: http://www.renewables-atlas.info/ (accessed on 15 August 2017).
- Winter, A. Speed Regulated Operation for Tidal Turbines with Fixed Pitch Rotors. In Proceedings of the IEEE Oceans Conference, Waikoloa, HI, USA, 19–22 September 2011. [Google Scholar]
- Rathmann, O.; Frandsen, S.; Barthelmie, R. Wake modeling for intermediate and large wind farms. In Proceedings of the EWEC 2007 Wind Energy Conference and Exhibition, Milan, Italy, 7–10 May 2007. Paper BL3.199. [Google Scholar]
- Sun, X.; Chick, J.P.; Bryden, I.G. Laboratory-scale simulation of energy extraction from tidal currents. Renew. Energy 2008, 33, 1267–1274. [Google Scholar] [CrossRef]
- Short, W.; Packey, D.; Holt, T. A Manual for the Economic Evaluation of Energy Efficiency and Renewable Energy Technologies; NREL/TP-462-5173; National Renewable Energy Laboratory: Golden, CO, USA, 1995.
- Ouyang, X.; Lin, B. Levelized Cost of Electricity (LCOE) of Renewable energies and required subsidies in China. Energy Policy 2014, 70, 64–73. [Google Scholar] [CrossRef]
- Castro-Santos, L.; Prado-García, G.; Estanqueiro, A.; Justino, P.A.P.S. The Levelized Cost of Energy (LCOE) of Wave Energy Usig GIS Based Analysis: The case study of Portugal. Int. J. Electr. Power Energy Syst. 2015, 65, 21–25. [Google Scholar] [CrossRef]
- Davey, T.; Harrison, G. Procedures for Economic Evaluation; Equitable Testing and Evaluation of Marine Energy Extraction Devices Deliverable D7.2.1; Commission of the European Communities: Brussels, Belgium, 2009. [Google Scholar]
- Levitt, A.; Kempton, W.; Smith, A.P.; Musial, W.; Firestone, J. Pricing offshore wind power. Energy Policy 2011, 39, 6408–6421. [Google Scholar] [CrossRef]
- Sánchez, G. Diseño de un Dispositivo Para el Aprovechamiento de la Energía de las Corrientes (DAEC) y su Integración en un Parque Marino. Master’s Thesis, Escuela Técnica Superior de Ingenieros Navales Universidad Politécnica de Madrid (ETSIN-UPM), Madrid, Spain, 2014. [Google Scholar]
- Davis Langdon Management Consulting. Towards a Common European Methodology for Life Cycle Costing (LCC)—Literature Review; Davis Langdon Management Consulting: London, UK, 2007. [Google Scholar]
- Fraenkel, P. Marine Current Turbines: Pioneering the Development of Marine Kinetic Energy Converters. Proc. Inst. Mech. Eng. Part A J. Power Energy 2007, 221, 159–169. [Google Scholar] [CrossRef]
- López, A.; Núñez, L.R.; Somolinos, J.A. Modelado energético de convertidores primarios para el aprovechamiento de las energías renovables marinas. Rev. Iberoam. Autom. Inform. Ind. 2011, 11, 224–235. [Google Scholar] [CrossRef]
- Morales, R.; Segura, E.; Somolinos, J.A.; Núñez, L.R.; Sira-Ramírez, H. Online signal filtering based on the algebraic method and its experimental validation. Mech. Syst. Signal Proc. 2016, 66, 374–387. [Google Scholar] [CrossRef]
- Somolinos, J.A.; López, A.; Portilla, M.P.; Morales, R. Dynamic model and control of a new underwater three-degree-of-freedom tidal energy converter. Math. Probl. Eng. 2015, 2015, 948048. [Google Scholar] [CrossRef]
- Morales, R.; Fernández, L.; Segura, E.; Somolinos, J.A. Maintenance Maneuver Automation for an Adapted Cylindrical Shape TEC. Energies 2016, 9, 746. [Google Scholar] [CrossRef]


| Cost Category | Total Value (€) | ||||
|---|---|---|---|---|---|
| Concept and Definition Costs () | 7,350,000 | ||||
| Design and Development Costs () | 200,000 | ||||
| Manufacturing Costs () | 103,613,935.88 | ||||
| Nacelle | 39,563,655.88 | ||||
| Supporting TEC Structure | 21,938,280 | ||||
| Export Power System | 42,112,000 | ||||
| Installation Costs () | 27,700 | ||||
| Transformation Platform and Converters | 3700 | ||||
| Submarine and Ground Exportation Cables | 7200 | ||||
| TECs | 16,800 | ||||
| O&M Costs () | 4,905,070.07 | ||||
| Material Costs | Transport Costs | Labor Costs | Production Losses Costs | ||
| Blade Cleaning | 0 | 81,120 | 4080 | 1256.40 | 86,456.4 |
| Light Preventive Maintenance | 142,293.45 | 533,512.45 | 53,659.63 | 32,394.14 | 761,859.67 |
| High Preventive Maintenance | 221,784.22 | 777,458.31 | 39,454.02 | 25,669.26 | 1,064,365.81 |
| Corrective Maintenance | 0 | 197,122.85 | 7068.15 | 10,918.47 | 215,109.47 |
| Insurance Costs and Fixed Expenses | 2,777,278.72 | ||||
| Decommissioning Costs () | 0 |
© 2017 by the authors. Licensee MDPI, Basel, Switzerland. This article is an open access article distributed under the terms and conditions of the Creative Commons Attribution (CC BY) license (http://creativecommons.org/licenses/by/4.0/).
Share and Cite
Segura, E.; Morales, R.; Somolinos, J.A. Cost Assessment Methodology and Economic Viability of Tidal Energy Projects. Energies 2017, 10, 1806. https://doi.org/10.3390/en10111806
Segura E, Morales R, Somolinos JA. Cost Assessment Methodology and Economic Viability of Tidal Energy Projects. Energies. 2017; 10(11):1806. https://doi.org/10.3390/en10111806
Chicago/Turabian StyleSegura, Eva, Rafael Morales, and José A. Somolinos. 2017. "Cost Assessment Methodology and Economic Viability of Tidal Energy Projects" Energies 10, no. 11: 1806. https://doi.org/10.3390/en10111806
APA StyleSegura, E., Morales, R., & Somolinos, J. A. (2017). Cost Assessment Methodology and Economic Viability of Tidal Energy Projects. Energies, 10(11), 1806. https://doi.org/10.3390/en10111806