Article

Harmonic Adaptability Remote Testing Method for Offshore Wind Turbines

1
Key Laboratory of Power System Intelligent Dispatch and Control of Ministry of Education, Shandong University, Jinan 250061, China
2
China Electric Power Research Institute, Beijing 100192, China
*
Author to whom correspondence should be addressed.
Energies 2017, 10(11), 1793; https://doi.org/10.3390/en10111793
Submission received: 27 September 2017 / Revised: 25 October 2017 / Accepted: 3 November 2017 / Published: 7 November 2017

Abstract

:
Harmonic adaptability (HA) capability is required for large-scale onshore and offshore wind turbines (WTs) connected to the grid. To ensure that the distortion of the harmonic voltage at the grid access point generated by grid simulator is in accordance with the required value, this paper proposes an on-site HA remote testing method for offshore WTs to eliminate submarine cable effects. The deviation compensation method detects the integer harmonic voltage distortion based on instantaneous reactive power theory, and the deviation from the required value is compensated by series active power filter. In order to further reduce the capacity of the designed device, integer harmonics close to the resonant frequency are suppressed by the selective harmonic damping (SHD) method initially. Owing to the attenuation of extreme amplification, the deviation determining the equipment capacity is decreased correspondingly. As a small synthesized impedance working for the selected frequency can suppress the amplification significantly, a low power ratings design for the SHD method can be achieved, and undesired resonance can be avoided. Simulation results indicate that the proposed method can make the harmonic distortion within the error tolerance.

1. Introduction

After having undergone fast growth for the last decade, wind power is now a significant technology to cope with environment and energy issues [1]. With the increasing penetration of wind power in the grid, the adverse effects on grid security and stability cannot be ignored [2,3]. Therefore large-scale wind turbines (WTs) are necessary to remain connected and support the power system like the conventional power plants during grid disturbances such as frequency fluctuation, voltage deviation, voltage unbalance, and distortion, which is called the grid adaptability in whole [4,5]. On one hand, grid-connected WTs are one of the causes of power quality problems, and the measurement and assessment of their power quality characteristics must be performed by the certifier and/or manufacturer in laboratory to make sure that they are qualified [6]. On the other hand, WTs are exposed to grid disturbances. In order to reduce uncertain risk to design and production as well as to ensure operating reliability of WTs, grid adaptability testing is essential to make sure that the installed WTs are capable of adapting to those disturbances.
As a part of grid adaptability testing, on-site harmonic adaptability (HA) testing is still essential, owing to the following considerations. First of all, offshore WTs are susceptible to the harmonic instability, where the extensive submarine cables and low short circuit power at the point of common coupling (PCC) may create resonance within the harmonic scope of grid disturbances. Therefore, the on-site testing conditions and conclusions are the most realistic and convincing. Second, there are clear requirements from the grid company and the wind farm that the grid-connected WTs should have the HA ability all the time. Finally, an HA capability re-evaluation is necessary after maintenance and/or adjustment of any major elements.
When it comes to the testing for onshore WTs, the inherent principle behind grid adaptability testing is to connect the WTs under testing to a specially controlled power source called a grid simulator, which is used to simulate the grid and generate grid disturbances based on the test conditions. There are several methods to generate grid disturbances such as non-controlled rectifier and controlled inverter-based and back-to-back, single-phase, full-controlled, devices-based grid simulators [4]. During the test for WTs, the grid simulator is connected in a series between the WT and the grid to emulate different grid disturbances. The grid adaptability testing system with single-phase, full-controlled, devices-based grid simulator transported in a standard size shipping container is the only technology available to provide the grid adaptability testing service on-site. Since the testing system needs to be brought to the fully erected WT under test, it can be called the local testing method. The capacity of the grid simulator has to be larger than that of WTs so as to perform the HA testing under different WT operating conditions. Relevant research works including the grid adaptability testing theories and methodologies, grid adaptability techniques, and grid code revision have been carried out [4,7,8]. There are some works related to the local HA testing method. Different design schemes of electronic harmonic generating devices for improving harmonic output accuracy and lowering the equipment capacity are presented in those works. However, those methods cannot be applied directly for the offshore wind turbine. In China, the requirements of grid adaptability, power quality testing, and evaluation methods for onshore WTs have already been standardized in the grid codes. Meanwhile, many on-site tests for onshore WTs have been performed by WT manufacturers and testing institutes.
With the fast development of offshore wind power, the on-site HA testing for offshore WTs is necessary to be performed. Until recently, lots of offshore wind farms (OWFs), such as Horns Rev OWF in Danmark, Xiangshui and Donghai daqiao OWFs in China, are generally not farther than few tens of kilometers from shore. Medium voltage AC transmission is applied widely to connect the offshore WTs to onshore PCC. However, the local testing method is not practical for offshore WTs considering the inconvenience of the gird simulator transportation, installation, and fixation because of the atrocious environment and accessibility limitations. On-site testing is of long time duration since the time needed to do the required tests largely depends on wind conditions. Additionally, a precise schedule cannot be made owing to the uncertainties of wind conditions. The completion of the overall testing will need several iterations for the transportation, installation, and uninstallation of testing devices to perform the whole tests. Thus, the testing may be very long, and the costs can vary significantly. Considering all those factors, it is scarcely possible to perform the on-site HA testing for offshore WTs.
In order to perform the HA capability testing of WTs in those OWFs feasibly, cost-effectively, and securely, this paper proposes an on-site method for doubly fed induction generator (DFIG) WTs. The basic idea is to put the test equipment on the shore and impose grid disturbances through submarine cables to the offshore WT under test, which is called the remote testing method. There are no effects of transportation or environment but the submarine cables. The introduced cables may result in resonance, thus the standard testing signal generated by grid simulator at the grid access point will exceed the required value of testing codes. Much attention has been paid to the power quality problems of grid-connected WTs by researchers [9,10,11,12]. The impedance models of DFIG WTs in harmonic domain are introduced in [13,14]. In references [15,16], the significant effects of submarine cables on the harmonic response in offshore power transmission systems are demonstrated, and several methods were taken to suppress harmonics amplification and resonance in traditional ways [17,18,19,20]. The resonance frequency shift (RFS) method was introduced by the authors in [5] to cope with the harmonic resonance occurring during the grid adaptability testing for offshore WTs. In reference [5], adjustable inductances and capacitances were used to verify the effectiveness and availability of the RFS method [21,22]. However, passive inductors and capacitors cannot be adjusted continuously, which makes it difficult to adapt to the various testing conditions. Active power filters (APFs) are regarded as powerful tools to deal with power quality problems [23,24,25]. Research works related to selective or specific order harmonics compensation and damping strategies have been investigated deeply [26,27,28]. Different design techniques and control schemes suitable for wide-band frequency have also been proposed for tackling undesired drawbacks, such as phase lag and tracking accuracy of reference signals [29,30,31,32]. Shunt APF controlled as an impedance, which works only for the selective frequency, are also investigated for resonance damping [33,34,35]. These works provide valuable guidance for the implementation of the proposed method.
To guarantee that the voltage distortion at the grid access point is in accordance with the testing standards, this paper proposes a deviation compensation method for on-site HA testing of offshore WTs eliminating effects of submarine cables. The proposed method detects the integer harmonic distortion being tested in real time, and the deviation from the required value is compensated by series APF. The concerned harmonics may be amplified to different degrees; therefore, the capacity of the series APF depends on the maximum deviation. In addition, there may exist background harmonics generated by WTs amplified to the extent of affecting test and dominating designed equipment capacity. In order to further reduce the capacity of the designed device, harmonics near the resonant frequency are suppressed by the selective harmonic damping (SHD) method.
The proposed method in this study focuses on the onshore or remote test by a cable for the offshore wind turbine and can reduce the overall cost significantly. The purpose of performing the onshore/remote HA testing for the offshore wind turbine by eliminating the effects of the cable is achieved. The disadvantage of repeatedly transporting the testing equipment and the fixation difficulty without enough space are avoided. The testing can be done effectively and cost effectively. Collaborated with the series APF, the shunt APF can be controlled to suppress the integer harmonic resonance to reduce the compensation deviation and eliminate the effects of other possible resonant harmonics to ensure the success of HA testing. The tested integer harmonic can be detected directly, and the compensation voltage reference can be obtained easily.
This paper is organized as follows. In Section 2, the testing system configuration and testing procedure are described. The effects of cables on HA testing are analyzed in Section 3. The deviation compensation method and the SHD method are presented in detail in Section 4 and Section 5 in sequence. Simulation results and conclusions are given in Section 6 and Section 7, respectively.

2. Testing System Configuration, Requirement and Procedure

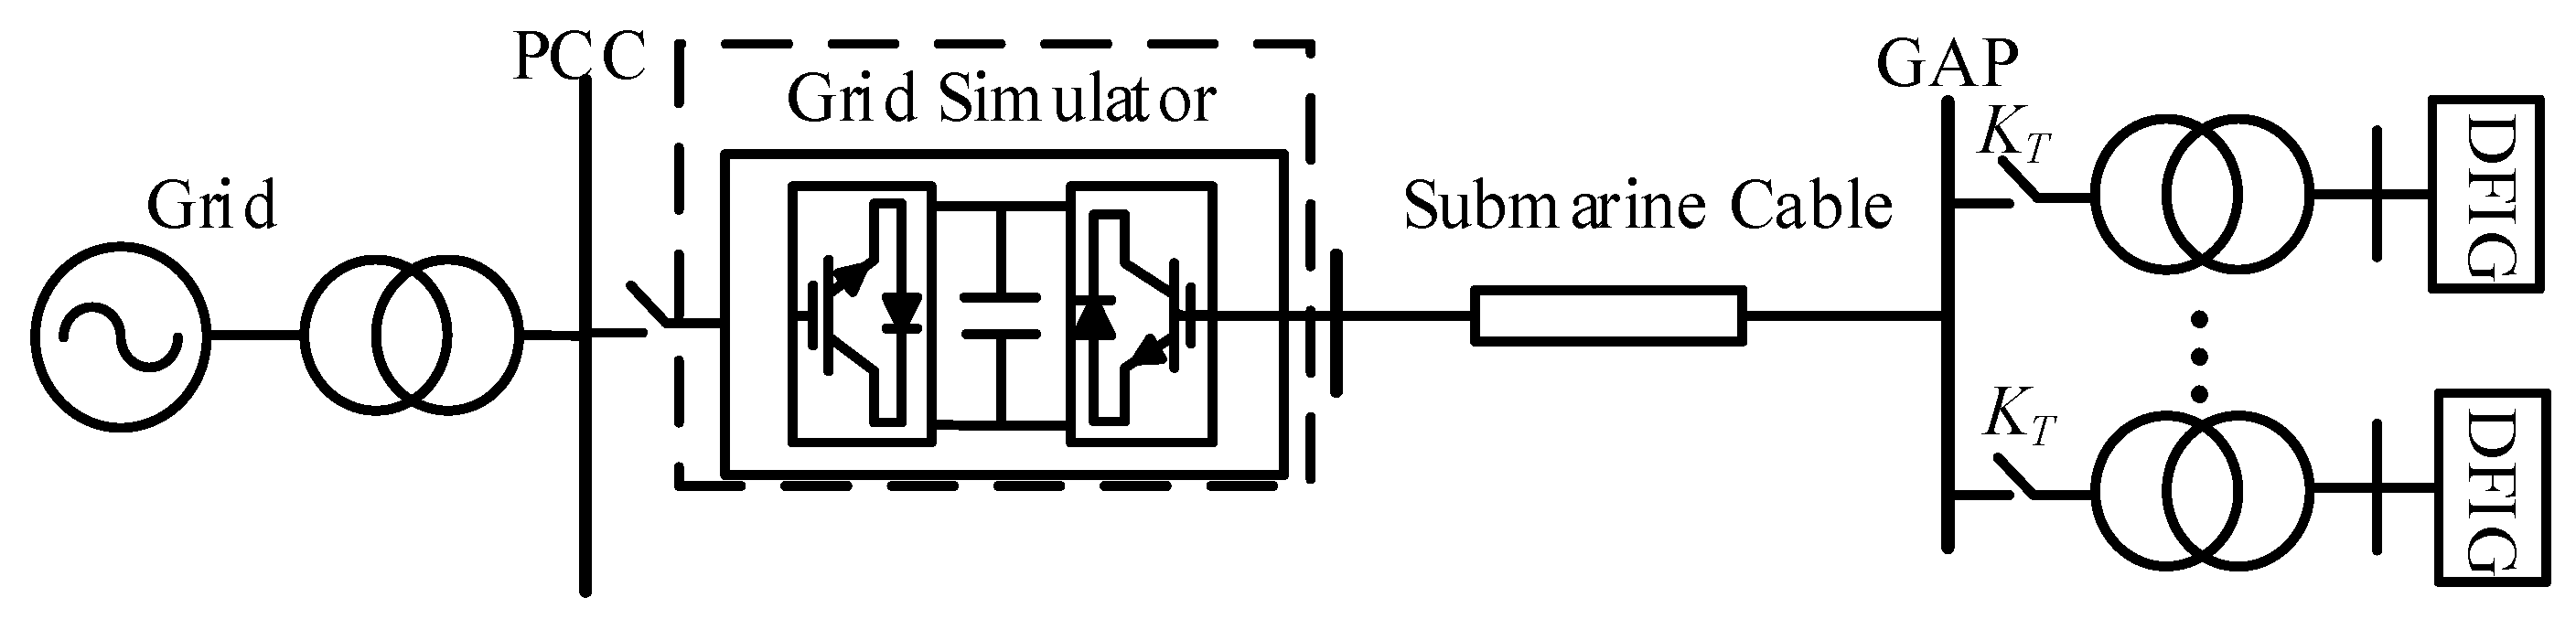
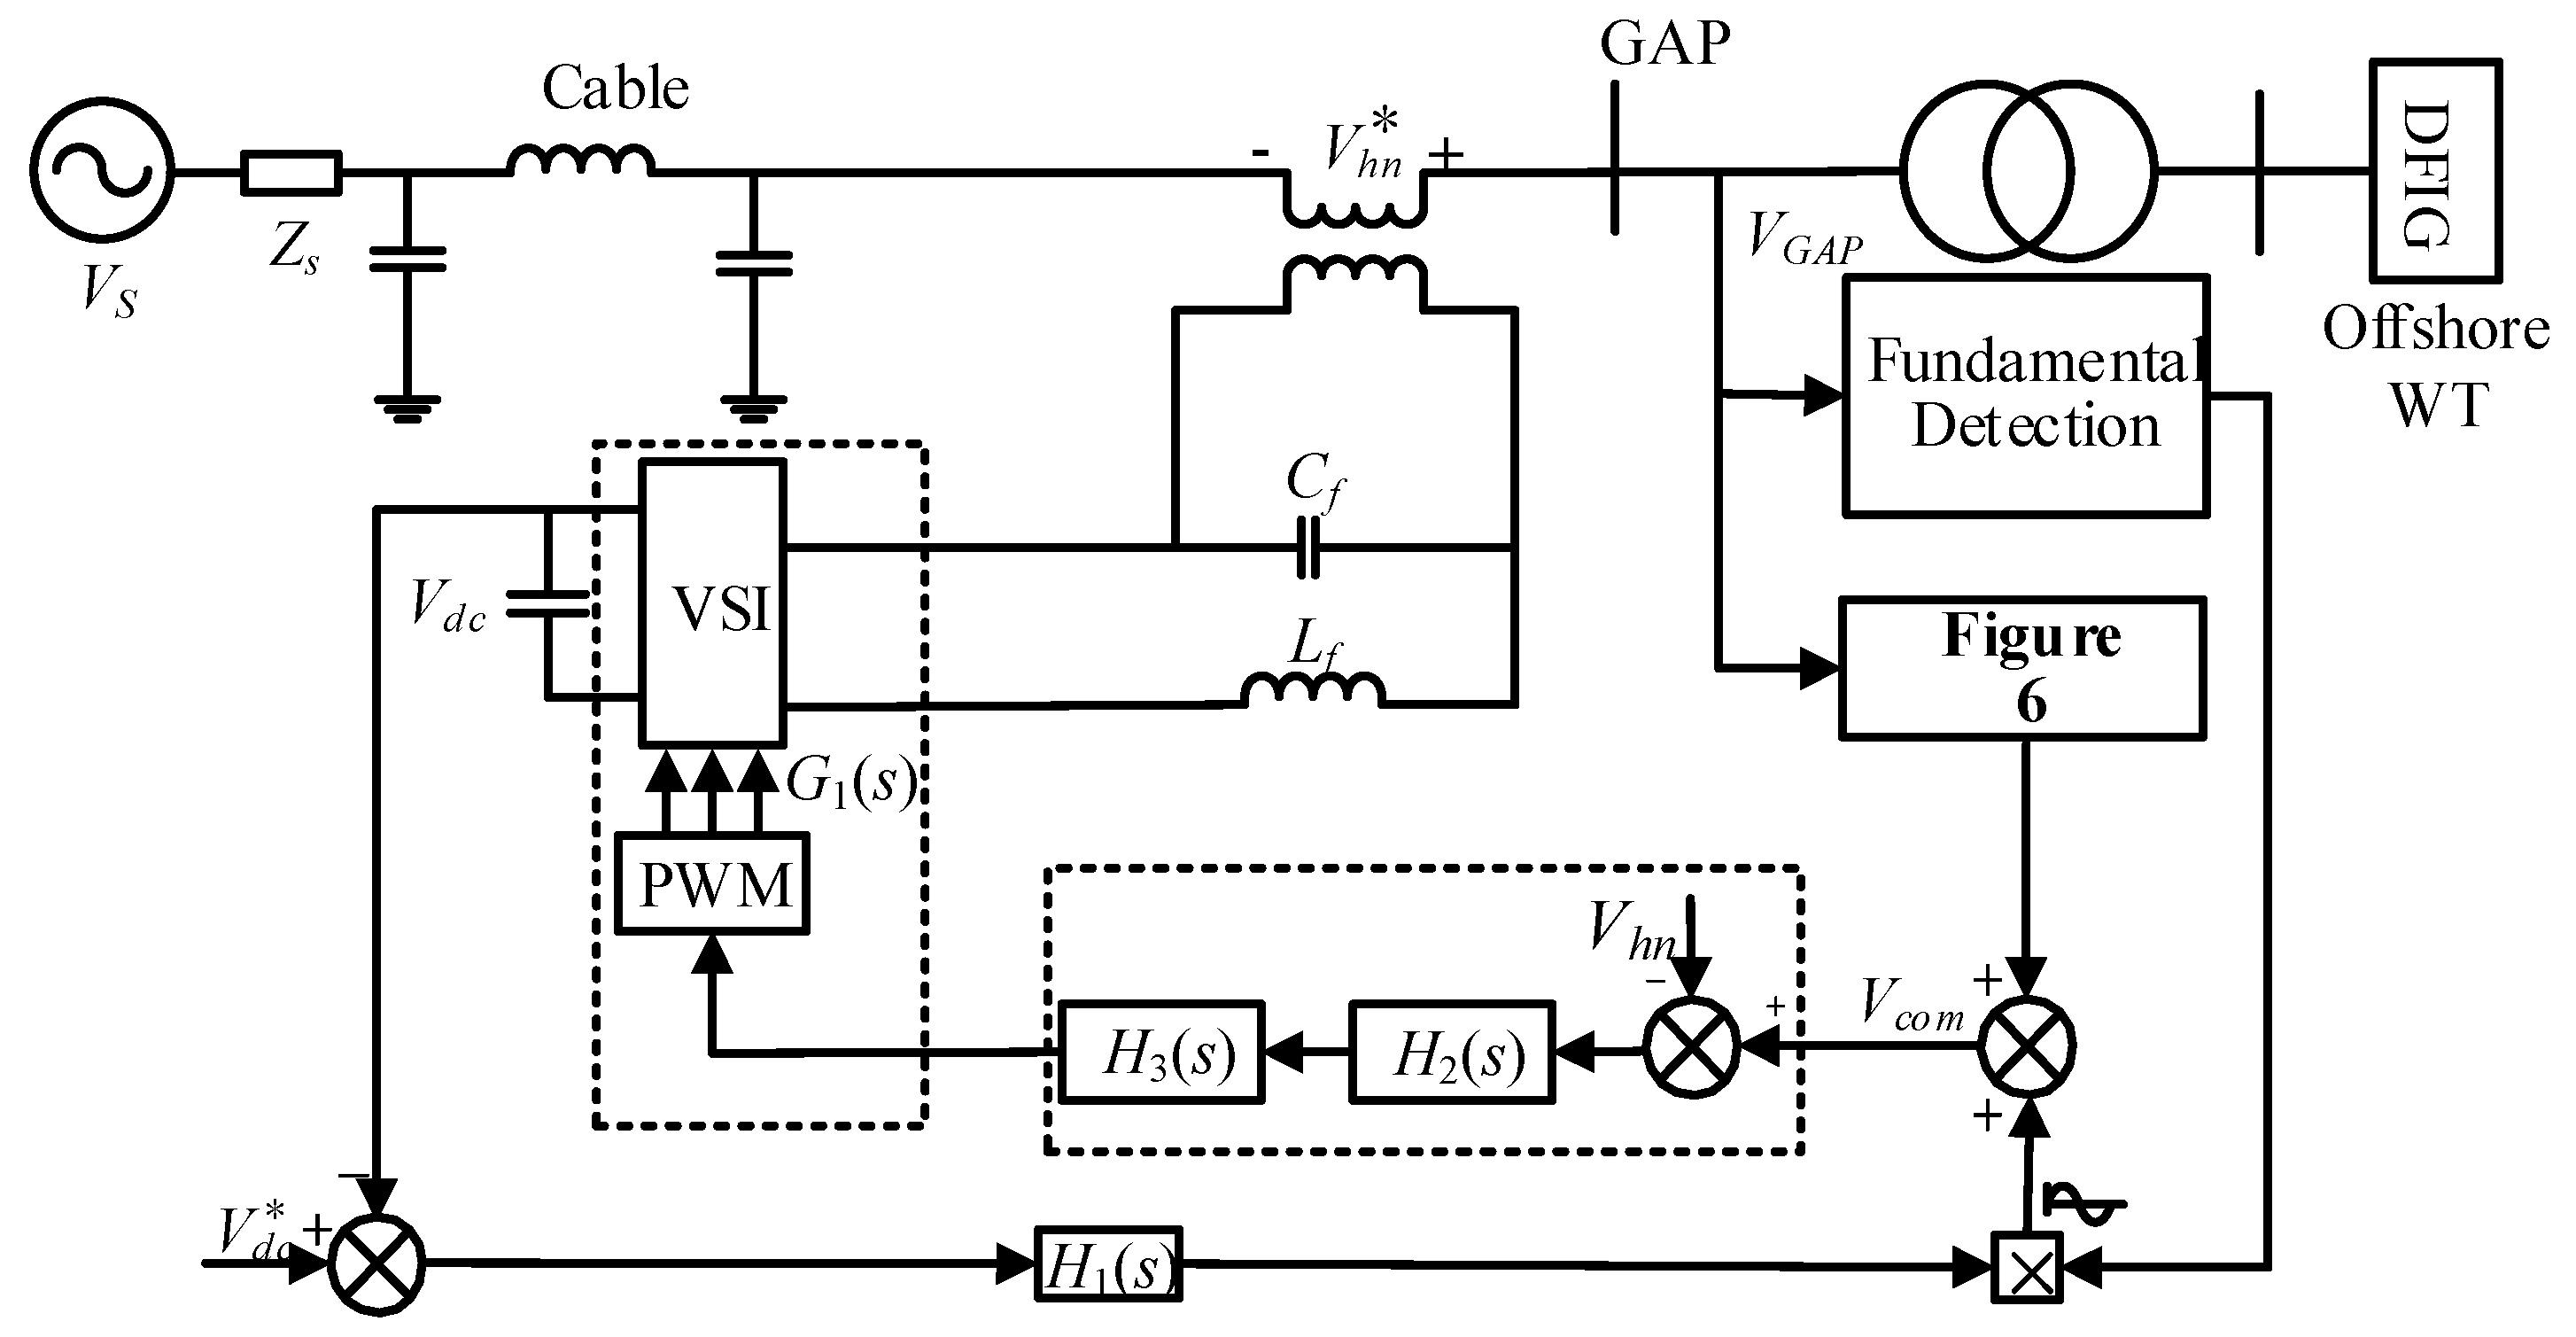
2.1. Testing System Configuration

As shown in Figure 1, the on-site HA testing system consists of test WTs and a grid simulator generating harmonics of 2nd to 25th order through disturbance-generating devices [7]. The schematic diagram of grid simulator is introduced in [4]. The grid and grid simulator are connected together by the wind farm bus referred to in this paper as the onshore PCC. The WTs and grid simulator are connected through submarine cables and the bus connecting the cable and the high voltage side of WT transformer is referred to in this paper as the grid access point (GAP). During the testing, the symmetrical harmonics generated by the grid simulator according to the test conditions may be amplified due to the effects of submarine cables and the harmonics distortion at GAP will exceed the specified value, which will be discussed in detail in Section 3.

2.2. Harmonic Adaptability Testing Requirement

According to the testing codes, HA testing is divided into two parts: single harmonic testing and mixed harmonics testing [7]. Taking the 8th harmonic voltage testing for onshore WTs for example, the required distortion of the 8th harmonic voltage is 2.5% [4,5]. Figure 2a,b depict the standard testing voltage waveform and the frequency spectrum for 8th harmonic voltage, respectively. In practice, mixed harmonics testing can be achieved by the combinations of different harmonic voltage with different orders and distortion. With regard to HA testing of offshore WTs, the distortion at WTs side should also be maintained at 2.5%. When the offshore WTs remain connected to the gird under the required voltage distortion, the offshore WTs have the capability of adapting to the grid harmonic disturbance. In other words, they are qualified.
During the testing, keep the offshore WTs operation under the required conditions and then adjust the grid simulator to generate the specified harmonics. The following contents should be recorded during the whole period: harmonic order, specified value of harmonic distortion, measured value of harmonic distortion, actual run time of WT (min), required run time of WT (min), and whether the WT remain connected or not [7].

2.3. Harmonic Adaptability Testing Procedure

In the real HA testing, the effects of two harmonic sources including the grid simulator and DFIG should be taken into consideration. The output of grid simulator is controllable while the harmonics generated by DFIG vary with the capacity, operation condition as well as control scheme of converters. Though many effective control strategies have been applied to reduce the harmonics generated by DFIG, there may exist harmonics closed to the resonant center. Those harmonics with low distortion may be amplified to the extent where the test would be affected. For analyzing the effects of harmonics generated by DFIG, the harmonics to be tested are divided into two parts: the non-amplified and amplified harmonics. In terms of the non-amplified harmonics testing, their distortion can be maintained at the required value by adjusting the grid simulator output approximately. Then, the deviation is compensated by the proposed method. Harmonics closed to the resonant center generated by DFIG may be highly amplified resulting in HA testing failure. Although those harmonics can also be eliminated by the proposed method, the capacity of the equipment should be designed to be large enough. The SHD method with low designed capacity can be used to suppress those harmonics to eliminate the effects. For the amplified harmonics testing, the SHD method is applied to damp the amplification at first and then the harmonics can be tested as non-amplified ones.
The whole HA testing procedure designed for offshore WTs is divided into six stages. Stage 1 is the planning and preparation for HA testing. This stage includes obtaining the parameters of all the necessary elements, such as submarine cables and DFIG WTs. In stage 2, the resonance mode of the system is analyzed to get the resonance frequencies (technical details can be found in Section 3), which is the basic of control system parameters design.
In stage 3, parameters of the controllers are designed for different testing conditions so as to guarantee the effectiveness of the proposed methods. According to the frequency to be damped and the selected damping method, the controller parameters are designed to make sure that the proposed method works effectively, that’s to eliminate the reference signal tracking error and phase lag because of the concerned wideband frequency in the testing. For harmonics of low amplification, the proposed method can be applied directly with properly selected parameters (the control strategy can be found in Section 4) [25,26]. For the harmonics of high amplification, the SHD method is used to reduce the amplification by synthesizing an adjustable impedance (the control scheme can be found in Section 5) [20,21,22].
In stage 4, connect the testing WTs and grid simulator according to Figure 1 and start the testing system. First, the OWF except the WTs under test will be taken out of service during the whole test. Connect the grid simulator to the onshore PCC and then switch on the WT. Second, adjust the WT to the operation state where it is in compliance with the testing conditions.
In stage 5, the HA testing can then be performed. After harmonics from 2nd to 25th orders, each being tested for at least 15 min with the testing data recorded consecutively, the whole experimental testing comes to the end.
Testing results analysis for the HA capability of offshore WTs will be done in stage 6, and the certified conclusions for the offshore WT—whether it is qualified or not—should be given by the testing institute.

3. Effects of Submarine Cables on Harmonic Adaptability Testing

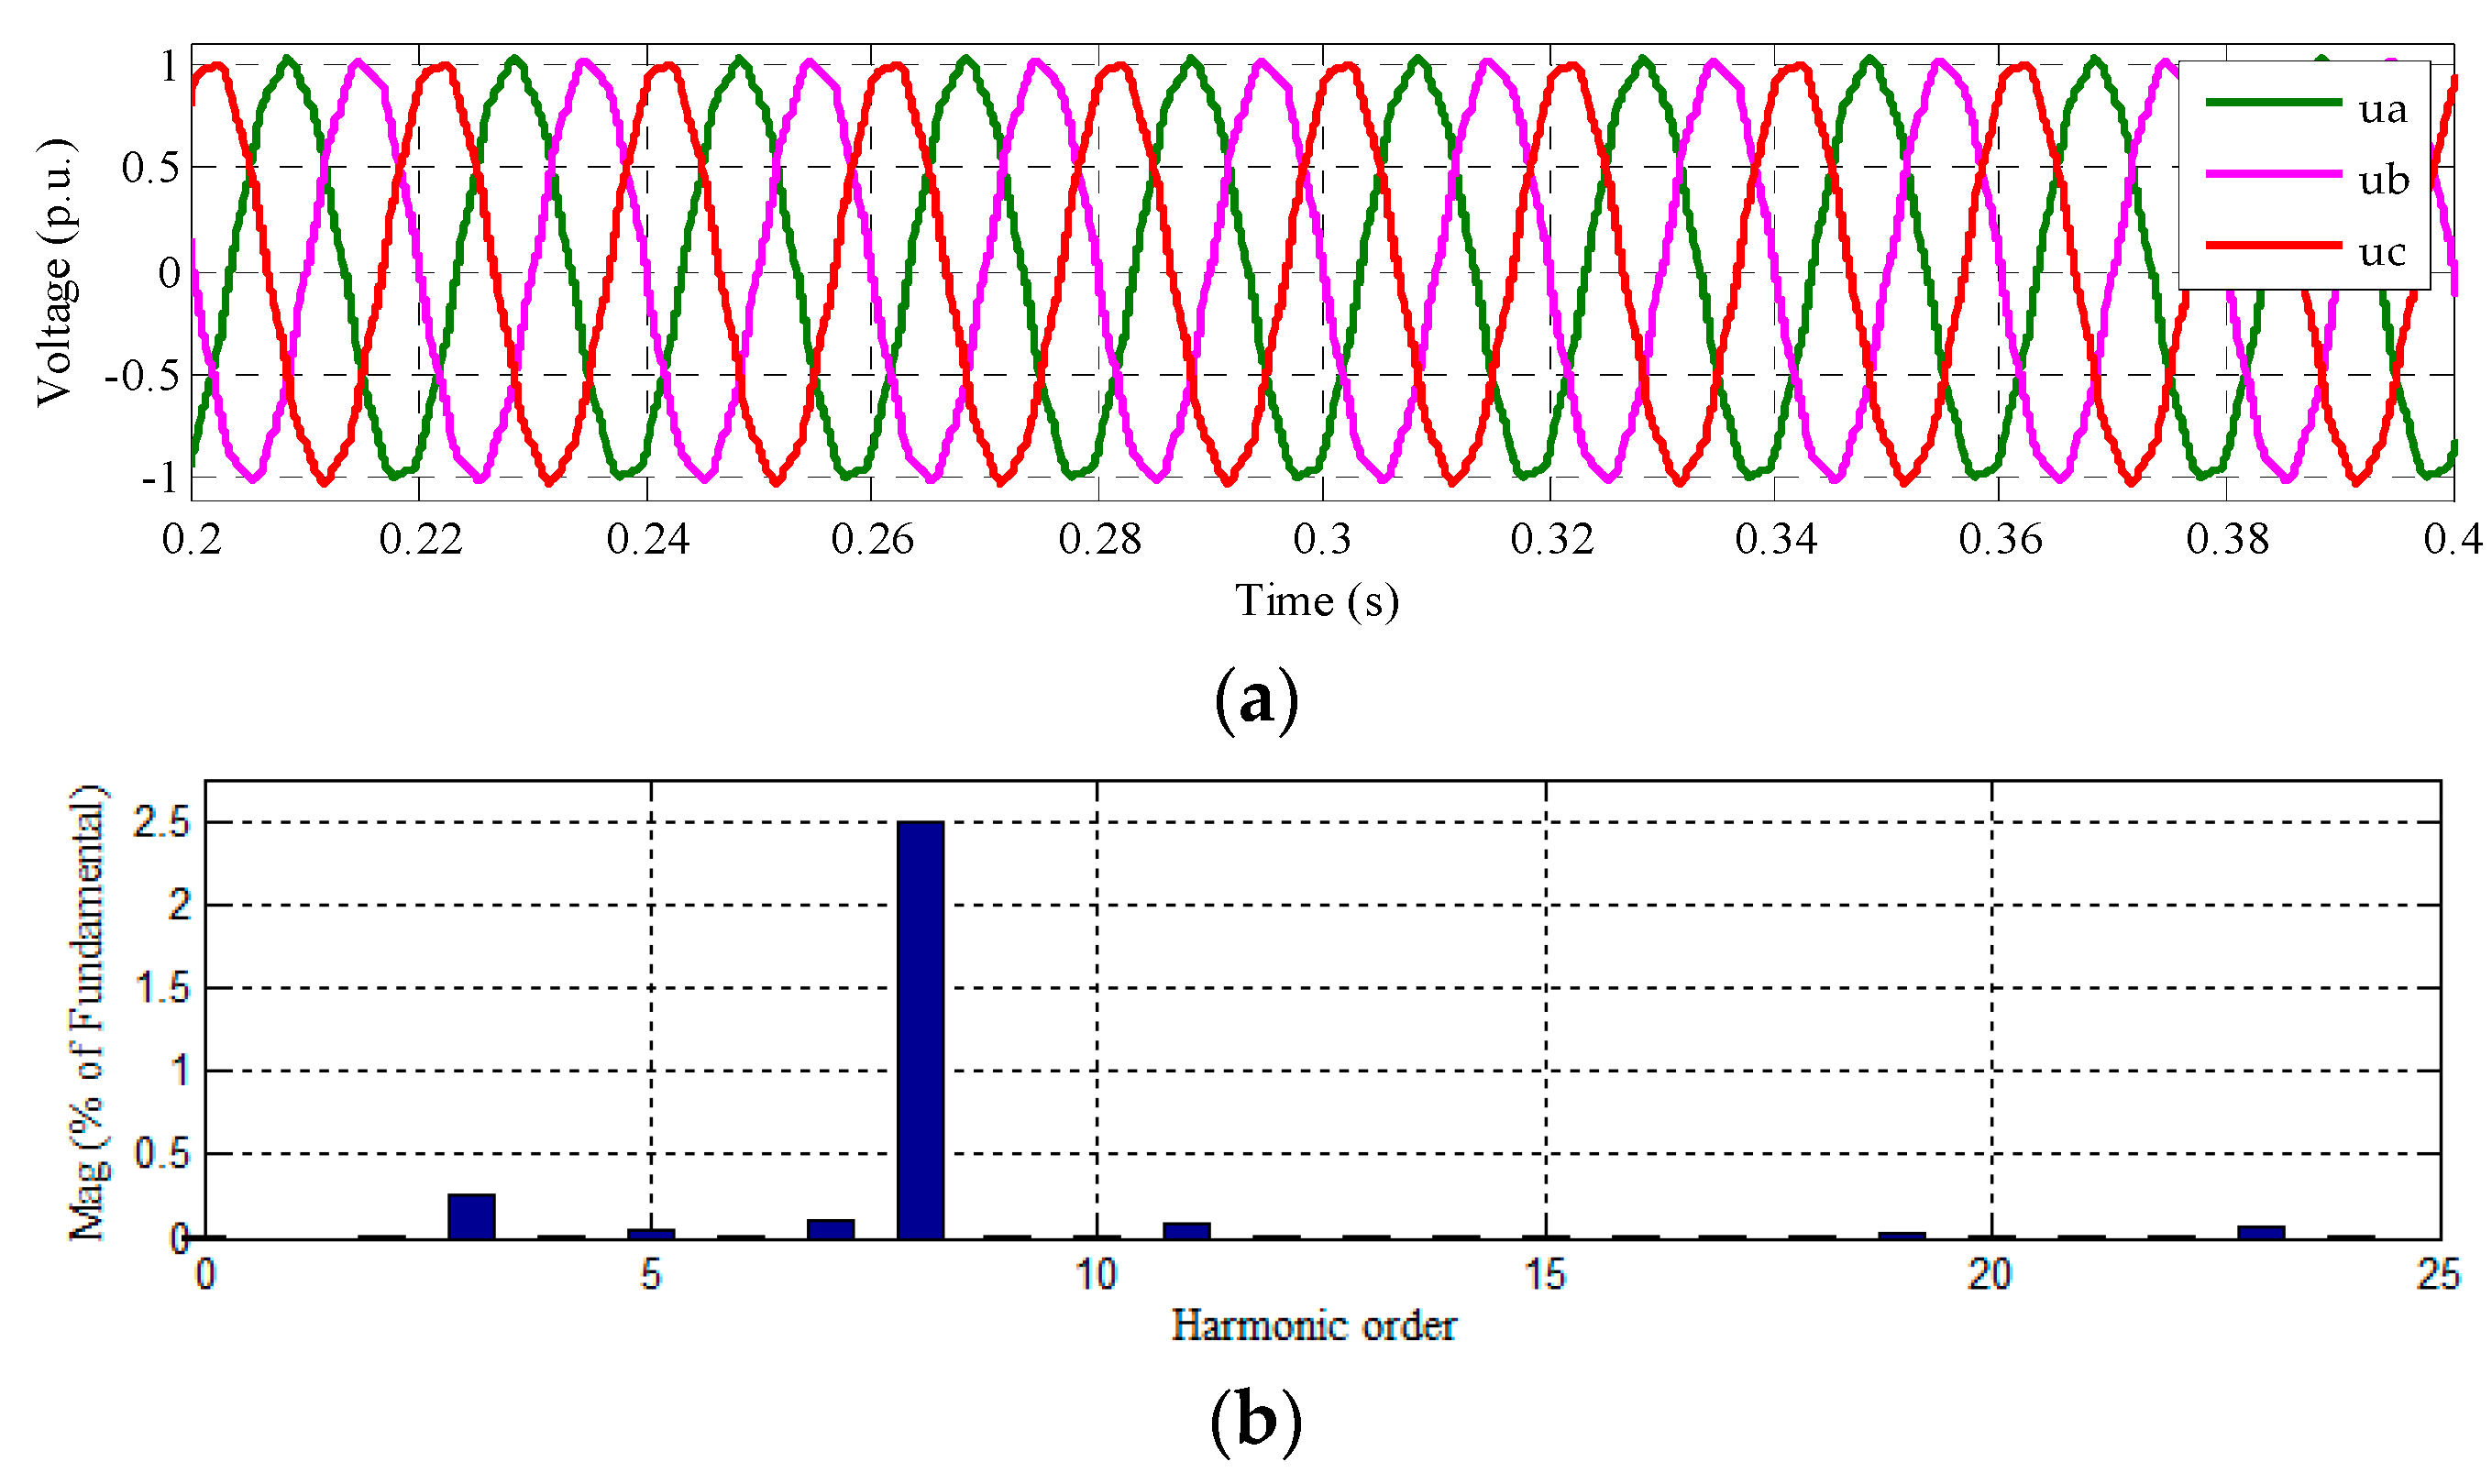
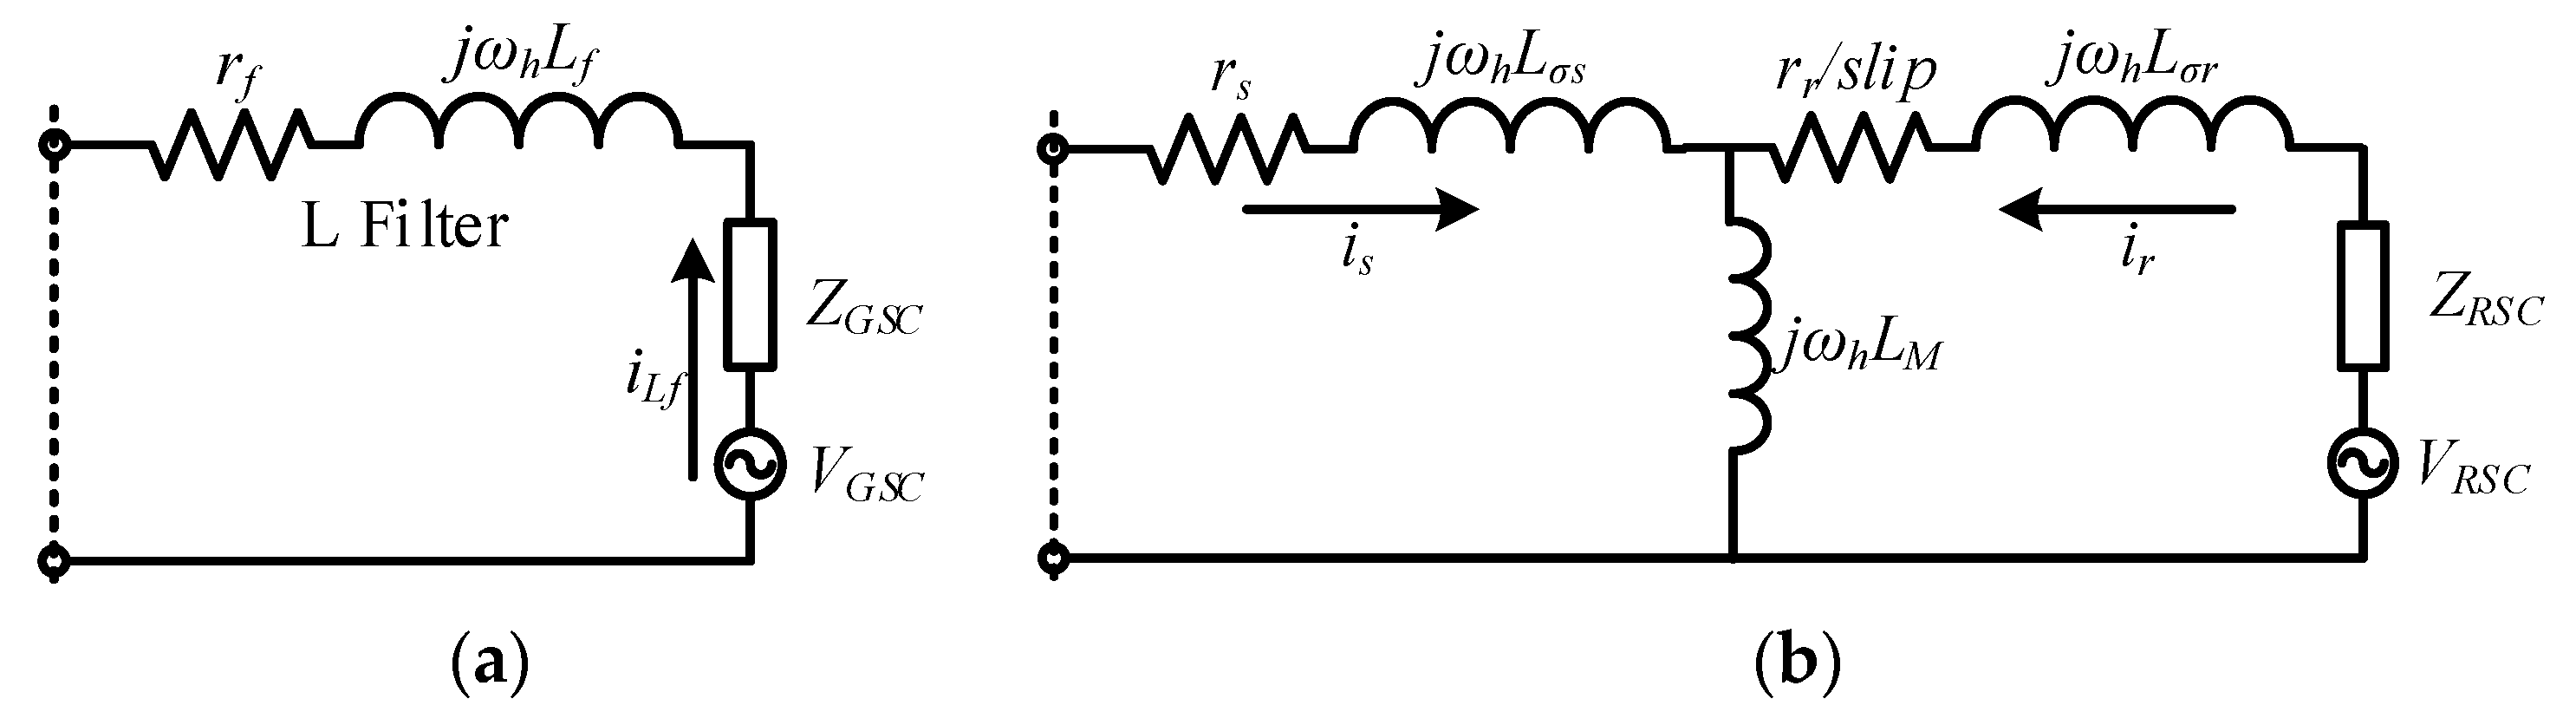
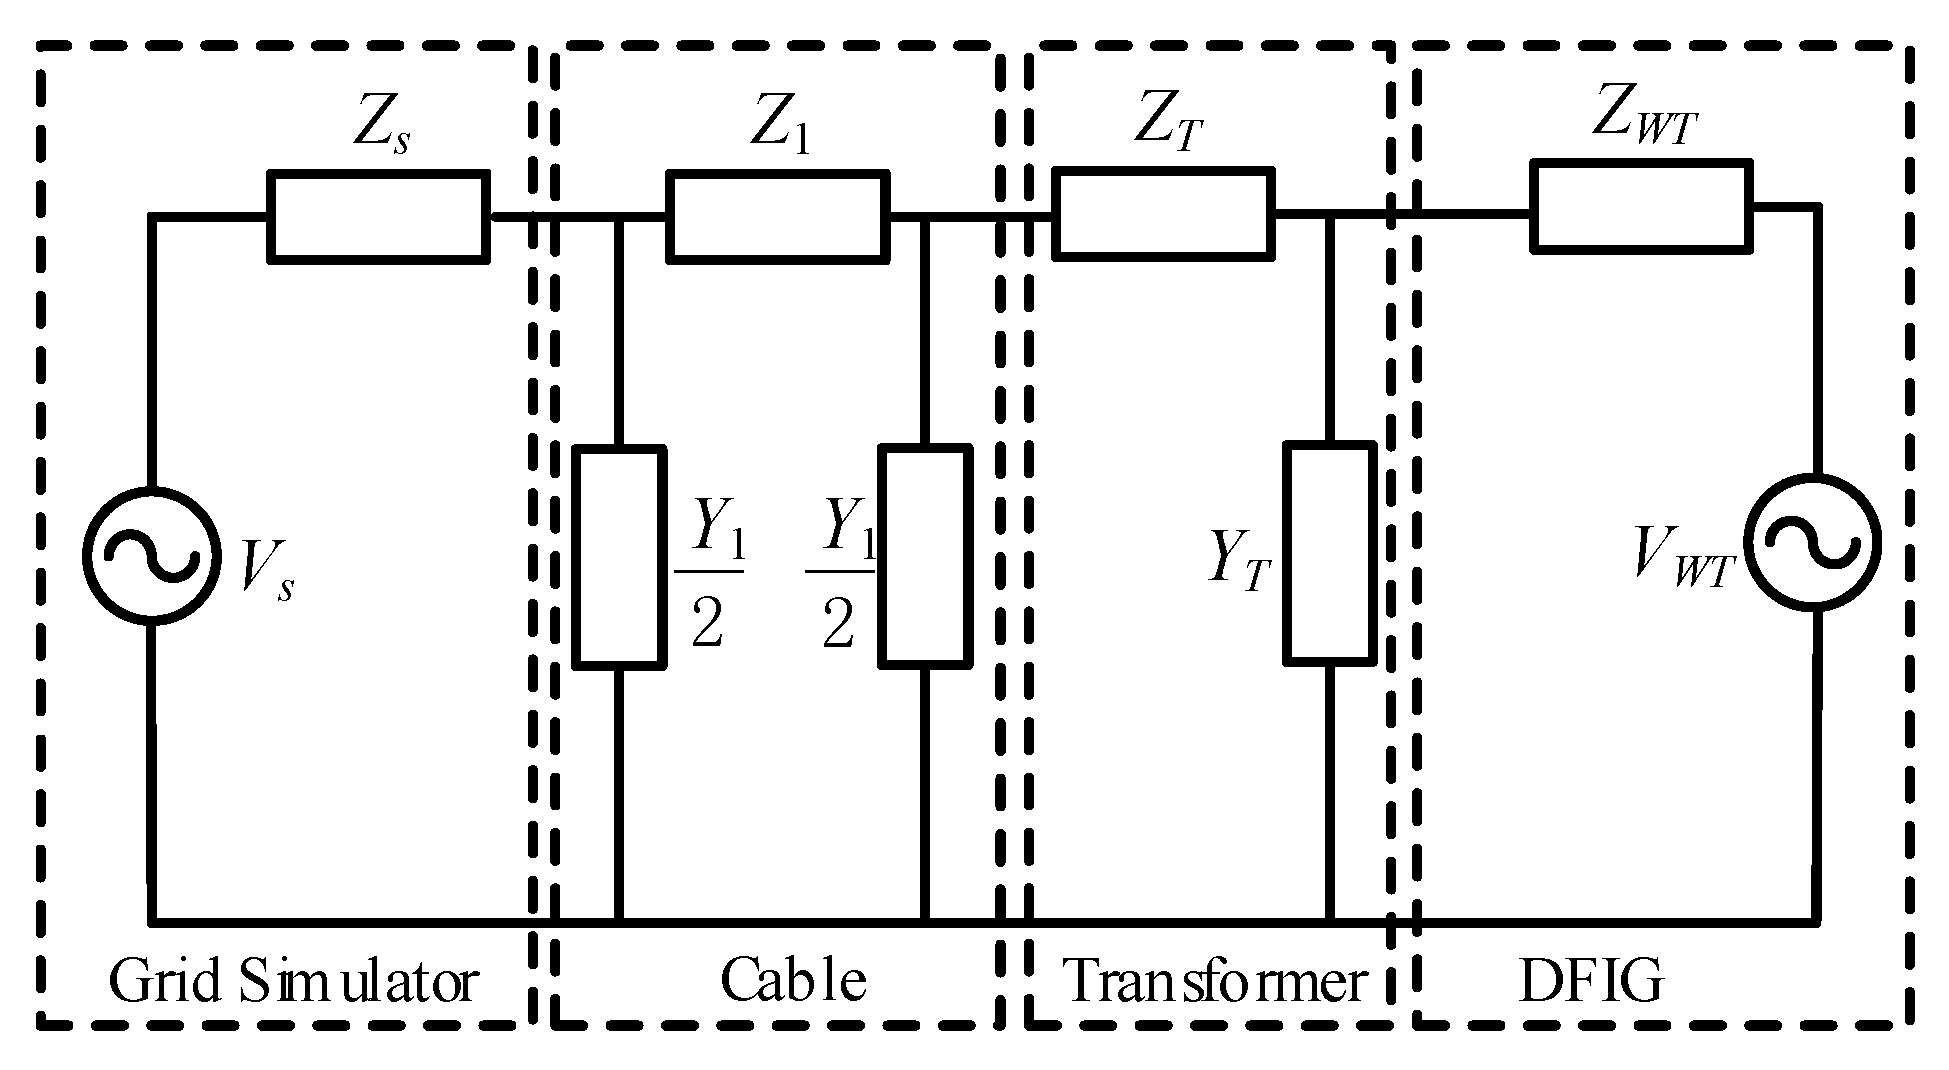
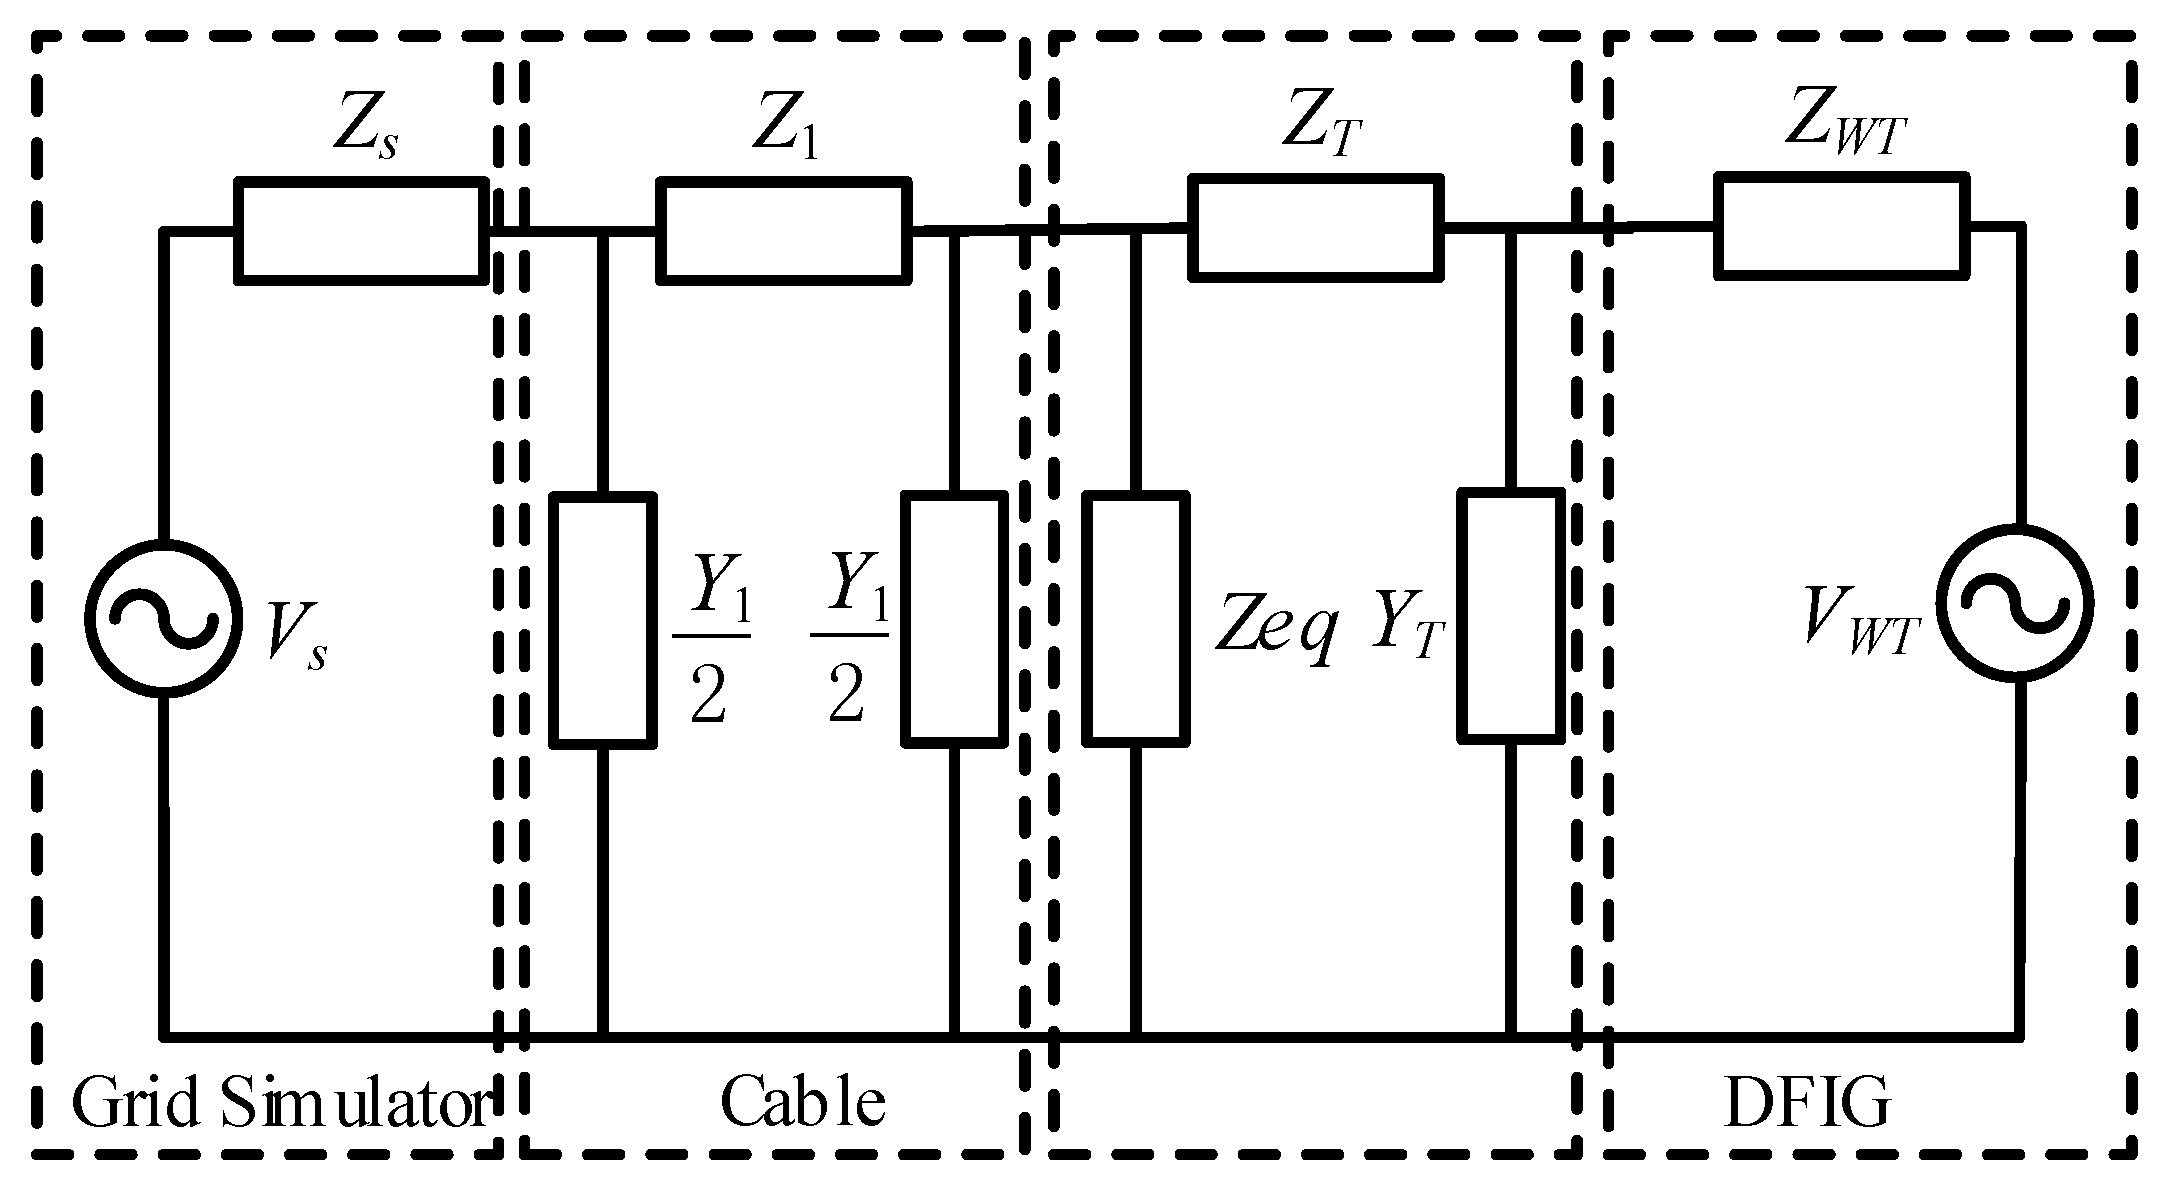
3.1. Equivalent Circuit of the System

In order to establish the analysis model of submarine cable effects on HA testing, the equivalent circuit of the system is presented in the beginning. The models of the submarine cable, transformer, and DFIG turbines are taken into consideration carefully.
The lumped parameter model of submarine cable cannot describe its characteristics due to the wideband harmonic frequency of concern and the variation of cable length; therefore, the distribution parameter model is applied [5]. The parameters of the submarine cable are given in Equation (1) on the fundamental domain according to the uniform transmission line equation.
{ Z 1 = Z c sinh γ l Y 1 = 1 Z c 2 ( cosh γ l 1 ) sinh γ l
where Zc, γ, and l are the characteristic impedance, propagation constant, and the length of the submarine cable respectively.
The DFIG impedance modeling is investigated as follows. There are mainly two types of filters used by DFIG grid side converter (GSC), which are the L filter and LCL filter, respectively [11]. The DFIG containing a commonly used L filter is applied in this paper. The grid side part of DFIG consists of the GSC and L filter, thus the impedance modeling of this part can be presented as Figure 3a, which has been reported in [12]. The GSC is modeled as a voltage source VGSC = i L f * GcGd connecting an impedance ZGSC = GcGd in series, where Gc is the PI controller with proportional gain Kpgsc and integral part Kigsc/s. Gd is used to describe digital control delay [11]. Thus the equivalent impedance of the GSC and L filter can then be given as ZGL = ZLf + ZGSC. The parameters can be found in [13,14]. According to [12,13,14], the DFIG machine and rotor side converter (RSC) can also be obtained similarly, which is shown as Figure 3b. The rotor variables are transformed into the stationary frame by means of the slip angular speed expressed as slip = (sr)/s, where ωr is angular speed of DFIG rotor. The equivalent impedance of the DFIG machine and RSC can then be given as Equation (2),
Z S R = Z L M Z r + ( r s + Z L σ s ) Z r + Z L M ( r s + Z L σ s ) Z L M + Z r
where, Zr = ZLσr + (rr + ZRSC)/slip, ZLM = sLM, ZLσr = sLσr, ZLσs = sLσs. rs and rr are the DFIG stator and rotor winding resistances, Lσs and Lσr are the corresponding leakage inductances of stator and rotor windings respectively, and LM is the excitation inductance. While, VRSC = i L r * GcGd and ZRSC = GcGd, which are similar to the GSC. The relevant parameters can be found in the Appendix A Table A2.
There is a dc-link capacitor connected between the GSC and RSC of DFIG to guarantee a constant dc-link voltage under normal operation condition. Actually, the capacitor is used to decouple the two sides of the DFIG, which means that both sides can operate independently. Therefore, there is no need to take dc-link coupling between the two sides into consideration in the modeling, and the GSC and RSC can be regarded as connected in parallel. According to the impedance modeling of GSC and RSC as shown in Figure 3, the DFIG model seen from the stator part can be represented by a voltage source VWT connecting an equivalent impedance ZWT in series. The DFIG system impedance can be given as ZWT = ZGLZSR/(ZGL + ZSR).
The characteristics of a transformer are mainly determined by the winding and excitation parameters. Consequently, the winding parameter ZT connecting the excitation parameter YT in parallel is used as the model of the transformer [19]. According to the topology of the grid simulator, it can be represented by a harmonic voltage source connecting an impedance in series [4,8].
The single-phase equivalent circuit of the testing system is shown in Figure 4, Vs and Zs are the grid simulator voltage and its equivalent impedance respectively. Z1 and Y1 are the equivalent impedance and admittance of submarine cable. ZT and YT are the equivalent impedance and admittance of the transformer. ZWT = ZGLZSR/(ZGL + ZSR) are the equivalent impedances of DFIG seen from the output port. VWT is the equivalent voltage source also seen from the stator port.

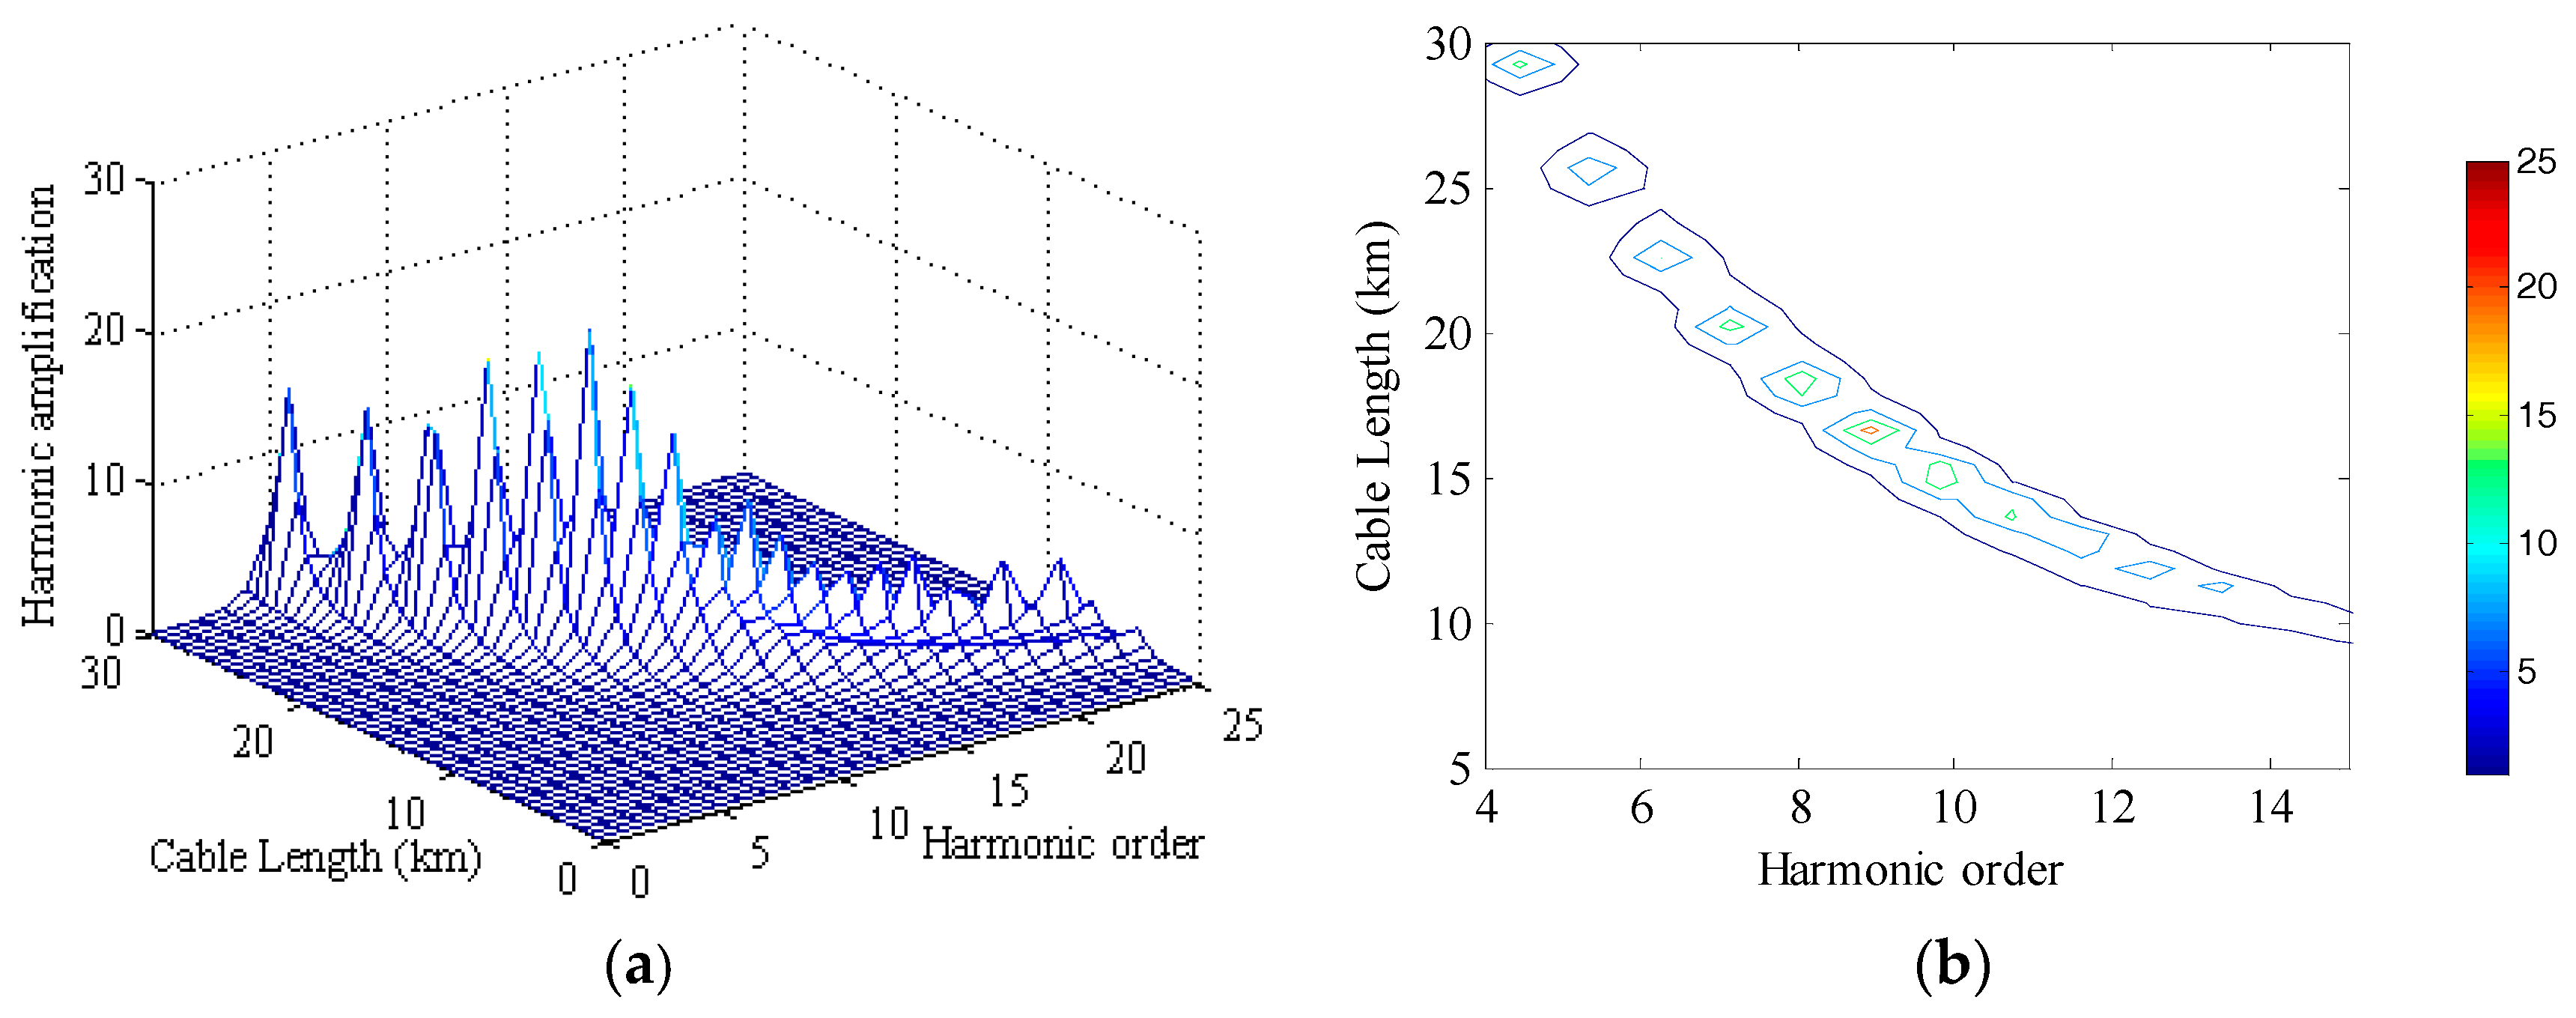
3.2. Resonance Analysis

Let Zs(h), Z1(h), Y1(h), ZT(h), YT(h), ZWT(h) denote the corresponding impedances or admittances of hth harmonic for grid simulator, submarine cable, transformer and DFIG respectively. According to Figure 4, the following equations can be given,
{ Z 2 ( h ) = Z W T ( h ) Z 3 ( h ) = Z T ( h ) + Z 2 ( h ) / / Y T ( h ) Z 4 ( h ) = Z 1 ( h ) + Z 3 ( h ) / / [ Y 1 ( h ) / 2 ] Z 5 ( h ) = Z 4 ( h ) / / [ Y 1 ( h ) / 2 ]
where, “//” represents parallel calculation. The harmonic voltage relationship between the receiving (GAP) and sending end (onshore PCC) can be obtained based on Equation (3).
V G A P ( h ) = [ Z 4 ( h ) Z 1 ( h ) ] Z 5 ( h ) Z 4 ( h ) [ Z s ( h ) + Z 5 ( h ) ] V s ( h )
where, Vs(h) and VGAP(h) are the harmonic voltage of onshore PCC and GAP respectively. From Equation (4), it can be noted that the harmonic voltage at GAP is not only determined by Vs(h) but also the parameters of cables. The simulation of relationships among harmonic amplification (the ratio of VGAP(h) to Vs(h)), cable length and harmonic order has been carried out, as shown in Figure 5.
The parameters of DFIG and the transformer are given in Table A1, Table A2 and Table A3 in Appendix A. Simulation parameters of other elements are given as follows. The frequency of the system is 50 Hz. The length of the 35-kV submarine cable employed is less than 30 km and the resistance, inductance and admittance of per unit length of the cable is 0.159 Ω/km, 0.138 Ω/km and 5.24 × 10⁻⁵ S/km respectively. The equivalent resistance and inductance of the grid simulator are 18 Ω and 120.9 mH. As can be seen in Figure 5, the resonance frequency is varying with the harmonic orders and change in cable length. The low order harmonics are easy to be amplified with the increment in the length of submarine cables, while high order harmonics are easy to be amplified by short submarine cables. Given that the cable length is 20 km, take the simulation result as an example, 7th harmonic voltage is amplified seriously, which represents resonance occurring. For different offshore WTs HA testing, harmonics are amplified to different extent, which need to be handled differently.
When on-site HA tests are performed, harmonic voltages of some orders are amplified to unacceptable degree. The extremely large voltage distortion would result in triggering of the DFIG protection relay and the DFIG is shut down, therefore a false conclusion that the offshore WTs are unqualified will be drawn. The deviation compensation method is proposed to tackle this problem, which is given in Section 4.

4. Deviation Compensation Method

Series APF has been used to improve the voltage quality since the 1980s. Different harmonic detection strategies can be adopted for harmonic compensation in traditionally used schemes of series APF [25,29]. Single or selective harmonic compensation has been investigated in recent years [26,27]. The series APF can generate an opposite direction compensation harmonic voltage whose magnitude is equal to the deviation from the required harmonic distortion set by the standards.

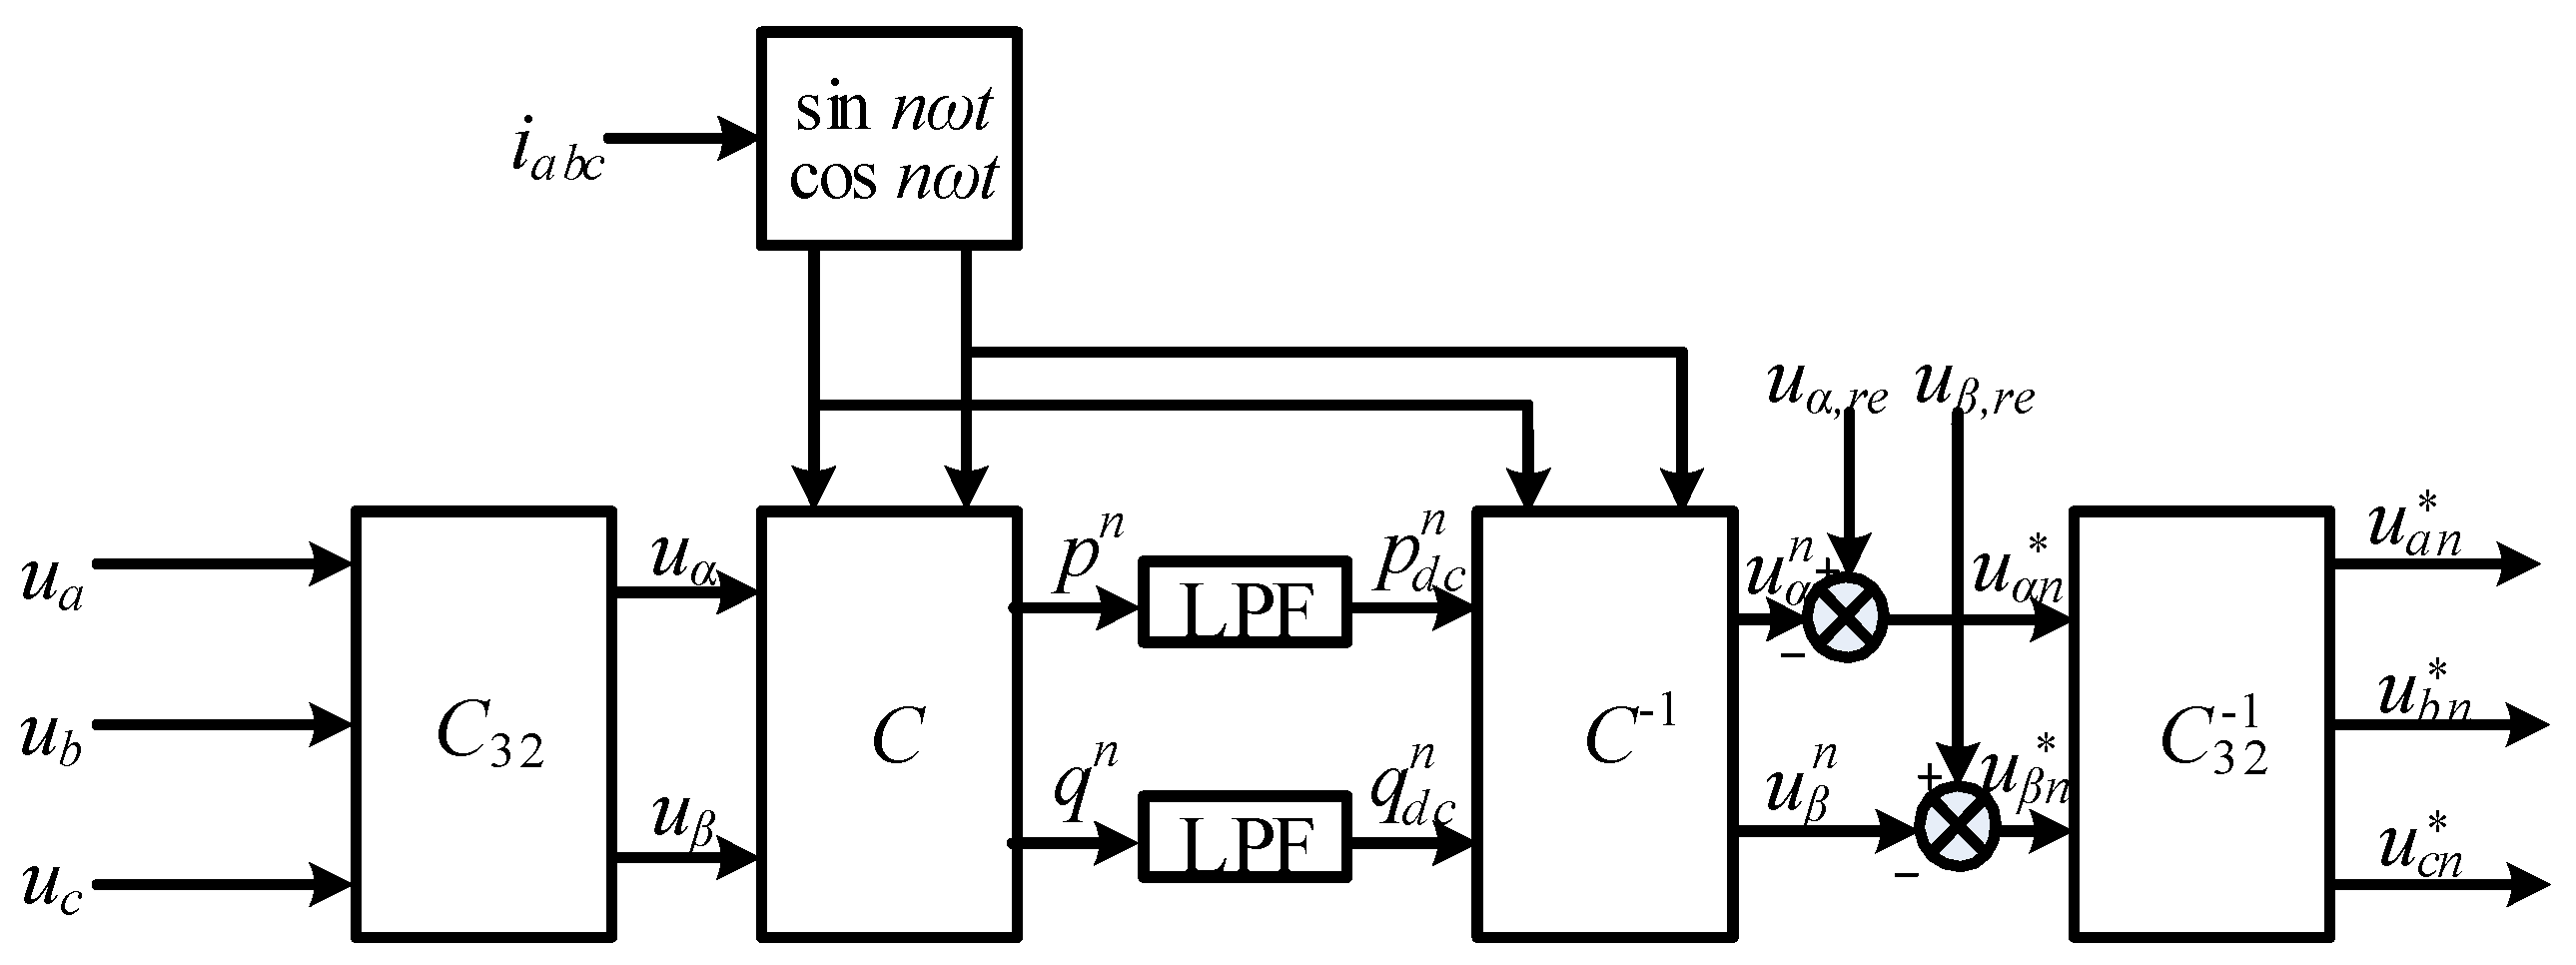
4.1. Random Integer Harmonic Detection

In order to maintain that the distortion is compatible with the testing standards for different conditions, a real-time detection method is indispensable. Since orders of harmonics to be tested are integers, the detection method of random integer-harmonic voltage should be taken so as to get its distortion. The real-time detection method of random integer-harmonic voltage applied in this paper is based on instantaneous reactive power theory. By means of superimposing independent current signals with the same frequency of the harmonic voltage to be detected, detection of the specific-order of voltage harmonics (including fundamental voltage) is realized without affecting the detection precision [36,37]. In practice, the Y-delta connection of the transformer is commonly applied for the integration of WTs. The connection of transformer windings eliminates effects of the background harmonic with the orders of multiples of 3 on WTs. In other words, it is certain that the offshore WTs can remain connected during those disturbances. As a consequence, the testing for those harmonics can be omitted. Good accuracy, fast dynamic performances can be achieved by the proposed method.
Let n be the order of the harmonic voltage to be tested, from the orthogonal operation property of trigonometric function, the order of the current harmonic signal should also be n, as given in (5).
{ i a n = I n sin n ω t i b n = I n sin n ( ω t 2 π / 3 i c n = I n sin n ( ω t + 2 π / 3 )
where, i a n , i b n , and i c n are the nth symmetrical 3-phase harmonic current signal and In is the amplitude. According to the Fourier transformation (FT) theory, the voltage can be represented by Equation (6).
{ u a = m U m sin ( n ω t + φ m ) u b = m U m sin [ n ( ω t 2 π / 3 ) + φ m ] u c = m U m sin [ n ( ω t + 2 π / 3 ) + φ m ]
where, ua, ub, and uc are 3-phase voltage and m represents harmonic order and m = 3k ± 1, k is an integer. Um and φm are the amplitude and initial phase angle, respectively. Equation (5) can be transformed into the α-β orthogonal coordinates as Equation (7).
[ i α n i β n ] = 2 3 [ 1 1 2 1 2 0 3 2 3 2 ] [ i a n i b n i c n ] = 3 2 I n [ sin n ω t cos n ω t ]
where, for n = 3k + 1, “−” is adopted; for n = 3k − 1, “+” is adopted, similarly hereinafter.
The instantaneous power pn and reactive power qn are given as Equation (8).
[ p n q n ] = I n [ sin n ω t cos n ω t ± cos n ω t sin n ω t ] [ 3 2 m U m sin ( m ω t + φ m ) 3 2 m U m c o s ( m ω t + φ m ) ]
When n equals m, there will be dc components, which are defined as p d c n and q d c n . The dc components are shown in Equation (9).
[ p d c n q d c n ] = 3 2 I n U n [ cos ( φ n ) sin ( φ n ) ]
From Equations (7) and (9), the harmonic voltage in the α-β coordinates can be obtained, as given in Equation (10).
[ u α n u β n ] = 3 2 U n [ sin ( n ω t + φ m ) cos ( n ω t + φ m ) ]
The nth voltage harmonic can be derived through the inverse transformation of Equation (10), as given in Equation (11).
[ u a n u b n u c n ] = 2 3 [ 1 0 1 2 3 2 1 2 3 2 ] [ u α n u β n ] = [ U n sin ( n ω t + φ n ) U n sin [ n ( ω t 2 π 3 ) + φ n ] U n sin [ n ( ω t + 2 π 3 ) + φ n ] ]
Equation (11) gives the specific harmonic voltage needed to be compensated. When the distortion for specific harmonic voltage ( u a n , u b n , and u c n ) exceeds the required value, deviation compensation by series APF is applied.
As the required harmonic voltage distortion is given by the testing standards, in other words, the required amplitude of the harmonic voltage, Un,re can be computed. The required compensation voltage injection at each phase by series APF can be obtained by subtracting the detected voltage from the required harmonic voltage, as given in Equation (12) in the α-β coordinates.
[ u α n u β n ] = 3 2 ( U n , r e U n ) [ sin ( n ω t + φ m ) cos ( n ω t + φ m ) ]
The compensation voltage in the time domain can be obtained by substituting μ α n * , μ β n * for μ α n , μ β n in Equation (11). Once the reference compensation harmonic voltage is obtained, it is input to a voltage controller to generate control signals. The three single phase pulse width modulated inverters produce the compensation harmonic voltage according to the control signals. The detection block diagram of the proposed method is shown in Figure 6. C32 and C are given as follows.
C 32 = 2 3 [ 1 1 / 2 1 / 2 0 3 / 2 3 / 2 ] , C = [ sin n ω t cos n ω t ± cos n ω t sin n ω t ]
As shown in Figure 6, the specific harmonic voltage is detected according to the real-time detection algorithm. The required compensation harmonic voltage can then be generated to maintain that the harmonic distortion satisfies the testing requirements. The LPF short for low pass filter is used to obtain the dc component transformed from the desired harmonic voltage.

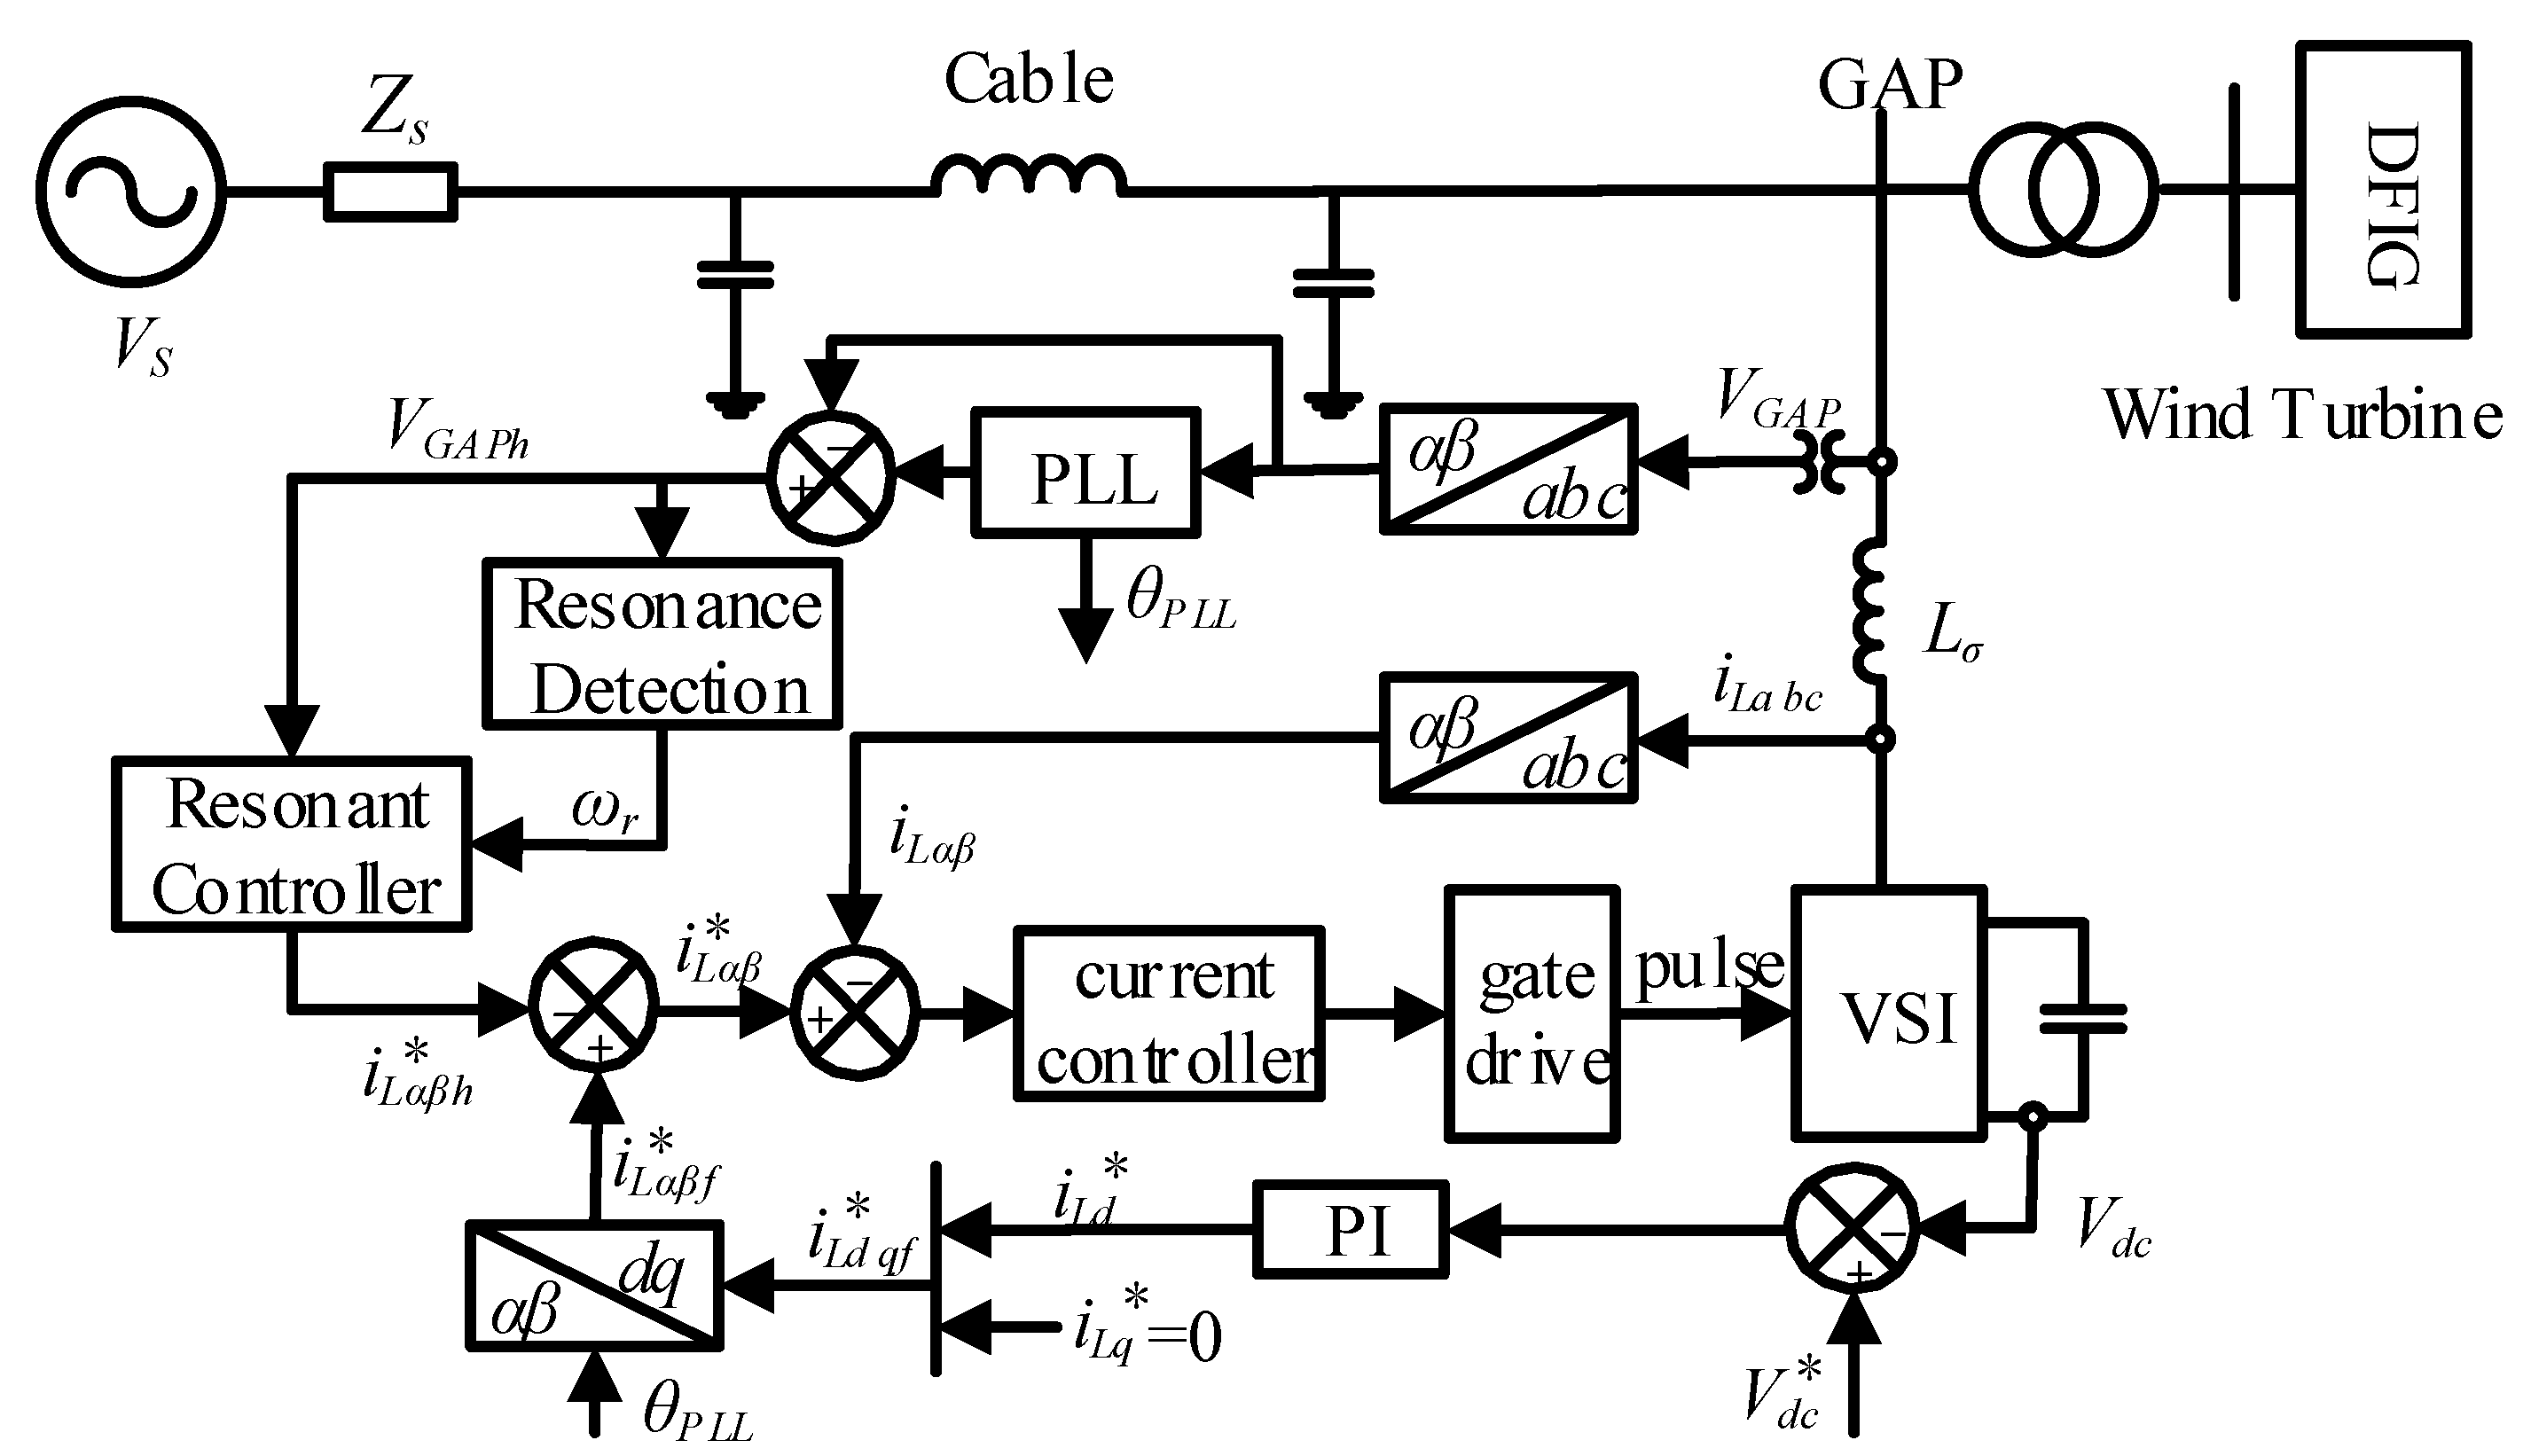
4.2. Control Algorithm of Deviation Compensation Method

Based on the random integer harmonic detection method as presented previously, the schematic diagram of the deviation compensation method is shown in Figure 7. This paper inherits the control scheme introduced in [31]. An output voltage feedback control is used for the compensation control of the harmonic being tested.
The proportional integral (PI) control algorithm is applied to maintain a constant dc link voltage of inverter, which is shown in Figure 7 as H1(s). The fundamental detection part in Figure 7 is used to generate a sinusoidal signal applied to compensate the dc link voltage. From the hth harmonic detection part given in Figure 6, the required hth harmonic compensation reference voltage can be obtained, as given in Equation (12). Considering the frequency scope of HA testing, the cut-off frequency of the control loop must be large enough so as not to affect the reference voltage. In order to guarantee good performance of reference voltage tracking and small phase lag or short response time, a feedback control of output voltage is adopted, as shown in the dashed block in Figure 7 [30,31].
In this closed loop control scheme, the actual injected harmonic voltage is fed back to compare with the reference signal. The error between those two signals is processed through H2(s), as shown by Equation (14), to produce the switching function.
H 2 ( s ) = k 1 + k 2 s k 3 s + 1
The applied modulation process transfer function H3(s) is comprised of a fixed gain and a delay function [29]. H3(s) is shown in Equation (15).
H 3 ( s ) = k d T d s + 1
As for the transfer function G1(s), it represents the control model of series compensator. The applied model is introduced in detail in [31]. Hence, the complete control system transfer function can be obtained. For the sake of analyzing the steady-state reference signal tracking behavior, the closed-loop frequency response of the control system is made. For the HA testing case of 20 km cable length, the following controller parameters are applied, k1 = 3, k2 = 0.001, k3 = 10−5, kd = 5, Td = 0.1 ms (switching frequency is 10 kHz). The closed-loop frequency response is shown in Figure 8.
As can be seen from Figure 8, in the concerned harmonic scope of HA testing, the tracking capability of reference signal is satisfactory. Meanwhile, the phase lag is still small enough to be neglected. Therefore, the control strategy can ensure good performances to compensate all the concerned harmonics in the HA testing.
As aforementioned, though the grid simulator can be controlled to only generate the required harmonic, there may exist some harmonics. Meanwhile, harmonics closed to the resonant frequency may also be generated by DFIG. Considering the large amplification, it is almost sure to have great effects on the testing. The deviation method can be used to eliminate these effects by compensating the relevant harmonics at the significant cost of device capacity. Since the amplification can be suppressed effectively by a small change of harmonic impedance, an SHD method based on shunt APF is applied. As the device is controlled to synthesize a small impedance and only work for the selected frequency, thereby, the capacity of shunt APF can be designed much lower. The shunt APF of small capacity is used to cope with extremely amplified harmonics instead of compensating of the large deviation with the proposed method. As a consequence, the device capacity can be reduced significantly. The control scheme of SHD is given in Section 5.

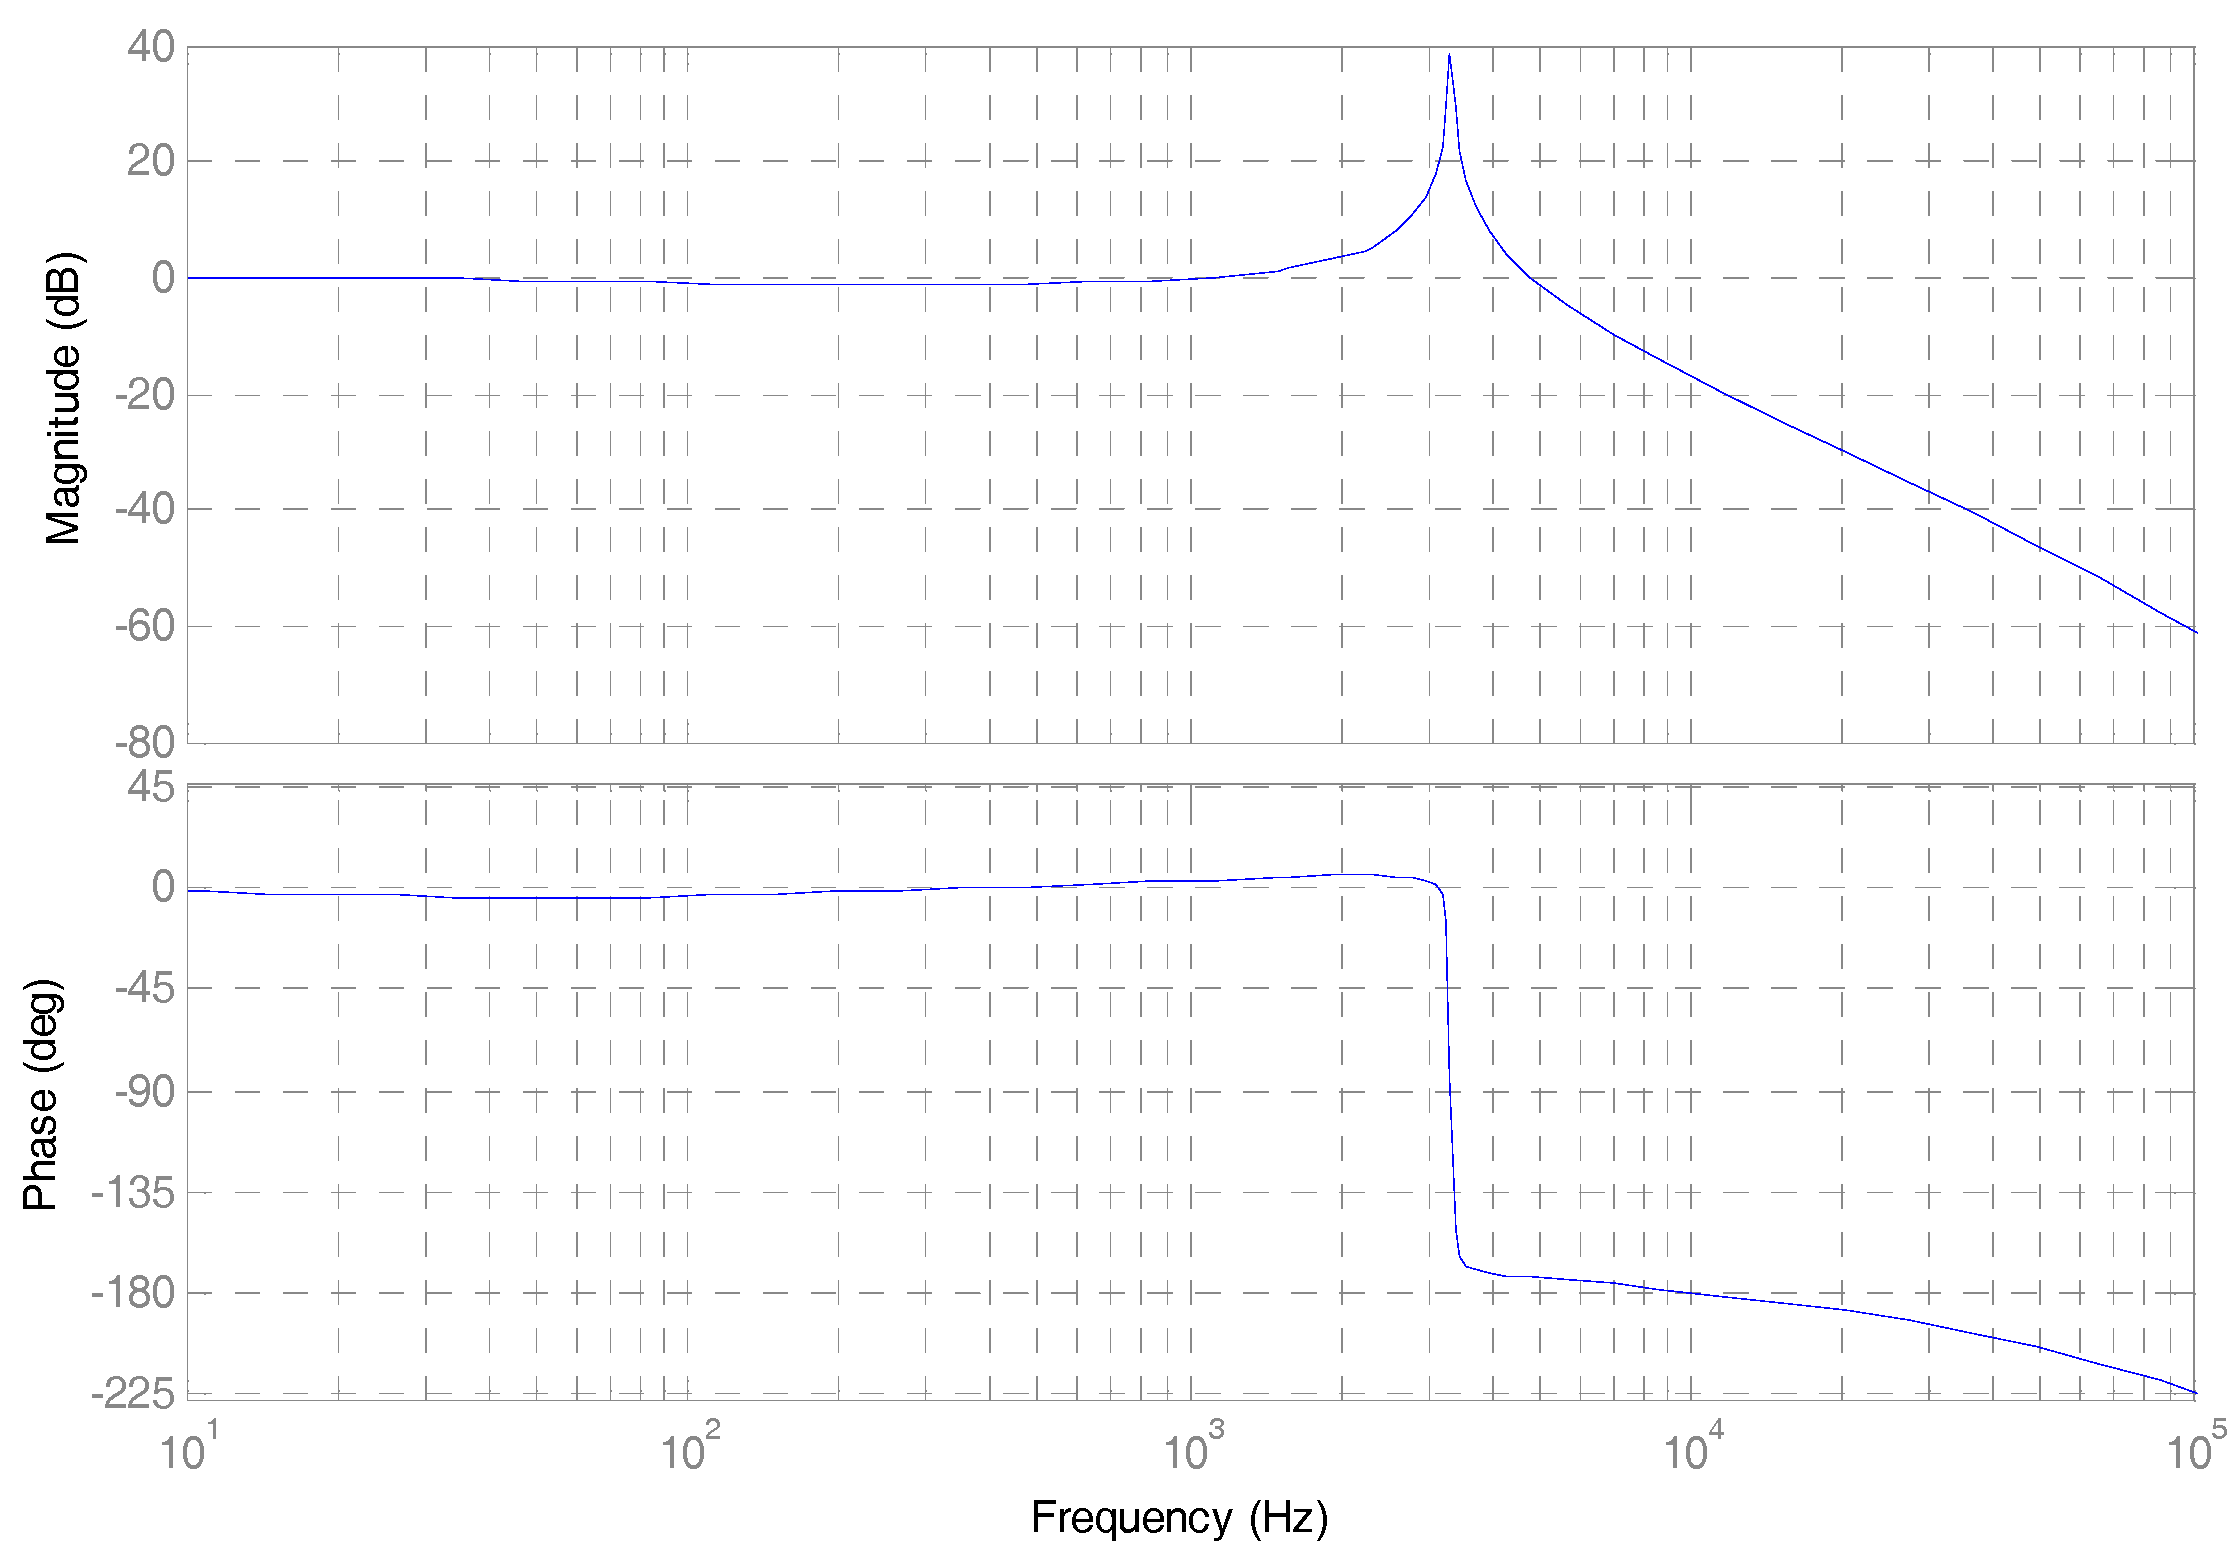
5. Selective Harmonic Damping

Note that the inherent defects of passive filters, which suppress one resonance frequency but introduce another and cannot be adjusted flexibly and continually, result in the difficulty of parameters matching for the wide bandwidth testing. Therefore, it is impractical for testing implementation.
Distinct from passive filters, the general idea behind this proposal is to reshape the system impedance seen from the grid access point of WTs dynamically under different testing conditions, such that the potential amplification or resonance then can be mitigated effectively [34,35]. It is controlled to work only for the selected harmonic frequency, so the defect of introducing other resonances can be avoided. Meanwhile, this advantage reduces the designed device capacity to a level lower than the traditional APF and high carrier/switching frequency can then be applied. In consequence, an adequate bandwidth covering the concerned harmonic frequency with high control precision for the testing can be achieved.
Figure 9 depicts the schematic configuration of the parallel damper and its control block diagram. As shown in Figure 9, the resonant or amplified components are directly compensated by a multiple frequency resonant voltage controller [34]. The resonant controller are based on two integrators [38] and it is expressed as the following equation:
G rc , h ( s ) = K r , h ω c , h s s 2 + ω c , h s + ω r , h 2
where, ωr,h, ωc,h, and Kr,h are the center frequency, the bandwidth, and the gain of the hth resonant controller, respectively. Rrc,h = Grc,h and Rref,h = 1/Kr,h are the actual and the referenced hth harmonic damping resistance emulated by the device. It’s worth mentioning that the shunt device works as a variable resistor only at the selected harmonic frequency. In order to maintain a constant capacitor voltage, a PI control strategy is applied.
In terms of the resonance detection part shown in Figure 9, there are several techniques to achieve this [34,39]. In real testing, since the integer harmonic within the testing scope maybe be amplified to different degree, thus the accurate resonance frequency is not necessary. The resonance mode analysis in Section 3 can be used to obtain the harmonic needed to be damped directly and easily. In addition, the adaptive resonance detection method proposed by [34] provides a convenient way adapting to variable testing conditions. After attaining the harmonic order to be damped, the parameters of the control system can be designed according to the given testing conditions.
A controlled impedance is introduced to the equivalent circuit at GAP as shown in Figure 10. The impedance Z4(h) denoted in Equation (3) becomes Z4(h) = Z1(h) + Z3(h)//[Y1(h)/2]//Zeq(h), Zeq(h) is the equivalent impedance of the controlled APF at the selected harmonic frequency.

6. Simulation Results

Time domain simulation is carried out to confirm the effectiveness of the proposed method. 5 MW DFIG and 20 km cable are applied. The parameters of cables and DFIG are given in Section 3 Appendix A respectively. As shown in Figure 5, according to the testing procedure given in Section 2, harmonics of orders less than 6 or larger than 9 are barely amplified, which are seen as the non-amplified harmonics. The 7th and 8th harmonics are regarded as the amplified harmonics.
For comparison, simulation before and after the introduction of cables is performed. In other words, the local testing method and the proposed method are applied.

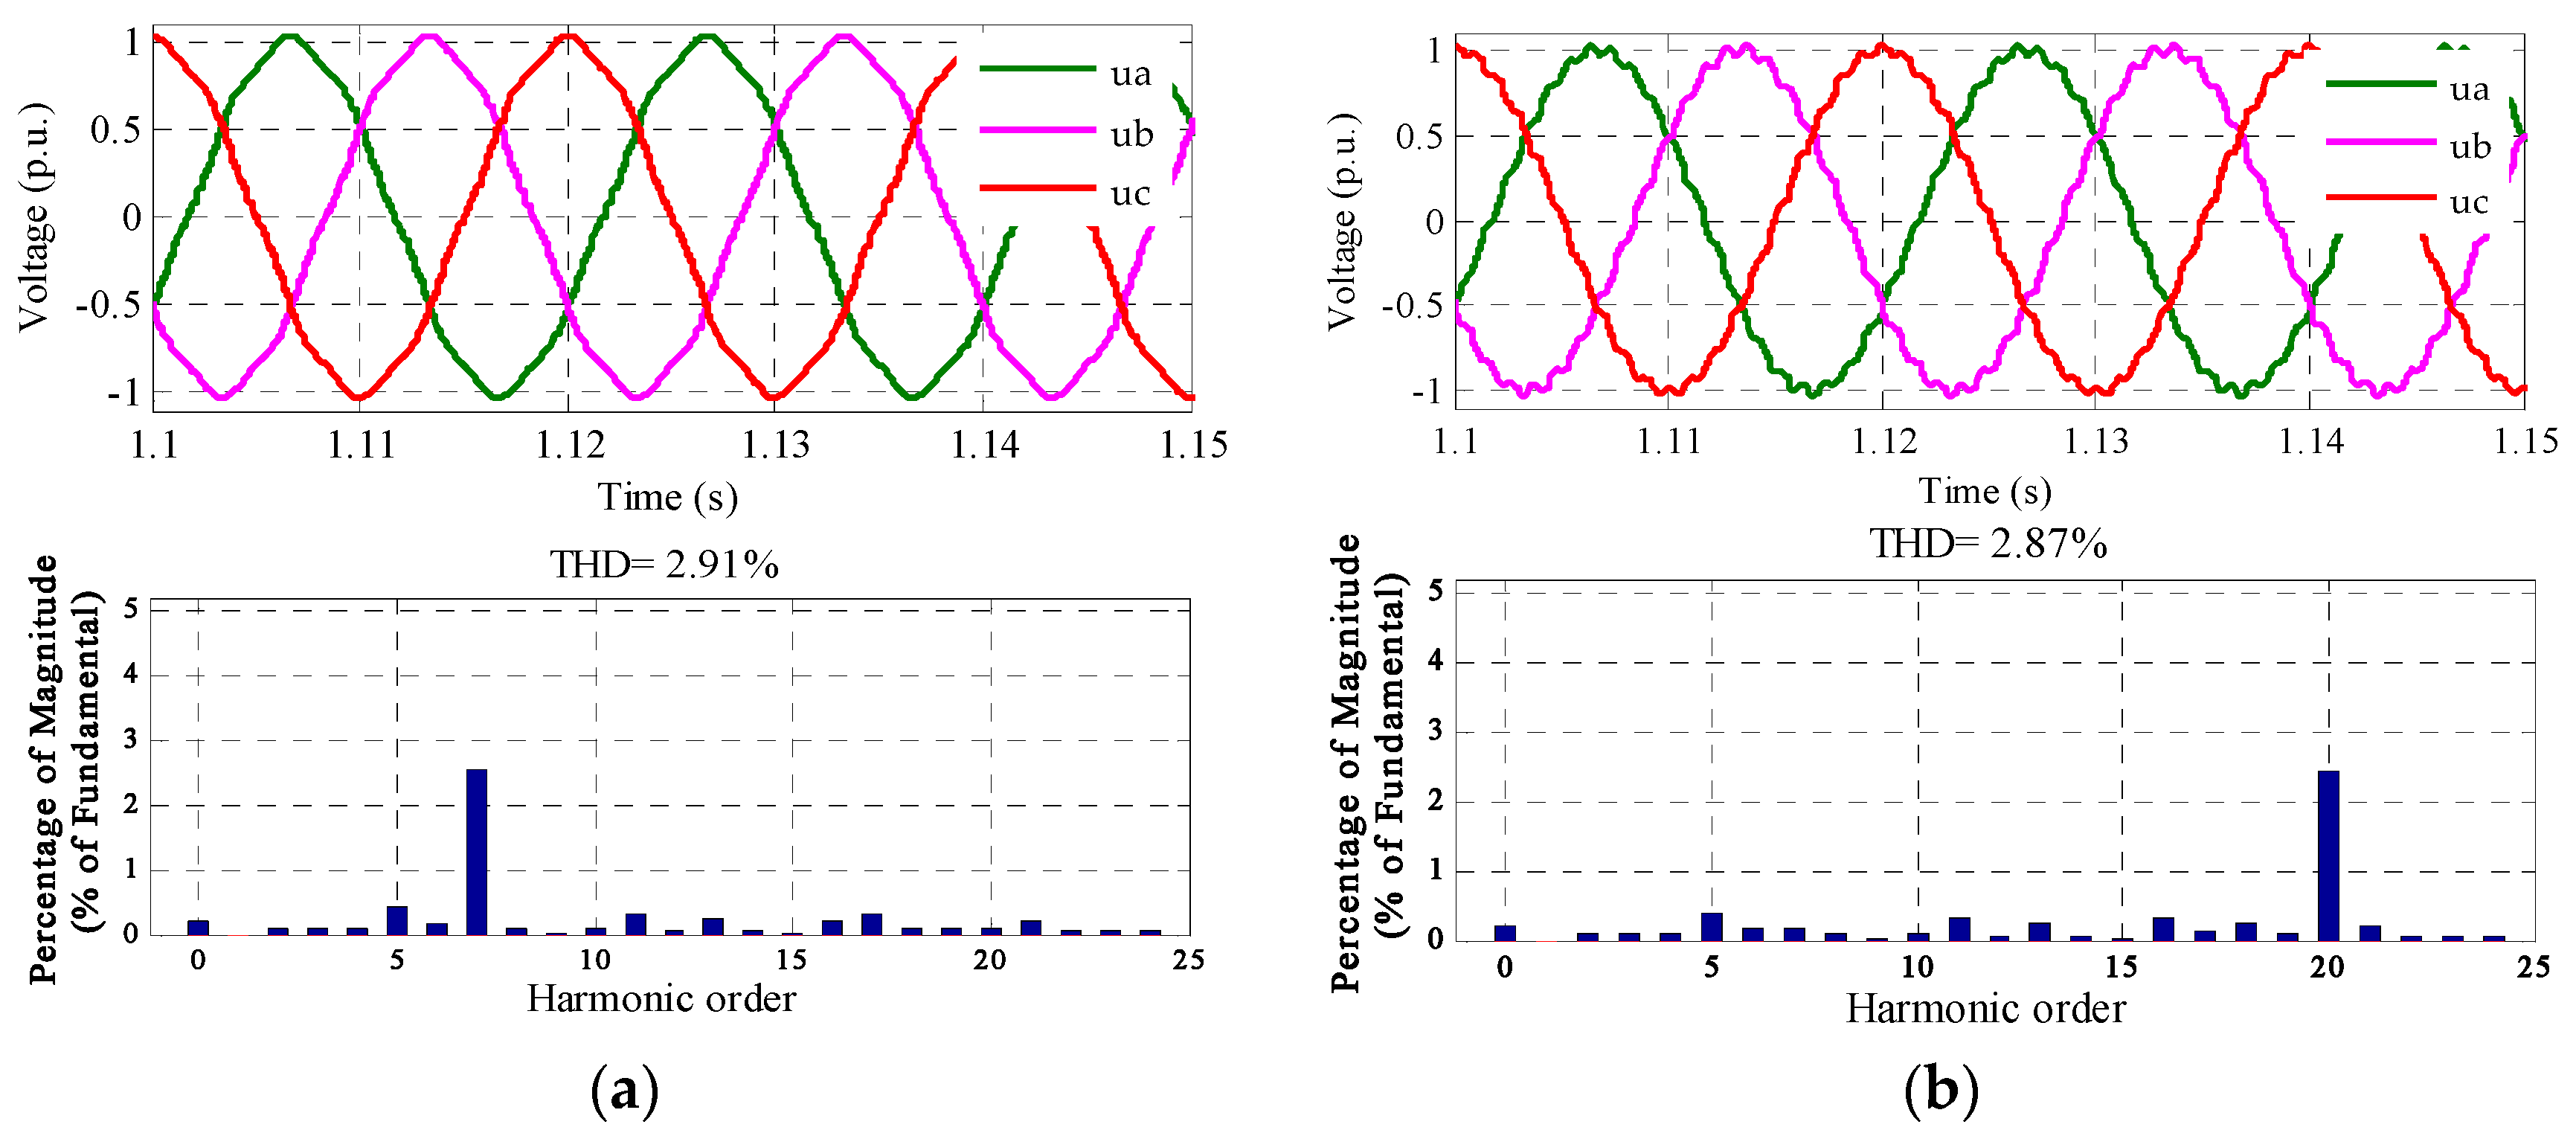
6.1. The Local Testing Method

The simulation of HA testing without cables is given first. When there is no cable and the local testing method is applied, the grid simulator generates the required harmonic distortion directly. Simulation results of 7th and 20th harmonic testing, which represent amplified and non-amplified harmonics, are shown in Figure 11a,b, respectively.
As can be seen from Figure 11, when there are no effects of cables, the 7th and 20th harmonic distortions at the grid access point are meeting the requirements of testing standards. Consequently, the testing can be performed directly and there is no need to worry about drawing wrong conclusions.

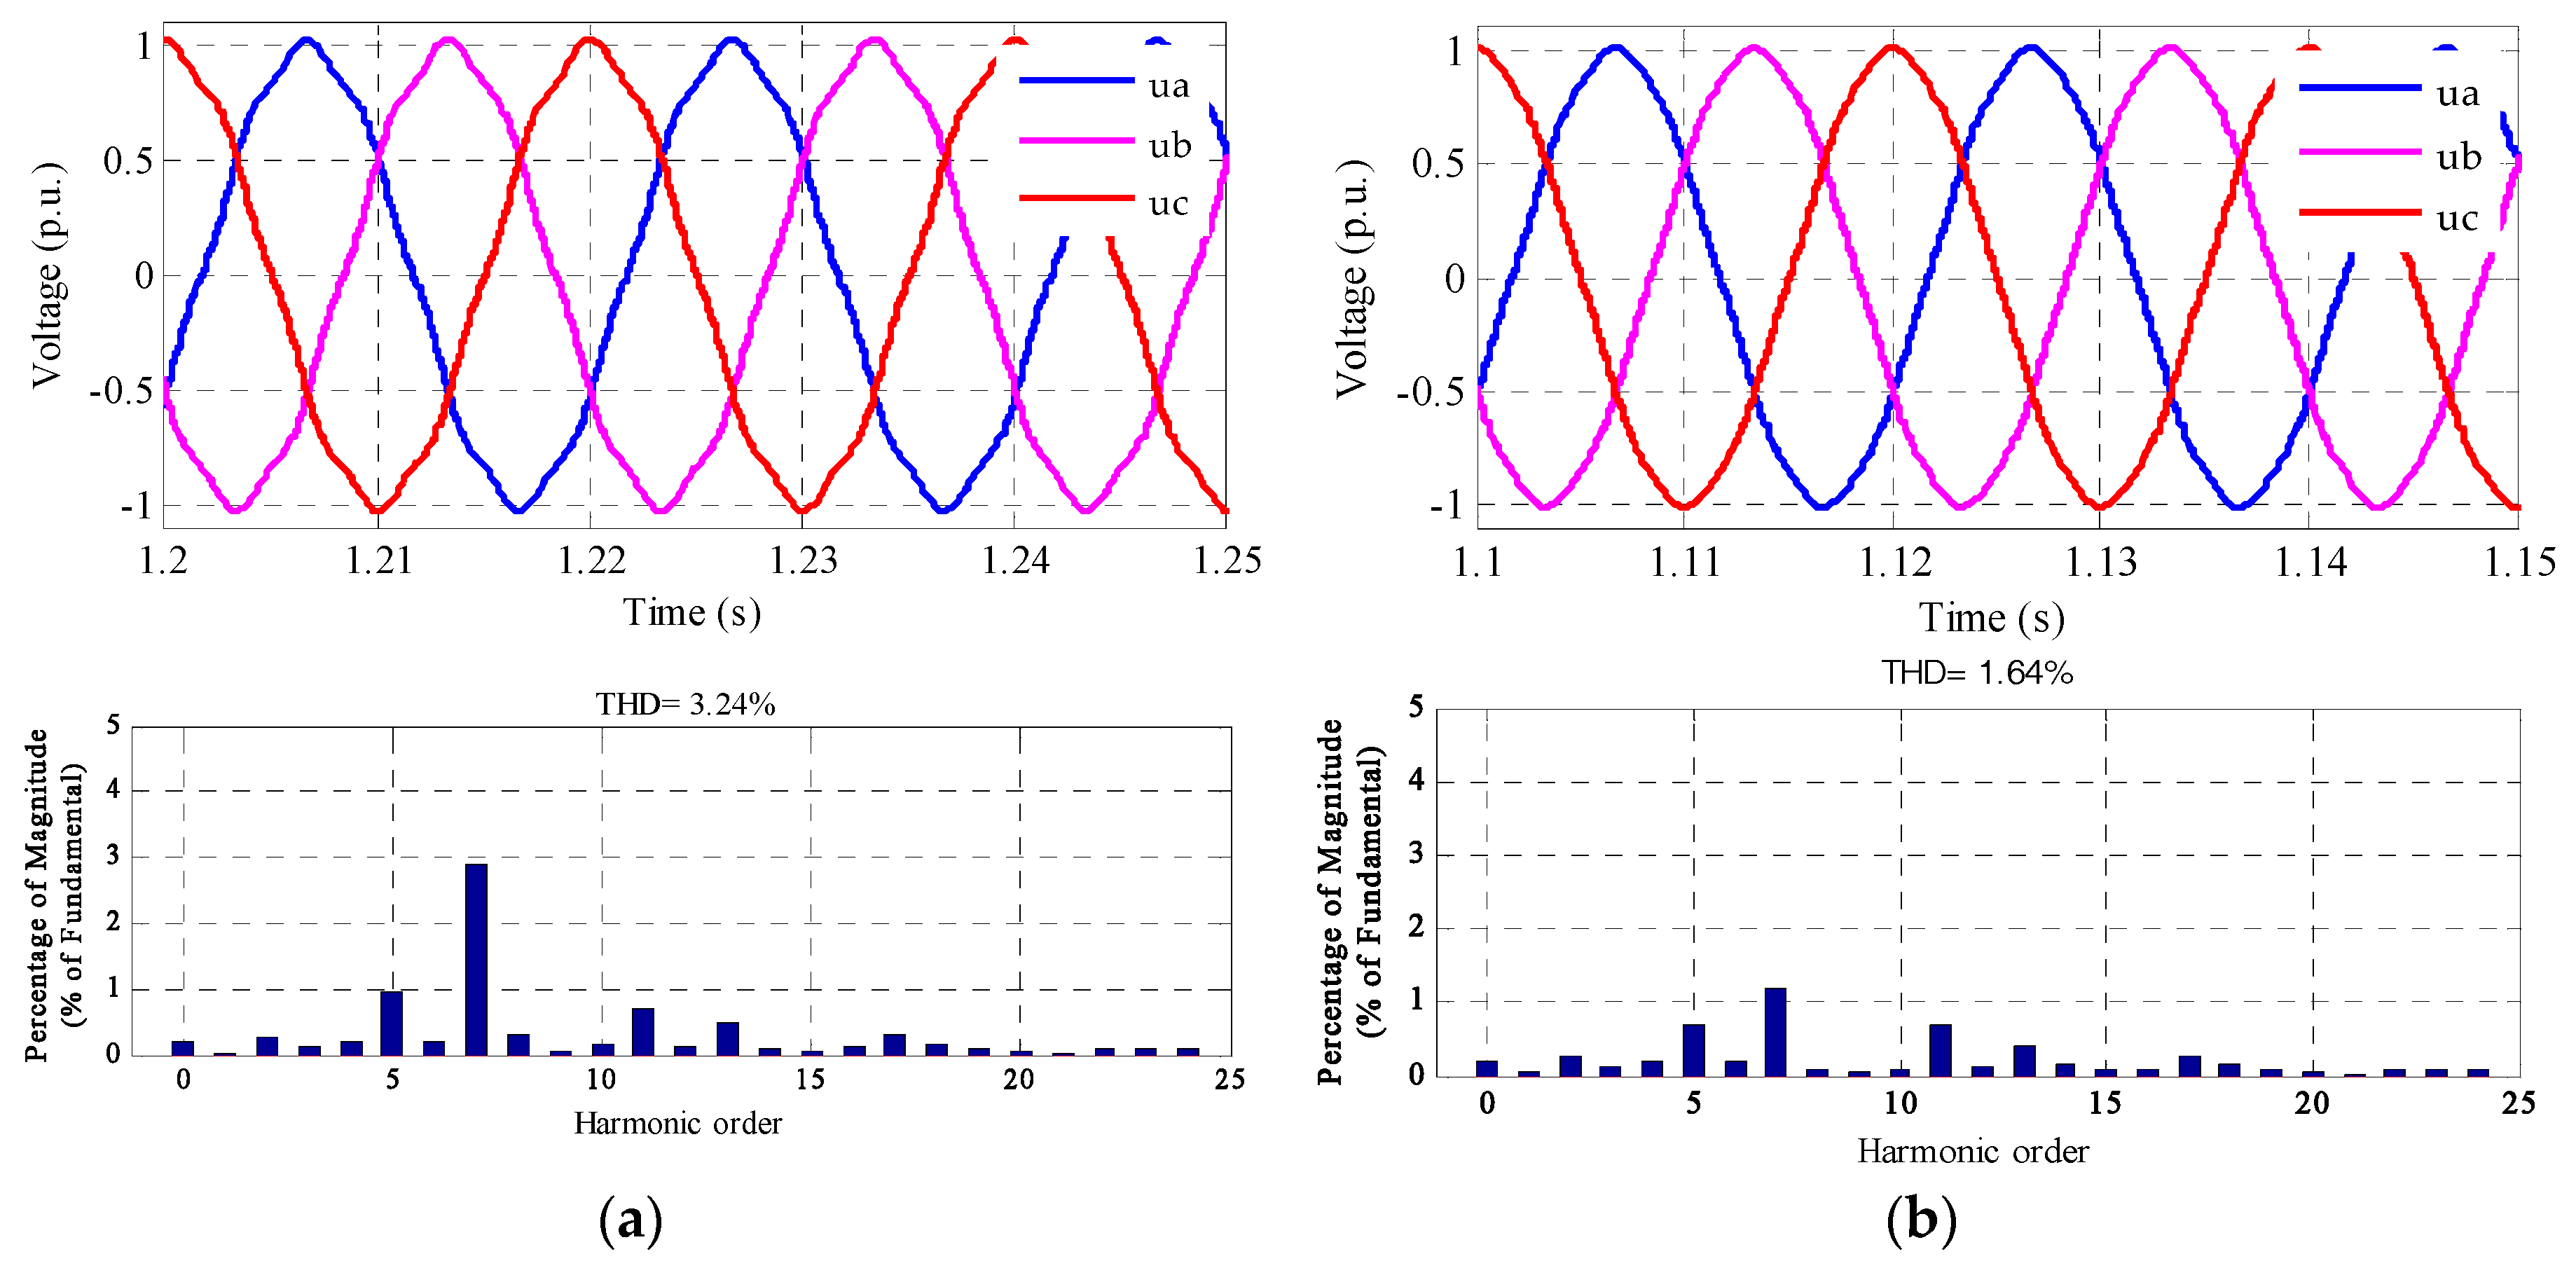
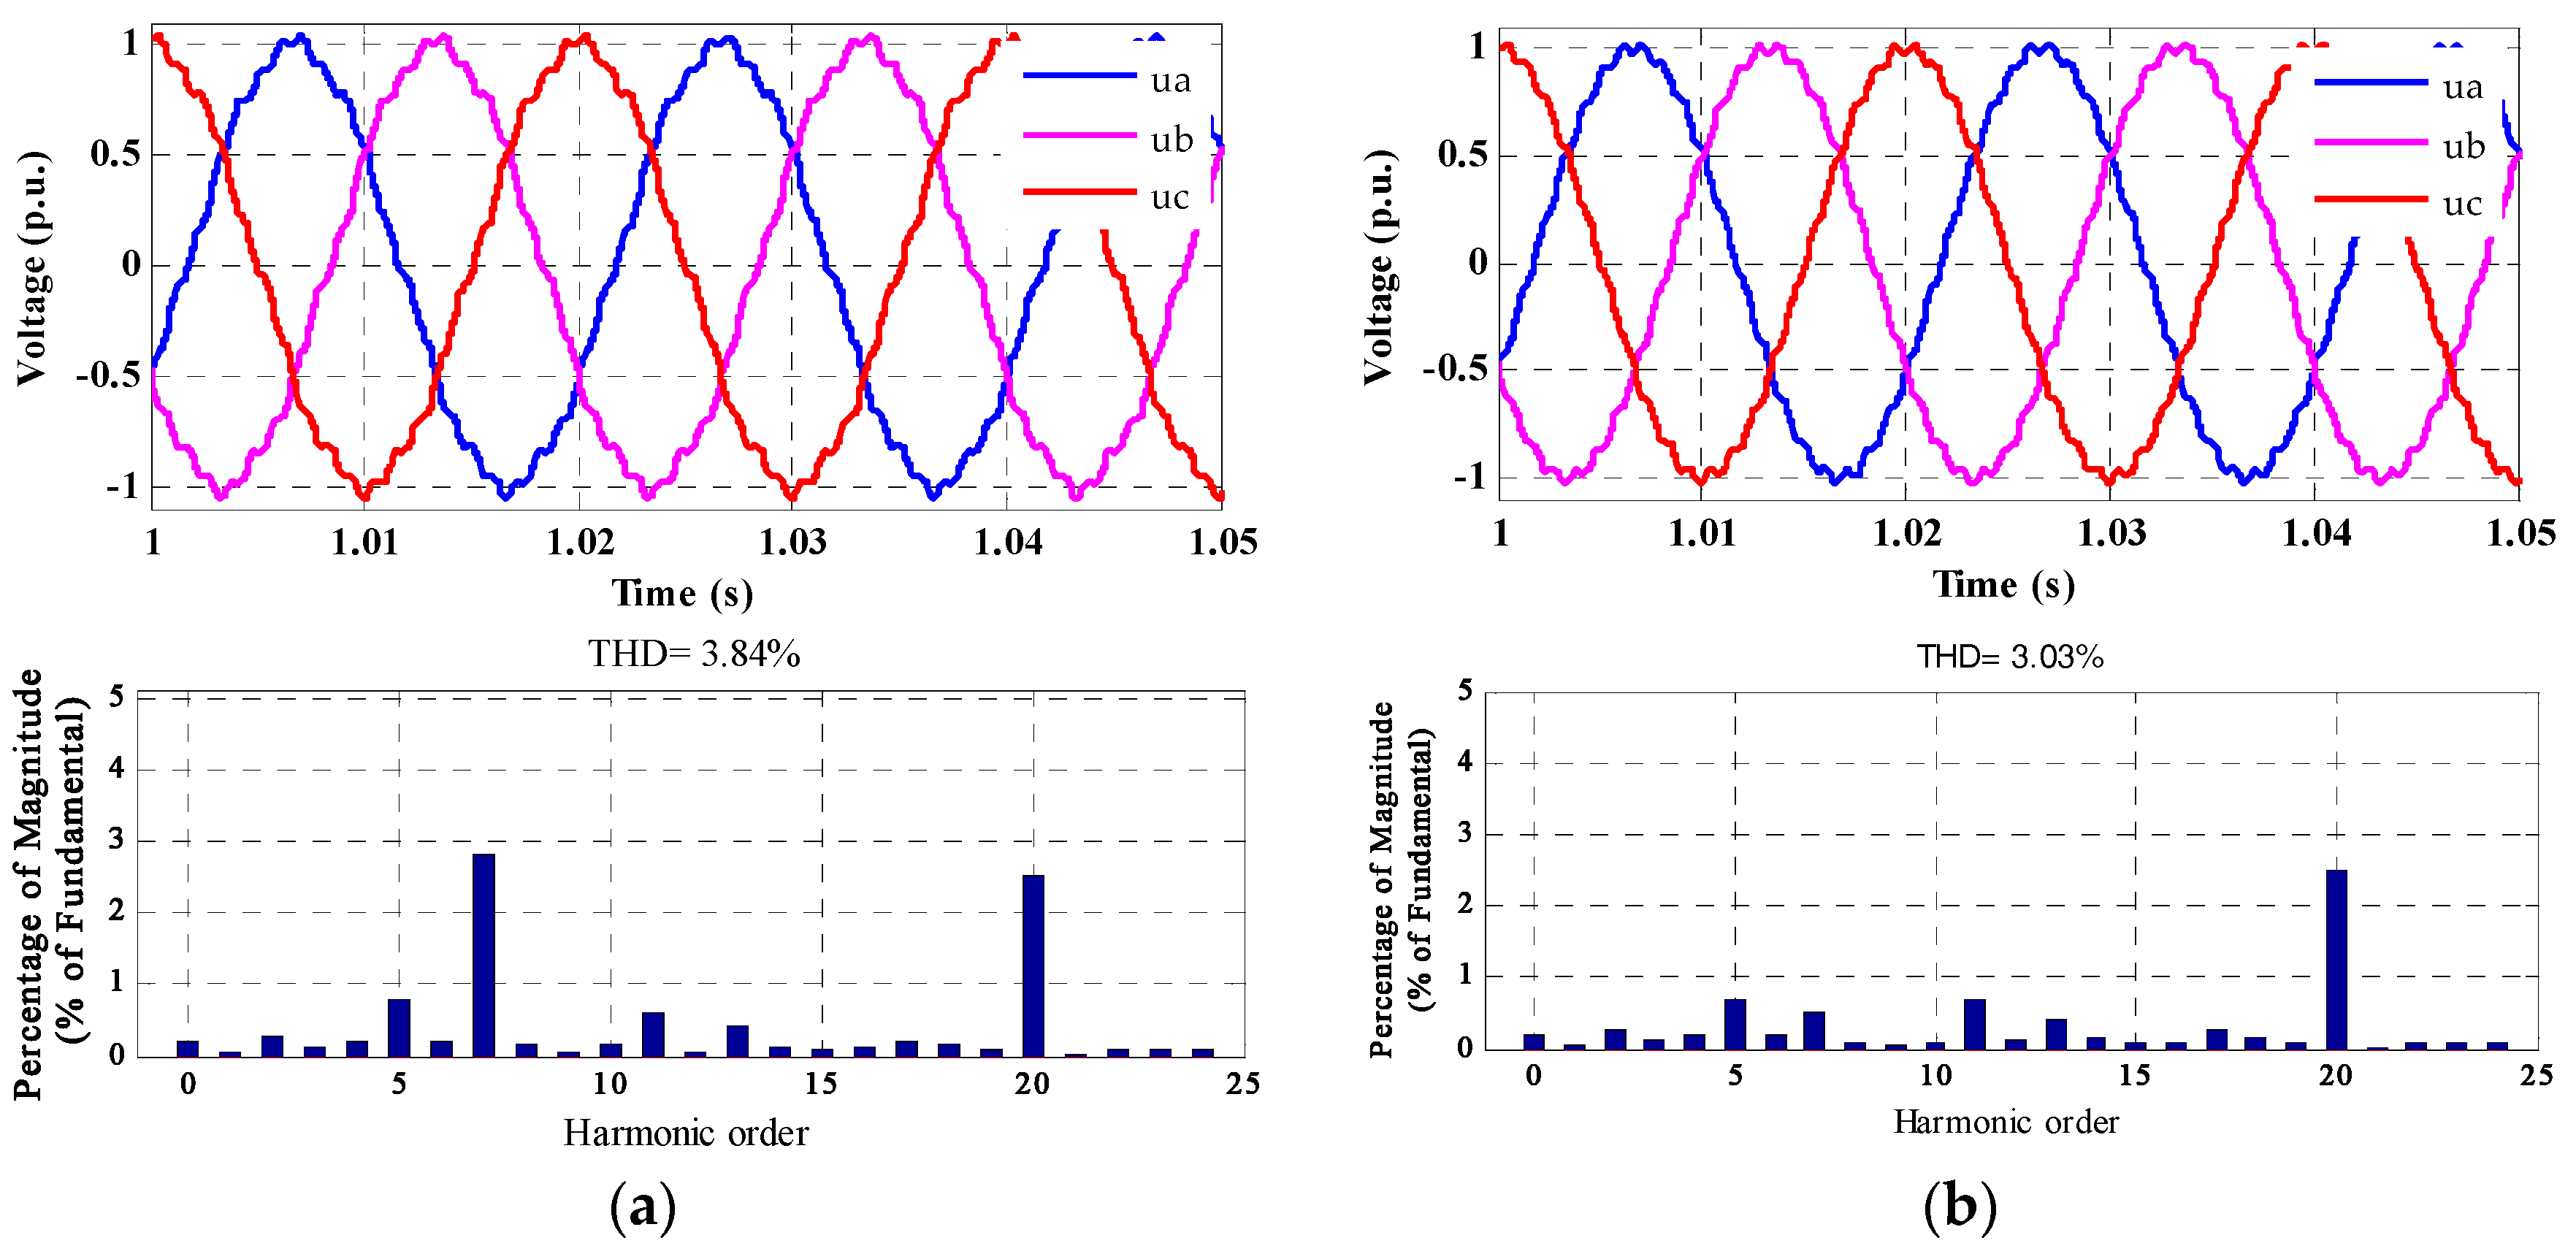
6.2. Deviation Compensation Method

Parameters used in the simulation of the deviation compensation method are given as follows. The turns ratio of the series transformer is 1:1; the dc-link voltage is 2200 V, the dc link capacitor is 11,000 μF; the output filter parameters are L = 0.4 mH, C = 3 μF, the switching frequency is 10 kHz. The control system parameters are given in Section 4. The designed capacity of series APF is 150 KVA.
The simulation results of 7th harmonic testing are given in Figure 12 firstly. Figure 12a shows the simulation results of background harmonics at grid access point when the 20 km cable is connected but without harmonics generated by grid simulator.
Simulation results show that the 7th harmonic distortion exceed the required value. As the 7th harmonic is considerably amplified that the distortion is difficult to keep under the required value when subjected to disturbances. Hence, the capacity of the devices should be designed large enough to compensate the probable large deviation. For those occasions, the amplification or resonance can be damped by the SHD method initially. Figure 12b shows the result after the emulation of 15 Ω impedance at the 7th harmonic frequency. The simulation parameters used in the SHD method can be found in the Appendix A Table A4. It can be seen that the distortion of 7th harmonic is reduced obviously and there are no undesired resonance occurring. On that account, the 7th harmonic can be tested as the non-amplified harmonics using the proposed method. The corresponding simulation results are shown in Figure 13. The designed capacity of shunt APF is 500 KVA.
It is graphically illustrated that the 7th harmonic distortion is now maintained at 2.5%. Though harmonics such as 5th order are amplified to some extent, it will not affect the testing results and conclusions. Since the proposed method only works for one frequency and the deviation is reduced as small as possible by adjusting the grid simulator output. Therefore the low power design is permissible.
In terms of the 20th order of harmonic testing, as can be seen in Figure 5, its distortion could be guaranteed to 2.5% by adjusting the output of grid simulator according to Equation (4) approximately, and the proposed method can be used to maintain the distortion at the required value accurately, the simulation results are shown in Figure 14a.
It is noted that the effects of background harmonics, especially the 7th harmonic, need to be eliminated to ensure convincing test conclusions. So the 7th harmonic should be damped using the SHD method when the 20th harmonic testing is carried out. Figure 14b shows the simulation results after damping the 7th order of harmonic by choosing the emulation impedance as 10 Ω. As can be seen from the simulation results, the 7th harmonic distortion decreased from 2.9% to 0.5% and the 20th harmonic testing can be performed successfully.
In Figure 5 and Figure 12, the resonance or amplification caused by introduction of cables has great effects on HA testing. When there are no cables, the HA testing can be performed successfully by controlling the output of grid simulator. The HA testing for offshore WTs, however, cannot be carried out by the local testing method. The SHD method with low design capacity works for the selected harmonic frequency to suppress the amplification or resonances. Thus, the effects of the background harmonics generated by WTs owing to the large amplification can be eliminated. Then, the distortion of testing harmonics can be adjusted by the grid simulator and the error can be reduced by the proposed compensation method. The deviation for amplified harmonics is reduced significantly by the SHD method, thus allowing a low capacity of the proposed method. Compared to the local testing method used for onshore WTs, it can be seen from the simulation results that the proposed method can eliminate the effects of cables and maintain the harmonic voltage distortion at the required value with the corporation of SHD method. Therefore, the HA testing can be performed in accordance with the standards.

7. Conclusions

In order to satisfy the requirements for on-site offshore WTs HA testing, the deviation compensation method is proposed in this paper. By attenuating possibly incurring harmonic resonance caused by cables properly, the HA testing for offshore WTs can be tested at the remote site. In comparison with the local testing method, there is no limitation due to transportation, accessibility, and fixation of testing devices for the proposed method.
Submarine cables have great effects on remote HA testing, and simulation results indicate that harmonics orders from 2 to 25 are amplified to a different degree with the change in cable length. Harmonics amplification or resonance during the testing can be tackled with the SHD method.
The closed loop control strategy of the deviation method has large bandwidth and good compensation characteristics in harmonic voltage compensation. The SHD method can be controlled to emulate resistive behavior only for the selected harmonic frequency dynamically. Only the necessary specific harmonics are compensated or damped by the proposed method, thus the capacity of the designed devices can be reduced. During the real HA testing, with the corporation of SHD method, the large deviation because of extreme amplification for some harmonics can be reduced, the capacity of the equipment can be lowered further. Meanwhile, the effects of background harmonics close to resonance center, which may be generated by WTs and grid simulator, can also be eliminated. The effectiveness of the proposed method are validated by the time domain simulations.
It is expected that there will be an optimal capacity design of the two devices, which will be discussed further in the following research.

Acknowledgments

This work is supported by the National Key Technology Research and Development Program of China (No. 2015BAA07B01).

Author Contributions

Zimin Jiang and Yutian Liu proposed the ideas. Zimin Jiang, Changgang Li, Xiaohao Liu, and Ruiming Wang implemented the simulation and wrote and revised the article.

Conflicts of Interest

The authors declare no conflict of interest.

Appendix A

Table A1. 5 MW doubly fed induction generator (DFIG) parameters.
ParametersElectrical Values
SbRated power5 MW
VsStator voltage (L-L)690 V
rsStator resistance0.003 p.u.
rrRotor resistance (referred to stator)0.004 p.u.
LlsStator leakage inductance0.125 p.u.
LlrRotor leakage inductance (referred to stator)0.05 p.u.
LmMagnetizing inductance2.5 p.u.
Table A2. 5 MW DFIG L filter and controller parameters.
ParametersValuesParametersValues
Ll125 μHVG480 V
Kprsc0.2VSR690 V
Kirsc2VPCC35 kV
Kpgsc0.05K12.03
Kigsc2K21.55
Table A3. Transformer parameters.
SbVnUk%I0%
5500 kVA35 kV/690 V6.50.8
Table A4. Simulation parameters of the selective harmonic damping (SHD) method.
ParametersValuesParametersValues
Filter inductanceLfD3 mHDC-link voltageVdc2.2 kV
Switching frequencyfsf20 kHzPR controllerKp_i30
Kr_i600
DC-link voltage controllerKp_dc0.05Resonant controllerKr_v2
Ki_dc0.5ωr750
DC capacitorCdc10,000 μFSampling periodTs50 μs

References

  1. Santos-Mugica, M.; Robles, E.; Endegnanew, A.G.; Tedeschi, E.; Giebhardt, J. Grid integration and power quality testing of marine energy converters: Research activities in the MARINET project. In Proceedings of the 9th International Conference of Ecological Vehicles and Renewable Energies, Monte-Carlo, Monaco, 25–27 March 2014; pp. 1–9. [Google Scholar]
  2. Qi, Y.; Liu, Y. Wind Power Ramping Control Using Competitive Game. IEEE Trans. Sustain. Energy 2016, 7, 1516–1524. [Google Scholar] [CrossRef]
  3. Liu, Y.; Fan, R.; Terzija, V. Power system restoration: A literature review from 2006 to 2016. J. Mod. Power Syst. Clean Energy 2016, 4, 332–341. [Google Scholar] [CrossRef]
  4. Li, S.; Qin, S.; Wang, R.; Li, Q.; Chen, C. Study on grid adaptability testing methodology for wind turbines. J. Mod. Power Syst. Clean Energy 2013, 1, 81–87. [Google Scholar] [CrossRef]
  5. Jiang, Z.; Kumar, M.; Liu, Y. A grid adaptability test method eliminating cable impacts for offshore wind turbines. In Proceedings of the 2016 China International Conference on Electricity Distribution, Xi’an, China, 10–13 August 2016; pp. 1–4. [Google Scholar]
  6. International Electro-technical Commission. IEC 61400-24 Wind Turbines-Part 21: Measurement and Assessment of Power Quality Characteristics of Grid Connected Wind Turbines; International Electro-technical Commission: Geneva, Switzerland, 2008. [Google Scholar]
  7. National Energy Administration of China. NB/T 31054 Test Procedure of Wind Turbine Grid Adaptability; National Energy Administration of China: Beijing, China, 2014. [Google Scholar]
  8. Ping, J.; Dai, C.B.; Wu, S.Y.; Jin, X.F. A scheme on adaption detection of large-capacity wind turbines to the power grid. In Proceedings of the International Conference of Advanced Power System Automation and Protection, Beijing, China, 16–20 October 2011; pp. 900–905. [Google Scholar]
  9. Fan, L.; Yuvarajan, S.; Kavasseri, R. Harmonic analysis of a DFIG for a wind energy conversion system. IEEE Trans. Energy Convers. 2010, 25, 181–190. [Google Scholar]
  10. Zhao, W.; Xie, C.; Liu, Y. Resonance analysis of DFIG-based offshore wind farm. In Proceedings of the 2015 IEEE Region 10 Conference, Macau, China, 1–4 November 2015; pp. 1–4. [Google Scholar]
  11. Song, Y.; Blaabjerg, F. Overview of DFIG-based wind power system resonances under weak networks. IEEE Trans. Power Electron. 2017, 32, 4370–4394. [Google Scholar] [CrossRef]
  12. Miao, Z. Impedance-model-based SSR analysis for type 3 wind generator and series-compensated network. IEEE Trans. Energy Convers. 2012, 27, 984–991. [Google Scholar] [CrossRef]
  13. Vieto, I.; Sun, J. Sequence impedance modeling and analysis of type-III wind turbines. IEEE Trans. Energy Convers. 2017. [Google Scholar] [CrossRef]
  14. Liu, H.; Sun, J. Voltage stability and control of offshore wind farms with AC collection and HVDC transmission. IEEE J. Emerg. Sel. Top. Power Electron. 2014, 2, 1181–1189. [Google Scholar]
  15. Chien, C.H.; Bucknall, R.W.G. Theoretical aspects of the harmonic performance of subsea AC transmission systems for offshore power generation schemes. IET Proc. Gener. Transm. Distrib. 2006, 153, 599–609. [Google Scholar] [CrossRef]
  16. Liang, X.; Jackson, W.M. Influence of subsea cables on offshore power distribution systems. IEEE Trans. Ind. Appl. 2009, 45, 2136–2144. [Google Scholar] [CrossRef]
  17. Zhang, S.; Jiang, S.; Lu, X.; Ge, B.; Peng, F.Z. Resonance issues and damping techniques for grid-connected inverters with long transmission cable. IEEE Trans. Power Electron. 2014, 29, 110–120. [Google Scholar] [CrossRef]
  18. Luo, A.; Xu, Q.; Ma, F.; Chen, Y. Overview of power quality analysis and control technology for the smart grid. J. Mod. Power Syst. Clean Energy 2016, 4, 1–9. [Google Scholar] [CrossRef]
  19. Shuai, Z.K.; Liu, D.; Shen, J.; Tu, C.; Cheng, Y.; Luo, A. Series and parallel resonance problem of wideband frequency harmonic and its elimination strategy. IEEE Trans. Power Electron. 2014, 29, 1941–1952. [Google Scholar] [CrossRef]
  20. Chaudhary, S.K.; Lascu, C.; Hoseinzadeh, B.; Teodorescu, R.; Kocewiak, H.; Sørensen, T.; Jensen, C.F. Challenges with harmonic compensation at a remote bus in offshore wind power plant. In Proceedings of the 16th International Conference of Environment and Electrical Engineering (EEEIC), Florence, Italy, 7–10 June 2016; pp. 1–6. [Google Scholar]
  21. Smith, K.S.; Ran, L. Active filter used as a controlled reactance to prevent harmonic resonance in interconnected offshore power systems. IEE Proc. Gener. Transm. Distrib. 1999, 146, 393–399. [Google Scholar] [CrossRef]
  22. Shen, H.; Yang, L.; Sun, X.; Li, Z.; Han, R.; Chen, Z. Active power filter equivalent to an infinite feeder for harmonic suppression in radial distribution systems. IET Power Electron. 2016, 9, 1331–1340. [Google Scholar] [CrossRef]
  23. Hasan, K.N.B.; Rauma, K.; Luna, A.; Candela, J.I.; Rodríguez, P. Harmonic compensation analysis in offshore wind power plants using hybrid filters. IEEE Trans. Ind. Appl. 2014, 50, 2050–2060. [Google Scholar] [CrossRef]
  24. Huali, C.; Yunlian, S.; Wei, C. Harmonic suppression of grid-connected distributed generation based on novel hybrid power filter. In Proceedings of the 4th IEEE Conference of International Electronics and Applications, Xi’an, China, 25–27 May 2009; pp. 2914–2918. [Google Scholar]
  25. Wang, T.X.; Choi, S.S.; Sng, E.K.K. Series compensation method to mitigate harmonics and voltage sags and swells. IET Gener. Transm. Distrib. 2007, 1, 96–103. [Google Scholar] [CrossRef]
  26. Shu, Z.; Lin, H.; Zhang, Z.; Yin, X.; Zhou, Q. Specific order harmonics compensation algorithm and digital implementation for multi-level active power filter. IET Power Electron. 2017, 10, 525–535. [Google Scholar] [CrossRef]
  27. Mattavelli, P. A closed-loop selective harmonic compensation for active filters. IEEE Trans. Ind. Appl. 2001, 37, 81–89. [Google Scholar] [CrossRef]
  28. Chen, X.; Dai, K.; Xu, C.; Li, P.; Zhang, Y. Harmonic compensation and resonance damping for SAPF with selective closed-loop regulation of terminal voltage. IET Power Electron. 2017, 10, 619–629. [Google Scholar] [CrossRef]
  29. Jianben, L.; Shaojun, D.; Qiaofu, C.; Kun, T. Modelling and industrial application of series hybrid active power filter. IET Power Electron. 2013, 6, 1707–1714. [Google Scholar] [CrossRef]
  30. Alali, M.A.E.; Chapuis, Y.-A.; Saadate, S.; Braun, F. Advanced common control method for shunt and series active compensators used in power quality improvement. IEE Proc. Electron. Power Appl. 2004, 151, 658–665. [Google Scholar] [CrossRef]
  31. Gupta, R.; Ghosh, A.; Joshi, A. Performance comparison of VSC-based shunt and series compensators used for load voltage control in distribution systems. IEEE Trans. Power. Deliv. 2011, 26, 268–278. [Google Scholar] [CrossRef]
  32. Ribeiro, E.R.; Barbi, I. Harmonic voltage reduction using a series active filter under different load conditions. IEEE Trans. Power Electron. 2006, 21, 1394–1402. [Google Scholar] [CrossRef]
  33. Inzunza, R.; Akagi, H. A 6.6-kV transformerless shunt hybrid active filter for installation on a power distribution system. IEEE Trans. Power Electron. 2005, 20, 893–900. [Google Scholar] [CrossRef]
  34. Wang, X.; Blaabjerg, F.; Liserre, M.; Chen, Z.; He, J.; Li, Y. An active damper for stabilizing power-electronics-based AC systems. IEEE Trans. Power Electron. 2014, 29, 3318–3329. [Google Scholar] [CrossRef]
  35. Wang, X.; Blaabjerg, F.; Lisere, M. An active damper to suppress multiple resonances with unknown frequencies. In Proceedings of the IEEE Applied Power Electronics Conference and Exposition, Fort Worth, TX, USA, 16–20 March 2014; pp. 2184–2191. [Google Scholar]
  36. Rechka, S.; Ngandui, E.; Jianhong, X.; Sicard, P. Analysis of harmonic detection algorithms and their application to active power filters for harmonics compensation and resonance damping. Can. J. Electr. Comput. Eng. 2003, 28, 41–51. [Google Scholar] [CrossRef]
  37. Shi, Z.; Wei, S.; Wu, B.; Huang, Y. Research on the current detection algorithm for reactive and harmonic of active power filters. In Proceedings of the 2010 Asia-Pacific Power and Energy Engineering Conference, Chengdu, China, 28–31 March 2010; pp. 1–5. [Google Scholar]
  38. Yepes, A.G.; Freijedo, F.; Lopez, O.; Gandoy, J. High-performance digital resonant controllers implemented with two integrators. IEEE Trans. Power Electron. 2011, 26, 563–576. [Google Scholar] [CrossRef]
  39. Lavopa, E.; Zanchetta, P.; Sumner, M.; Cupertino, F. Real-time estimation of fundamental frequency and harmonics for active shunt power filters in aircraft electrical systems. IEEE Trans. Ind. Electron. 2009, 56, 2875–2884. [Google Scholar] [CrossRef]
Figure 1. Configuration of the harmonic adaptability (HA) testing system.
Energies 10 01793 g001
Figure 2. (a) 3-phase voltage waveform with the required distortion of 8th harmonic testing; (b) Voltage spectrum for the standard testing waveform.
Energies 10 01793 g002
Figure 3. Single phase equivalent circuit of a doubly fed induction generator (DFIG). (a) Grid side converter (GSC) impedance modeling, (b) DFIG machine and rotor side converter (RSC) impedance modeling.
Energies 10 01793 g003
Figure 4. Equivalent circuit of the HA testing system.
Energies 10 01793 g004
Figure 5. Simulation results of Equation (4). (a) Relationships among harmonic amplification, cable length and harmonic order; (b) relationships among harmonic amplification, cable length and harmonic order shown by contour map.
Energies 10 01793 g005
Figure 6. Schematic diagram of obtaining voltage compensation value.
Energies 10 01793 g006
Figure 7. Single phase schematic diagram of series active power filter (APF) compensation.
Energies 10 01793 g007
Figure 8. Closed-loop transfer function frequency response.
Energies 10 01793 g008
Figure 9. Control block diagram of selective harmonic damping method.
Energies 10 01793 g009
Figure 10. Equivalent circuit of HA testing system of the selected harmonic frequency.
Energies 10 01793 g010
Figure 11. Simulation results without cables. (a) 3-phase voltage waveform and spectrum of 7th harmonic testing; (b) 3-phase voltage waveform and spectrum of 20th harmonic testing.
Energies 10 01793 g011
Figure 12. (a) 3-phase voltage waveform and spectrum of grid access point when the 20 km is connected; (b) 3-phase voltage waveform and spectrum of 7th harmonic after being damped by the selective harmonic damping (SHD) method.
Energies 10 01793 g012
Figure 13. Simulation results of 7th harmonic testing. (a) 3-phase voltage waveform; (b) voltage spectrum.
Energies 10 01793 g013
Figure 14. Simulation results of 20th harmonic testing. (a) 3-phase voltage waveform and spectrum without damping 7th harmonic; (b) voltage waveform and spectrum after damping 7th harmonic.
Energies 10 01793 g014

