1. Introduction
The European electrical grid has been experiencing deep changes in recent years. In particular, the exploitation of Renewable Energy Sources (RESs) for electricity generation is dramatically modifying the traditional paradigm. In order to facilitate the renewables operation, considering that their operational costs are extremely reduced as compared with traditional fossil-fuel plants, RES power units are usually primarily dispatched. Combining this with the decrease in overall demand witnessed over the last decade, Conventional Power Plants (CPPs) are more and more excluded from the electricity market due to their high price, which makes them inconvenient from the economic point-of-view. It is worth noting that, focusing on the European context, photovoltaic and wind production grew from 323 TWh in 2011 to 553 TWh in 2015 [
1,
2].
This trend, often a consequence of incentive laws and market rules, could be detrimental for the main grid stability, considering that CPPs are large-scale plants mainly equipped with rotating machines having significant inertia, whereas RES units are often connected to the main grid through static converters. In this way, the overall system inertia is reduced, which means the electrical power system is more prone to higher frequency/voltage perturbations in case of loads or generation sudden variations, with possible consequences for the overall system reliability. In addition, the high RESs penetration affects the reliable behaviour of the electrical power system because of their weather-dependent generation [
3].
To face frequency perturbations, traditional power plants, including hydroelectric impoundment facilities, are called to provide ancillary services, for instance frequency- and voltage-regulating functions [
4]. Considering the unpredictable availability of the primary source, other renewables such as photovoltaic, wind and run-of-river hydroelectric plants are excluded from the primary reserve contribution [
5], often leading to a significant reduction in the available primary reserve power [
6]. Recently, the inertia emulation applied to static converter has been investigated, even if its application has not been regulated in the grid codes, considering also its impact on local loss-of-main protection effectiveness [
7,
8].
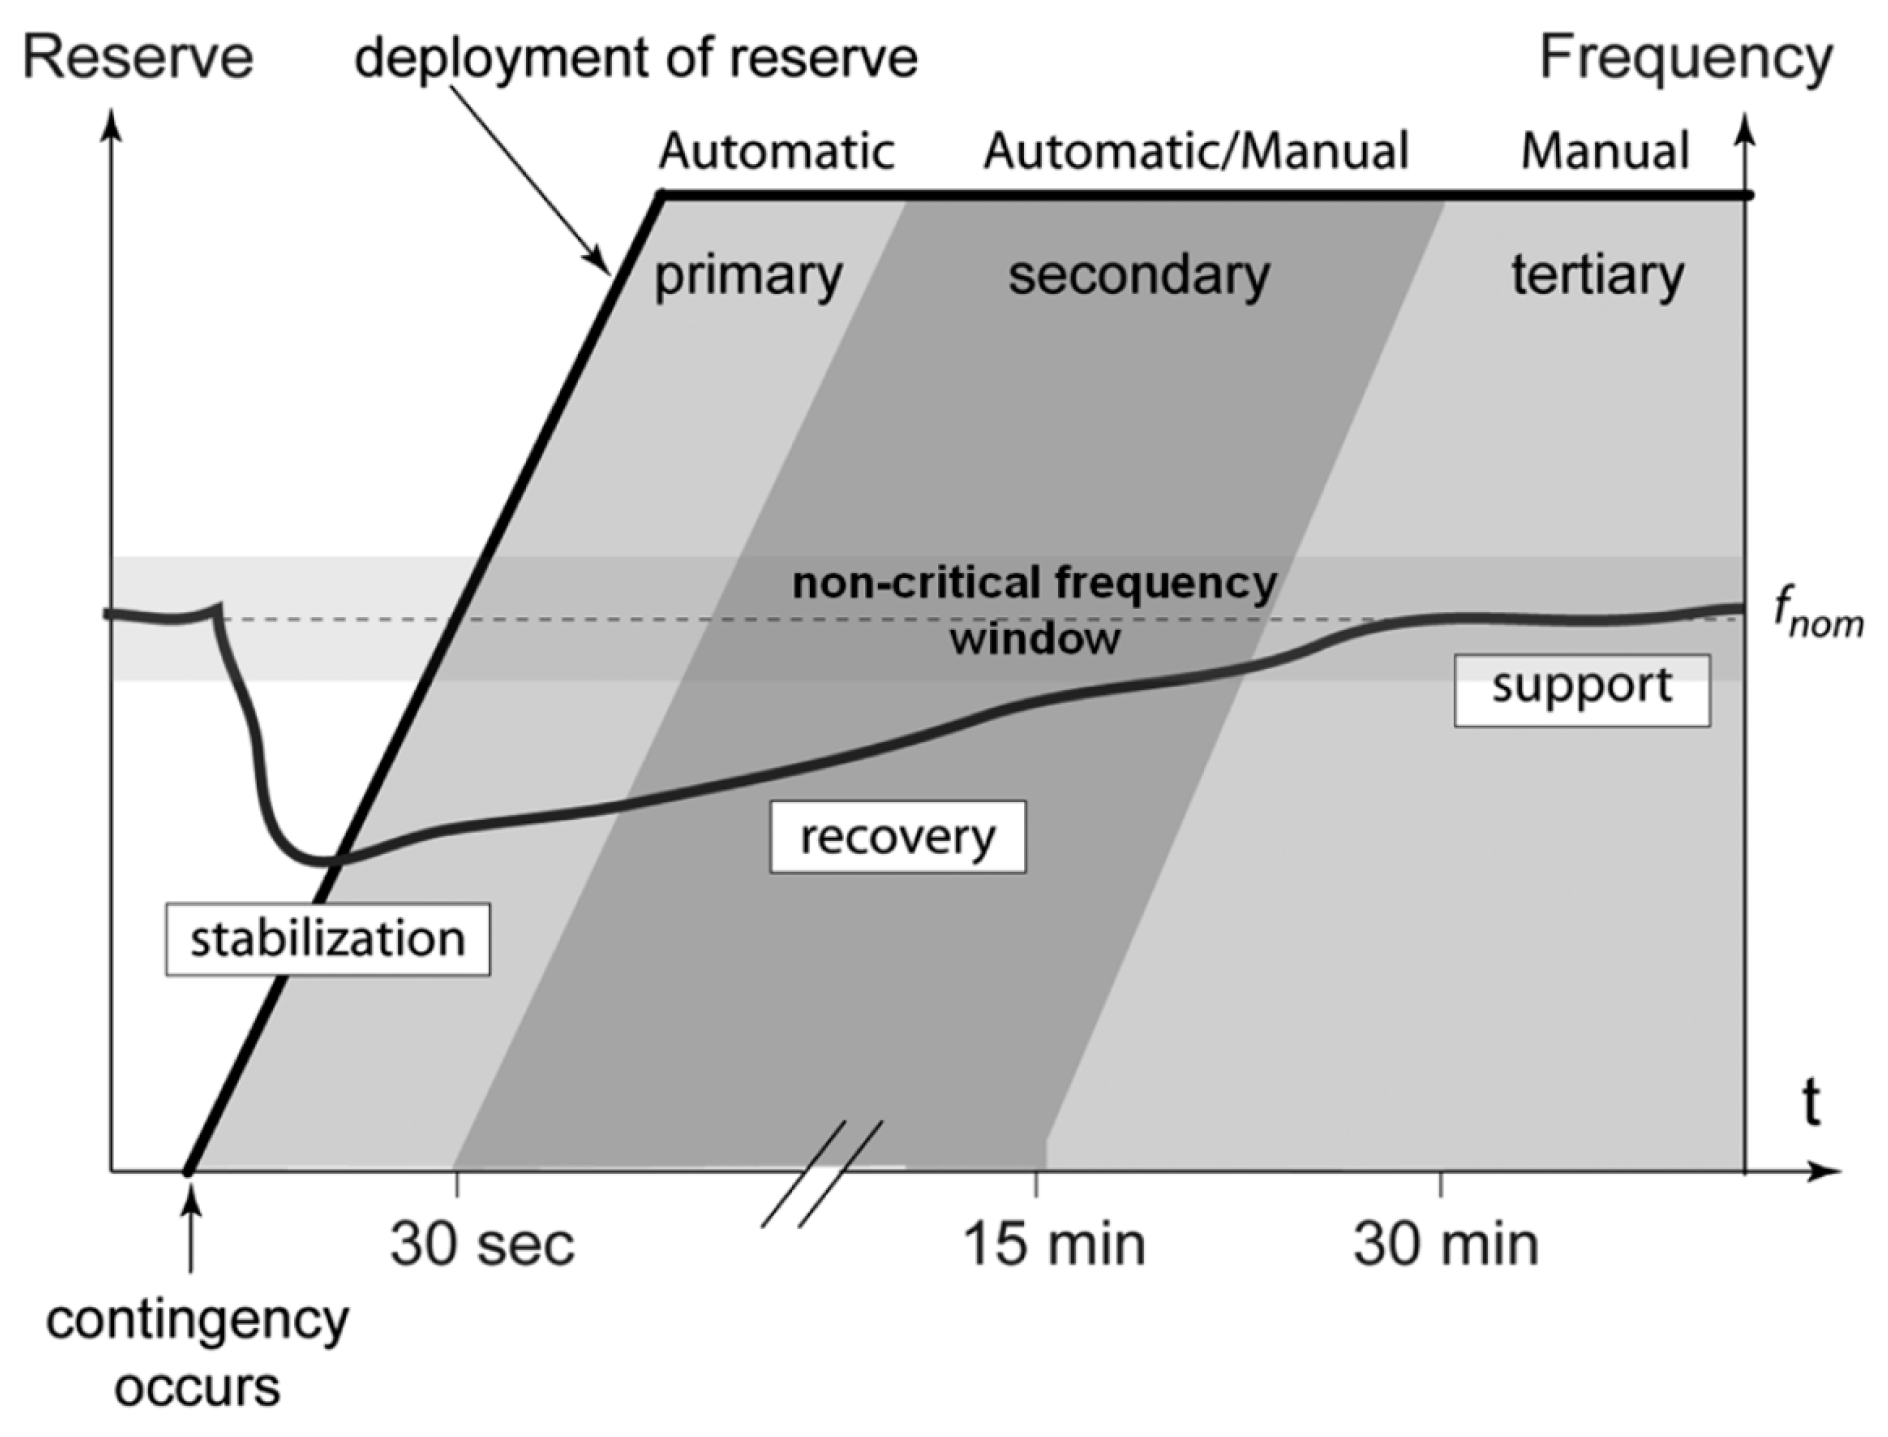
In this paper, the Primary Control Reserve (PCR) is investigated considering its high importance among all the required ancillary services [
9]. In normal operating conditions, the generated power must balance the load absorption plus the network losses to ensure the frequency level within a narrow admitted range around the rated value (50 Hz in the Continental European Synchronous Area, CESA). PCR scope is maintaining the active power balance in the electrical power system immediately after network events and consequent frequency perturbations. Considering that a frequency increase is due to a generation surplus, PCR operates within seconds to correct the power plant injections and contain the frequency oscillation width. Frequency restoration is later attained thanks to secondary and tertiary control reserves, as depicted in
Figure 1.
Secondary and tertiary reserves are partially or completely manual, while CPPs and hydroelectric impoundment facilities are asked to automatically supply PCR in case a frequency deviation occurs at the connection busbar. The CPP controllers modulate linearly the active power output by regulating the plant’s operating conditions (e.g., acting either on the steam valve or on the flow rate regulator, in case of steam-cycle power stations or impoundment hydropower plants, respectively). Usually, since the plant operating conditions cannot change instantly due to mechanical, thermodynamic and/or hydraulic reasons, PCR is progressively required according to grid standards: standing on the European Network of Transmission System Operators for Electricity (ENTSO-E), for a frequency deviation of ±200 mHz, half of the overall required reserve has to be supplied within 15 s from the frequency perturbation, whereas the full PCR activation must be reached within 30 s. In some CPPs, the reduction of the injected power in case of over-frequency may be reached more quickly (e.g., deflecting the water flow in high head hydroelectric power plants making use of Pelton turbines). A dead-band around the frequency rated value is allowed to limit the PCR actions. Moreover, the power level reached during the PCR must be maintained for at least 15 min to avoid oscillations of the system electric parameters during the frequency restore operated by the secondary reserve [
10].
In this paper, the PCR ancillary service is supposed to be extended by the standards to also include run-of-river hydroelectric plants. In this way, only considering the countries reported in
Table 1, an increase of about 45 GW in the overall installed rated power of plants supplying PCR is expected in the European area (data are evaluated as in [
11] and generally refer to 2015). This corresponds to 5.8% of the overall installed capacity in the analysed countries (771 GW).
Moreover, the integration of a Battery Energy Storage System (BESS) is investigated as an alternative solution instead of modulating the hydraulic power. A hybrid solution, i.e., installing a BESS in parallel to the traditional plant, allows for increased energy production since, if the storage unit is not operating close to its minimum State of Charge (SoC), upward reserve can be supplied by the storage system and the hydroelectric part of the plant operates closer to its maximum available power. In the paper, a technical–economic investigation of the BESS optimal size according to the hydropower plant characteristics and the hydraulic availability is detailed. Evaluations are realized in a MATLAB (version R2016b) environment and the Internal Rate of Return (IRR) maximization is used as the sizing criterion. Later, the benefits of a hybrid system in terms of PCR contribution are verified through dynamic simulations in the DIgSILENT PowerFactory environment. Different BESS sizes are analysed, aiming to evaluate the plant contribution to the network frequency stability.
As detailed below,
Section 2 discusses the BESS integration for supplying PCR;
Section 3 details the procedure for the optimal technical–economic analysis and sizing, whereas the dynamic control schemes regulating the hybrid plant output according to the measured frequency are described in
Section 4.
Section 5 illustrates the case study and reports the main results in terms of sizing and dynamic behaviour, and conclusions are drawn in
Section 6.
2. BESS Integration for Supplying Primary Control Reserve (PCR)
Grid-connected storage units can be a valuable resource for supplying ancillary services [
12,
13]. BESSs’ use for providing PCR is revealing as an interesting alternative to active power modulation of CPPs. This mainly depends on its fast and precise power response to grid frequency deviations [
14], since a faster response directly implicates a reduced frequency perturbation width [
15]. In the past, storage systems were rarely used for grid services because of their high cost [
16]; however, the rapidly falling cost of Li-ion battery packs [
17] and their lifecycle increase [
3,
18] have boosted the interest in applications of storage systems in network regulation.
Several studies regarding PCR supply by means of storage systems are available in the literature [
4,
19]. A commercial strategy for operating energy storage in supporting integration of renewable generation is introduced in [
20]. Different charging control strategies are proposed in [
21], comparing the estimate of battery ageing [
22] and maximizing both the service continuity and the BESS profitability [
15]. A non-conventional droop-control law was proposed in [
23]. Lifetime perspectives of Lithium Iron Phosphate batteries are discussed in [
3], whereas [
24] evaluates the investment revenue depending on different strategies for the SoC restoration. Also, [
25] presents a possible operational mode of a generic energy storage system supporting frequency regulation in a network with high penetration of wind power plants, focusing on the system’s size. The role of storage systems in fulfilling multiple grid services is investigated in [
16], e.g., with SoC sharing [
18]. Operation and charging control of a Li-ion BESS installed in Denmark and providing upward frequency regulation is analysed in [
26], whereas an application of 5 MW/5 MWh Li-ion batteries installed in Germany is presented in [
14]. Technical and economic opportunities making use of BESSs installed for providing PCR in buildings with photovoltaic (PV) generators are studied in [
27].
In [
28] the potential application for wind power integration support and an optimal sizing procedure are introduced. Vanadium batteries supporting wind power plants to provide PCR are discussed in [
29], whereas time shifting is investigated in [
30] according to U.K. policy requirements. An installation of 1.6 MW/0.4 MWh Li-ion battery combined with a wind power plant in Denmark providing ancillary services is described in [
31]. The degradation behaviour of lithium based batteries supplying upwards frequency regulation (while the downwards regulation is obtained by reducing the wind generation) is investigated in [
32] with support of field measurements. Reference [
33] analyses and models the performances and the degradation trend of a specific Lithium-ion technology. Referring to a PV system, a control scheme and a BESS sizing procedure are introduced in [
6] to study the PCR impact on batteries lifetime. Finally, BESS and flywheels are compared in providing PCR in industrial plants [
34].
Integrating a Storage Unit in a Run-of-River Hydroelectric Power Plant
Nowadays, grid codes do not consider the opportunity of supplying PCR by means of BESSs. In this paper, the authors propose equipping an existing hydroelectric run-of-river power plant with a battery storage unit, assuming as a working hypothesis that the standards might require the PCR ancillary service also to this type of power generator.
Requirements for PCR in Italy are defined by the national Transmission System Operator (TSO) Terna SpA in the Section A.15 of the connection grid code [
5], in accordance with UCTE guidelines. In detail, a power plant providing PCR has to make available a portion
R of its rated power
Pr as upward reserve (currently
R = 1.5%), whereas the required downward reserve is equal to the plant effective production, taking into account the minimum operating power. In case the plant is composed by
U generating units, the PCR is evaluated on the sum of the working units rated power, not on the overall plant rated power. As a consequence, RES plants required to provide PCR have to operate at reduced power, which means partially wasting free renewable energy. Taking into account the PCR thresholds introduced below and considering the frequency trend evolution in a long-time period (e.g., one year), the installation of a BESS partially or completely providing the required upward reserve, rather than reducing the renewable power output, could be interesting from the plant owner’s economic perspective as well as the electrical power system frequency stability (response readiness of the overall plant in case of frequency perturbations). This work investigates the advantages of the BESS integration in a run-of-river plant, in terms of technical feasibility, economic profitability and dynamic response.
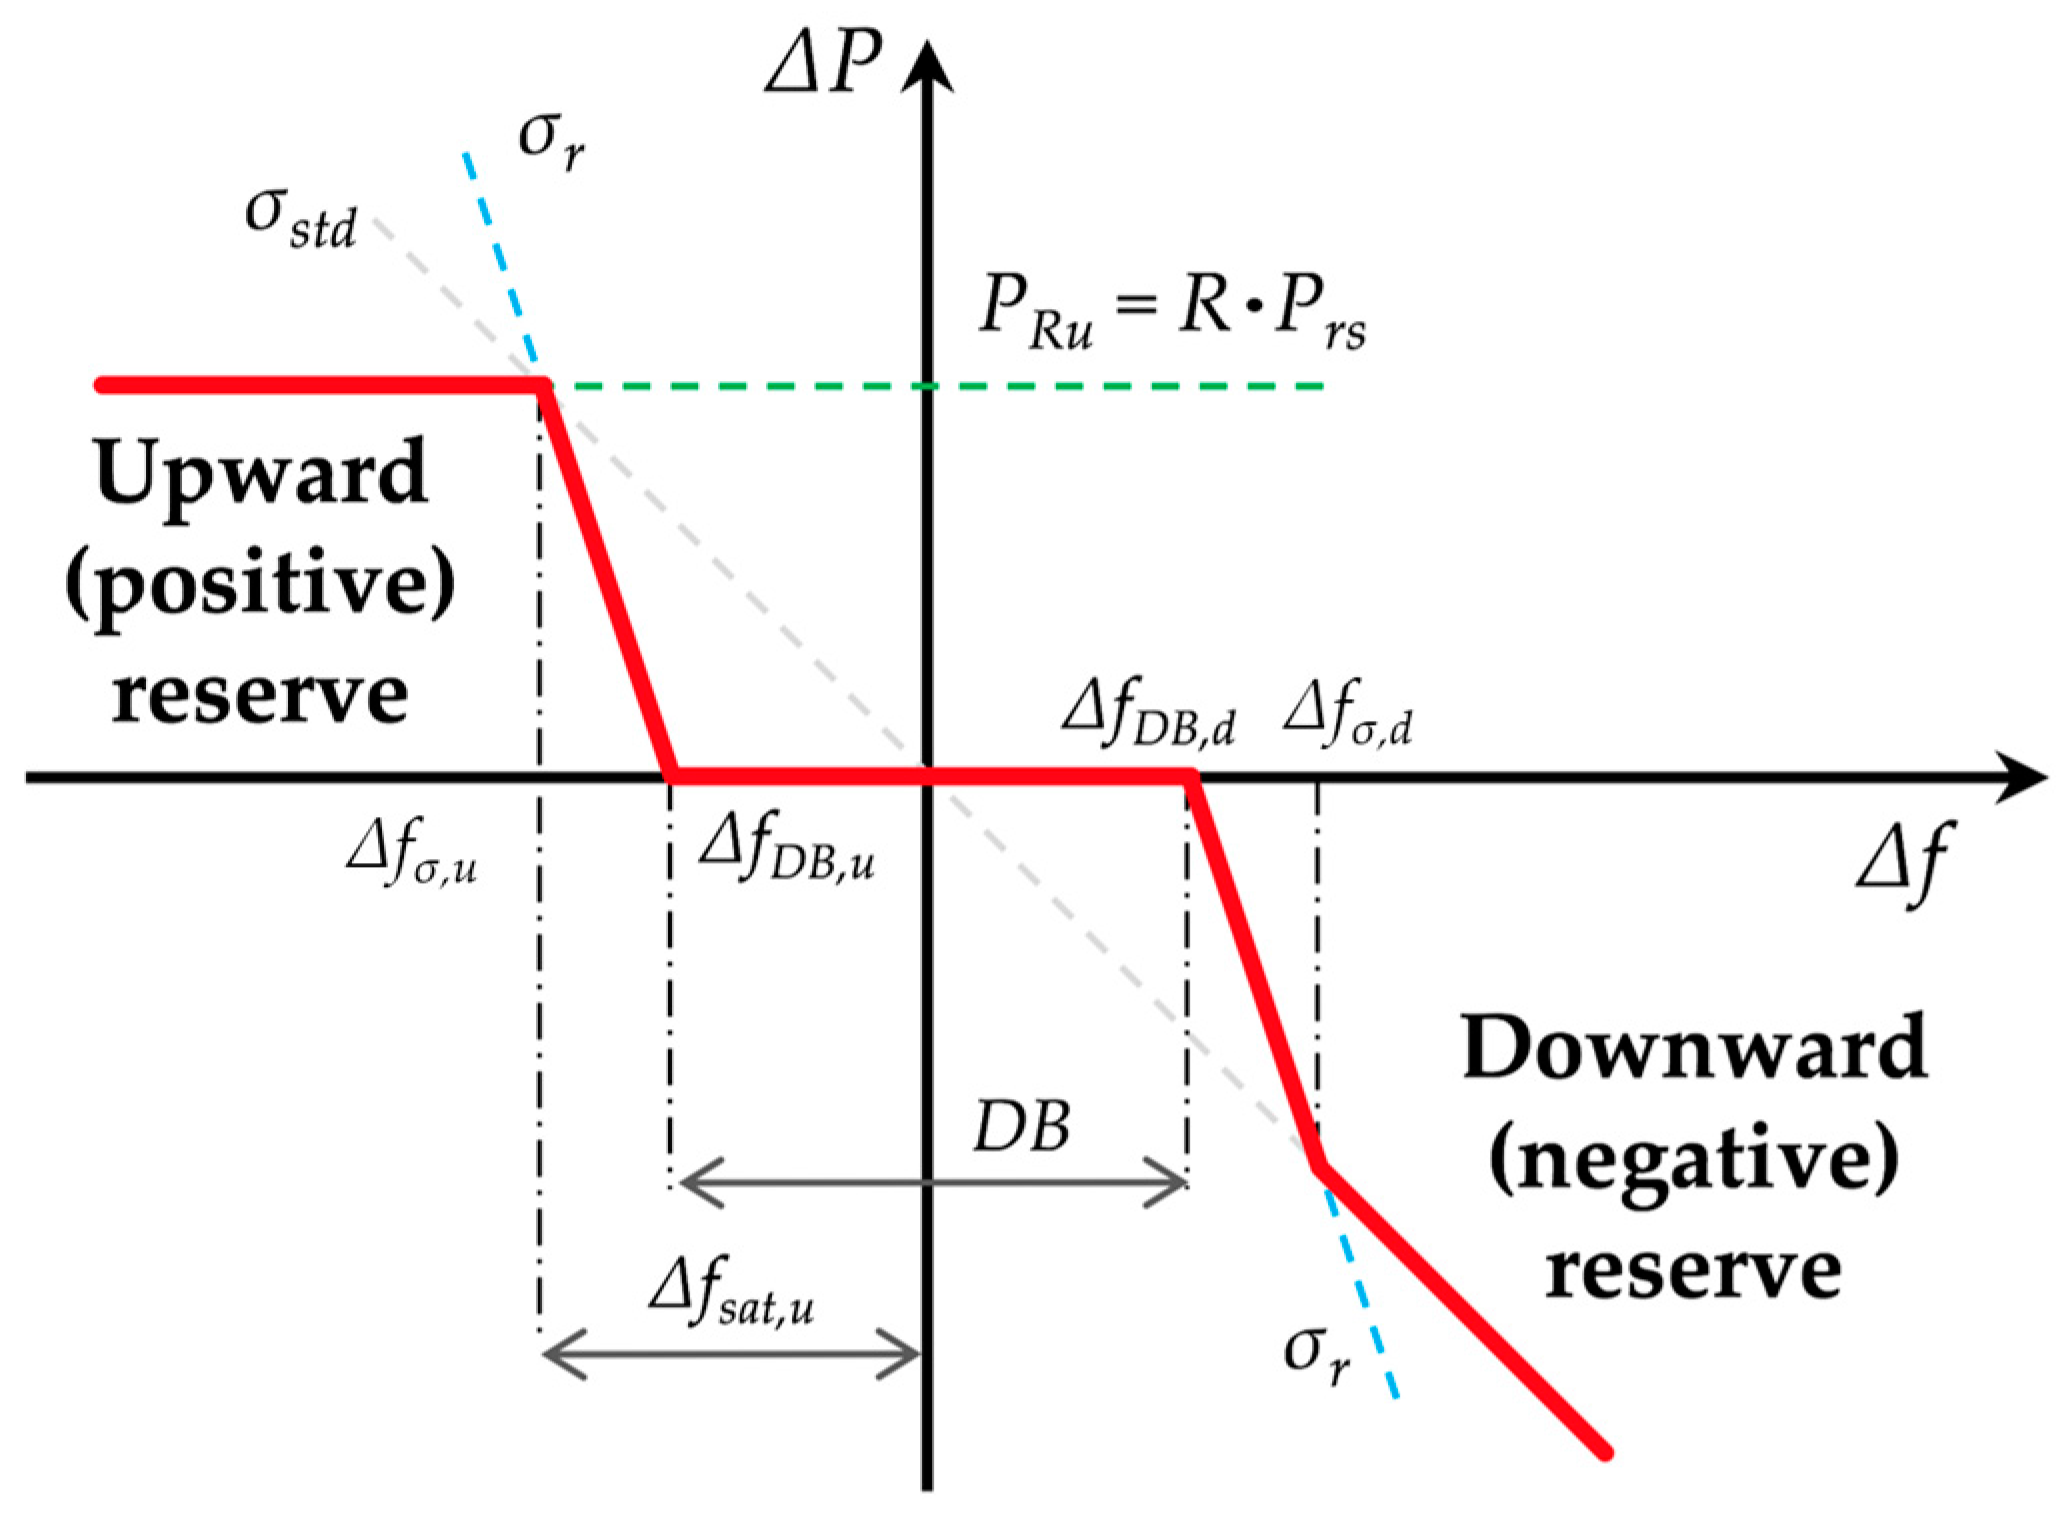
Figure 2 (bold red line) and
Table 2 concisely describe the plant response required by current grid codes [
5]. The overall behaviour can be obtained by considering multiple elementary constraints:
3. Technical-Economic Analysis
In this section, the BESS operating conditions are defined in order to evaluate its profitability, according to the currently applied legislation, national authority deliberations and grid codes. In the Italian market, the PCR revenue is evaluated as a reimbursement depending on the effectively supplied regulating energy, with reference to the market price evolution [
23]. The PCR availability forces the generation plants to reduce their effective output from the theoretical primary source availability, at least
R times the overall rated power of operating units. Since the PCR reimbursement does not depend on how the generating units provide the ancillary service, this income is not considered in the economic comparison between the traditional plant and the hybrid configuration, in which the PCR ancillary service is partially or completely supplied by means of a storage unit. By contrast, the BESS benefits are evaluated in terms of larger exploitation of the available primary source. Since the BESS contributes in supplying the upward PCR, the hydroelectric portion of the hybrid plant can increase the generated power, which means a higher energy production of the RES-based plant during the analysed time period. This economic benefit is compared with the additional costs involved by the BESS implementation, considering both the installation cost and the Operation & Maintenance (O&M) ones.
3.1. Base Case: Hydroelectric Plant
The base case is the traditional run-of-river plant, in which the PCR is made available by modulating the hydroelectric output, which means regulating the water flow rate through suitable valves or machine configurations, depending on the hydroelectric plant characteristics (rated power, head, turbine type, etc.). Plant data, primary source availability and characteristics of each generating unit are fully available since the base case is evaluated on a real power station. Grid frequency evolution is known from recorded values or making use of web-portal databases (e.g., [
35]), with 1 s time resolution. The produced energy selling value
V (€/MWh) is supposed to be known, depending on the market price evolution or considering specific incentives for the RES exploitation. The analysis lasts one year, in order to take into account the seasonal variations of both the primary source availability and the market price. Evaluations are made second by second, so the parameter
t varies between 1 and
tM (
tM = 31.536 × 10
6).
For each time instant, the plant theoretical power production
Pth,t is evaluated according to the known data on primary source availability. Parameter
Ox,t defines the state of the
xth generation unit at instant
t (0 means unit out of service, 1 means unit in operation) and
Prx is the rated power of the
xth generating unit. So, the required upward reserve power
PRu,t is evaluated as in Equation (2), considering the overall rated power effectively in service
Prs,t, whereas the plant output power
Pt is computed as the theoretical availability, reduced by the required upward reserve:
Consequently, the overall energy production
E is evaluated as in Equation (4) and the generated energy curtailment for providing PCR, named as Δ
E, is computed as in Equation (5):
3.2. Hybrid Hydroelectric Plant Including BESS
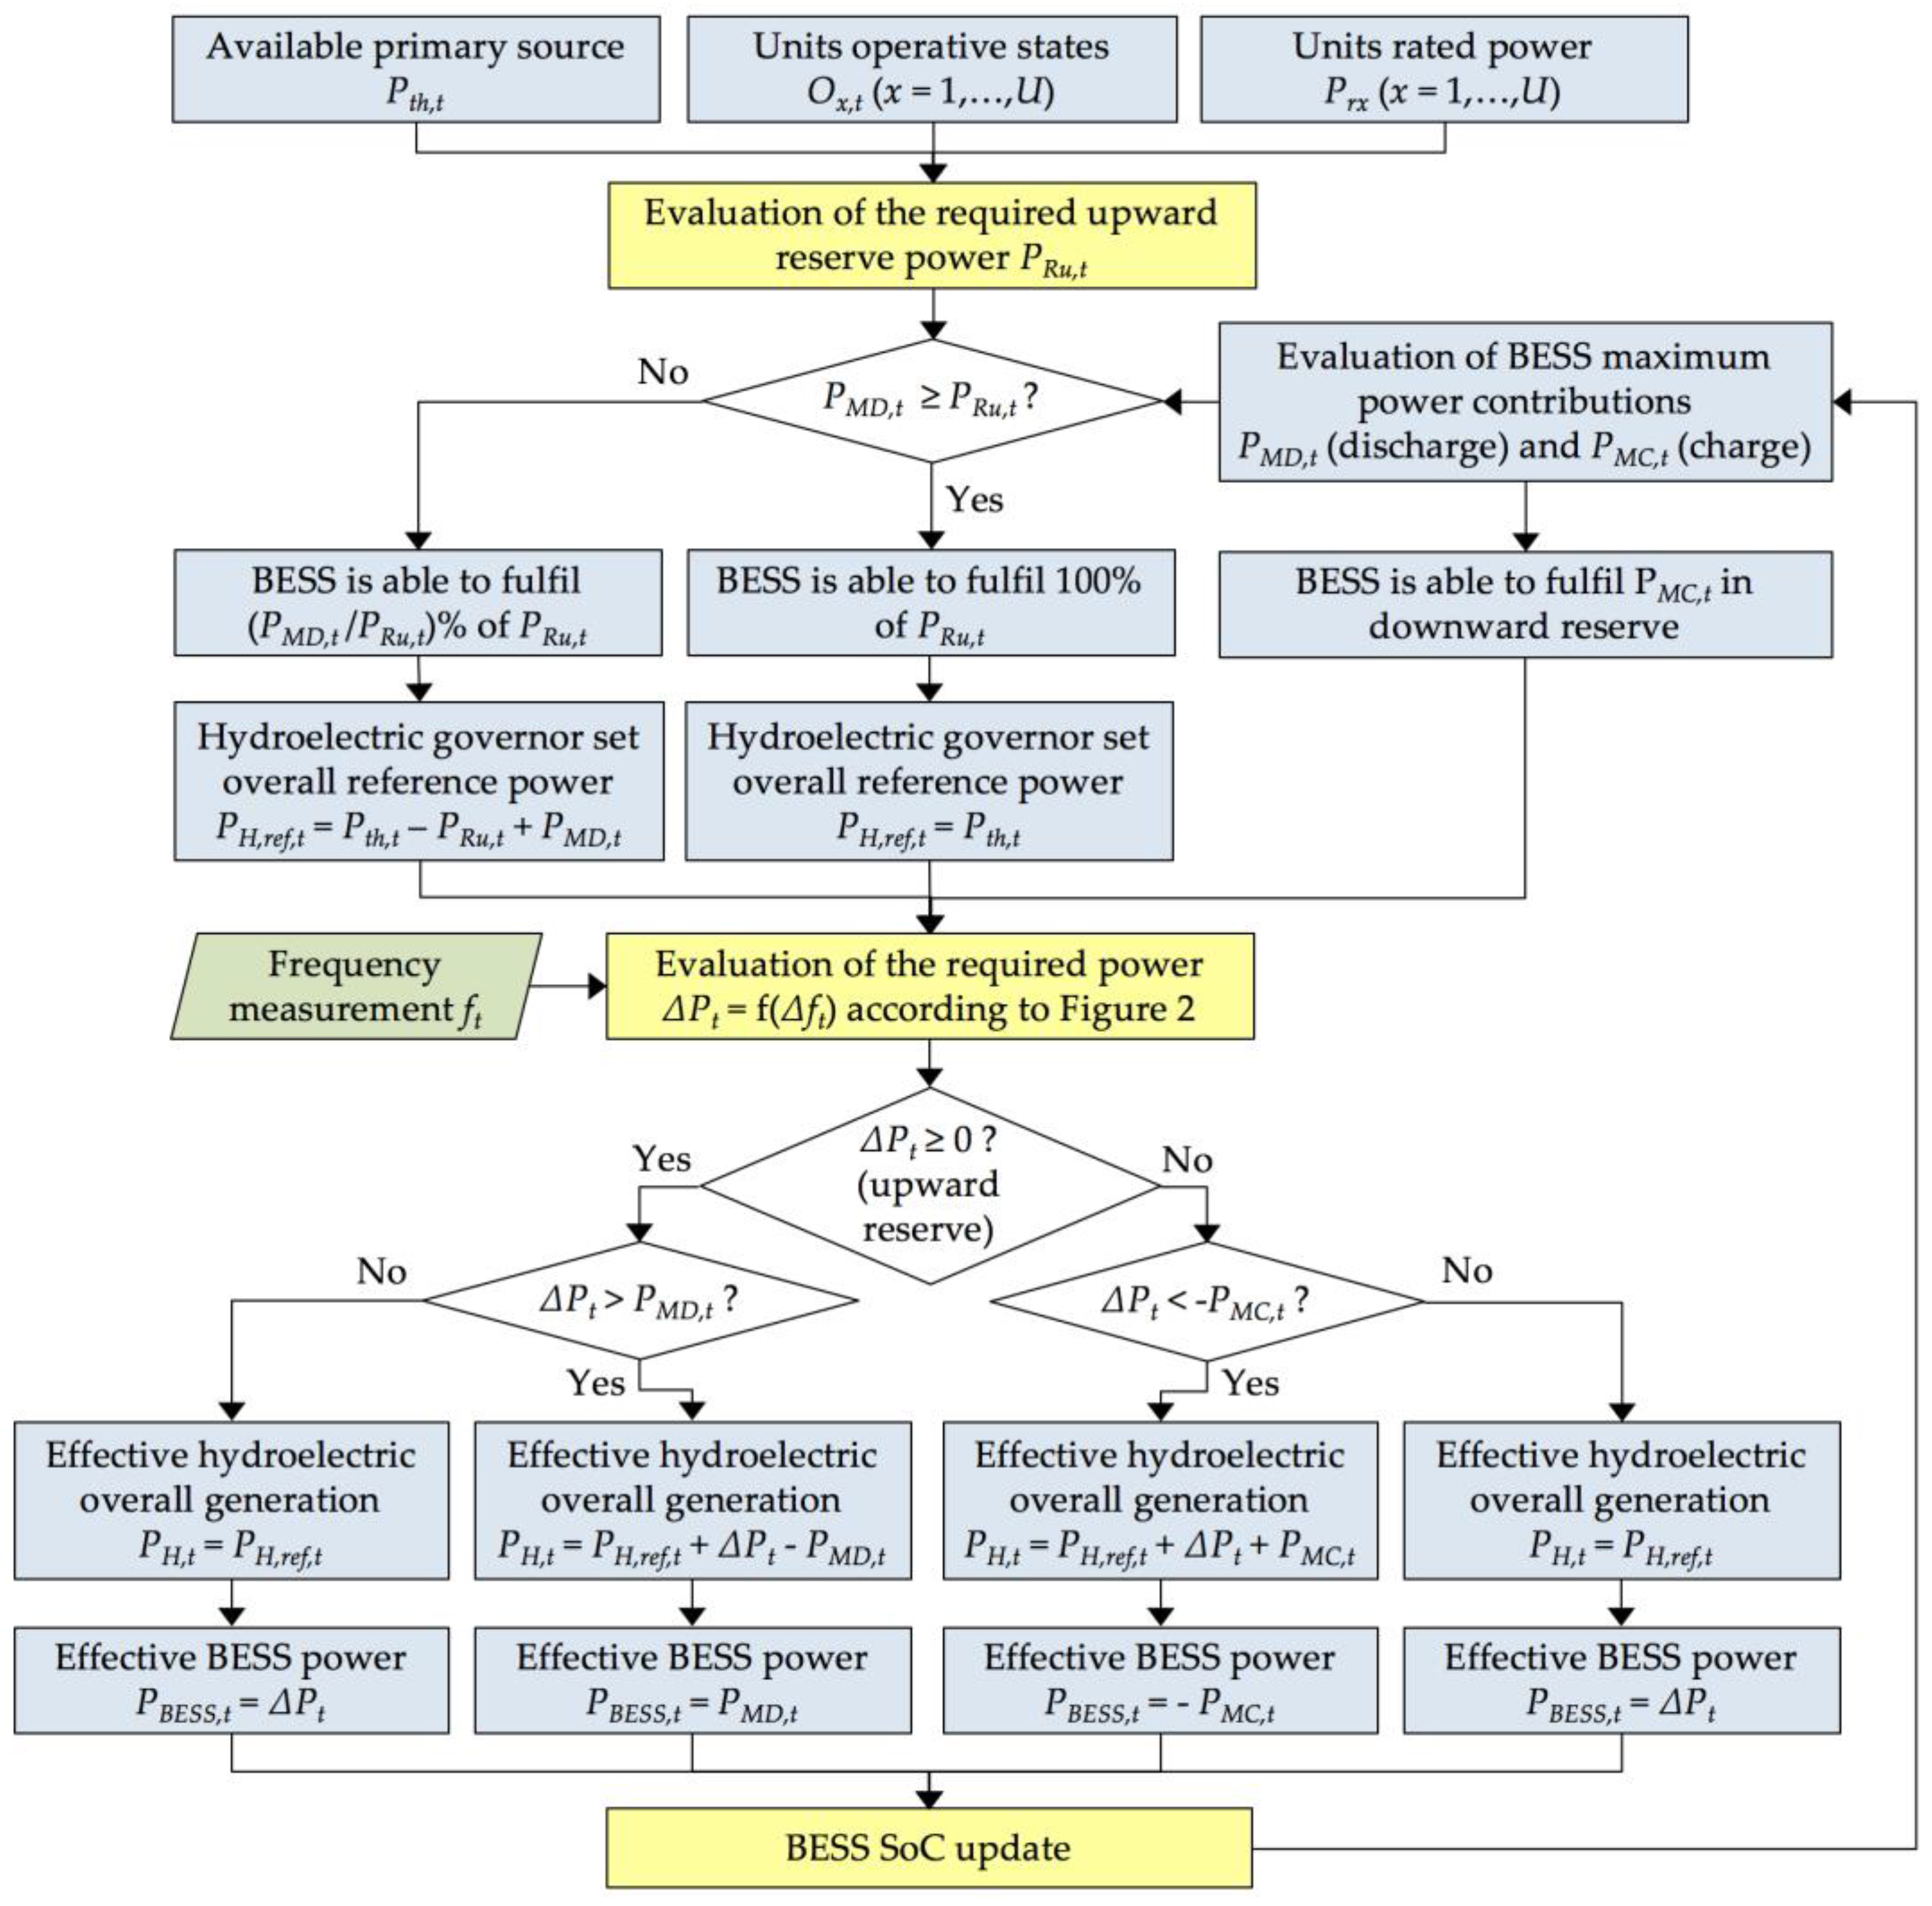
In this case, the operating conditions of the hydroelectric section depend on both the BESS sizing and its operating state, in particular the SoC. The PCR management algorithm is depicted in the block diagram of
Figure 3. For each time instant
t, the required upward reserve power
PRu,t is computed according to (2). At the same time, depending on the state of charge evaluated in the previous time instant
SoCt−1 and taking into account the BESS discharging efficiency η
D and charging efficiency η
C, the storage unit maximum contributions in discharge
PMD,t and in charge
PMC,t are assessed according to (6) and (7) respectively. The SoC admitted range (
SoCmin–
SoCmax) and the time instant duration Δ
t are considered. The BESS rated energy is named
EBESS, whereas
tDmin and
tCmin are the minimum allowed discharging time and charging time. These parameters could be related to
SoCt−1 according to the battery system specifications. For the first instant evaluation (
t = 1), the initial state of charge
SoC0 has to be provided as input to the procedure.
In case the storage unit is able to completely provide the upward reserve power, the output power reference of the hydroelectric part
PH,ref,t is equal to the available primary source
Pth,t, i.e., the generators operate without modulation. Otherwise, both the BESS and the hydroelectric section partially contribute to the upward reserve power, depending on
PMD,t. Therefore, hydroelectric governors are set with an overall reference power
PH,ref,t evaluated as in Equation (8):
Given a frequency deviation at time instant
t, named as Δ
ft, the PCR active power contribution Δ
Pt is evaluated accordingly to the required curve depicted in
Figure 2. In case of under-frequency, the BESS is required to contribute first, whereas the hydroelectric generation intervenes if Δ
Pt >
PMD,t. Similarly, an over-frequency exceeding the regulation dead-band involves the charge of the storage unit and secondly the reduction of the hydroelectric generation.
Finally, defining the storage unit equivalent efficiency η as in Equation (9), the BESS SoC at the end of the considered time instant,
SoCt, is updated as in Equation (10). Again, both η
D and η
C could be related to the BESS SoC according to the specific batteries’ characteristics, if known:
In case the BESS SoC approaches its upper or lower operational constraints, SoCmax and SoCmin, respectively, reductions of the available charging and discharging power are introduced, as previously described in Equations (6) and (7).
Operating the hybrid plant as discussed above allows for increased renewable energy production. This, weighted with the sold energy unitary price
V, corresponds to the BESS investment income. This revenue is supposed to be constant during all the BESS lifetime. On the other hand, both the installation cost (e.g., batteries, power electronics, electric panels, etc.) and the O&M costs are included in the business plan. The storage system installation cost
C is evaluated as in Equation (11) to represent different price trends by modifying coefficients
a and
b, depending on the considered technology and BESS size
EBESS. O&M costs are related to the installation cost
C:
The BESS yearly ageing
A, in terms of equivalent cycles per year, is computed as in Equation (12), taking into account the sole discharging phase. Considering the PCR ancillary service characteristics, it is worth noting that this is a conservative approximation, since the BESS ageing is reduced in case deep discharges are not frequently required.
The procedure evaluates the IRR, the Net Present Value (NPV) and the Pay-Back Time (PBT) as output of the BESS economic characterization. No financing mechanisms are considered to allow a direct analysis of the BESS investment profitability. Different BESS sizes are compared, making use of the IRR as discriminant parameter and considering an opportune reduction of the unitary cost with the increase of the storage size EBESS.
The economic analysis does not consider the dynamic behaviour of the hybrid plant in case of frequency perturbations. As demonstrated below, a traditional plant, without storage units, has its own dynamic response, which is not so fast due to hydraulic and mechanical constraints. By contrast, considering the extremely short response time of a BESS, a hybrid plant could make available the required PCR (or part of it) in a very short time, increasing the amount of the supplied reserve energy, which increases the plant profitability. So, having excluded the dynamic response of the plant from the economic analysis is a conservative hypothesis.
4. Dynamic Behaviour of the Hybrid Plant
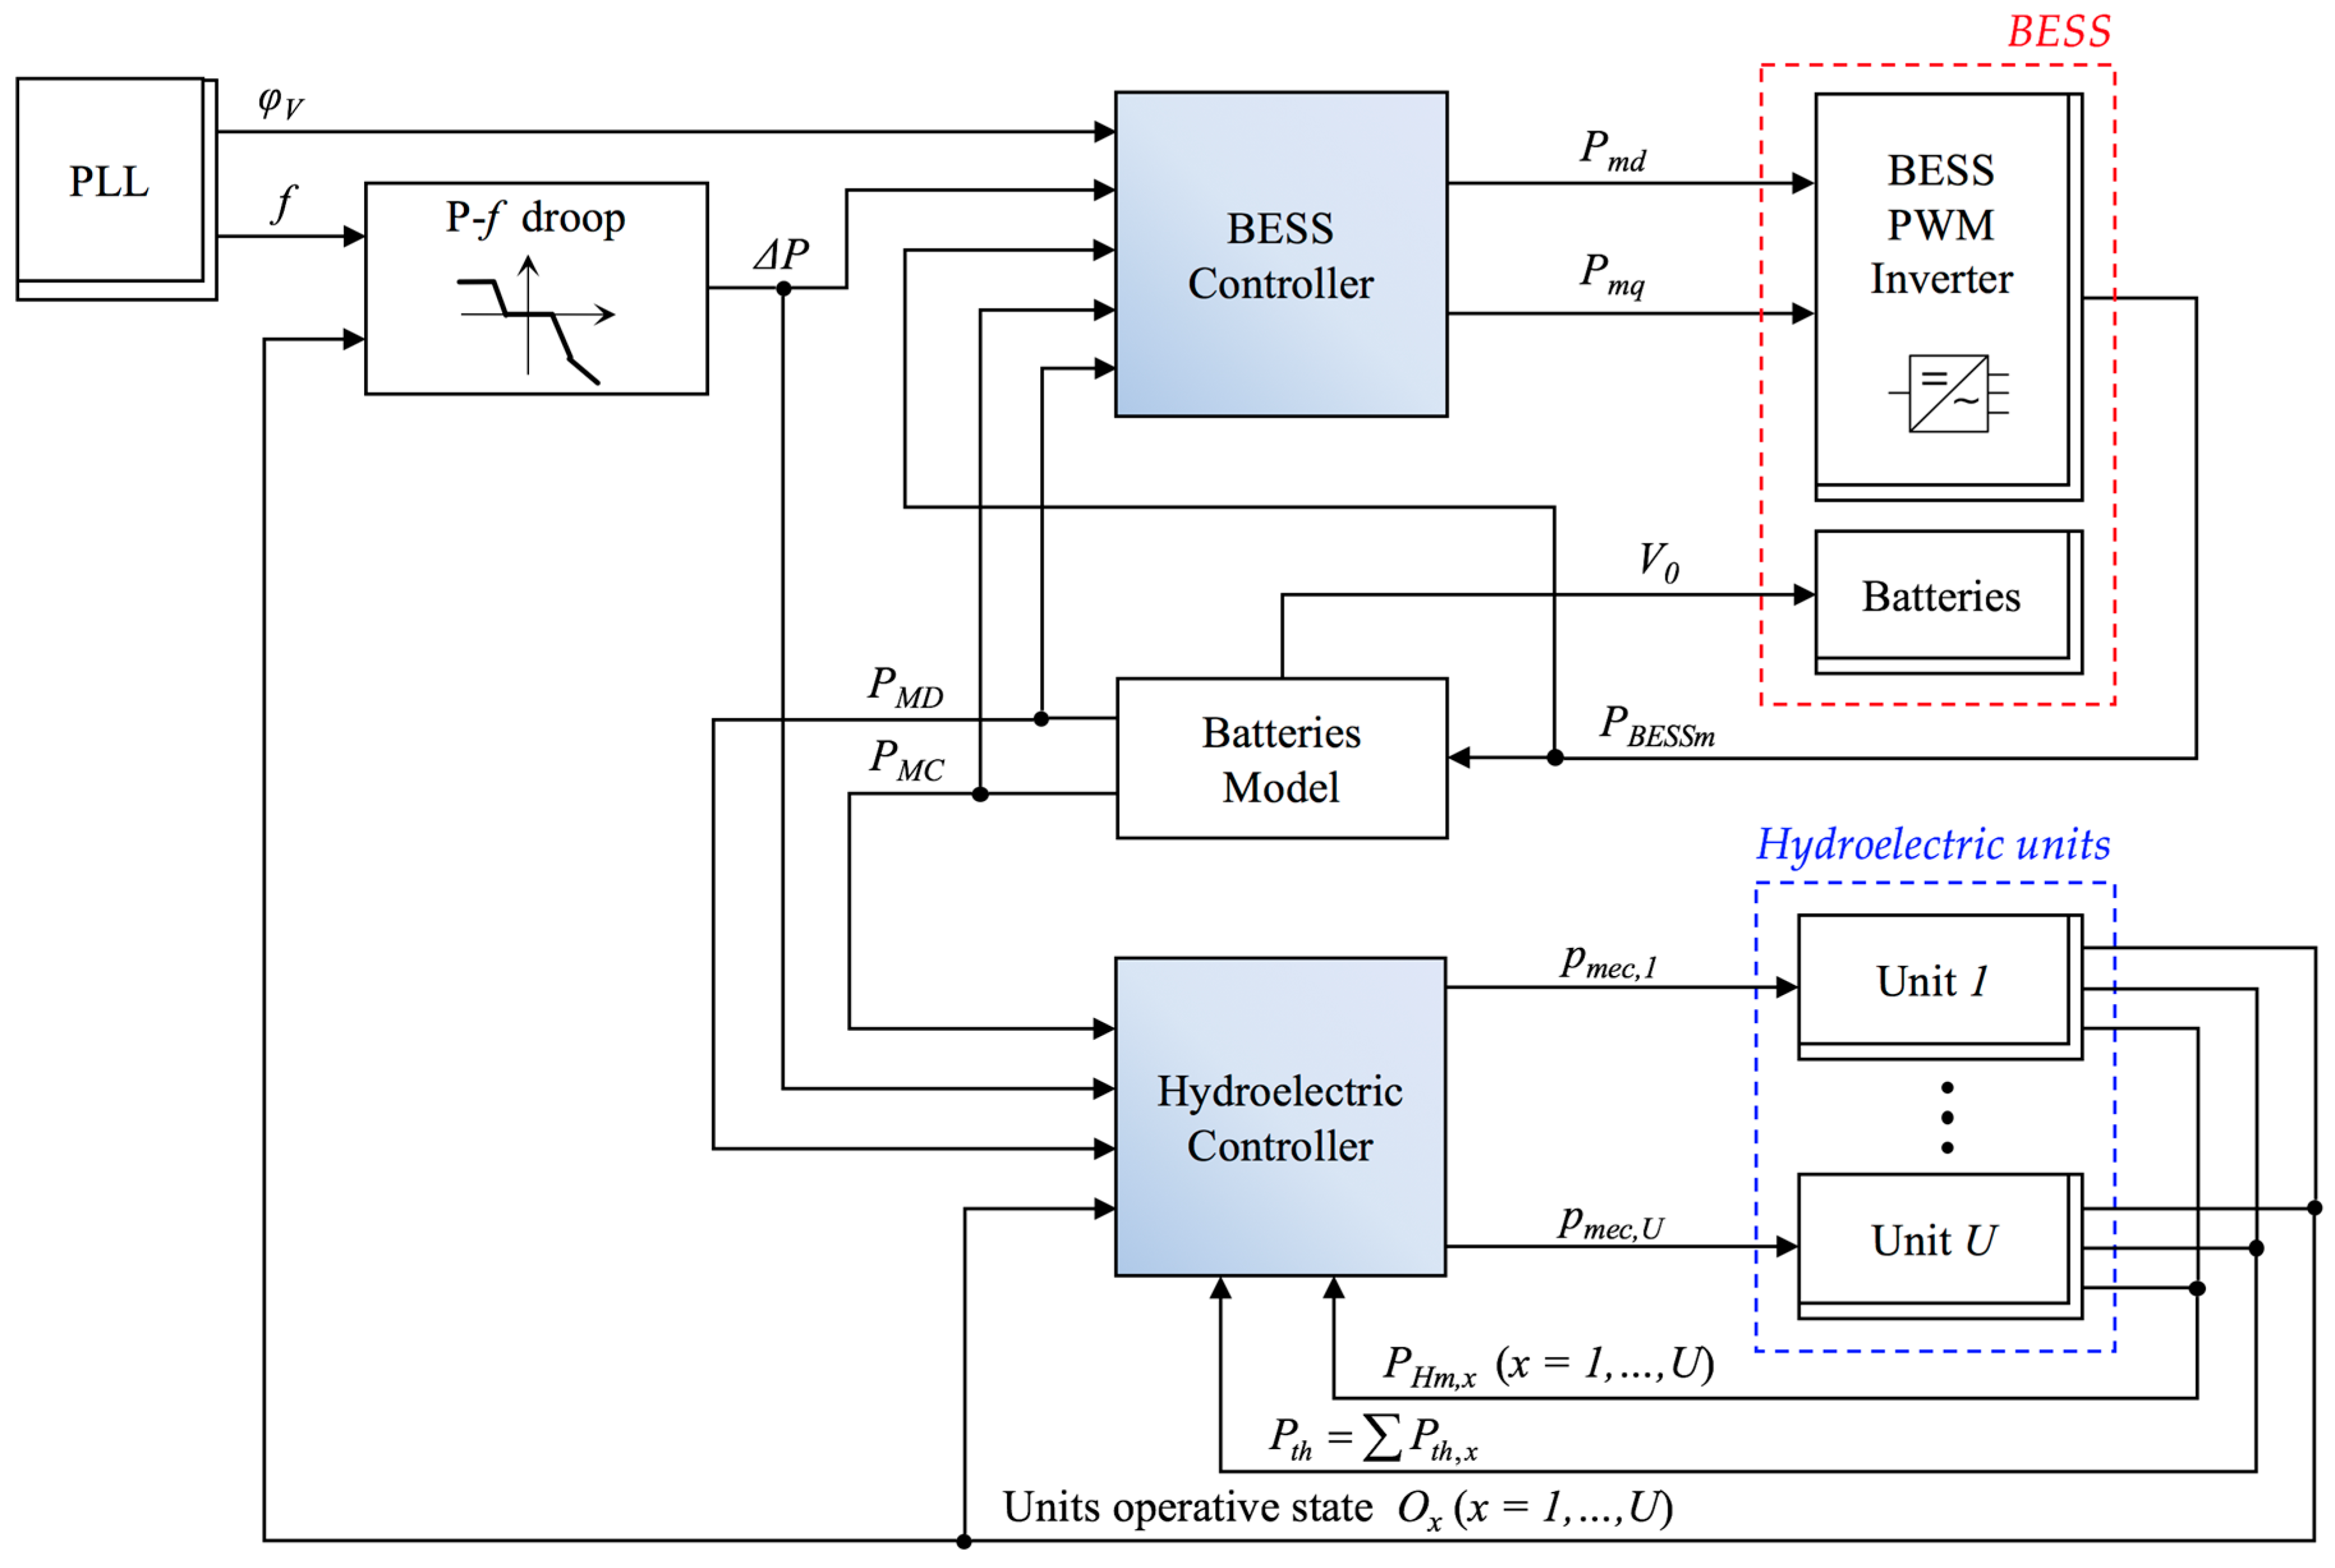
In the previous section the hybrid plant was studied from an economic point-of-view as a series of subsequent steady-state regimes. Otherwise, this section aims to investigate the dynamic behaviour of the overall generating unit in case of frequency perturbations. A complete control system is developed to provide the required PCR according to the generation plant operating conditions, as illustrated in
Figure 4. The control system interacts with both the BESS inverter (interfacing the storage unit with the rest of the generation system) and each hydroelectric unit. Double-framed blocks represent physical devices, whereas single-framed ones are internal controllers.
In detail, a Phase Locked Loop (PLL) installed on the generator Point of Delivery (PoD) measures the network frequency
f and the reference voltage angle ϕ
V required to correctly drive the power electronic converter synchronizing it with the main grid [
36,
37]. The signal
f is used by the block
P-f droop to define the PCR active power contribution required to the overall plant Δ
P, according to the droop curve (
Figure 2) and taking into account which of the hydroelectric units are effectively in operation (
Ox, with
x = 1,…,
U).
Each storage system array is modelled as
Ns cells, with nominal voltage
Vcell (V) and rated capacity
Ccell (Ah), connected in series (
Ns is defined according to the inverter DC voltage operating range). The number of parallel connected arrays
Np is defined to achieve the desired value of the rated storage energy
EBESS (kWh), as in Equation (13):
The block
Batteries Model implements Equation (14) to estimate the SoC, knowing the initial value
SoC0 and integrating the BESS effective power
PBESSm, as measured at the inverter terminals. The equivalent efficiency η is defined similarly to Equation (9) depending on the sign of
PBESSm. According to the evaluated SoC, the BESS maximum power contribution in discharge
PMD and in charge
PMC are directly evaluated. Furthermore, the evaluated SoC has influence on the batteries no-load voltage
V0.
The BESS is required to firstly contribute to the PCR in case a frequency variation exceeding the allowed dead-band is measured by the PLL.
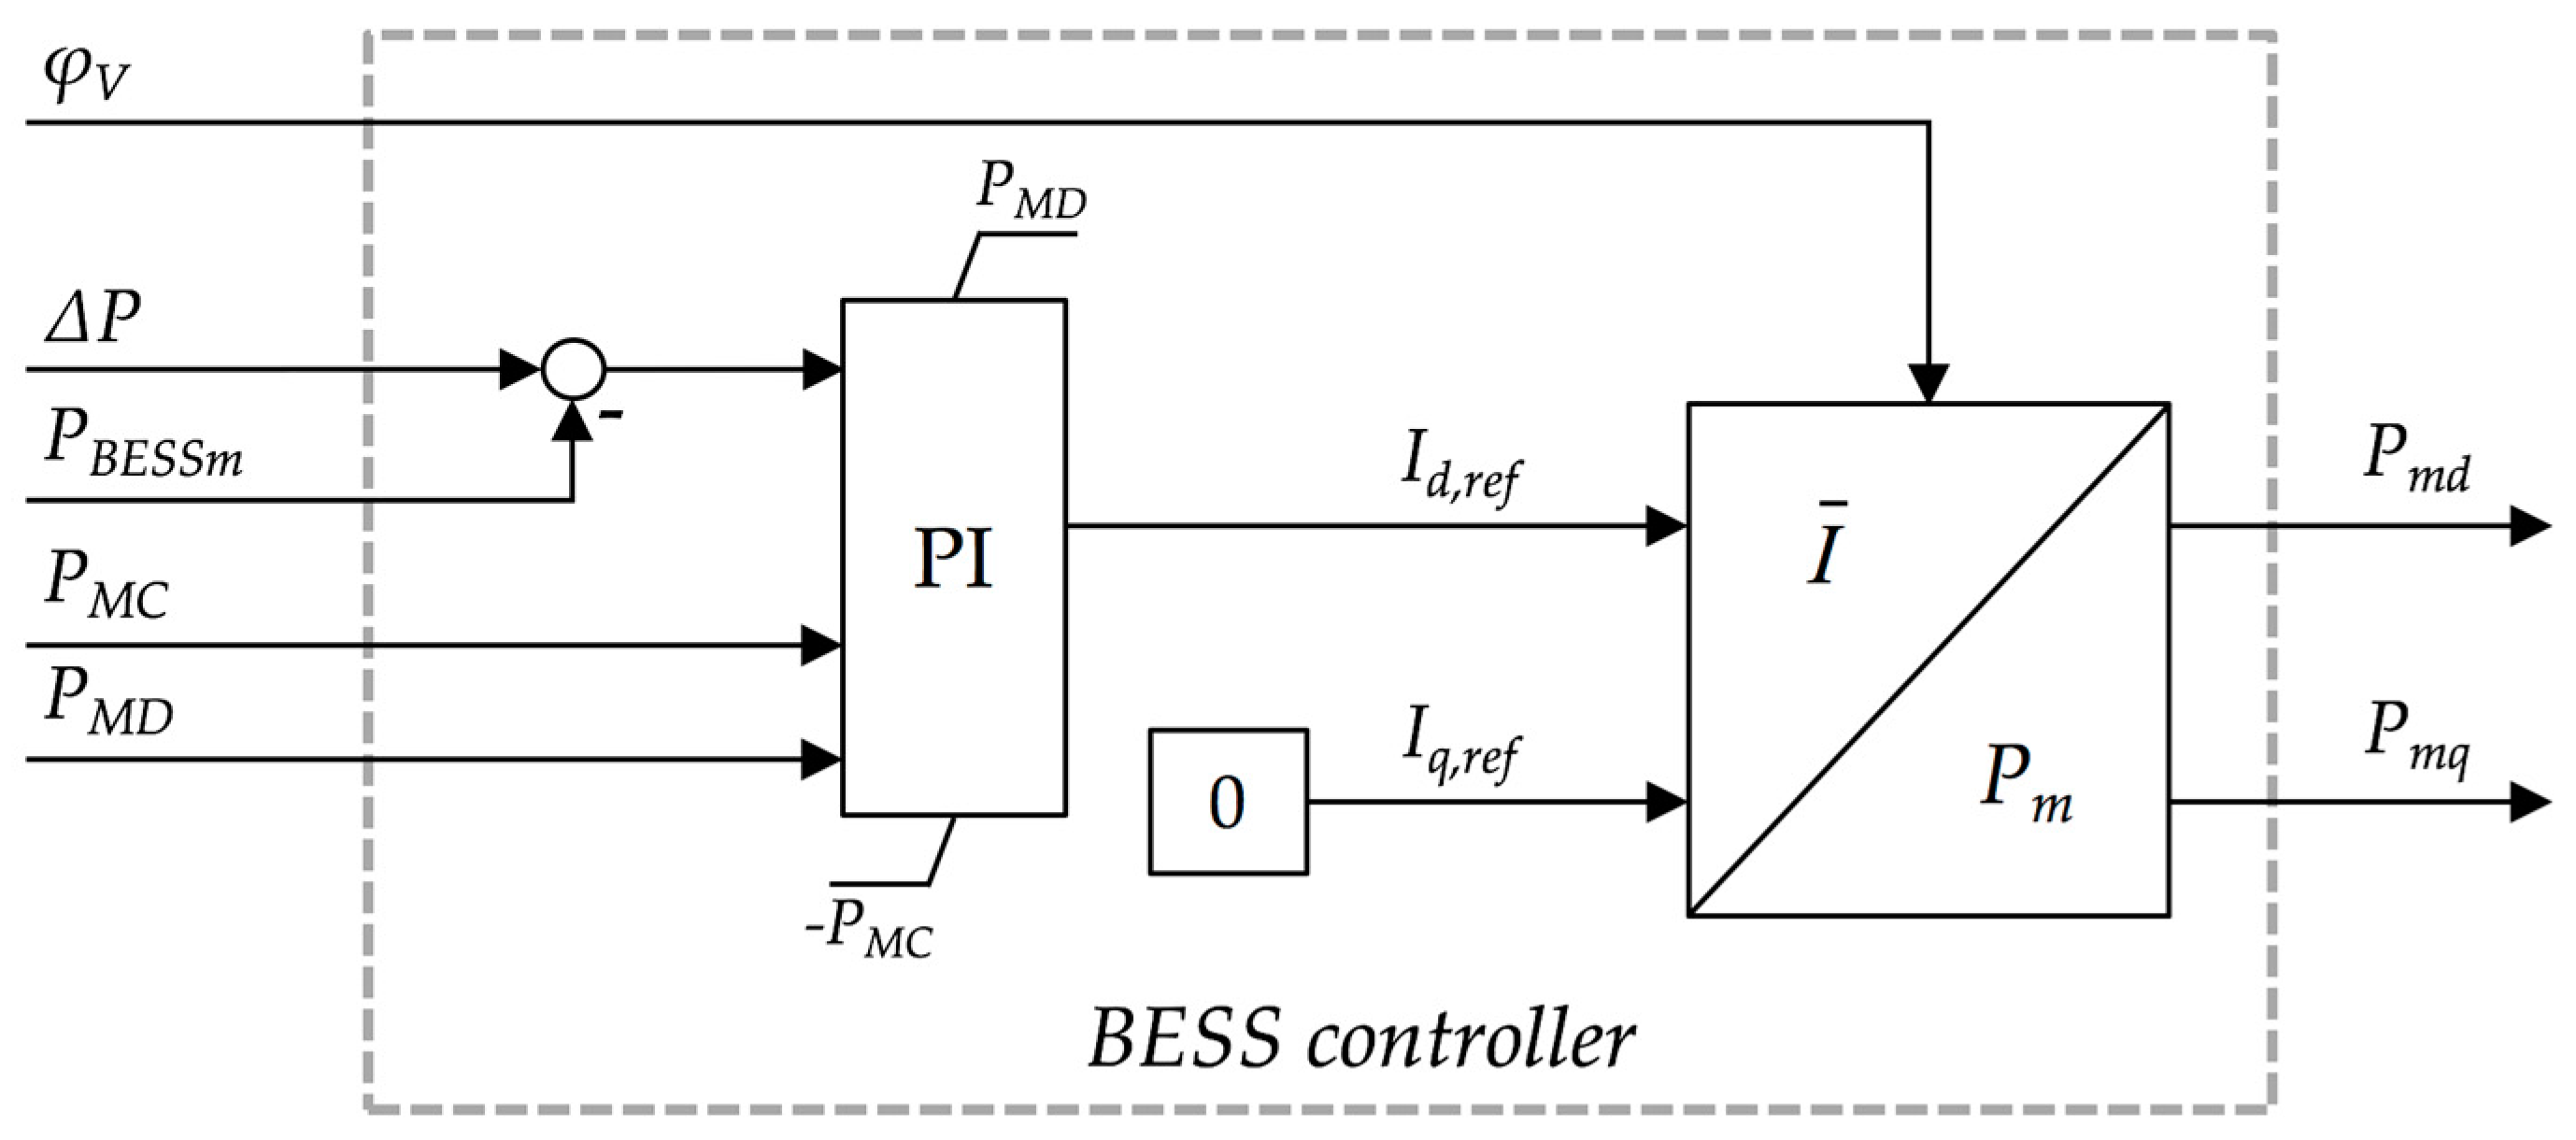
Figure 5 defines the internal scheme of the block
BESS Controller. The overall plant required reserve Δ
P is compared with the effective BESS active power exchange
PBESSm. A Proportional-Integral (PI) controller, equipped with an anti-windup internal loop, computes the direct current set-point
Id,ref, whereas the quadrature current reference signal
Iq,ref is set to zero since no reactive power contribution of the storage unit in supplying the voltage regulation is here considered. The following block drives the power electronic converter (block
BESS PWM Inverter in
Figure 4) via the pulse width modulation factors
Pmd and
Pmq.
The internal scheme of the block
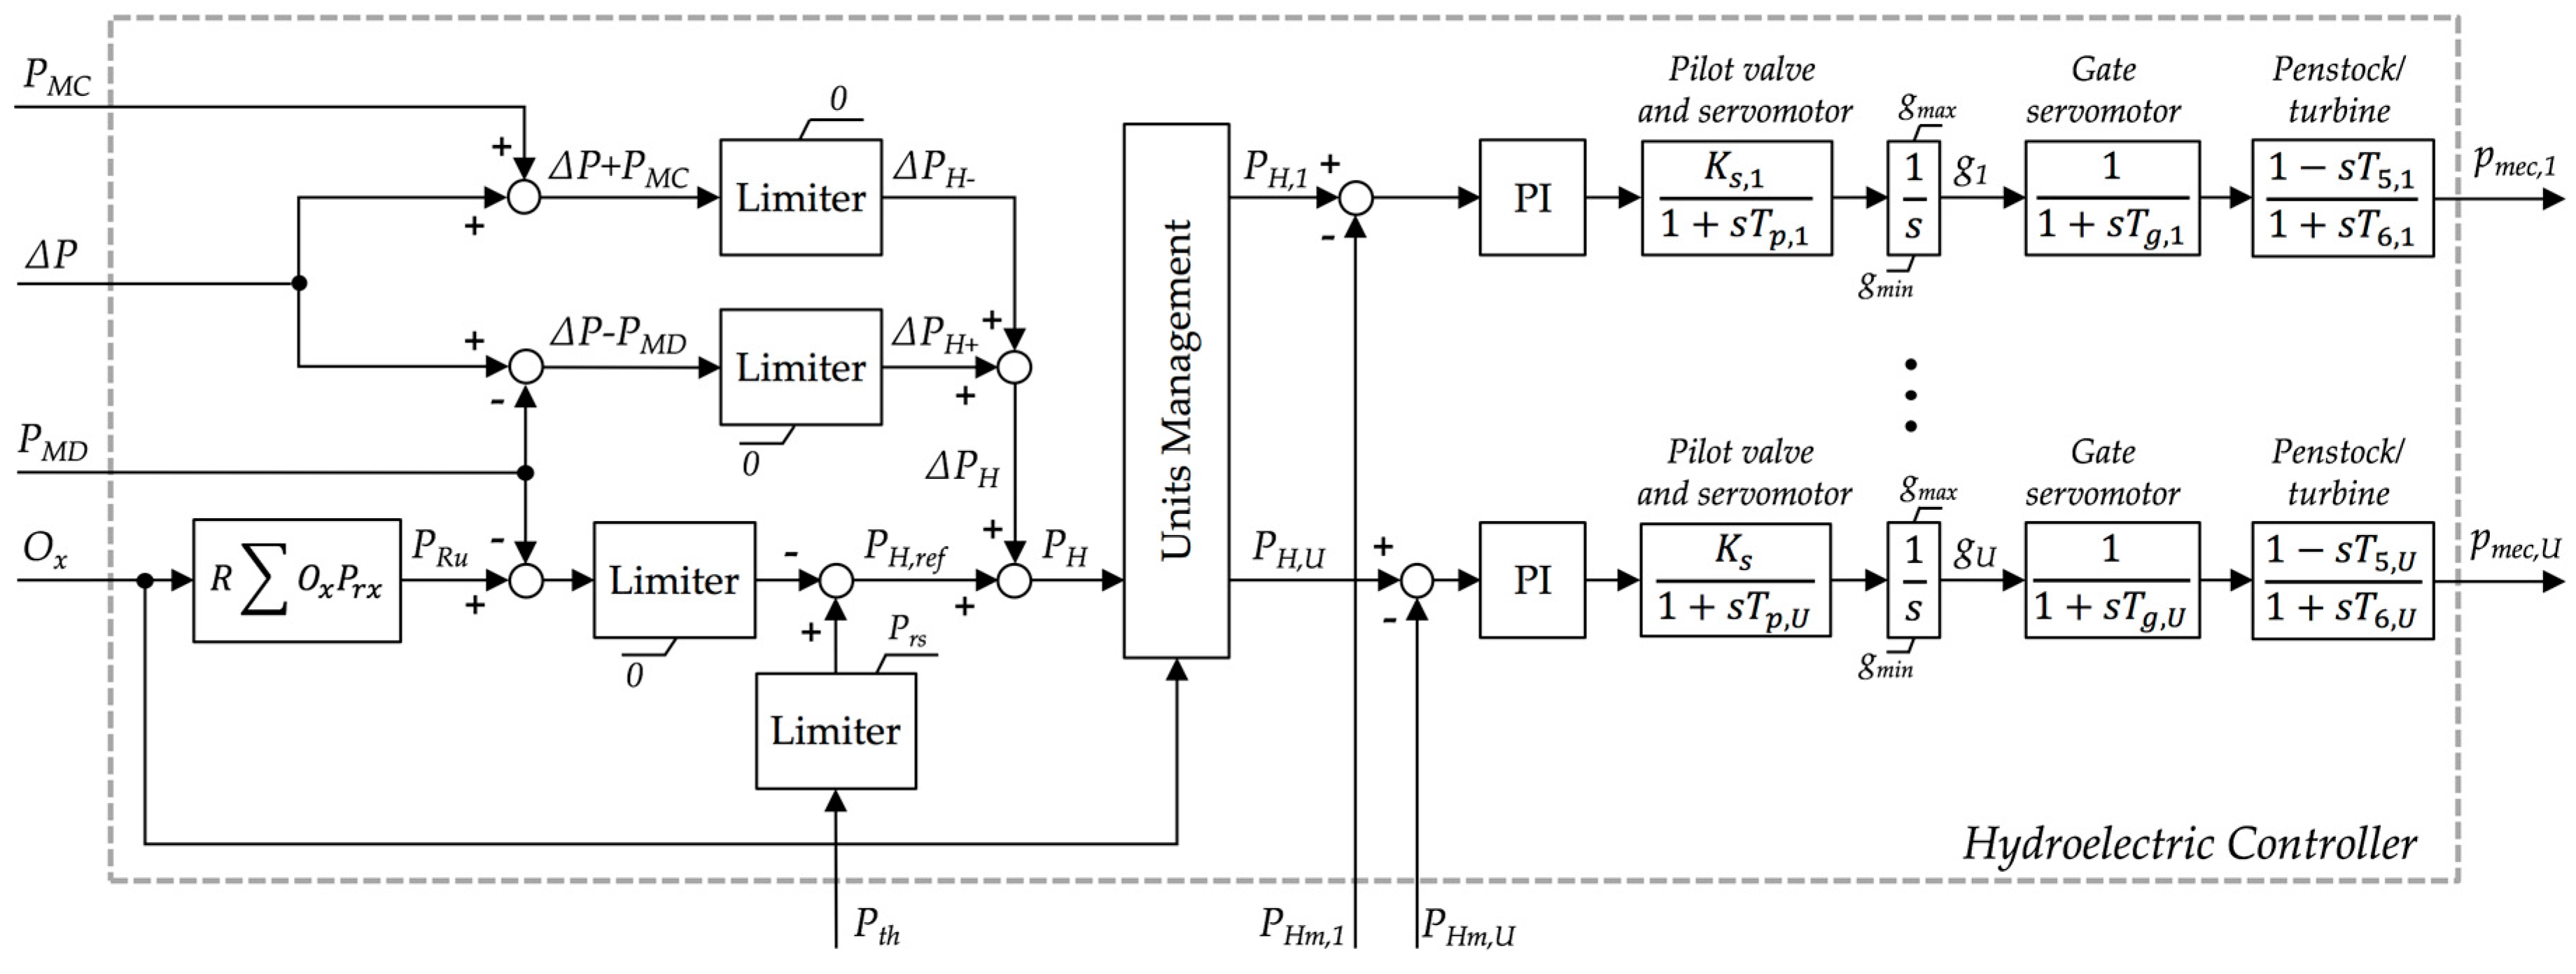
Hydroelectric Controller in
Figure 4 is detailed in
Figure 6. On the left-hand side, the required upward power contribution
PRu is computed knowing the state of the hydroelectric units
Ox and their rated power
Prx (
x = 1,…,
U), according to (2). The available power
Pth is computed as the sum of the power availabilities
Pth,x of each
xth unit. In case the BESS maximum discharge power
PMD is not enough to completely provide the required upward reserve (due to the storage size or its operating conditions in terms of SoC), the hydroelectric governor sets the overall reference power
PH,ref lower than the available power
Pth to make the hydroelectric generators able to partially contribute to the upward reserve. Concurrently, the required PCR contribution Δ
P is compared with
PMD and
PMC to define the effective contribution Δ
PH required of the hydroelectric section of the hybrid plant (Δ
PH+ is higher than zero if the BESS does not completely provide the required Δ
P in case of severe under-frequency, similarly for Δ
PH−). Finally, the hydroelectric section reference power
PH is computed by summarizing the reference operating power
PH,ref with the required variation Δ
PH.
The block
Unit Management shares the reference signal
PH among the hydroelectric units in operation. Later,
U independent controllers regulate the hydroelectric units; reference signals
PH,x are compared with the measured generations
PHm,x and the obtained errors are elaborated by suitable PI controllers [
38]. Since hydroelectric plants’ behaviour is strongly affected by water inertia, this is represented as two servomotors for each unit, acting on the control gate. The first low-power servomotor, equipped with a pilot valve controlled by an electronic regulator, operates the distributor valve of the high-power gate servomotor. So, blocks
Pilot valve and servomotor and
Gate servomotor describe the dynamic behaviours of the pilot and the main valve/servomotor systems respectively. For the
xth hydroelectric unit,
KS,x is the gate servomotor gain,
Tp,x is the pilot servomotor time constant and
Tg,x is the gate servomotor time constant. The resulting control signal
gx, limited within the admitted range (
gmin–
gmax), is the gate position of the
xth unit.
The block
Penstock/turbine describes the linear model of the penstock/turbine system. For each
xth unit, the mechanical power reference signal in per unit,
pmec,x, is obtained according to the evaluated gate position
gx and the hydraulic system dynamic response. The water inertia time constant
TW,x is given by Equation (15), so water column time constants
T5,x and
T6,x are defined as in Equations (16) and (17) [
39]:
In the above equations, referring to the xth unit, Qx is the water flow rate in (m3·s−1), Lx is the length of the penstock in (m), gv is the gravity acceleration in (m·s−2), Ax is the penstock cross-sectional area in (m2), Hx is the net hydraulic head in (m) and P0,x is the hydraulic power in steady-state operating conditions, in per unit of the rated value.
No limits to the PCR contribution are implemented in the control scheme in case of over-frequency, according to grid codes [
5]. If required, the plant output power can be reduced until the technical minimum constraint is reached.
5. Case Study
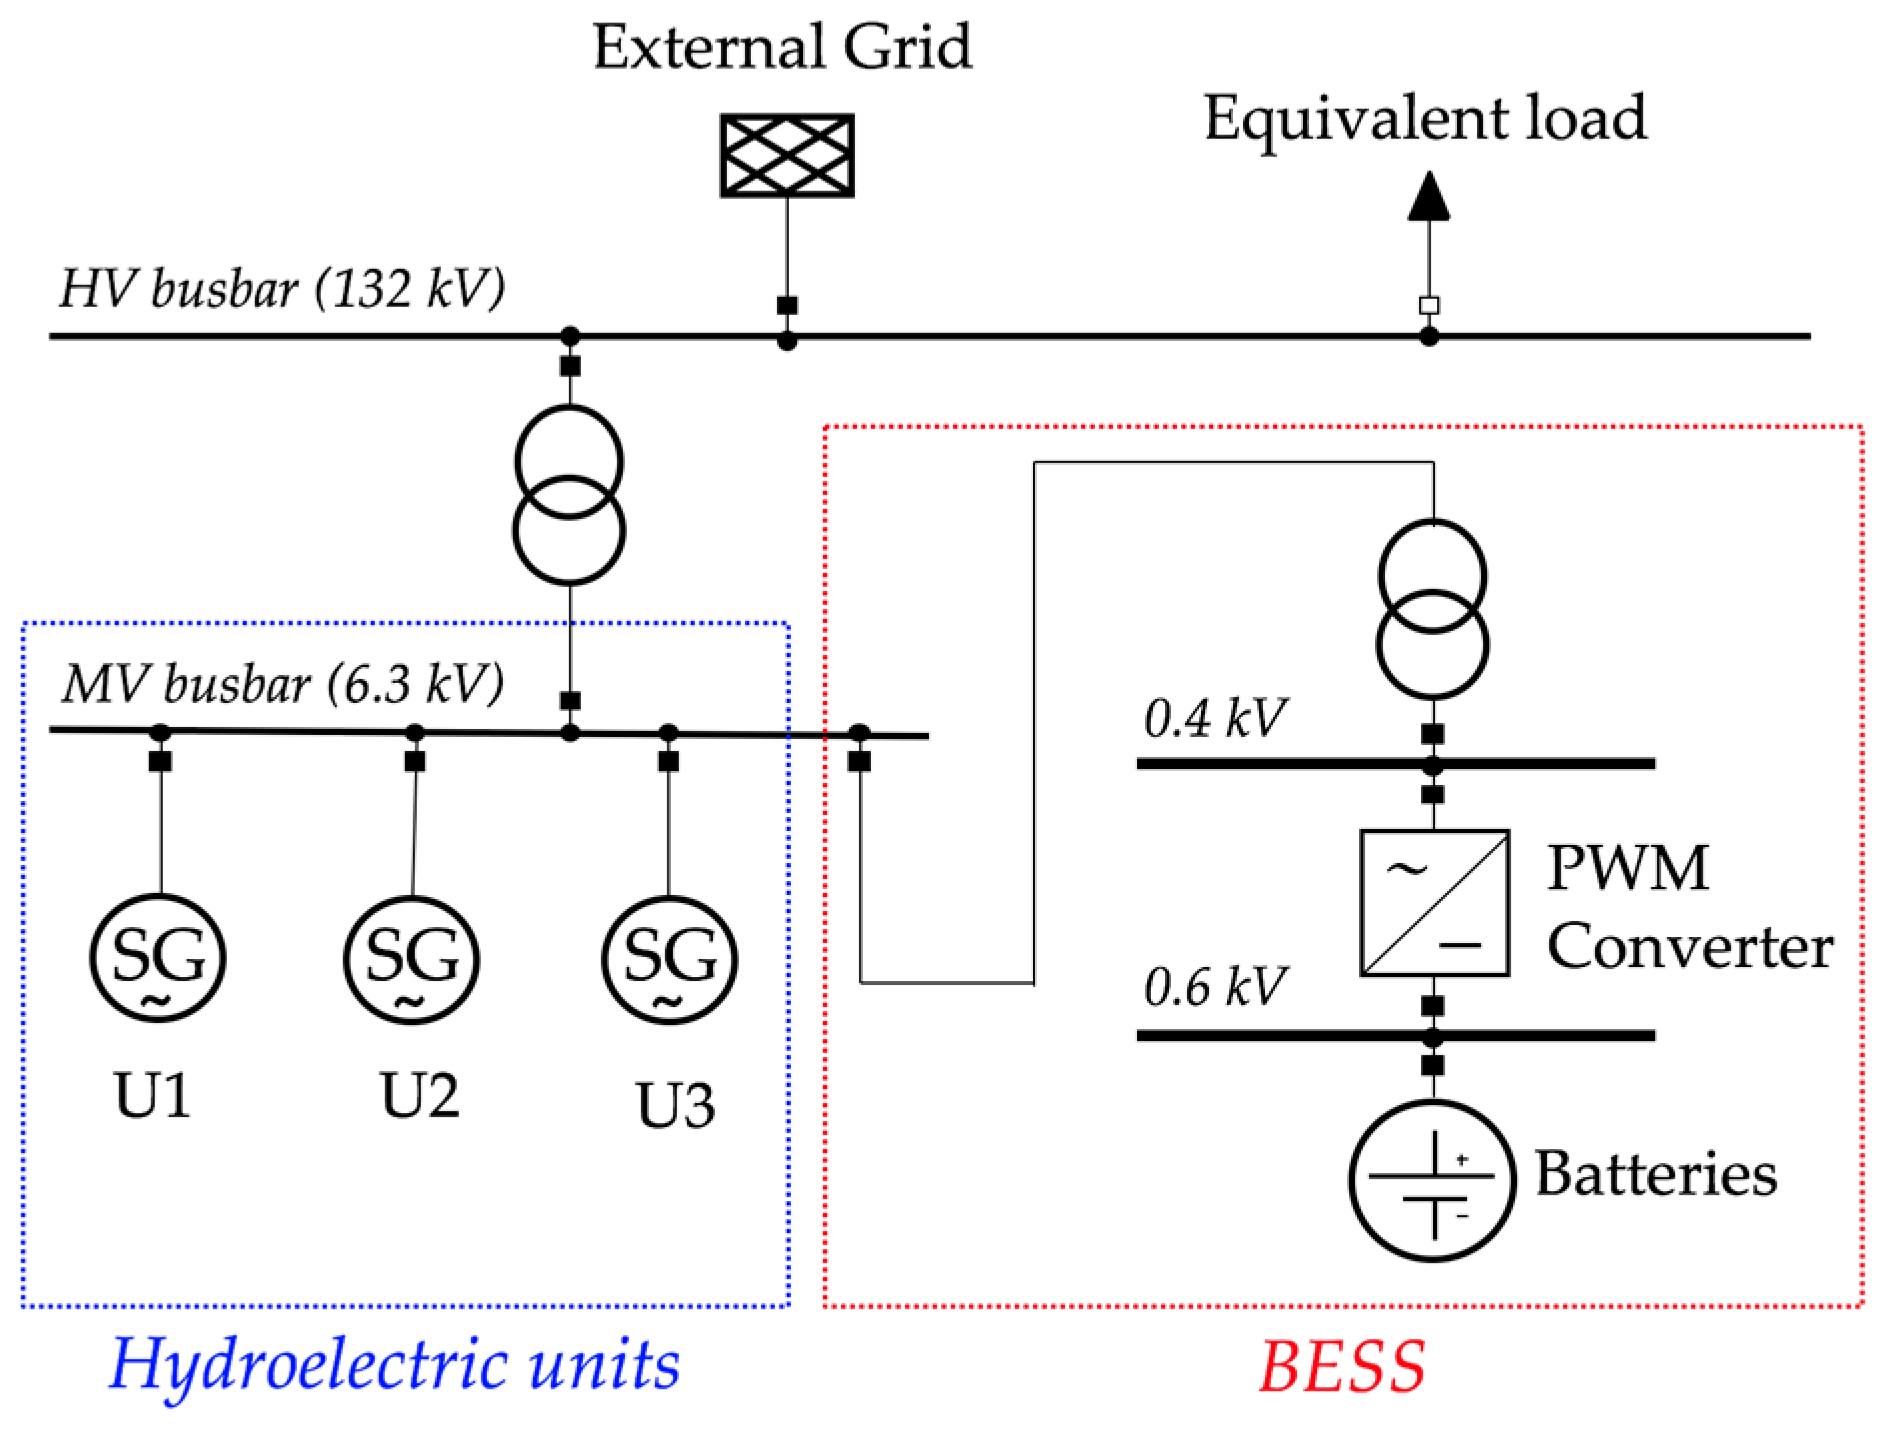
A real run-of-river hydroelectric power plant is considered in the case study as base configuration. The plant consists of three synchronous generators (named as units) connected to the transmission grid as illustrated in
Figure 7. Generators have rated power 2.36 MW (
U1) and 5.22 MW (both
U2 and
U3), for an overall plant rated value of 12.8 MW. The hydraulic characteristics of each unit are summarized in
Table 3. Generators operate at rated voltage 6.3 kV, so a 132/6.3 kV step-up power transformer is required for the generator’s connection to the main grid. The node
HV busbar is supplied by an equivalent network (element
External Grid) with short circuit current of 50 kA (corresponding to a short circuit power of about 11.4 GVA).
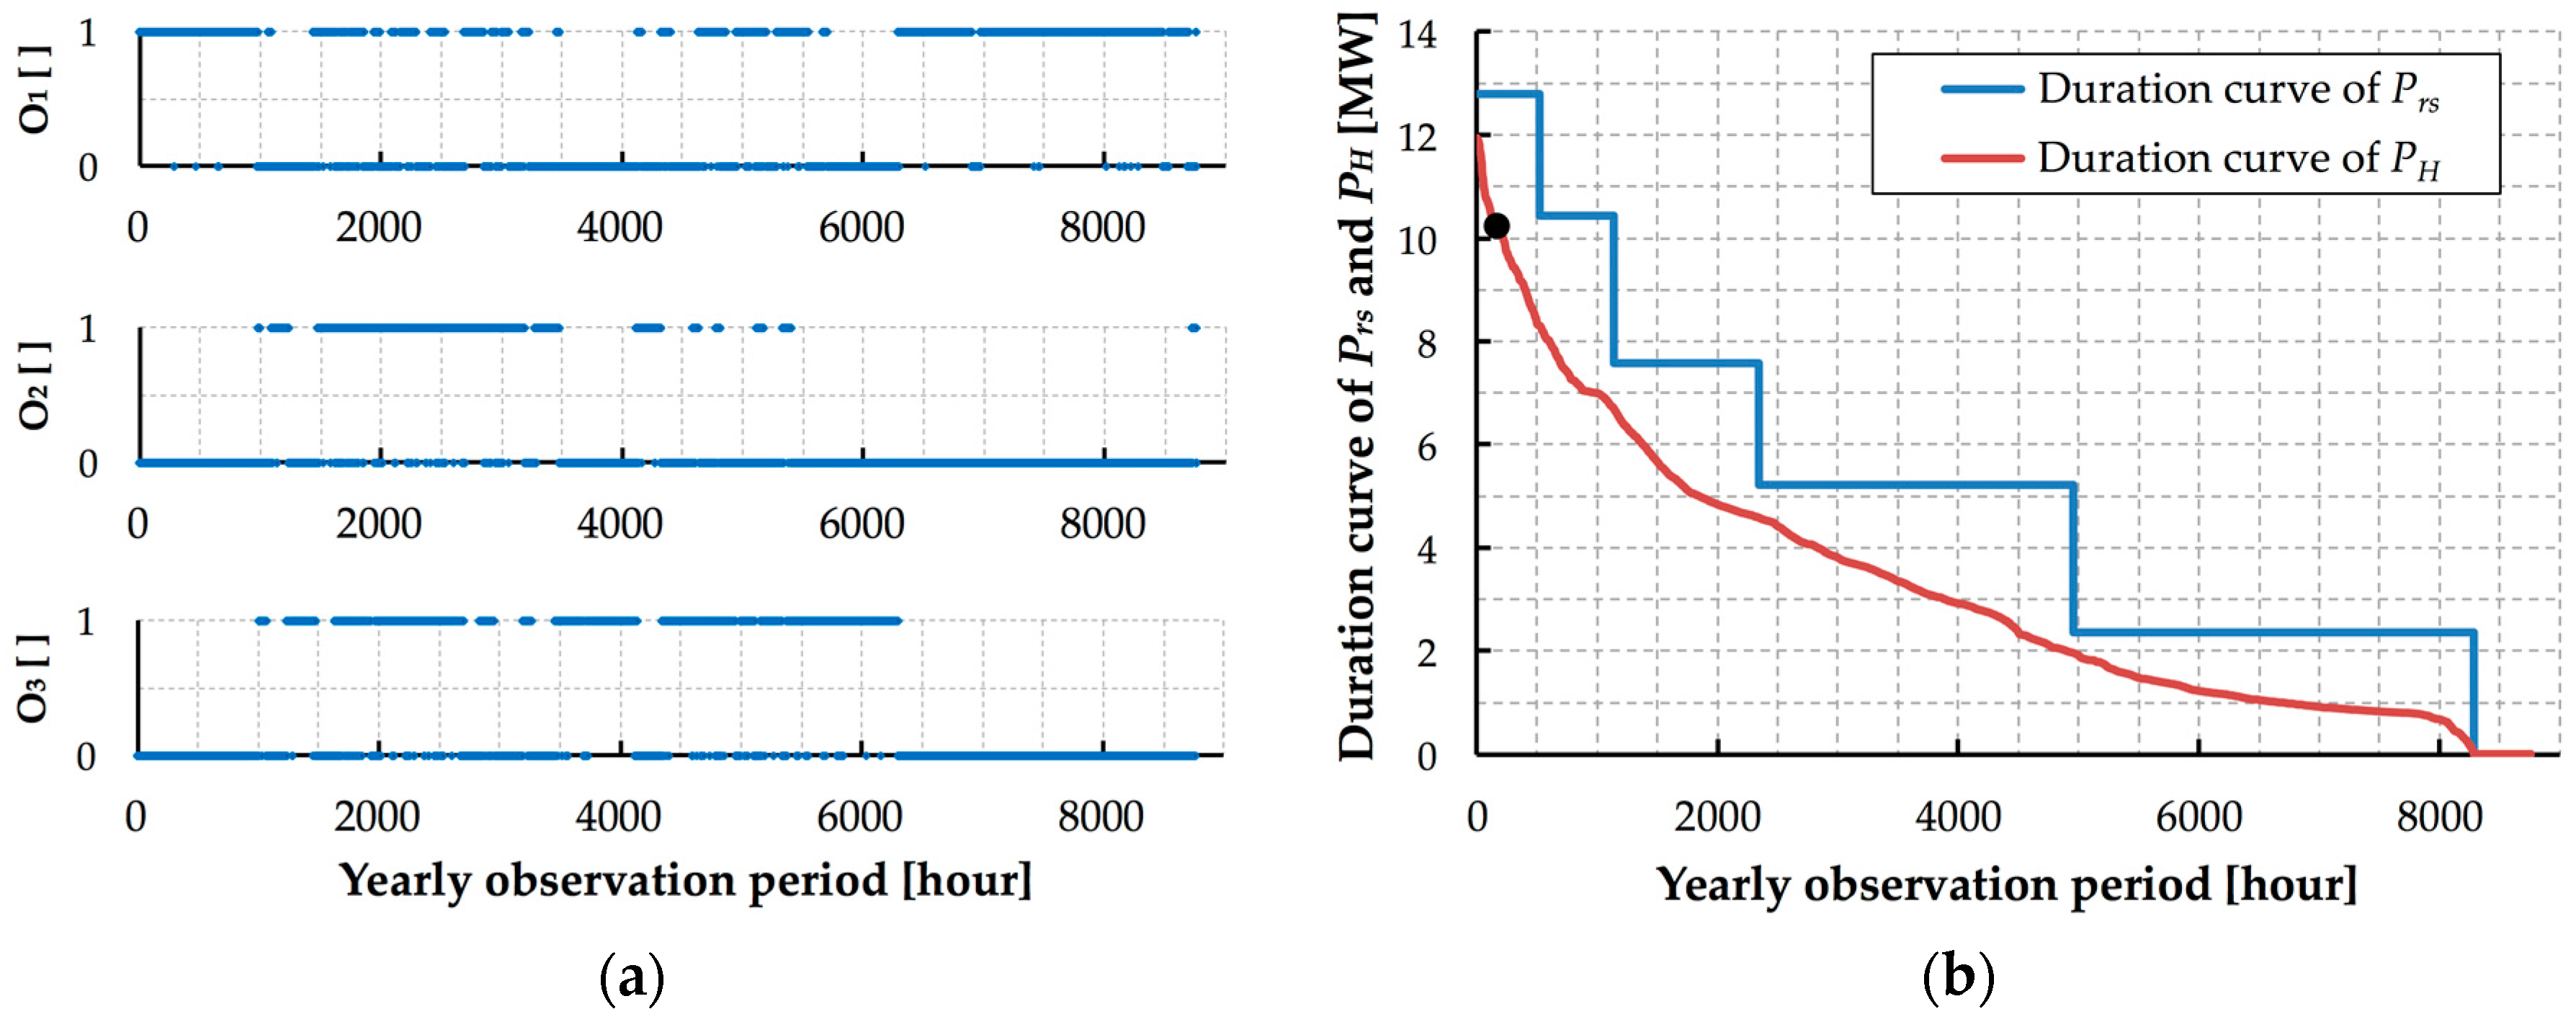
It is worth noting that a run-of-river hydroelectric plant rarely operates at rated power. The real state trends of the hydroelectric units are shown in
Figure 8a and summarized in
Figure 8b, the latter representing the duration curves of both the operating rated power
Prs and the effective hydroelectric production
PH. Equivalent values are reported in
Table 4. It is clearly demonstrated how all three units are simultaneously in operation for only 5.9% of the overall observation period, which is one year, whereas the plant overall operating rated power
Prs is lower than half of the installed rated power
Pr for a relative time duration of around 73.3%. This, reflecting a yearly equivalent unitary production of 2196 kWh/kW, is an intrinsic characteristic of this type of renewable plants, which are highly affected by seasonal variations in the river flow rate. Considering that the present standards evaluate the required upward PCR according to
Prs,
Table 4 reports in the last column the minimum upward reserve the plant has to guarantee depending on the state of each unit. Furthermore, the black dot in
Figure 8b indicates the plant operating conditions used as initial state for the dynamic simulations described below.
The technical–economic analysis of a hybrid plant integrating a BESS has been performed assuming a storage system connected in parallel with the three units. Considering the expected size of the BESS and the technology evolution of power electronic devices, the storage unit is connected making use of a dedicated 6.3/0.4 kV transformer. An opportune value of 600 V is assumed as BESS DC busbar rated voltage.
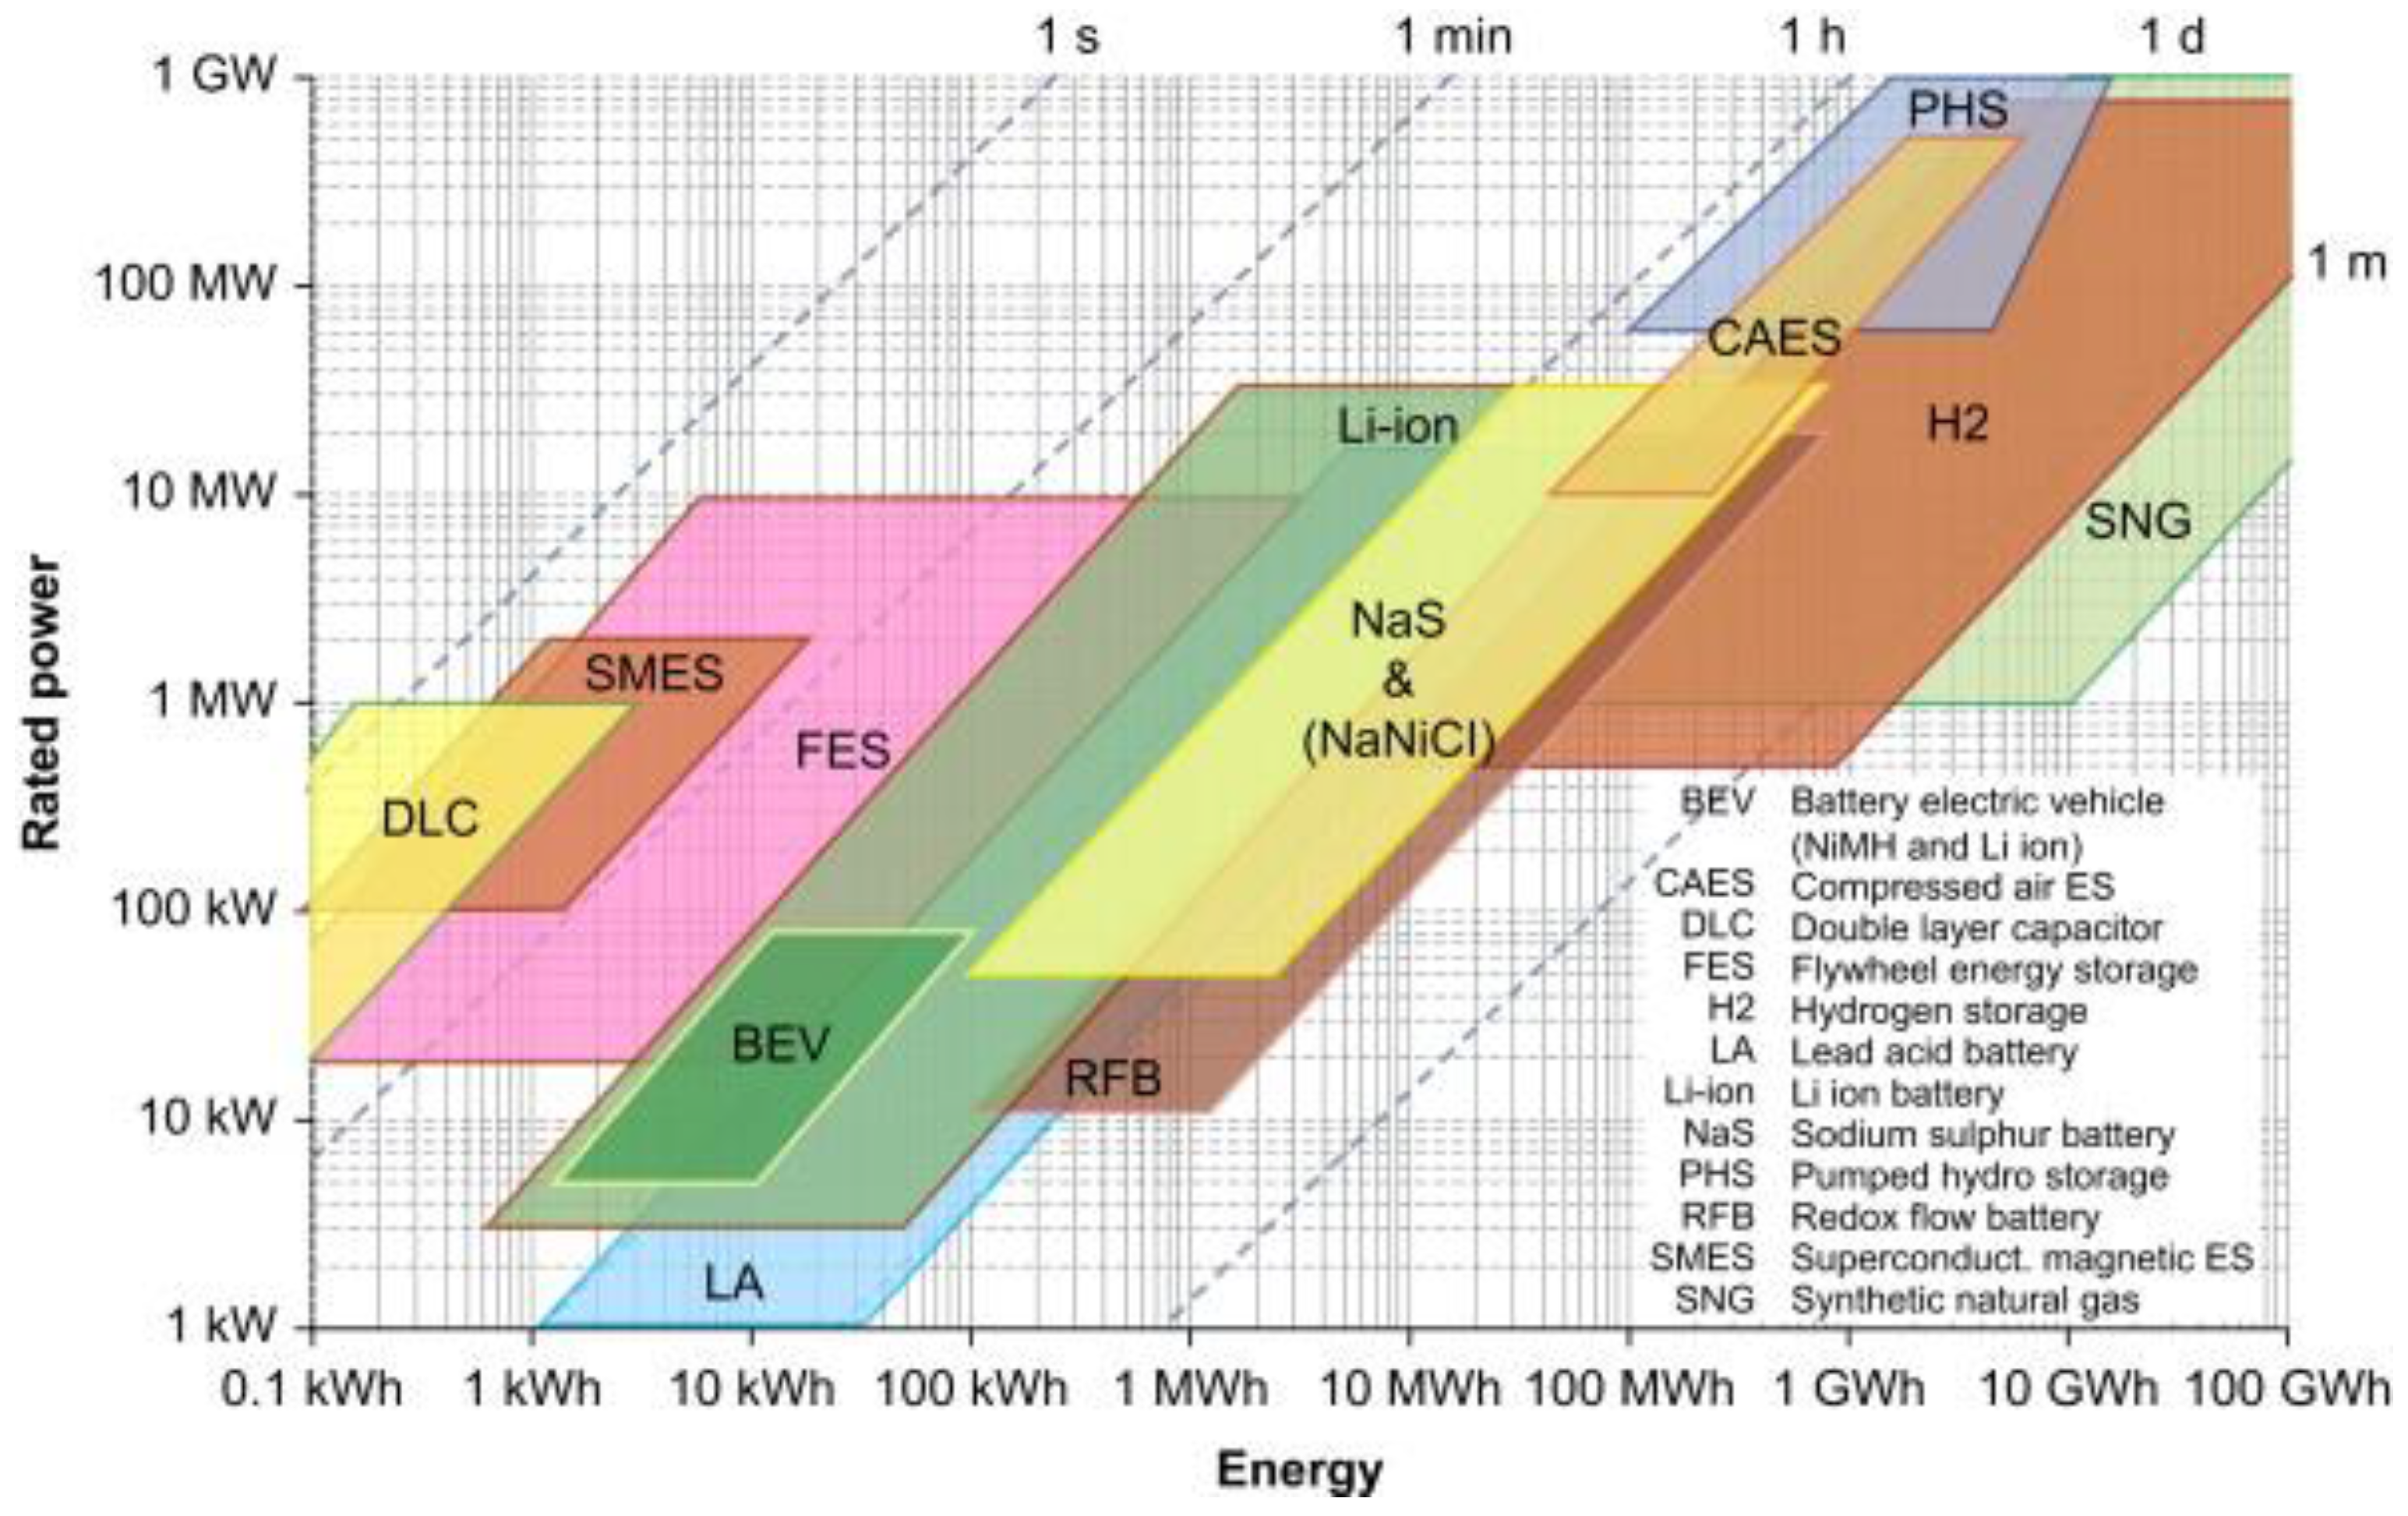
In this work, for selecting the electrochemical storage technology to be used in both the technical–economic analysis and the dynamic simulations, few issues have been considered, taking into account the main characteristics of available technologies, as briefly reported in
Figure 9 (obtained from [
40]):
PCR is required for R times the generating plant rated power, if all the generating units are in operation;
The rated power of hydroelectric plants connected to the HV transmission network typically varies between few MW and hundreds of MW. Considering the previous point and sizing the BESS according to the required upward reserve, a storage unit with discharging power varying between tens of kW and 10 MW is able to fully cover the reserve contribution in case of under-frequency;
PCR is classified as a power ancillary service, since it is required for the stabilization of the power system in the quarter-hour after the frequency perturbation (this time duration is introduced by the standards to prevent frequency oscillations during the secondary regulation), as illustrated in
Figure 1. Considering that several frequency perturbations with the same sign could be recorded in sequence, this means that a storage technology with discharging time between a few tens of minutes and a couple of hours is required (it should be noted that the BESS has to maintain its SoC around 50% in normal conditions, to be able to regulate both upward and downward);
Taking into account the frequency trend over time, hundreds of equivalent charging/discharging cycles are expected on a yearly basis. This requires adopting a storage technology with a lifetime of thousands of cycles or more to preserve the BESS investment profitability. Alternatively, considering other storage technologies (e.g., lead acid batteries), severe oversizing could be needed to cover the required number of charging/discharging cycles (i.e., increasing the minimum admitted SoC), with consequent increase of weight, physical dimensions and costs.
Basing on the above criteria, a lithium-based BESS has been considered. This choice is confirmed by other studies investigating the integration of BESSs for PCR applications [
34] since this technology ensures low self-discharge, high efficiency, long calendar and cycle life [
3,
18]. In addition, the BESS maximum power, in both charging and discharging phases, is almost unaltered varying the internal SoC. In particular, the Lithium-Iron-Phosphate (LiFePO
4, frequently called LFP) and the Lithium-Titanate (LTO) technologies seem to be two of the most appropriate solutions for this kind of application [
33]. Both the technical–economic analysis and the dynamic simulations do not consider the specific type of Lithium-ion battery (in terms of cathode material, anode material, electrolyte, etc.), since this choice will be done in the future final design of the storage system composing the hybrid hydroelectric plant. In addition, it should be noted that other storage technologies such as molten-salt based batteries, either Sodium-Sulphur (NaS) or Sodium-Nickel (Na-NiCl
2) batteries depending on the storage size, can be easily implemented in both the technical-economic model and the dynamic simulations. According to the selected storage technology,
Table 5 collects all the relevant data considered by the authors in the case study.
An equivalent load is connected to the HV node to represent other users either connected to the same substation or electrically close, e.g., distribution networks supplied by the HV busbar as in [
41]. Network events used to test the hybrid plant behaviour are obtained by varying the load absorption. Simulation results are analysed for different BESS sizes.
5.1. Results of the Technical–Economic Analysis
The procedure developed by the authors and described in
Section 3 is here applied to the case study to define the optimal size of the BESS. Both the yearly simulations and the final economic analysis are carried out in a MATLAB environment.
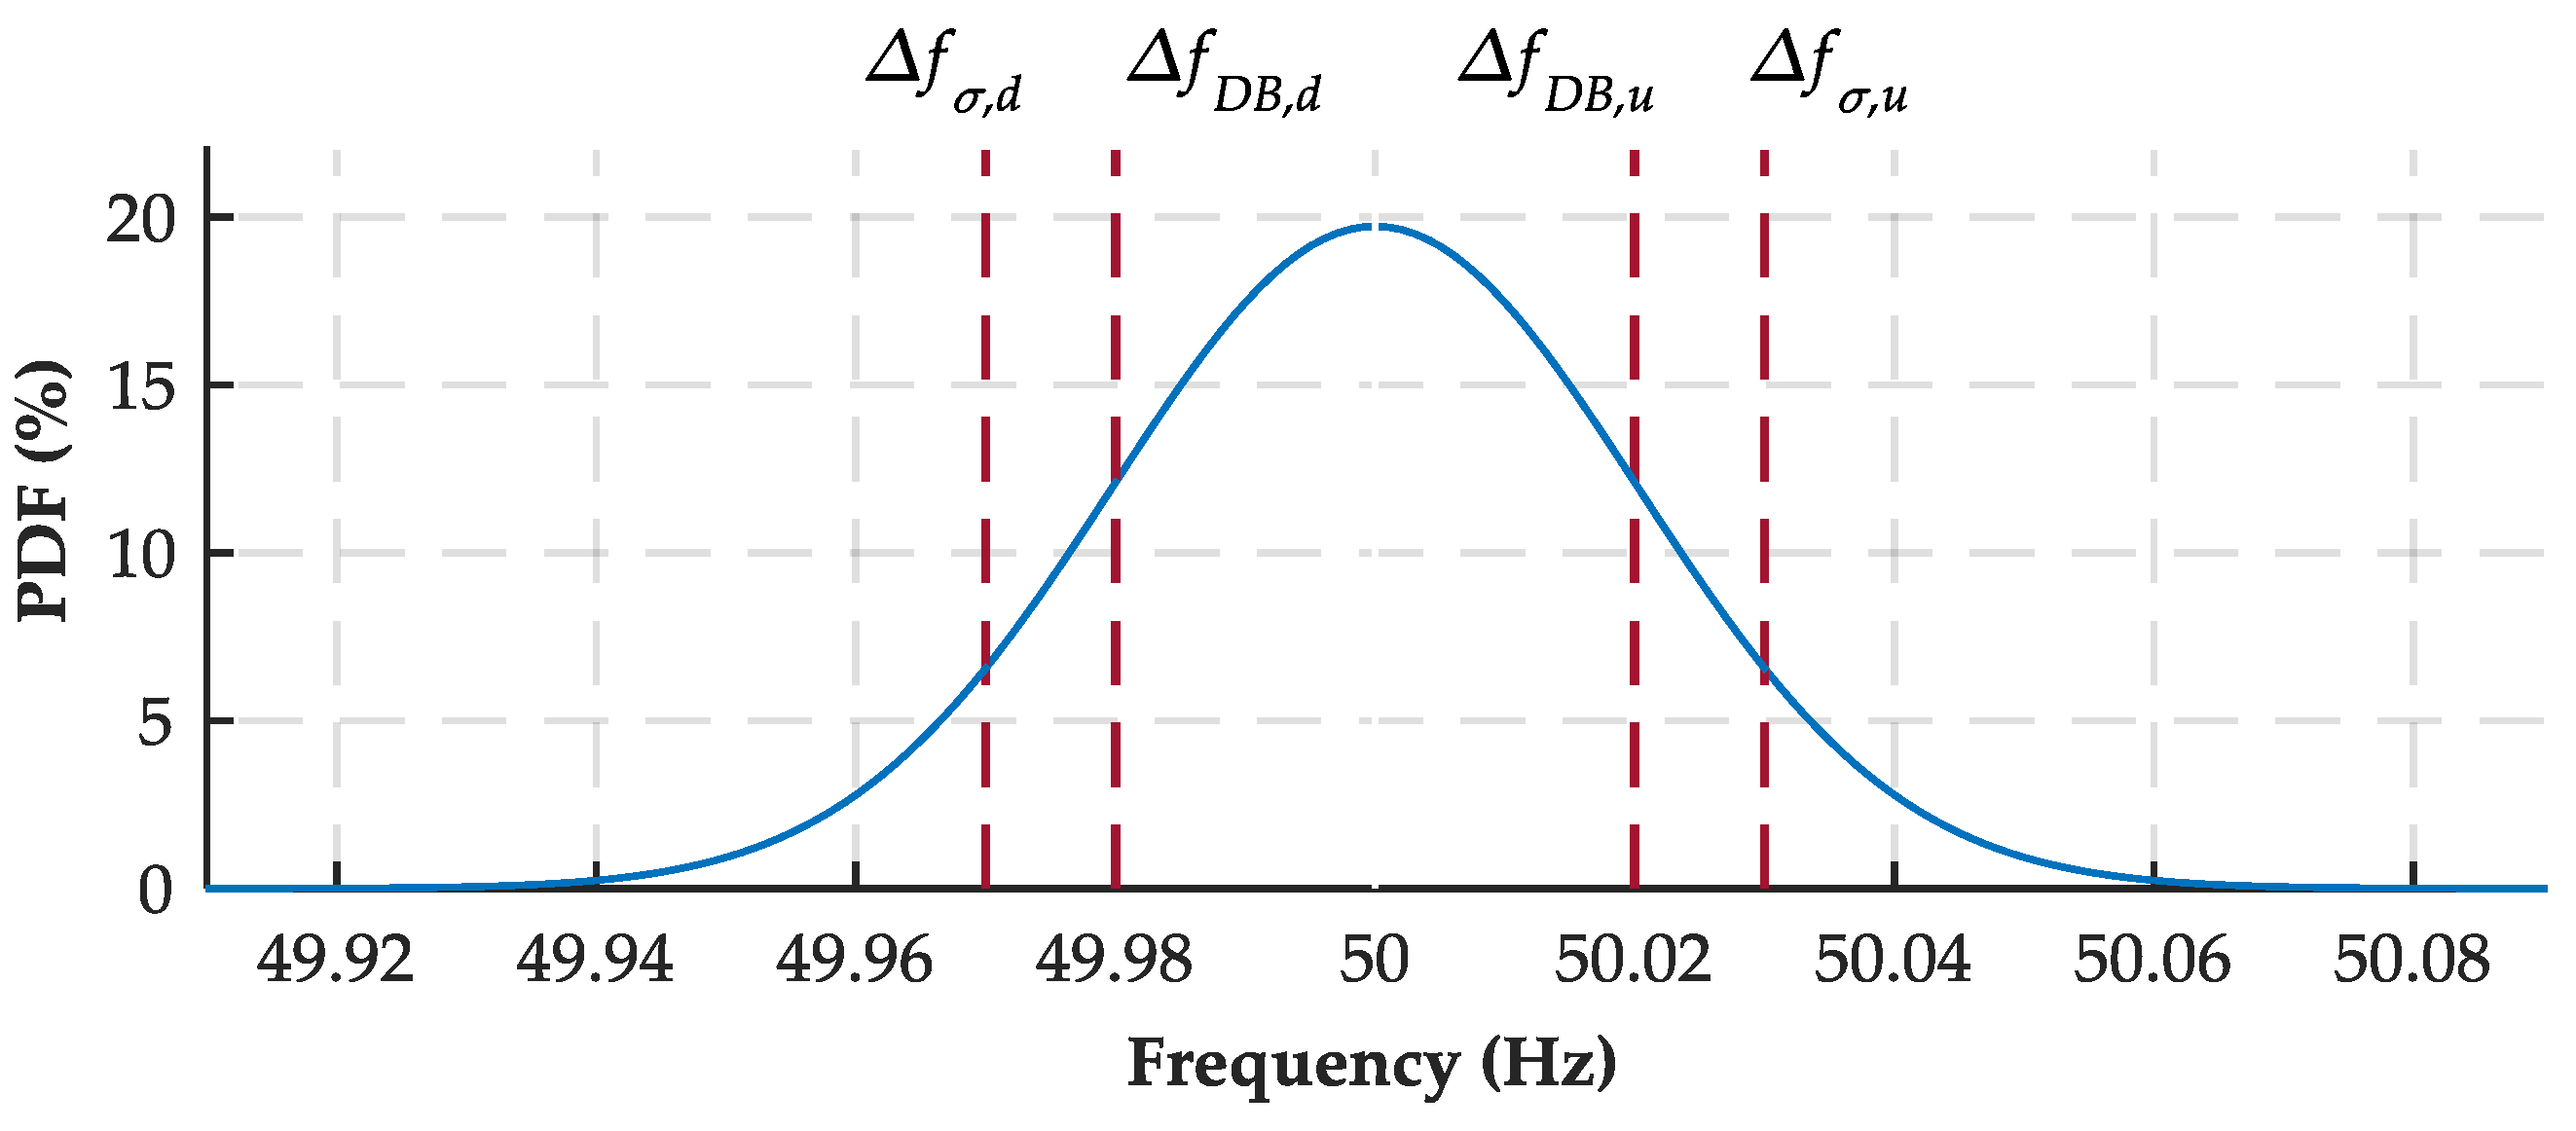
Grid frequency data are obtained from [
35], with one-second resolution. For the largest part (about 70%) of the analysed period (one year, from March 2014 to February 2015), frequency fluctuates within the dead-band defined in
Figure 2 and
Table 2. Outside the dead-band, under-frequency and over-frequency values have a nearly symmetric distribution. The grid frequency Probability Density Function (PDF), reported in
Figure 10, shows that almost all the frequency perturbations are within ±50 mHz, according to frequency statistics described in other research works [
6,
19,
26].
Considering the base case, the actual renewable energy availability and the required upward reserve (
R = 1.5%), the analysed run-of-river plant results in a yearly curtailment Δ
E equal to 656 MWh, which corresponds to 2.33% of the overall plant production
E (28,108 MWh). This causes an income reduction of about 62.5 k€/year, according to the produced energy selling value
V (€/MWh), in form of constant incentive as reported in
Table 3. The BESS role is reducing the energy curtailment by partially supplying the required power reserve.
First of all, the primary source availability is expected to dramatically affect the sizing procedure. In fact, considering the operating state trends of the hydroelectric units and remembering that the PCR is required for the operating rated power (rather than the effective plant output), the full provision of PCR by means of a storage unit could increase the renewable production (up to R/(1 − R) or more). On the other hand, a higher size BESS could prove to be unused for long periods of time if no significant frequency perturbations happen. Furthermore, the BESS price trend with increasing EBESS is expected to be an influencing issue.
In order to obtain a representative case study, different BESS sizes and multiple BESS price trends are here considered, namely:
The BESS size
EBESS is varied between a very limited value (30 kWh) and the size able to completely provide the upward power reserve (300 kWh), in accordance with the minimum discharging time
tDmin reported in
Table 5;
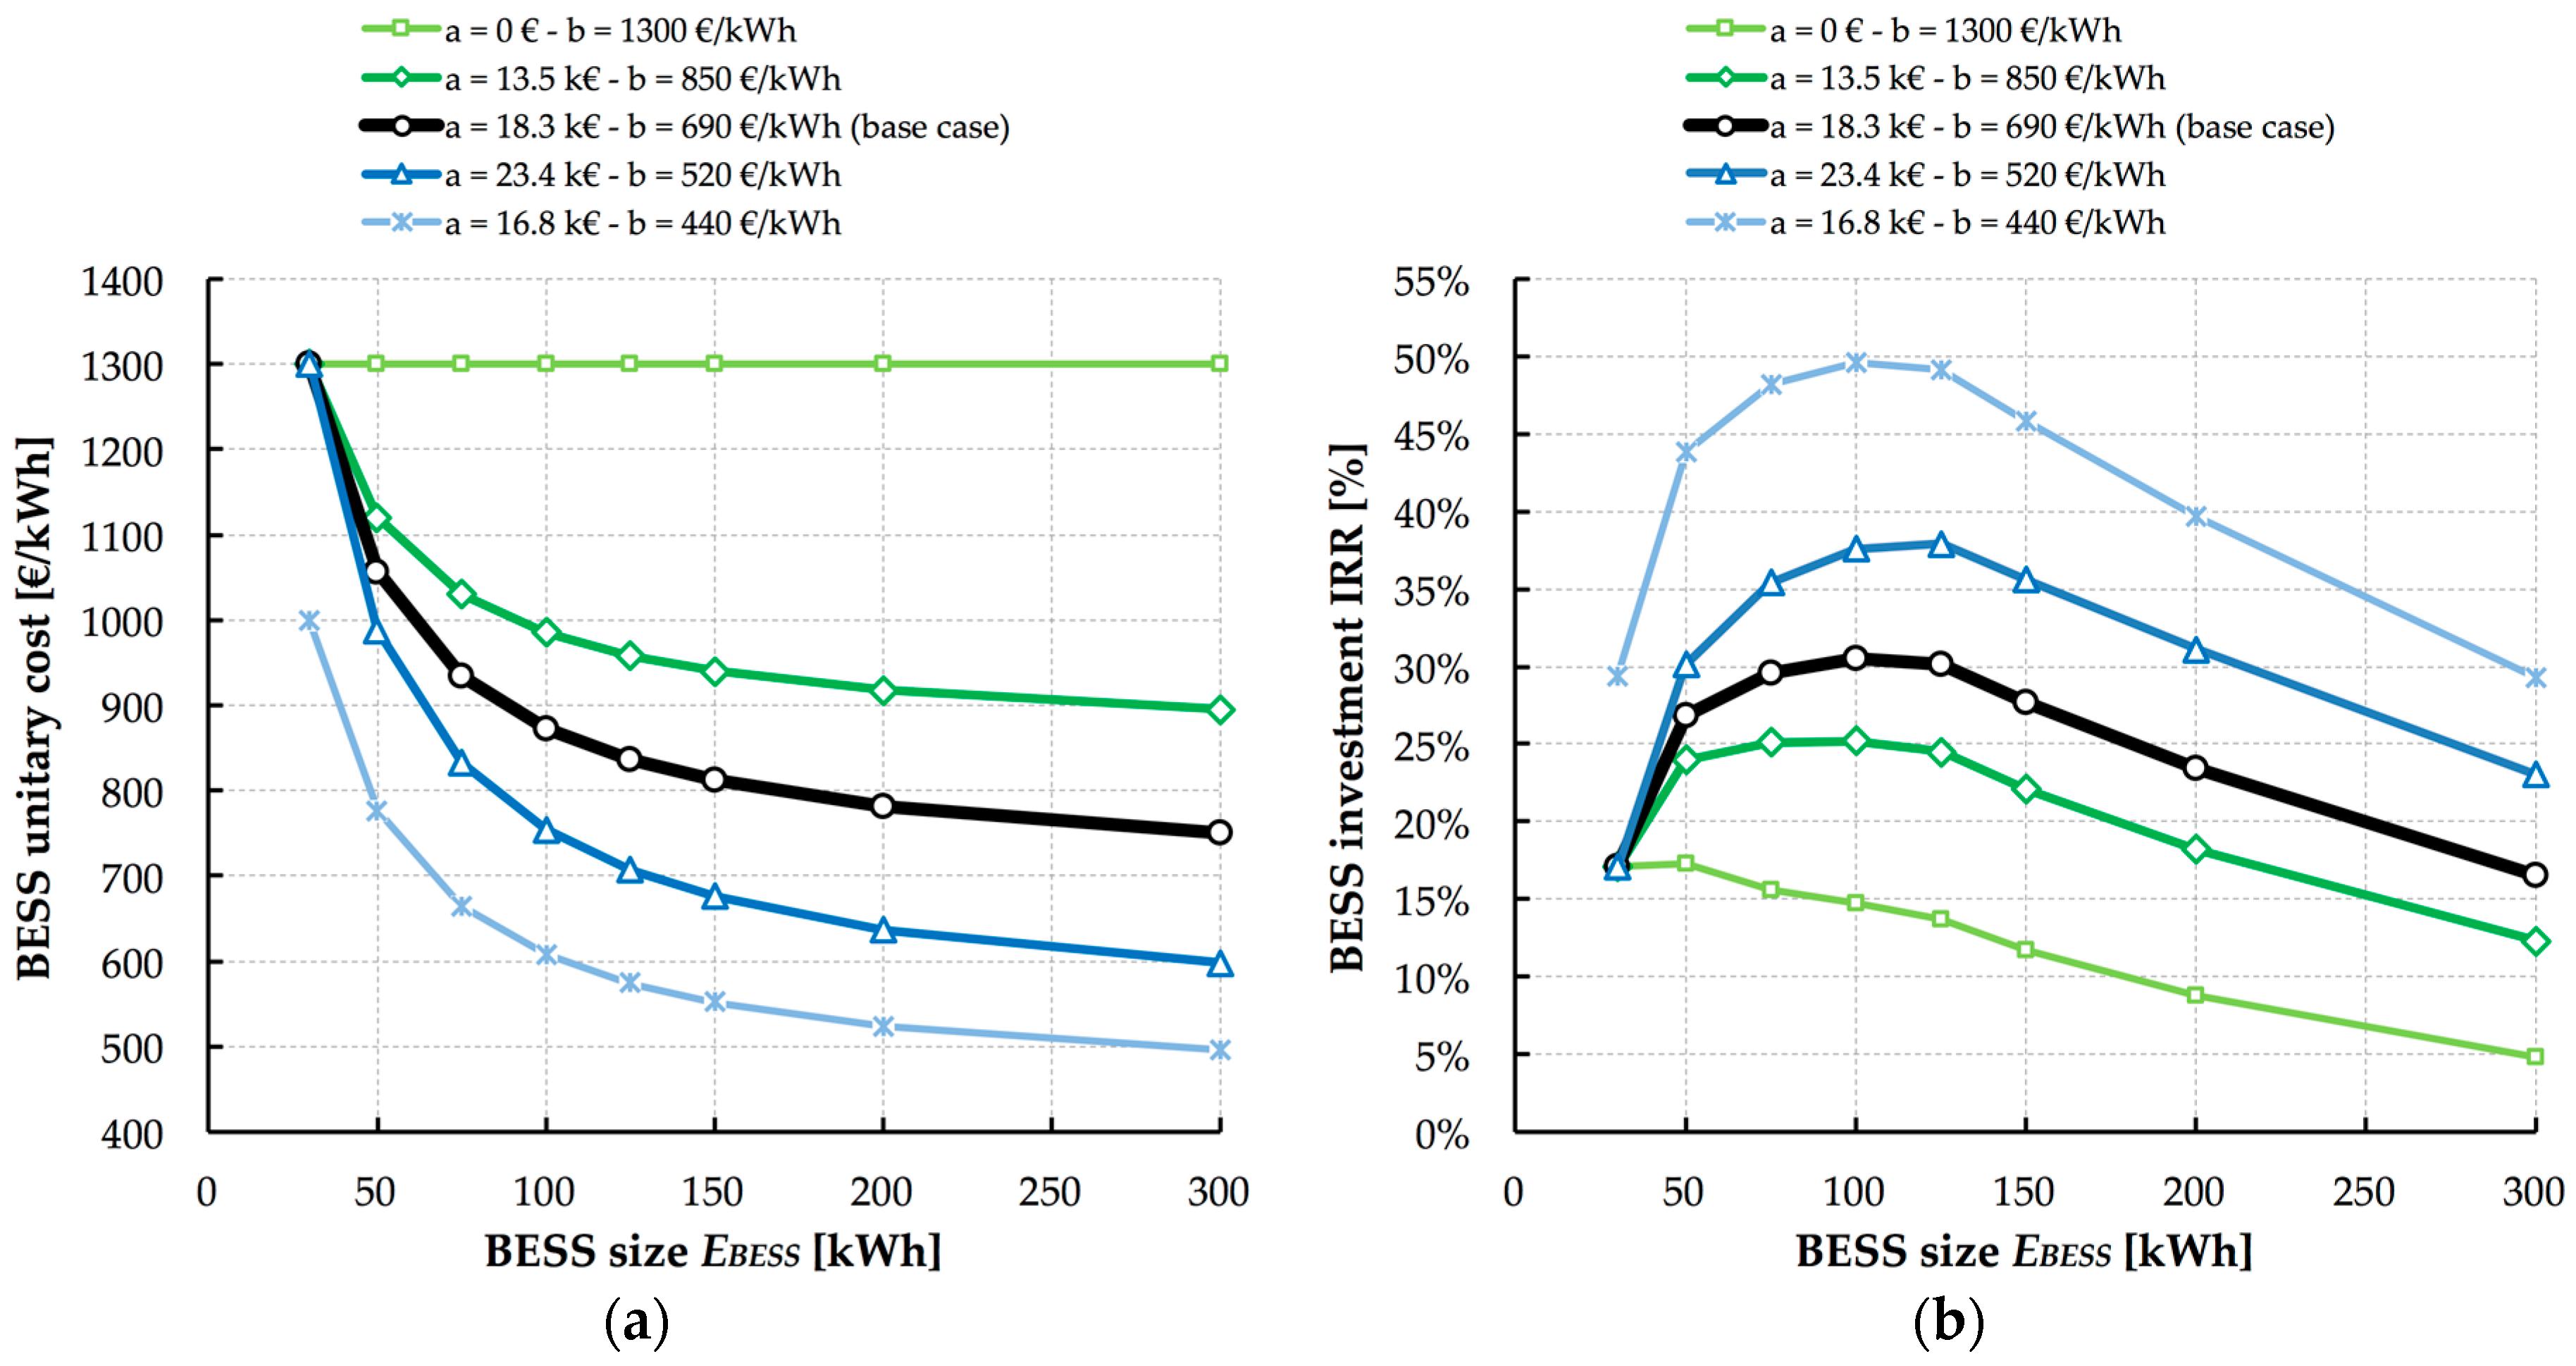
Five BESS price trends are introduced by modifying the coefficients
a and
b of formula (11), as depicted in
Figure 11a. Values reported in
Table 5 represent the base case (bold black line).
In the economic analysis, the discount rate
r, i.e., the return that could be earned per unit of time on an investment with similar risk, is assumed to be equal to 5.0%. Economic profitability is graphically reported in
Figure 11b, whereas
Table 6 details the results obtained by considering the base case in terms of BESS price trend. Even if almost all of the analysed BESS sizes results are economically interesting (IRR >
r), the discontinuous primary source availability, reflecting the operating state trends of hydroelectric units, makes a reduced BESS size of 66.7 kW/100 kWh more profitable (column reported in red in
Table 6). This storage system is able to fully supply the required upward PCR only in configuration 1 (larger units
U2 and
U3 switched off), whereas a contribution of the hydroelectric section of the overall hybrid plant is required for configurations 2 to 5.
Despite the small size, the economically optimal BESS size is able to supply a significant part of the overall reserve energy, both upward (51.6%) and downward (46.2%). It is worth noting that, in absolute terms, the upward regulating energy supplied by the BESS is lower than the downward energy contribution due to a couple of reasons: (i) no saturation on the downstream reserve is allowed by grid codes, so the overall plant downward reserve energy (78.3 MWh/year) is considerably higher than the overall plant upward reserve energy (62.0 MWh/year), even if the frequency statistical distribution is almost symmetrical (
Figure 10); (ii) the BESS efficiency requires the charging energy to be higher than the discharging energy. The reduced optimal size of the BESS results in more frequent use of the storage unit, even if this does not dramatically impact on its ageing: a reasonable lifetime of eight years is allowed with investment IRR higher than 30%.
A larger BESS should be able to supply a larger part of the overall plant reserve energy in a year, but this income increase does not compensate for the additional installation costs, even if a longer life is expected due to the reduction of the BESS yearly ageing.
Figure 11b further demonstrates the influence of the BESS unitary price on the optimal sizing results. Even if the obtained trends are similar, the storage unit optimal size is affected by the BESS price reduction while
EBESS increases. Keeping constant the BESS unitary price (i.e.,
a = 0 as represented with the light green line), the optimal size of the storage unit decreases.
5.2. Dynamic Simulations Results
In this section, dynamic simulations are carried out making use of the power system analysis software DIgSILENT PowerFactory to demonstrate the improvements obtainable by partially or completely supplying PCR by means of a battery storage unit. The generating plant is supposed to have RES availability
Pth equal to 80% of its rated value (the plant initial conditions are represented with the black dot in
Figure 8b). For convenience, considering the short duration of dynamic simulations,
Pth is supposed constant. All the units are in operation (
Ox = 1 for each
x = 1,…,
U, where
U = 3). In particular, three scenarios are analysed:
Scenario 1: traditional hydroelectric run-of-river plant, which supplies PCR only regulating the hydraulic power;
Scenario 2: hybrid hydroelectric power plant, in which the BESS size is defined according to the previous economic analysis (
EBESS = 100 kWh). In this configuration, the upward reserve (192 kW as defined in
Table 4) is partially supplied by the BESS;
Scenario 3: hybrid hydroelectric power plant, in which the BESS is able to supply the entire upward reserve, according to its internal operating conditions in terms of SoC admitted range (EBESS = 300 kWh).
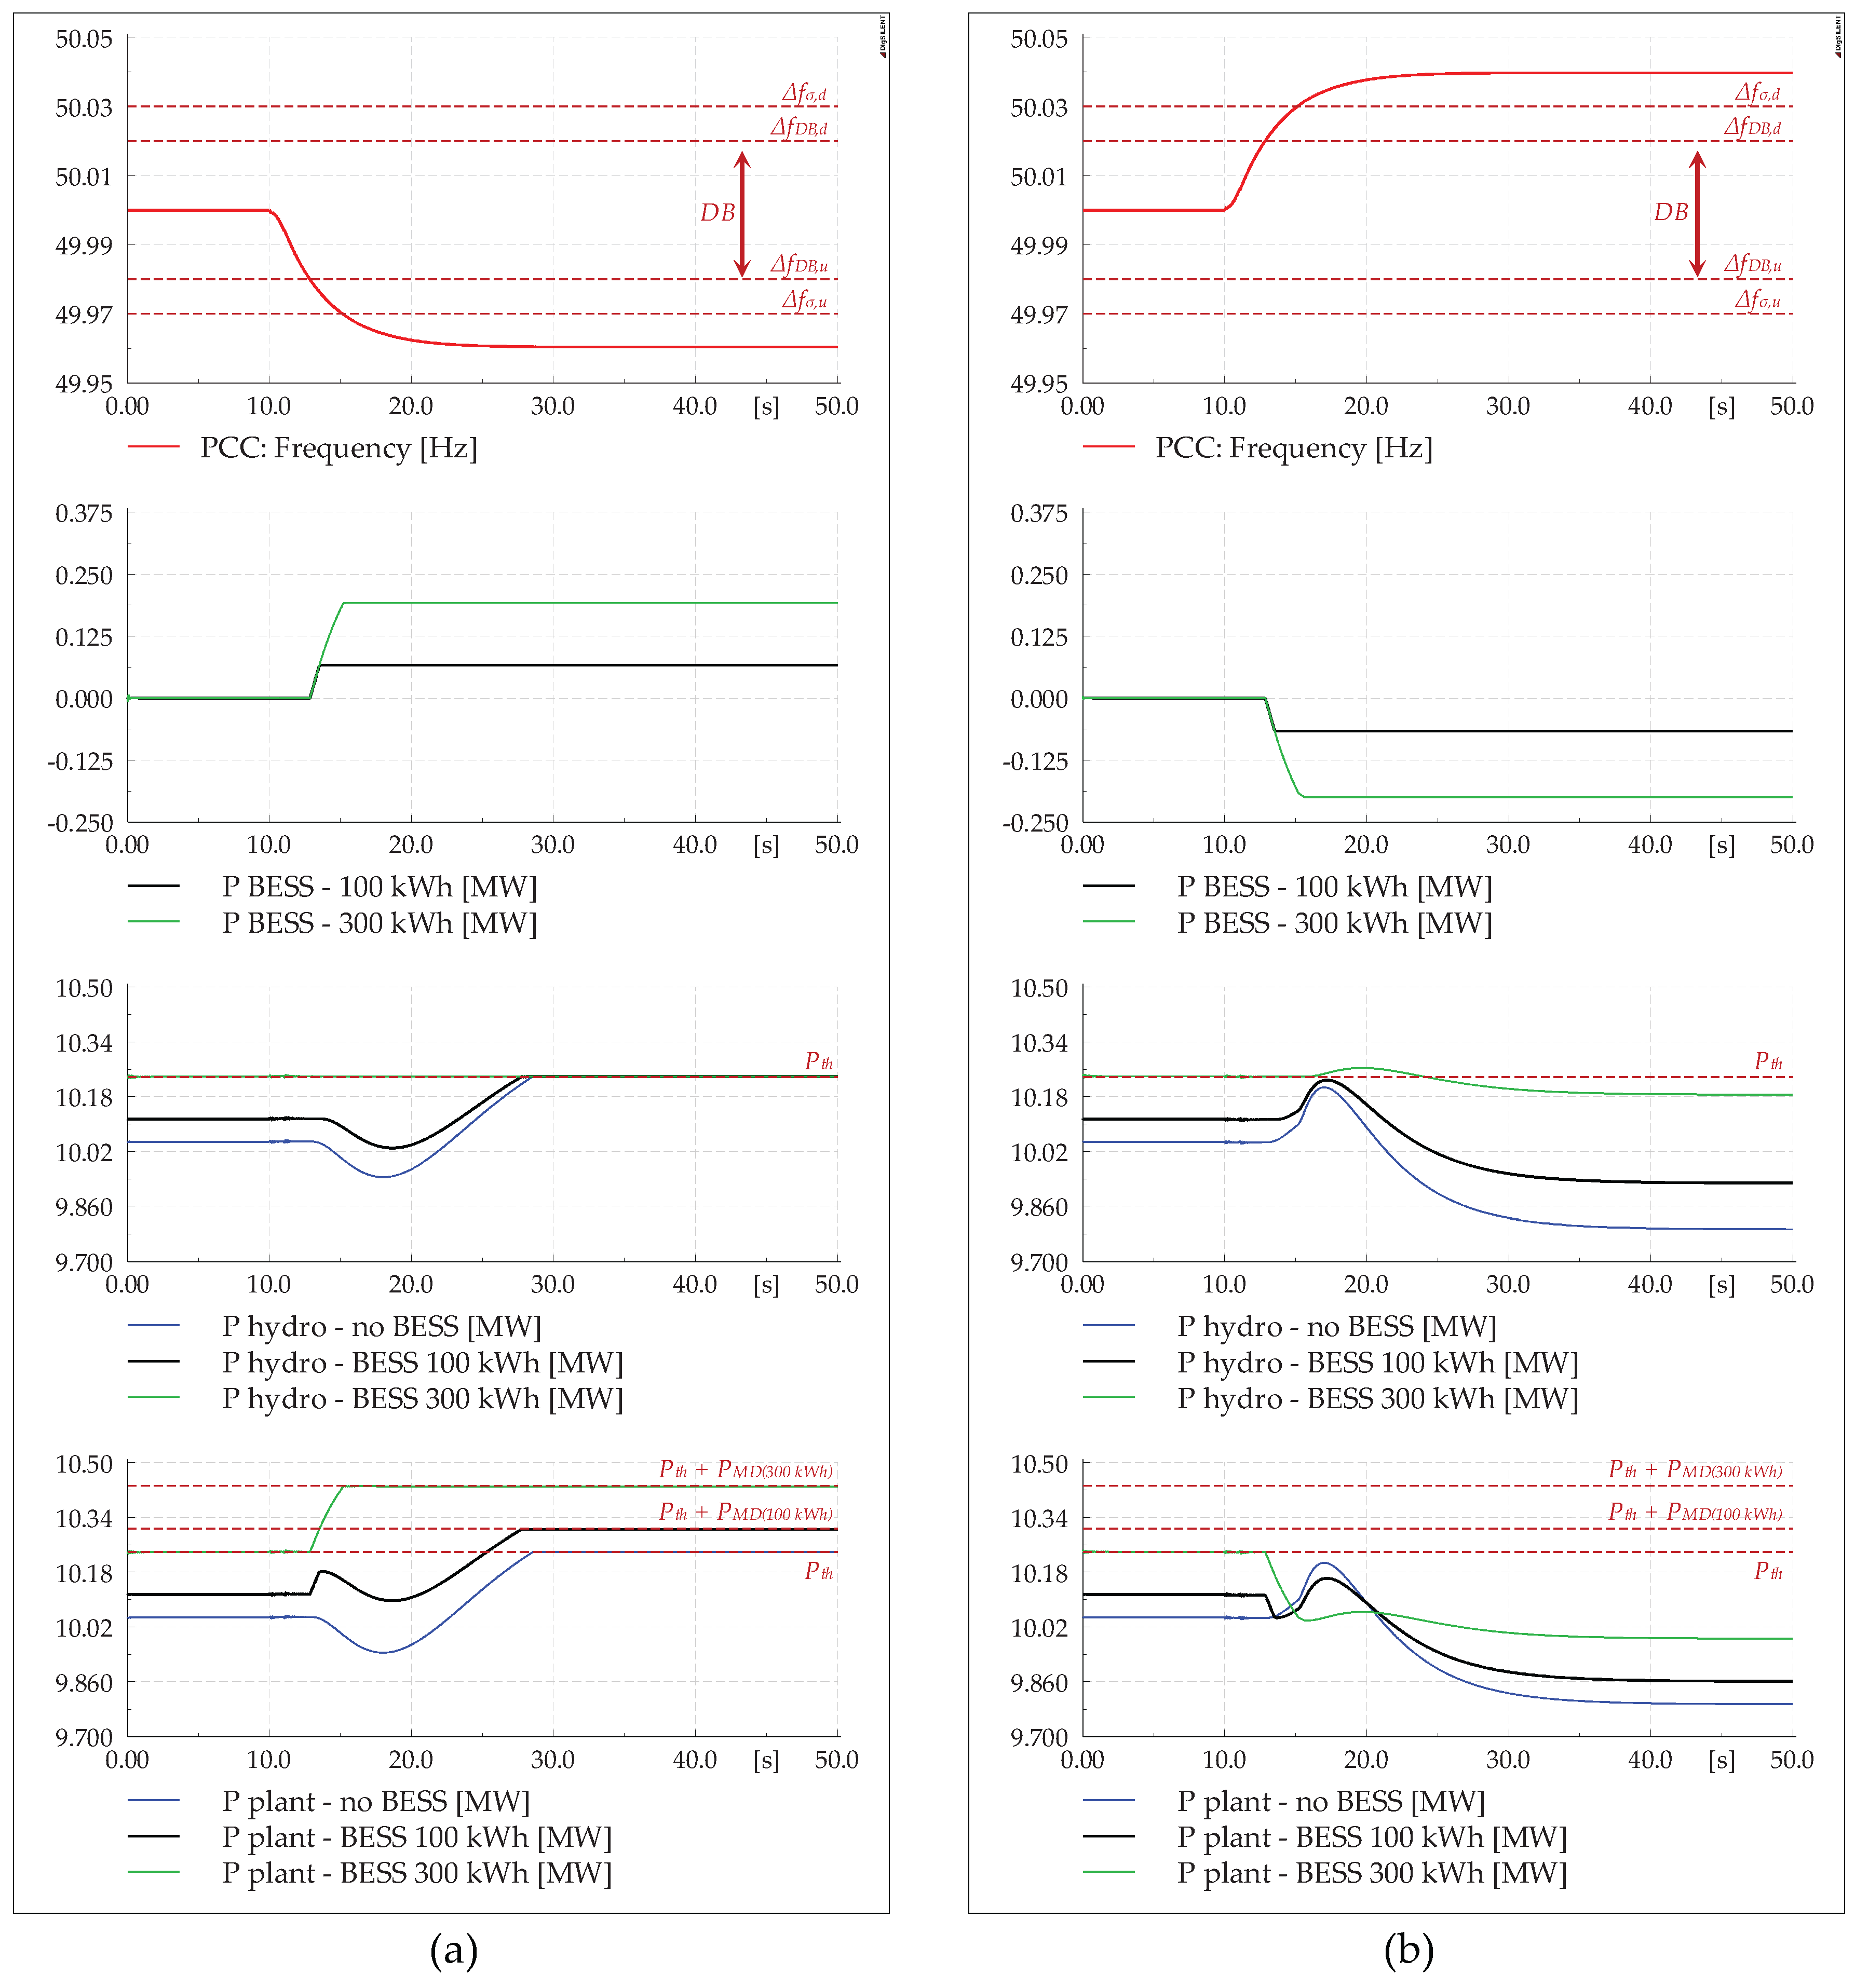
In
Figure 12a, at
t = 10 s, the load connected to the HV busbar increases by 40 MW in 1 s (ramp variation), resulting in severe system under-frequency (first plot). The frequency perturbation overpasses both the dead-band limit Δ
fDB,u (2.84 s after the load perturbation) and the reduced droop area Δ
fσ,u (at
t = 15.15 s), so in the final steady-state condition the plant is required to supply upward reserve up to
R times its operating rated power. It is worth noting that, since only one power plant supplying PCR is considered, the frequency trend at the HV busbar does not change when varying the scenario.
In the second plot, the BESS contribution is reported to give evidence of the storage size impact. The black line refers to the economically optimal BESS size (Scenario 2), whereas the green trend represents the behaviour of the storage unit in Scenario 3. Referring to Scenario 2, once the frequency exceeds the admitted dead-band, the first power contribution is supplied by the storage unit, until the BESS maximum discharging power
PMD is reached. In case the BESS is not able to supply the required upward PCR (depending on the frequency perturbation depth, black line), the hydroelectric units are called to increase their output power, as seen in the third plot of
Figure 12a. A direct comparison with a traditional hydroelectric run-of-river plant (blue line) is reported, giving evidence of how the hydraulic characteristics affect the dynamic behaviour of renewable units. In particular, immediately after the frequency variation, the water column response causes a power variation with opposite sign respective to the desired upward reserve.
In the last plot, the overall plant production trends are reported, with the same colour legend. First of all, it is worth noting that in the initial condition, when frequency is within the dead-band, the BESS allows the hybrid plant to operate closer to its renewable availability Pth (black and green lines depending on the BESS size), which means increasing the overall energy production in a long-term analysis. The RES power output in steady-state conditions is increased the least between PMD and PRu (in Scenario 2 PMD < PRu; the opposite is true for Scenario 3).
The significant contribution of the BESS in terms of system stability clearly appears by comparing the hybrid plant trends with a traditional hydroelectric configuration (blue line). A large-scale BESS supplies all the required PCR in a very short time (in accordance with the frequency time evolution) and without power oscillations. A reduced size storage unit is still able to improve the hybrid plant response by compensating for the initial hydraulic behaviour immediately after the frequency perturbation, when the PCR is more critical for the system stability since a fast response directly reduces the frequency variation width.
Similar conclusions can be drawn analysing an over-frequency perturbation. In
Figure 12b, a 40 MW ramp decrease of the HV equivalent load is introduced at
t = 10 s (ramp duration equal to 1 s). The initial behaviour of the plant is similar to the previous case. However, since the present standards impose no limitations on the downward reserve contribution, even if the storage system is sized to completely provide the upward reserve, in all the scenarios the hydroelectric section of the hybrid plant could be asked to modulate its output power in case the PCR contribution exceeds the BESS maximum charging power
PMC. It is possible to observe how, during the transient phase in Scenario 3, modulating the hydroelectric output by reducing the water flow results in an overall hydroelectric generation temporarily higher than
Pth, which represents the hydraulic availability only in steady-state conditions.
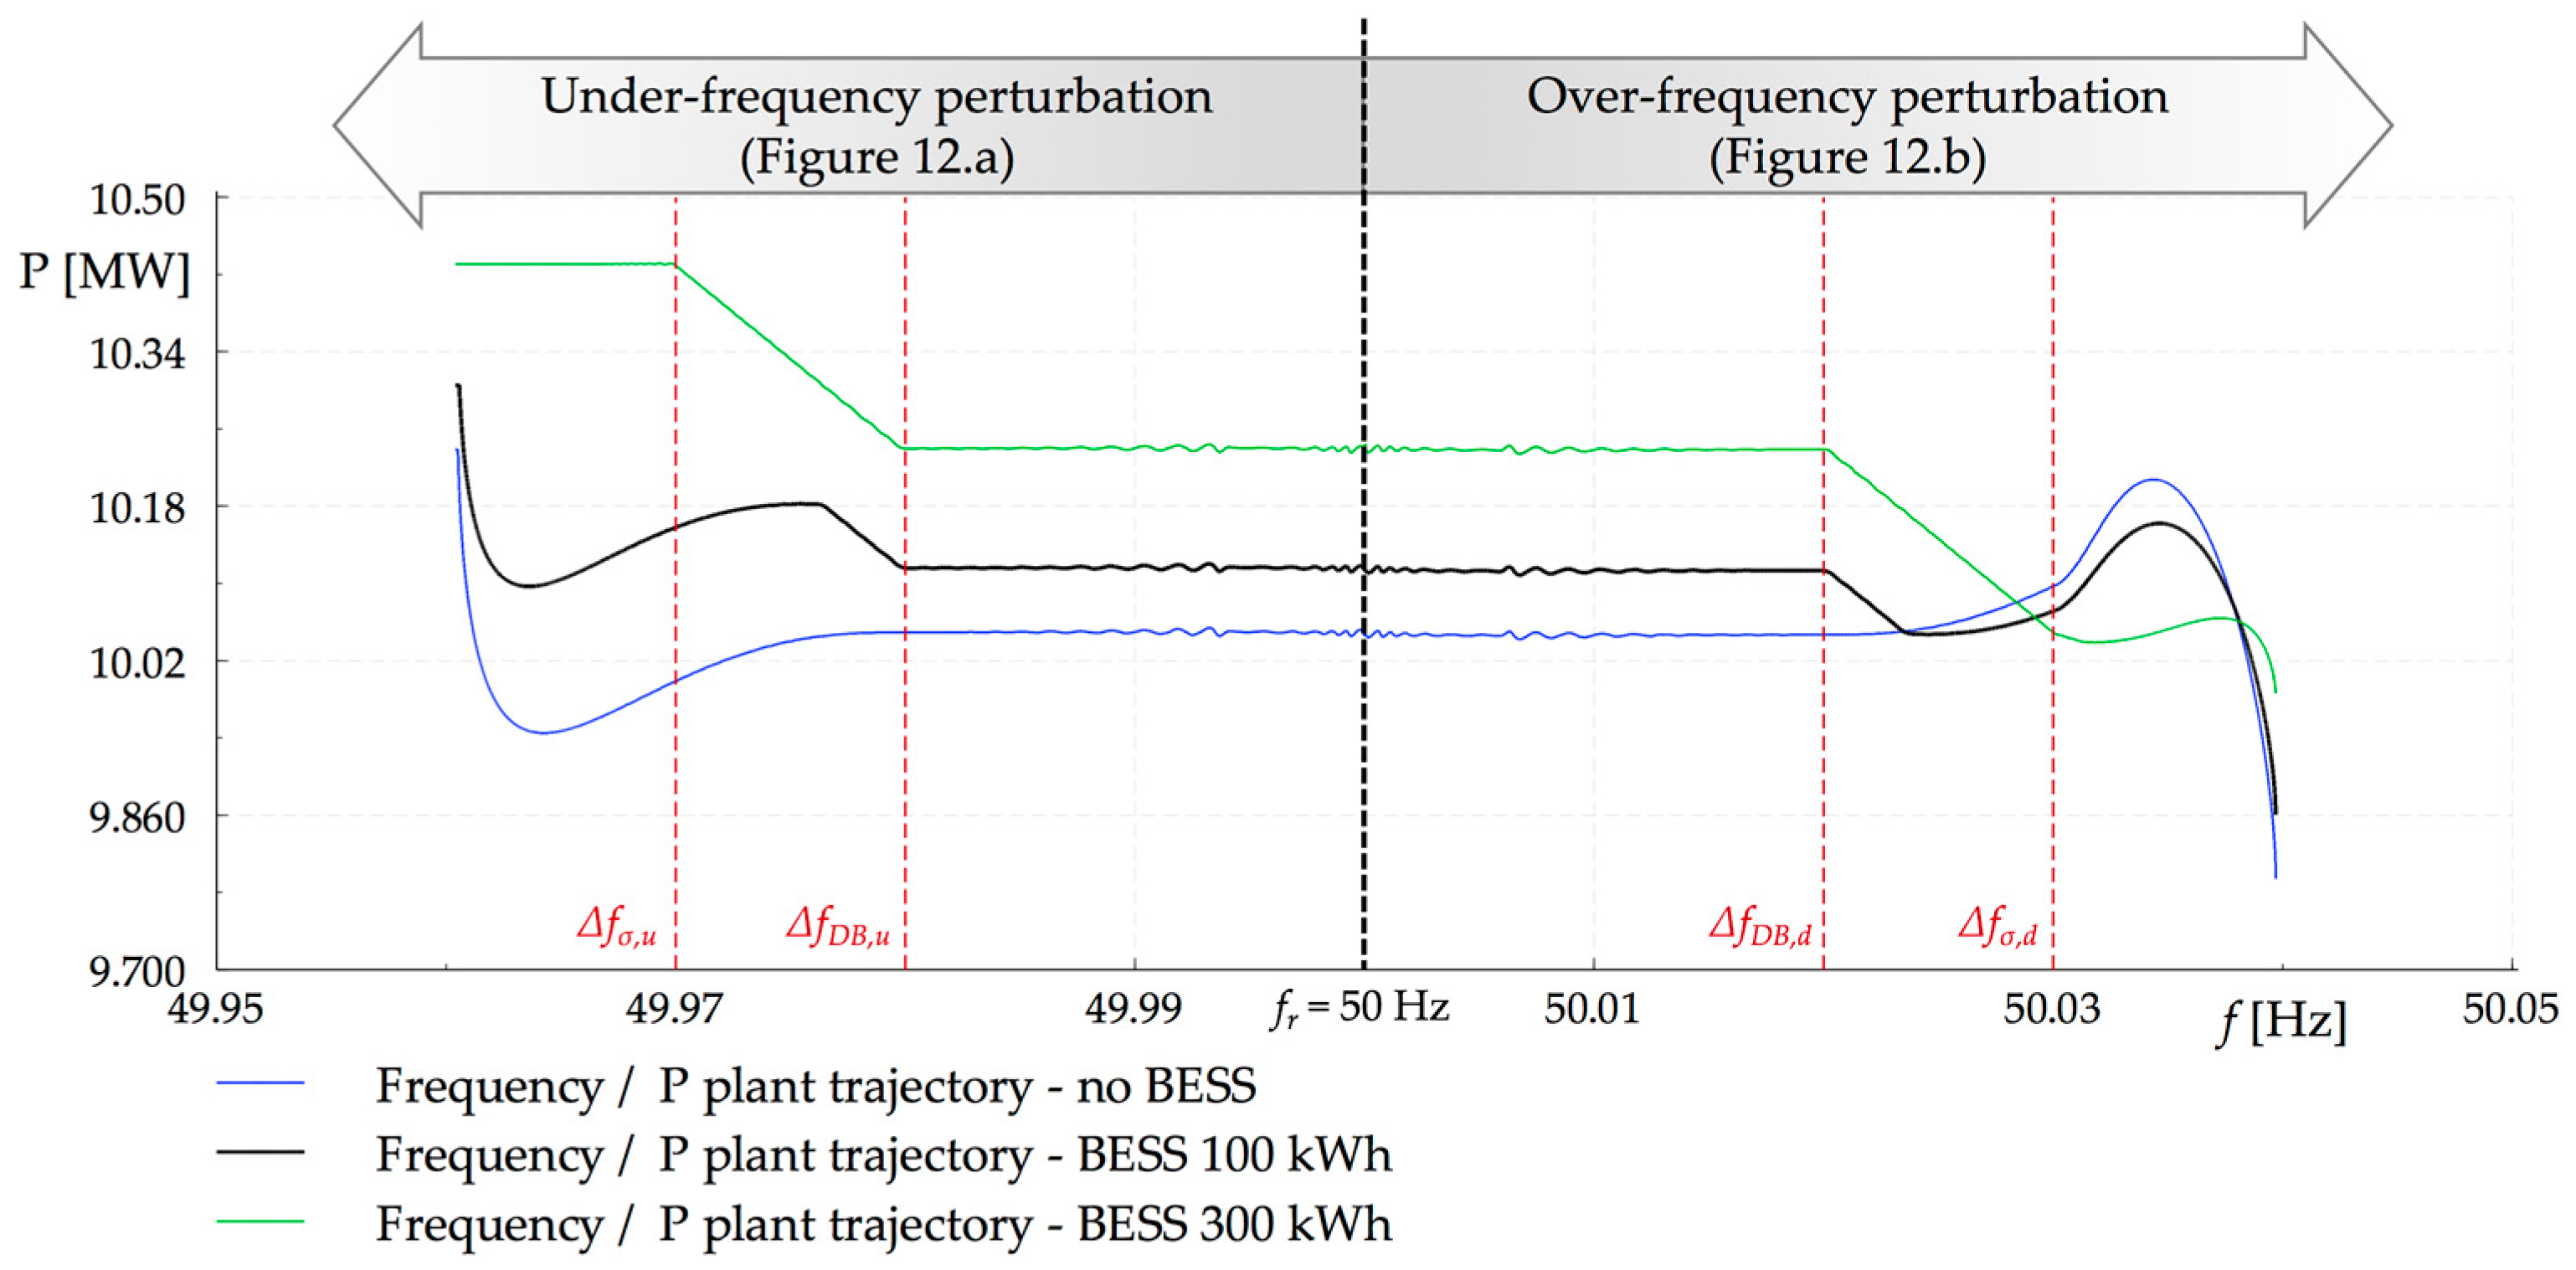
Finally, the BESS regulating action perfectly follows the frequency perturbation trend, whereas requiring reserve power to the hydroelectric units causes output power slow fluctuations depending on the hydraulic inertia. This can be distinctly appreciated by reporting the dynamic simulations of
Figure 12 in the frequency/power plane (
Figure 13) and comparing the obtained trends with the desired one defined by grid codes (
Figure 2). Simulations of
Figure 12a are reported on the left-hand side of
Figure 13, whereas on the right-hand side the over-frequency perturbation is shown. Power oscillations of hydroelectric units in the horizontal parts of the reported behaviours (i.e., frequency within the dead-band) are observed immediately after the load perturbations and the consequent frequency trends.
If the upward PCR is fully supplied by the BESS (green line), the system behaves perfectly as required in case of under-frequency, without significant delay. A slower response is observed in case of large over-frequency, which means the hybrid generation plant needs to partially use its hydroelectric section to supply all the downward reserve. By contrast, the dynamic response of the traditional hydroelectric plant (blue line) dramatically departs from the desired trend on the occasion of either positive or negative frequency perturbations. Consequently, the plant operating point returns to the desired trajectory after only a few seconds. Implementing the economically optimized BESS size (black line), the generating plant behaviour lies between the desired trajectory and the traditional plant evolution.
6. Conclusions
Considering the evolution of the electrical power system, in which traditional generating units tend to be replaced by renewables with consequent reduction of the available reserve power, this paper discusses the possible extension of the frequency regulation ancillary service to run-of-river hydroelectric plants. In the proposed solution, this can be done by either acting on the hydraulic units or integrating the plant with a Lithium-ion battery storage system.
A technical-economic analysis demonstrates how installing a storage unit partially supplying PCR in a real run-of-river plant could prove to be very interesting in terms of investment profitability. Even including the installation costs, in any case decreasing in recent years, the BESS integration shows high IRR since it allows the traditional plant to operate at higher power, closer to the hydraulic availability. This enables an increased production of the plant and, generally, a better exploitation of the renewable source.
Furthermore, the advantages of supplying reserve power by means of a storage unit have been investigated through dynamic simulations in DIgSILENT PowerFactory environment. Results demonstrate that a storage unit allows a faster and more accurate active power response to frequency perturbations, whereas traditional hydroelectric units are heavily affected by the overall system inertia. In particular, if the hydroelectric units supply the required reserve, the plant operating point corresponds to the required regulating trajectory only in steady-state conditions, so the stability contribution during the transient phase is limited, particularly in the case of under-frequency. However, if the BESS size is able to cover the required reserve according to the frequency perturbation depth, the system trajectory in the frequency/power plane perfectly matches the regulation curve defined by the current standards during all the simulated time duration, maximizing the primary reserve effectiveness and increasing the system stability.


