1. Introduction
The use of high-performance wood adhesives has currently become essential for the production of high-demand applications, such as timber construction including GLT (Glue-laminated timber) and CLT (Cross Laminated Timber). Material properties, also on the microscale, are of great importance to improve the performance of the single constituents and the interaction in the interface regions of the composites.
Hänsel et al. (2021) summarized and discussed the current state of the art factors influencing the gluing quality of solid wood products in timber construction. The gluing of hardwood species receives special focus, as it is considered by the industry to be the most challenging process for implementation. The gluing effect is influenced by the wood, surface quality, glue, glulam structure and gluing technology. It is important in the wood selection process to consider the properties of the species, such as the grain and ring angle, density, strength, moisture behavior, chemical composition, but also wood modifications (e.g., thermal, chemical and densification). The vast majority of GLT is made of softwood, although the amount of hardwood products has been increasing recently. Hardwood, such as beech (
Fagus sp.), ash (
Fraxinus sp.), or birch (
Betula sp.) are used separately or in combination with softwood species. The growing popularity of these species is hampered by the difficulty of gluing and the price of the components. Another important aspect is choosing an appropriate adhesive. The choice of adhesive type, bond line thickness, sorption and mechanical properties, adhesion to wood and aging behavior are very important. In particular, by the use of load-bearing elements, it is worth paying attention to the lamella thickness, the selection of species with the desired properties, dimensions and surface coating. Ultimately, the method of preparation, pressing conditions and the application of adhesive play an important role in the quality of adhesive bonding [
1,
2].
Timber construction needs to fulfill very strict requirements regarding strength, resistance to moisture and to elevated temperatures. There have been many attempts to improve these parameters with 1C-PUR (one-component polyurethane) adhesives by adding fillers (organic and inorganic) and varying the prepolymers. It has been proven that urea hard segments always have a positive effect on the thermal stability and that the adhesive indentation hardness and Young’s modulus have a direct impact on the WFP (wood failure percentage). Through the addition of filler materials, the thermal stability of the adhesives has been significantly increased. Research confirms that the mechanical properties of the 1C-PUR adhesives are significantly affected by their prepolymer composition [
3].
Sebenik and Krajnc (2007) and Chattopadhyay and Webster (2009) concluded that the NCO (Isocyanate)/OH ratio and the molar mass are important factors determining the structure properties of PUR. These properties can be measured by various methods. FTIR-ATR spectroscopy and strength tests were used in the mentioned publications. It was pointed out that these parameters are very important in formulating the desired adhesive [
4,
5,
6].
Furthermore, it is reported that a higher proportion of the still reactive, free NCO groups, a lower degree of resin polymerization and a slower reaction rate are the dominant factors for the high thermal stability (Richter et al., 2006), whereas beyond a critical free NCO content, the high stiffness of the adhesive is responsible for a decrease in the adhesion strength, These are other examples of how complicated the process is to choose the right adhesive parameters [
5,
6,
7,
8].
Clauss (2011) concluded that the polyisocyanate component is mostly responsible for the properties (elasticity, cohesion and strength) of the finished product. As a part of this research, the isocyanate (NCO) content, the crosslink density, the urethane group content and the ethylene oxide/propylene oxide ratio were varied. The author highlights the importance of the subsequent formulation (catalyst, filler, plasticizer, etc.) on the quality of the bond [
9].
In formulating the composition of the additives that are often added in addition to the main ingredient additives, these can improve the properties. For example colorants (such as dyes or pigments), plasticizers (increase flexibility), and fillers. The adhesive formulation by means of additives, moreover, does not affect the mechanical properties, but is responsible for the bonding performance [
10,
11].
Mendoza et al. (2012) used a combined experimental–numerical modal analysis technique for determining the effective mechanical bond line properties. The numerical model analysis is relatively accurate, the difference between the respective experimental and numerical eigenmodes is less than 2.25%. This method can be used to estimate the hardness, modulus of elasticity (MOE), density of the wood and adhesive layer, and to predict the penetration of adhesives into hardwood [
12]. The model was applied to beech samples joined with three different types of adhesives (PUR, UF, PVAc) under various growth ring angles, as described by Hass et al. (2010). Analyzing the results using an appropriate statistical method is crucial to interpreting the obtained results [
13].
Plötze et al. (2011) determined the densities and the porosity parameters on domestic and overseas soft- and hardwoods with the application of pycnometric methods and mercury intrusion porosimetry (MIP). The hardwoods, particularly the European diffuse-porous ones, show a higher amount of micropores, which represent the microvoids or cell wall capillaries [
14].
Furthermore the sorption behavior and the fluid intake was investigated as the technological characteristics in the industrial processes of impregnation and penetration of the coating materials or adhesives [
15].
Adhesives with different chemical bases, absorb different amounts of water. Even low amounts of water may influence the mechanical performance of the glued wood products. Wimmer et al. (2013) performed a dynamic vapor sorption analysis to assess the sorption processes of six commercial wood adhesives. The best performing adhesive, by means of strength values, was RPF, then in decreasing order: fish glue, PUR, MUF and PVAc [
16].
Furthermore, the wood strength is also moisture-dependent. Kläusler et al. (2013) noticed a decrease in strength as the moisture content increased [
17]. Studies of Hass et al. (2009) showed a significant influence of growth ring angle, adhesive system and viscosity on the shear strength of the bonded elements [
18].
A lot of methods for evaluating the quality of gluing and the parameters affecting the quality of gluing have been described above, which shows how important and timely this topic is.
1.1. Computed Tomography
The computed tomography method has been used many times to evaluate wood and the glue joints. Hass et al. (2012) investigated the penetration of adhesive and mechanical properties of adhesive bond lines by means of synchrotron radiation X-ray tomographic microscopy (SRXTM) [
12].
Sanabria (2011) used limited-angle microfocus X-ray computed tomography for the glue line assessment of timber constructions. Delaminations and air gap thickness topology could be assessed for mass discontinuities larger than 150 µm between the timber lamellas. These limits did not compromise the detectability of the lamination faults for the thin glue lines of 100 to 200 µm obtained with hydraulic pressing [
19].
Leggate et al. (2021) used micro X-ray computed tomography and microscopy to assess the key PUR adhesive bond criteria. There was a considerable loss in the amount of adhesive after the wet and dry test cycles for all species. There was also an extremely high frequency of voids in the glue lines for all species, which would negatively impact the bond strength and durability [
20].
Bastani et al. (2016) examined the three-dimensional (3D) visualization of the penetration of PU adhesive into heat-treated Scots pine by X-ray micro-computed tomography. The 3D pattern obtained by XmCT of the PU adhesive flow in the radial direction of the heat-treated Scots pine, provided an understanding of the pathways this adhesive used (e.g., pits and lumens of the adjacent axial tracheids) to penetrate the wood [
21].
Jakes et al. (2019) used X-ray computed tomography (XCT) and X-ray fluorescence microscopy (XFM) to study the adhesive flow and infiltration. The model wood–adhesive bond lines were made using loblolly pine (Pinus taeda) and BrPF adhesive [
22,
23]. Furthermore, synchrotron tomography was successfully used, combined with the acoustic emission to investigate the deformation of wood under tension [
24].
As mentioned above, much research has been carried out with this method, but no one has yet attempted to evaluate the properties of the glue joint, based on the amount of gas void in the glued element.
1.2. Nanoindentation
The first determinations of the material properties of the adhesives by means of nanoindentation (NI) were recently described by Stöckel, Konnerth and Bockel [
25,
26,
27,
28,
29]. Stöckel (2013) summarized and discussed the state of the art mechanical properties of pure wood adhesives. He stated that wood adhesives show a large variability of mechanical properties in the cured state. The modulus of elasticity determined by different methods covers a wide range from 0.1 GPa up to 15 GPa. The results are highly influenced by the adhesive formulation and the ambient conditions, but also by the sample preparation and by the testing method used. Modulus values of the cured wood adhesives are highest for amino resin adhesives, compared to phenolic adhesives. Adhesives based on isocyanates (polyurethanes, emulsion polyisocyanates and pMDI), epoxy resins and poly vinyl acetate adhesives represent the lower end of the range. Moisture typically causes a softening of the adhesives, whereby the phenolics and the structural amino resin show the highest susceptibility. Increased temperature typically reduces stiffness in a temperature range between 20 °C and 70 °C, in the case of polyvinyl acetate, polyurethanes, and epoxies, whereas other adhesives are less affected (e.g., condensation resins) [
26].
Recently, Bockel et al. (2020) analyzed the properties of wood adhesive bonding, by means of nanoindentation, and compared it to the classical lap-shear strength. Research shows that both wood and RPF adhesive show a much lower hardness when wet. PUR adhesive does not show such a relationship [
29]. The literature values for the hardness of the adhesives cover a wide range [
26].
Herzele et al. (2020) investigated the impact of different chemically composed fibers on the adhesion behavior between adherend and adhesive. The less polar surface seems to be favorable for 1C-PUR, whereas surfaces of a higher polarity, e.g., pure cellulose surfaces, are less favorable for the 1C-PUR adhesives [
30].
Frybort et al. (2014) investigated the polarity of wood by means of an AFM adhesion force mapping. It has shown that the polarity significantly decreases with the increasing surface age and that differences in polarity between freshly cut cell walls and native inner lumen surfaces correlate with the chemical heterogeneity, in particular the varying ratio of lignin, compared to the cell wall carbohydrates [
31].
The purpose of this study was to use commercially available methods (NI and used X-ray micro computed tomography) and find a way to evaluate the adhesive bond, possibilities of characterizing and observing the relationship for various commonly used wood adhesives. It is a comparative analysis of the indicators provided by the two assessment tools and the methodologies considered.
It is expected that, especially the PUR adhesives, due to their known foaming, will have a lot of voids in the glue joint.
The advantage of these methods over those traditionally used, is their accuracy, repeatability and lack of sample destruction. The samples are measured at the nanoscale. Thanks to the fact that the samples are not destroyed during the test (as happens, for example, during strength testing) they can be reproduced. The testing of the joints is crucial, in terms of new solutions being introduced to the market. The obtained values can help adhesive manufacturers formulate new adhesive systems.
3. Results
3.1. X-ray Micro Computed Tomography
The volume fraction of the gaps (voids) in the adhesive joints was determined. The values represent the whole tested volume.
Table 4 contains the values of the total voids volume and their proportion, in relation to the total volume of the adhesive joint.
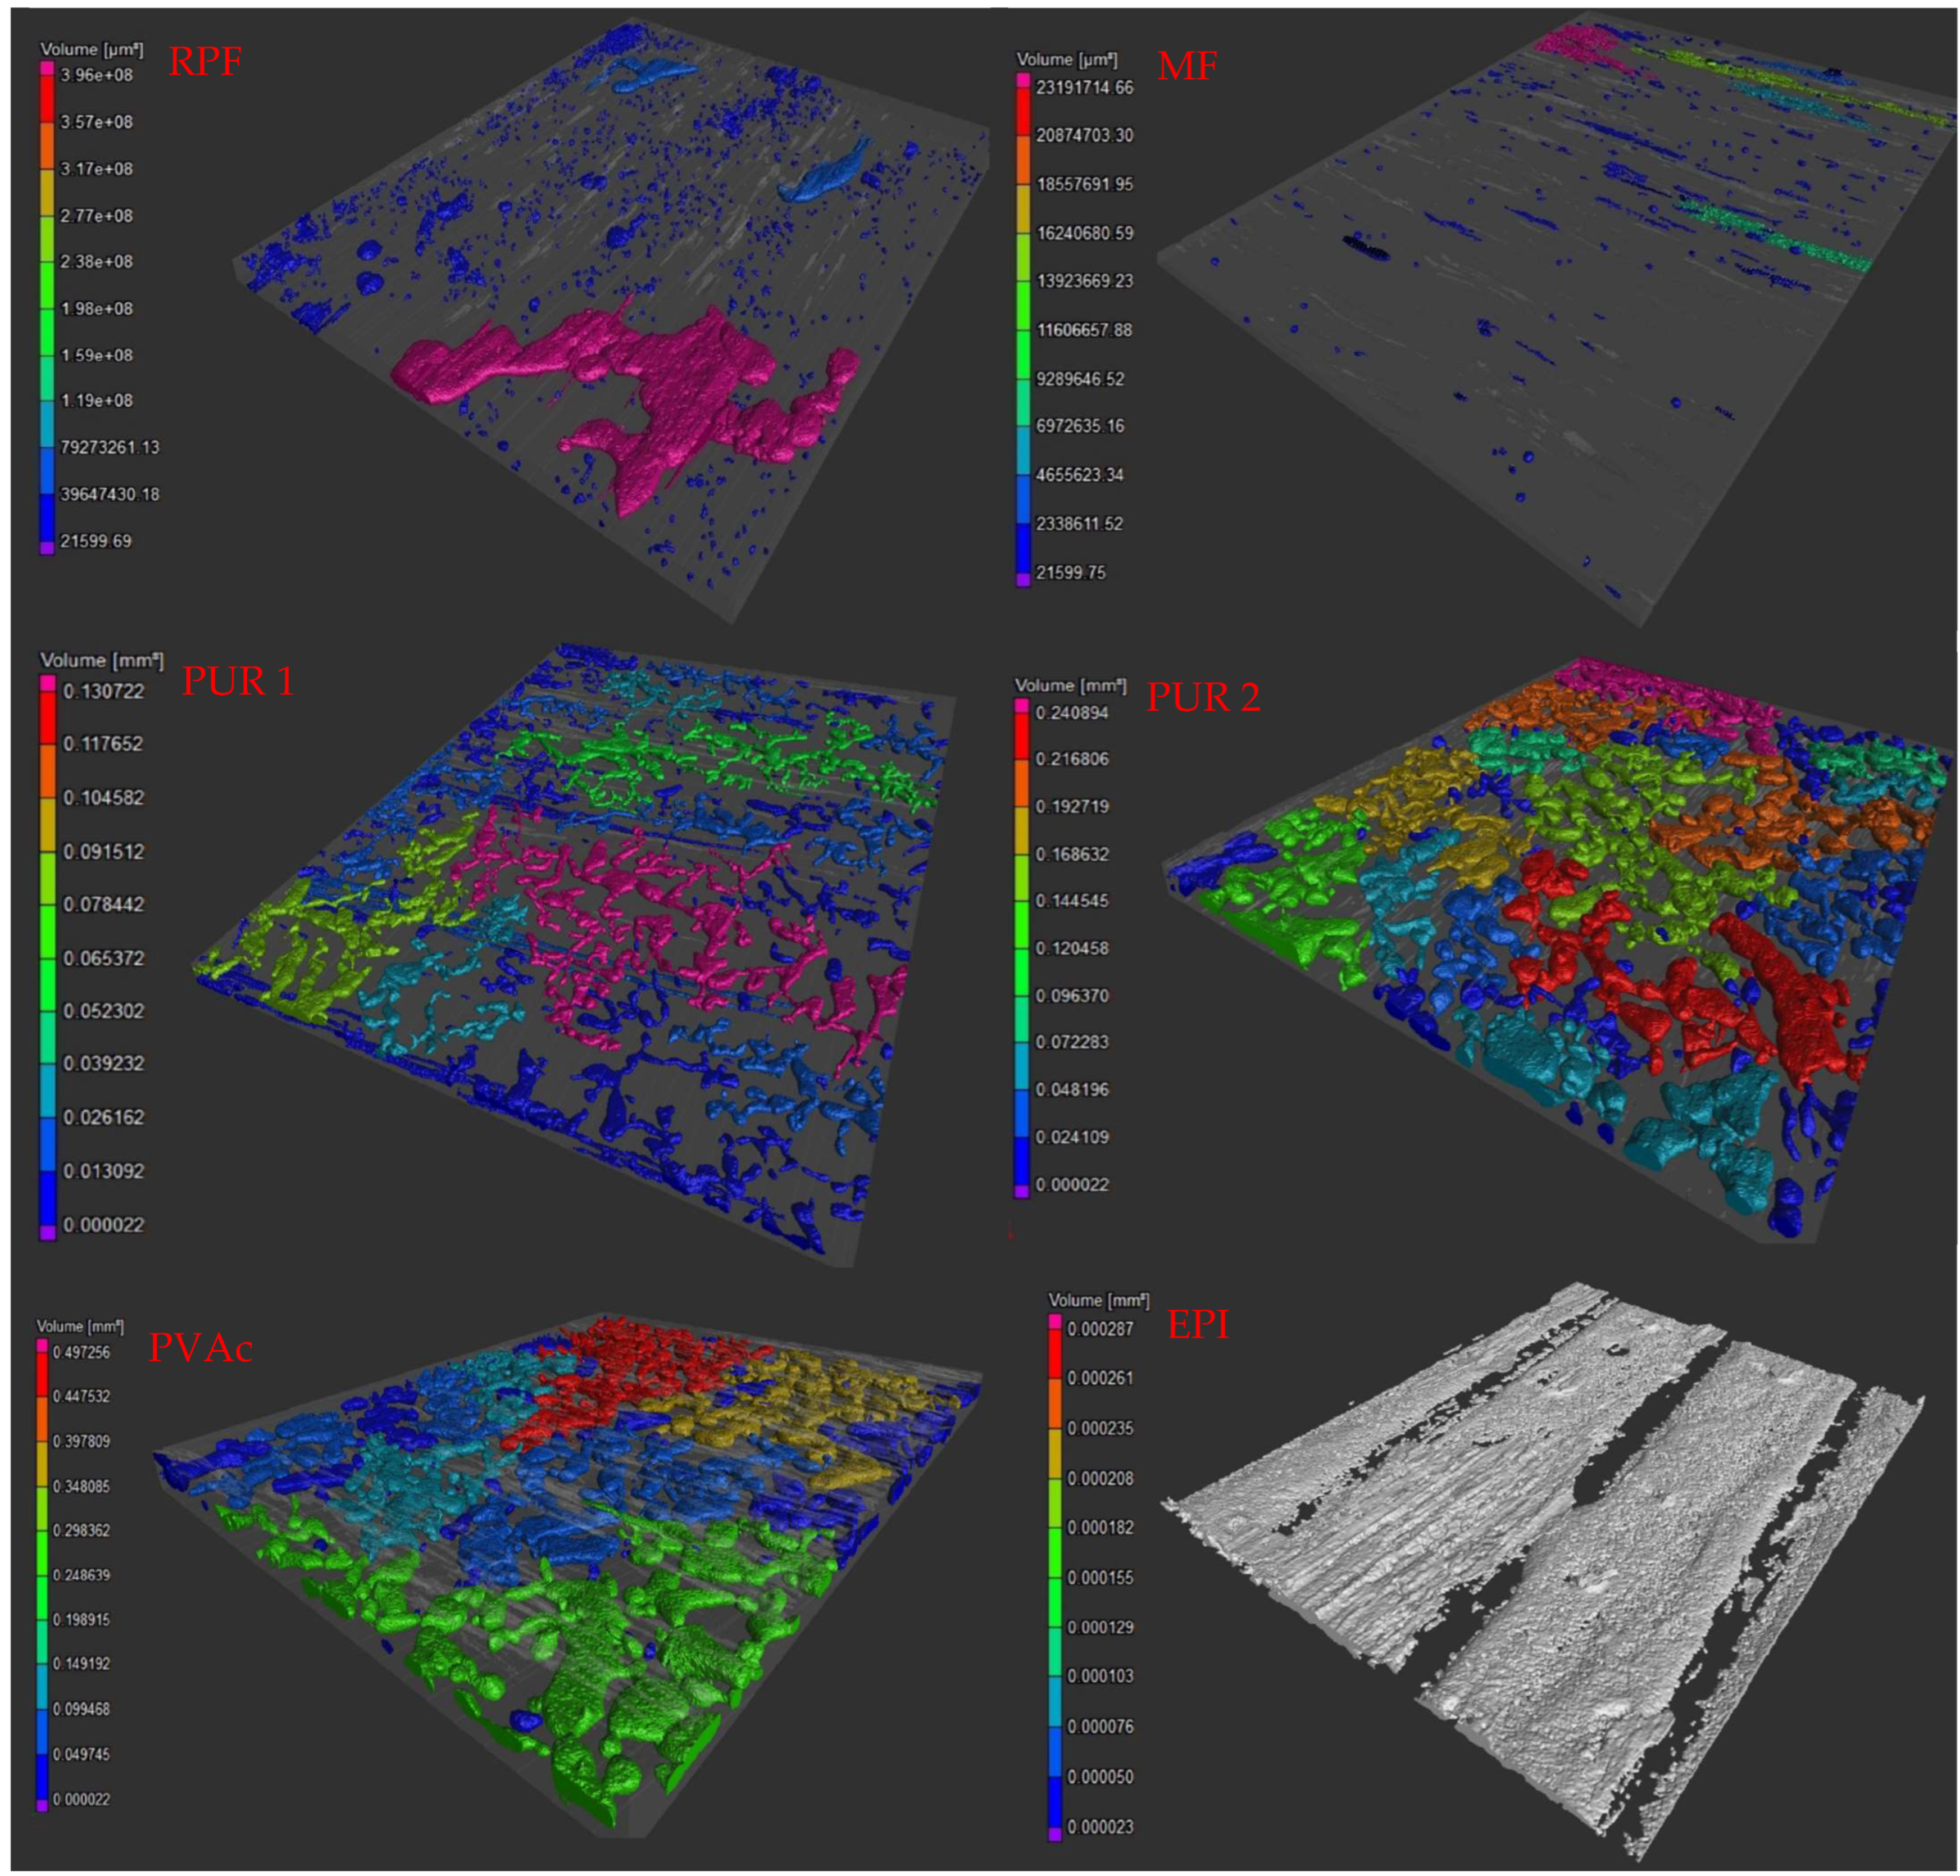
The highest gaps volume have PUR and PVAc adhesives. Then, decreasing, RPF, MF and EPI.
The voids are illustrated in
Figure 3. The adhesive covers the whole bonded area, but in the joint, there were gaps, which are displayed on the figures. The size of the gaps is determined by the use of the colors displayed. The biggest voids are pink and the smallest are blue.
The results of the thickness determination, using a digital microscope are shown in
Table 5.
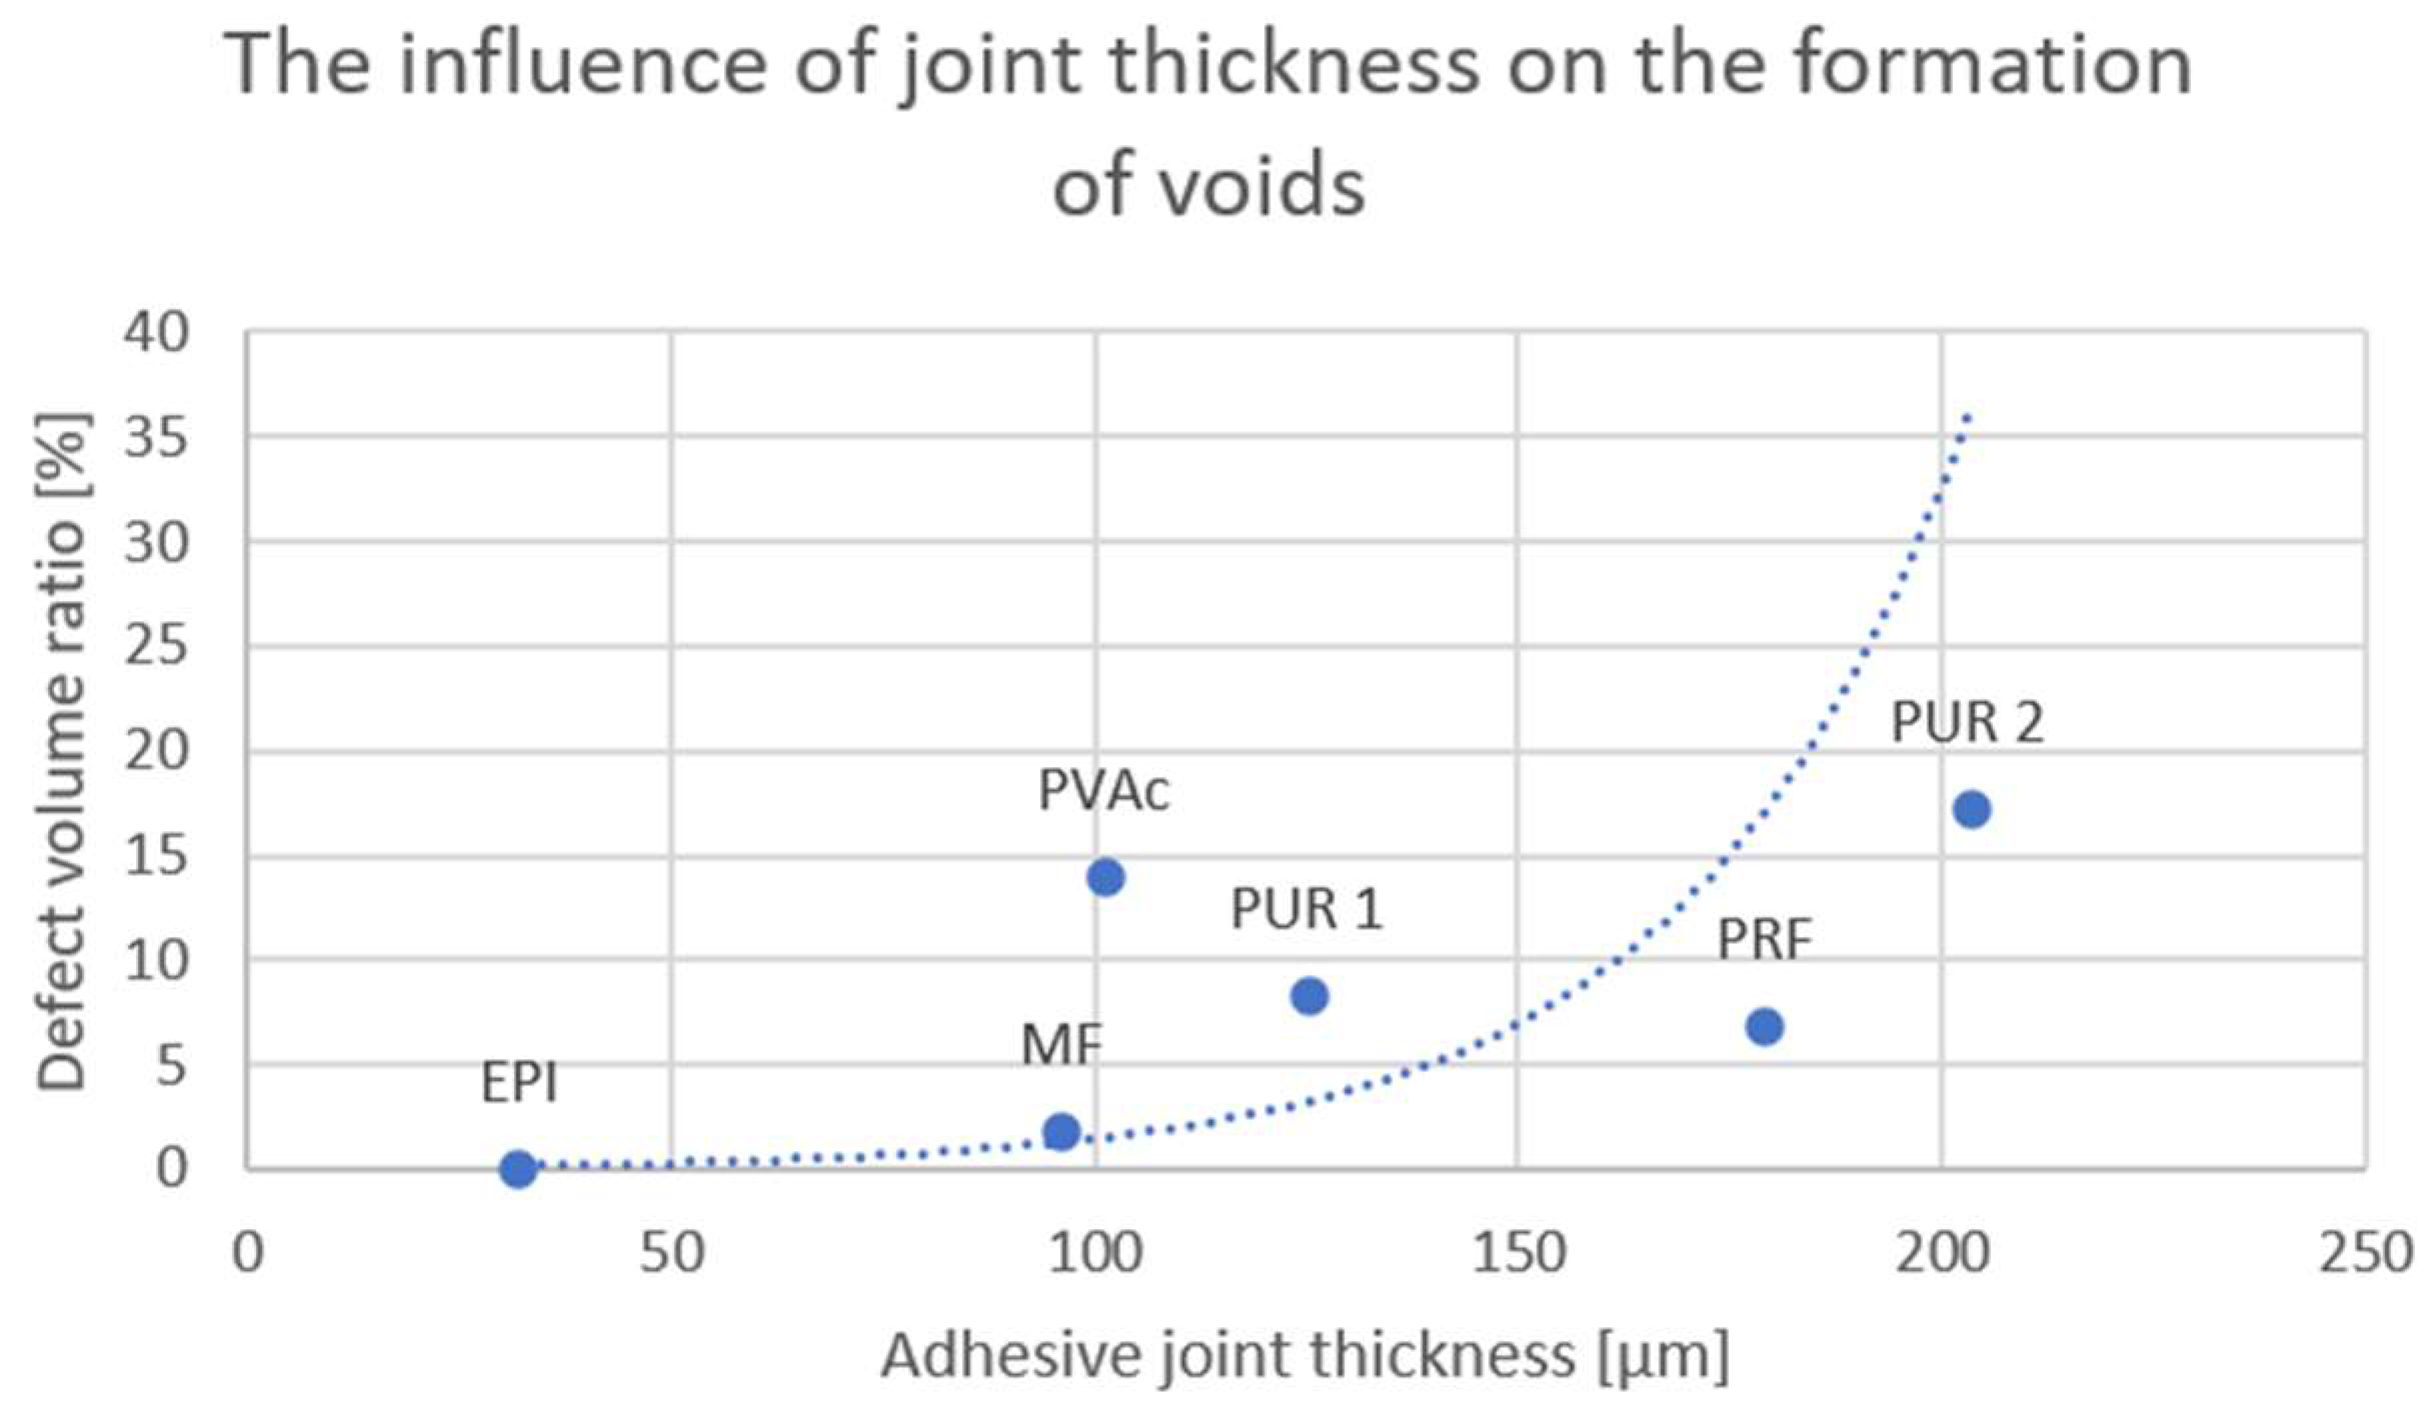
The highest adhesive joint thickness was observed by the PUR and RPF adhesives. Then, decreasing, PVAc, MF, and EPI. The voids formation depends on various bonding parameters. One of the most important is an adhesive joint thickness. It was observed that the higher adhesive joint thickness correlated with the higher defect volume ratio (voids)—
Figure 4. Adhesive joint thickness of PVAc is similar to MF, but differs in the defect volume ratio. It is probably caused by the lower solid content and the different curing method.
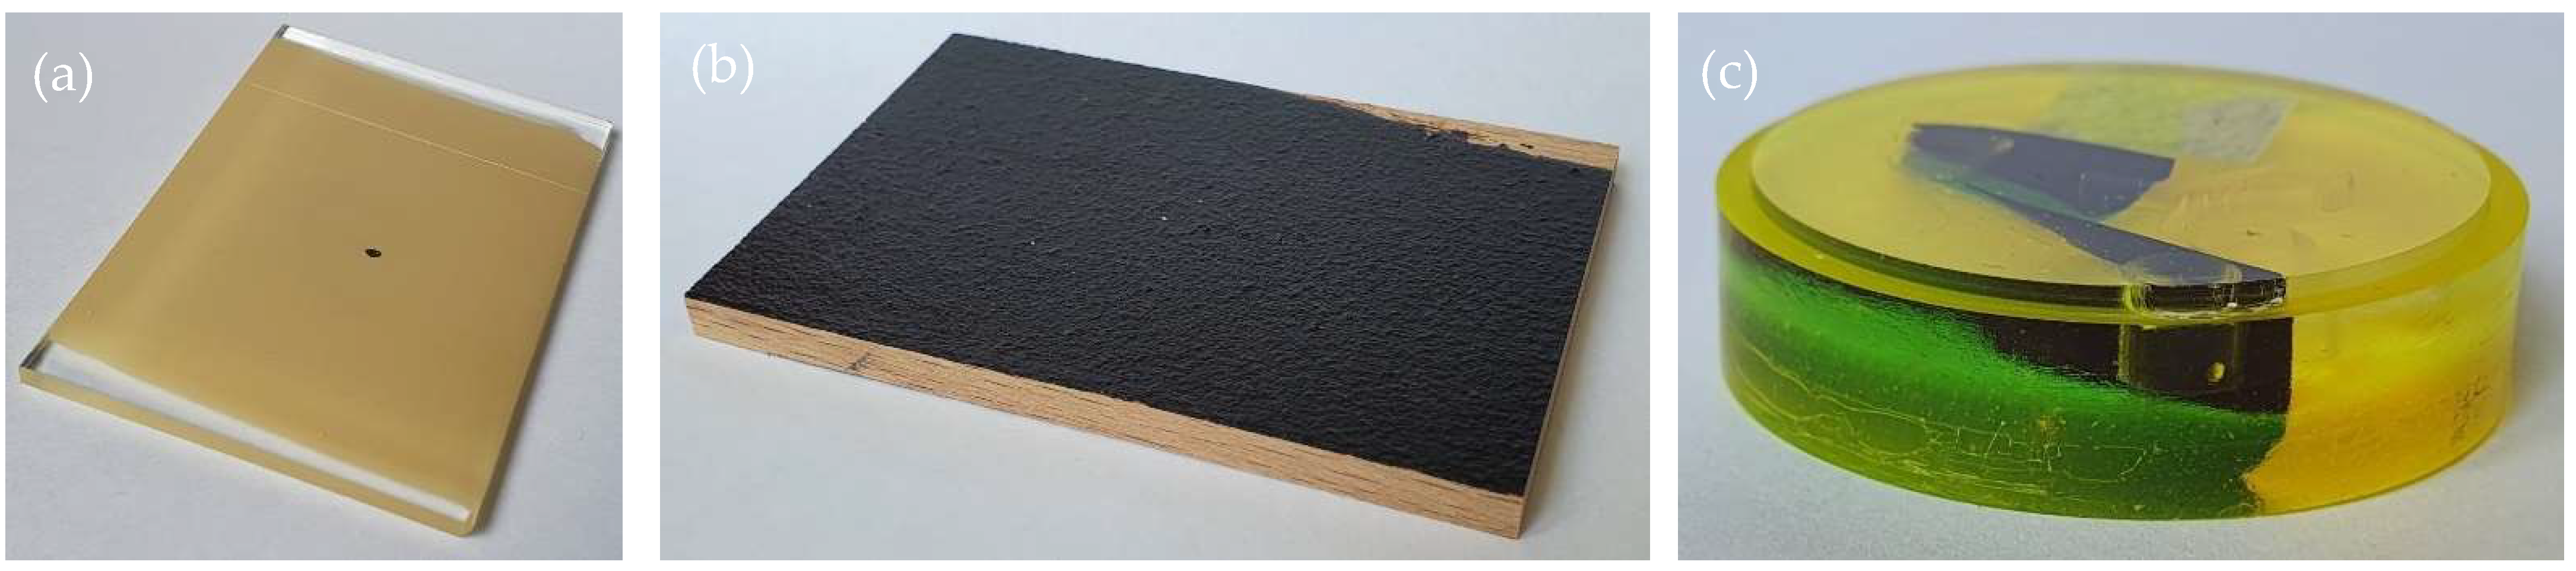
In the case of the PVAc and EPI adhesives, the reduced glue quantity was selected, based on the data sheet, as it is in industry use, in order to achieve the highest strength values.
3.2. Nanoindentation
The results of nanoindentation are shown in
Table 6 and
Table 7. Each variant was tested at 15 different points.
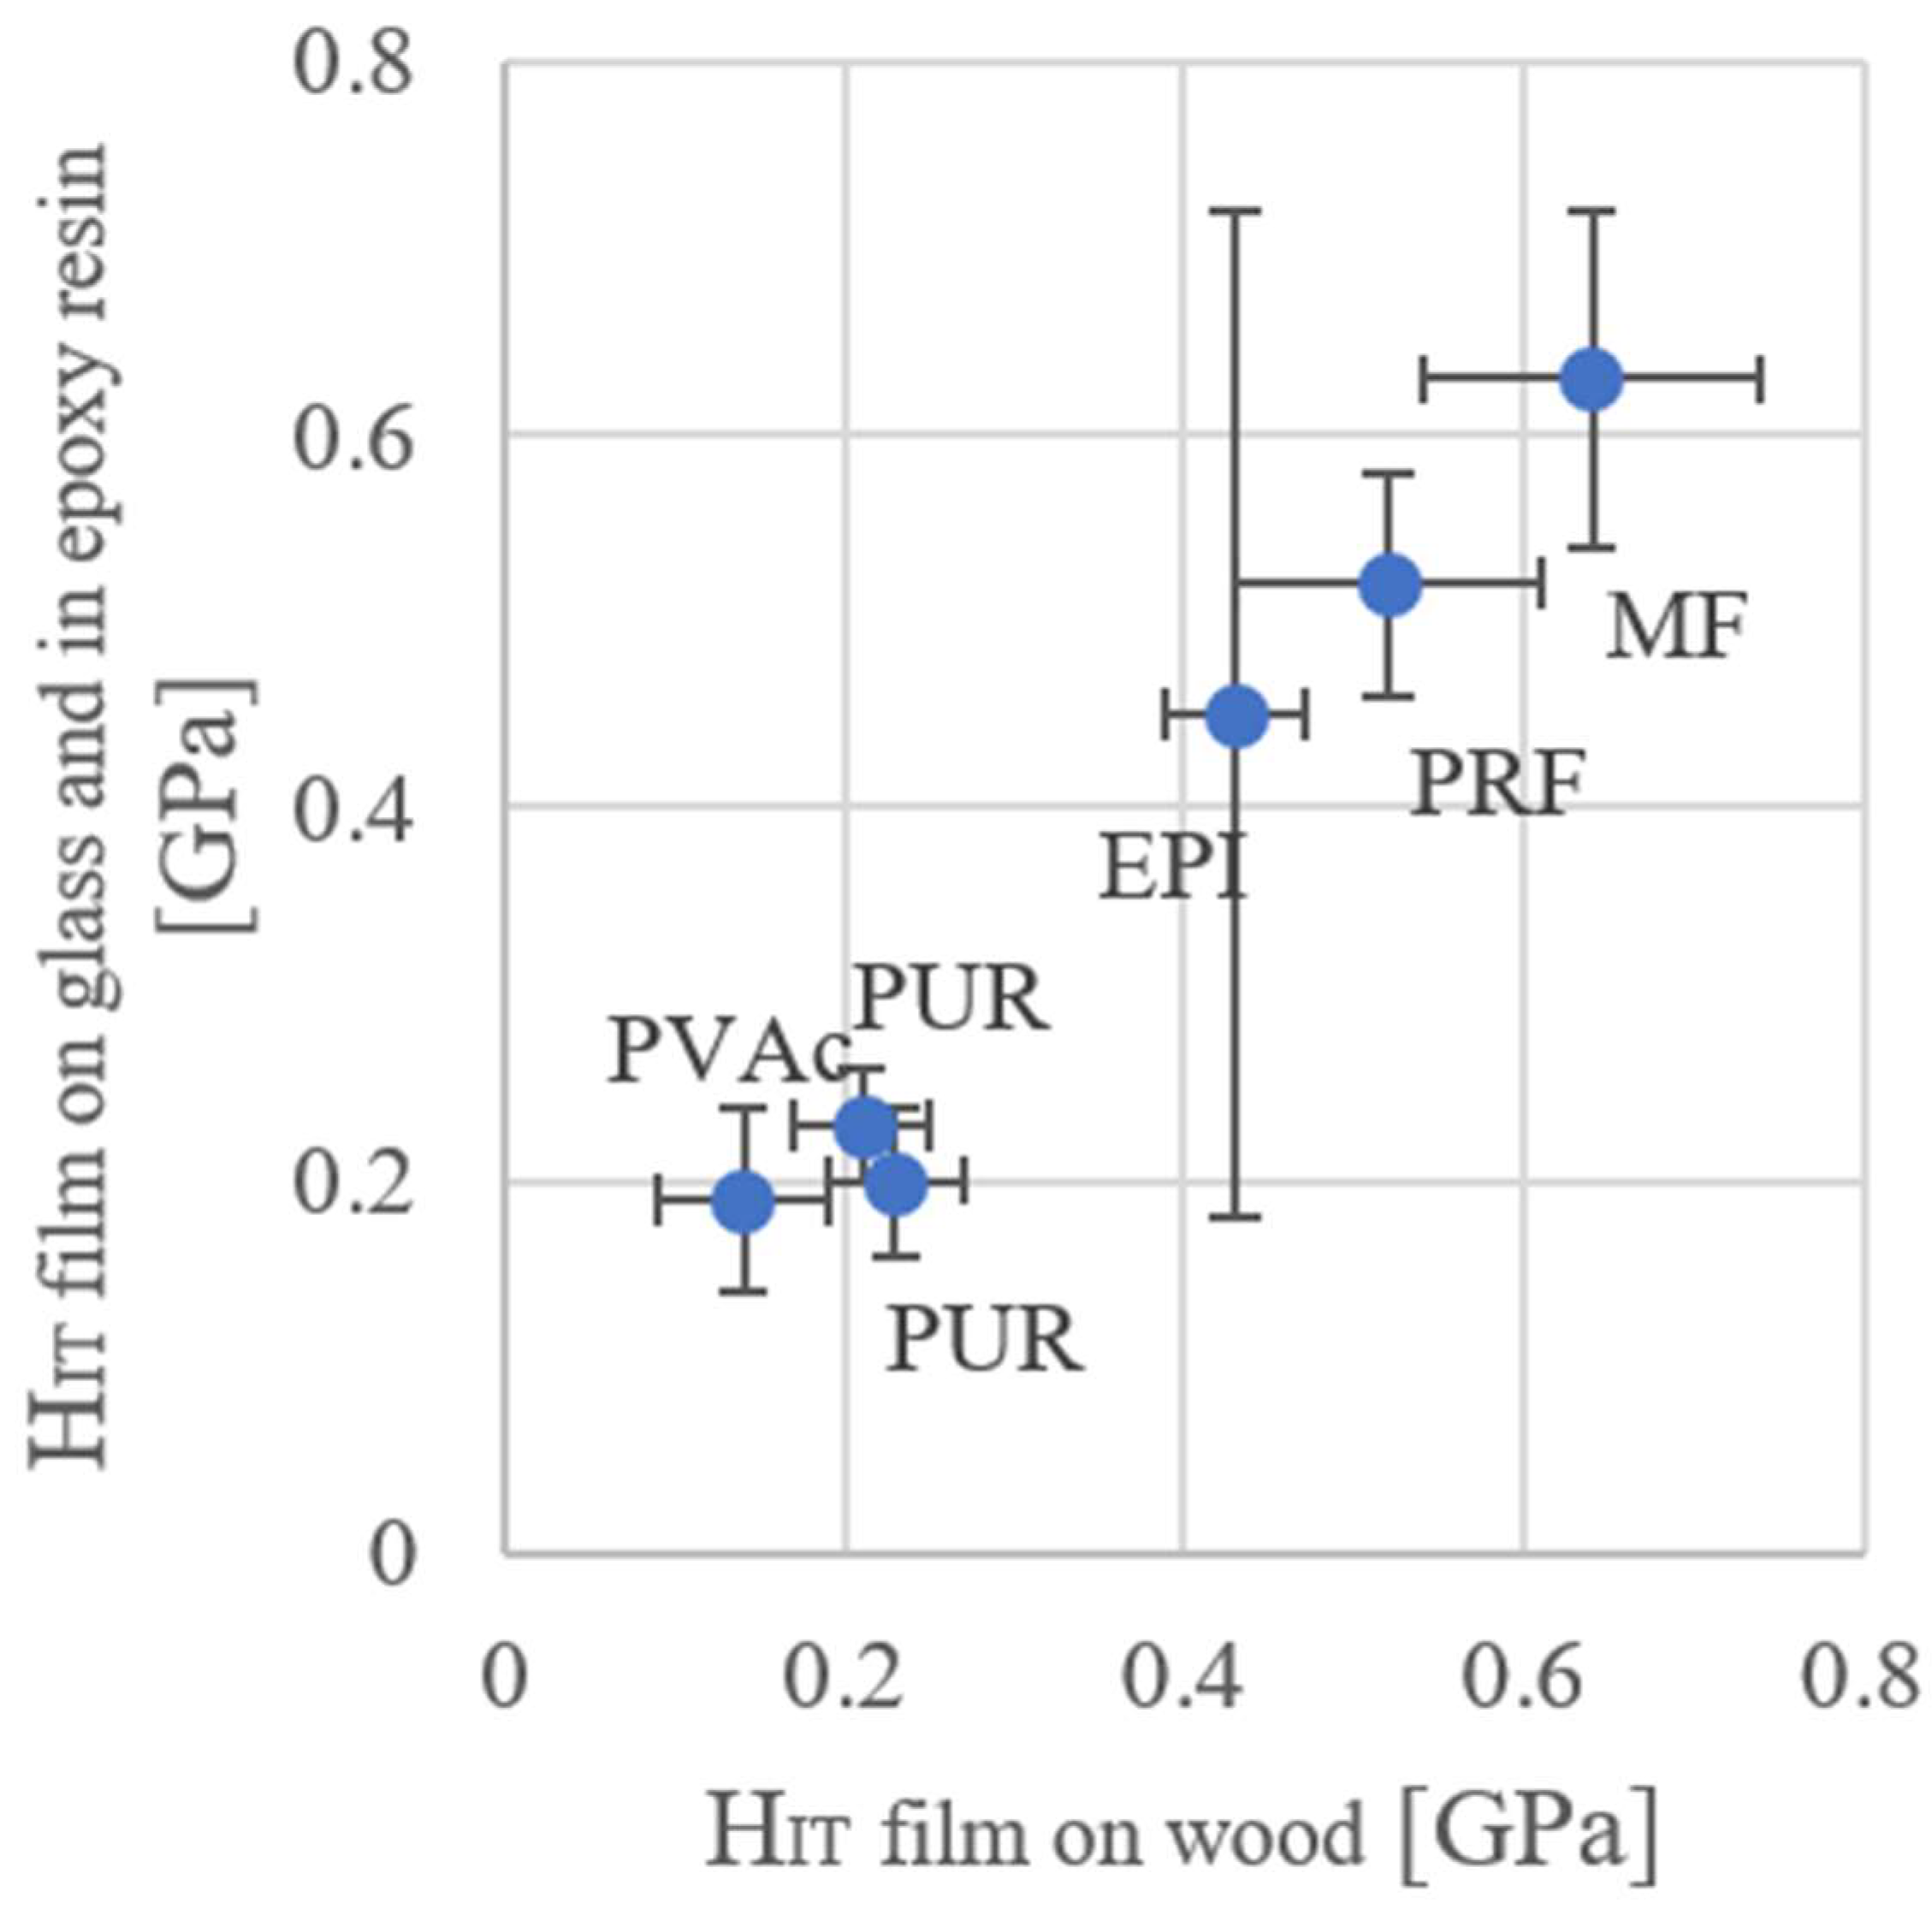
The highest values of hardness have condensation resins (RPF und MF). Then, decreasing, the EPI, PUR and PVAc adhesives.
In the investigations, two methods of measuring hardness were used and compared.
As shown in
Figure 5, the two methods correlate with each other. Only for one variant (EPI) the method (adhesive layer on glass) showed a very large spread.
The selected 1C-PUR adhesives have a relatively low modulus of elasticity and hardness. The range of variation correlate with the values of Clauss. The hardness of some PURs is much higher, that parameter depends probably on the filler content [
7].
For this reason, it is recommended to test the hardness of the adhesive applied to the wood.
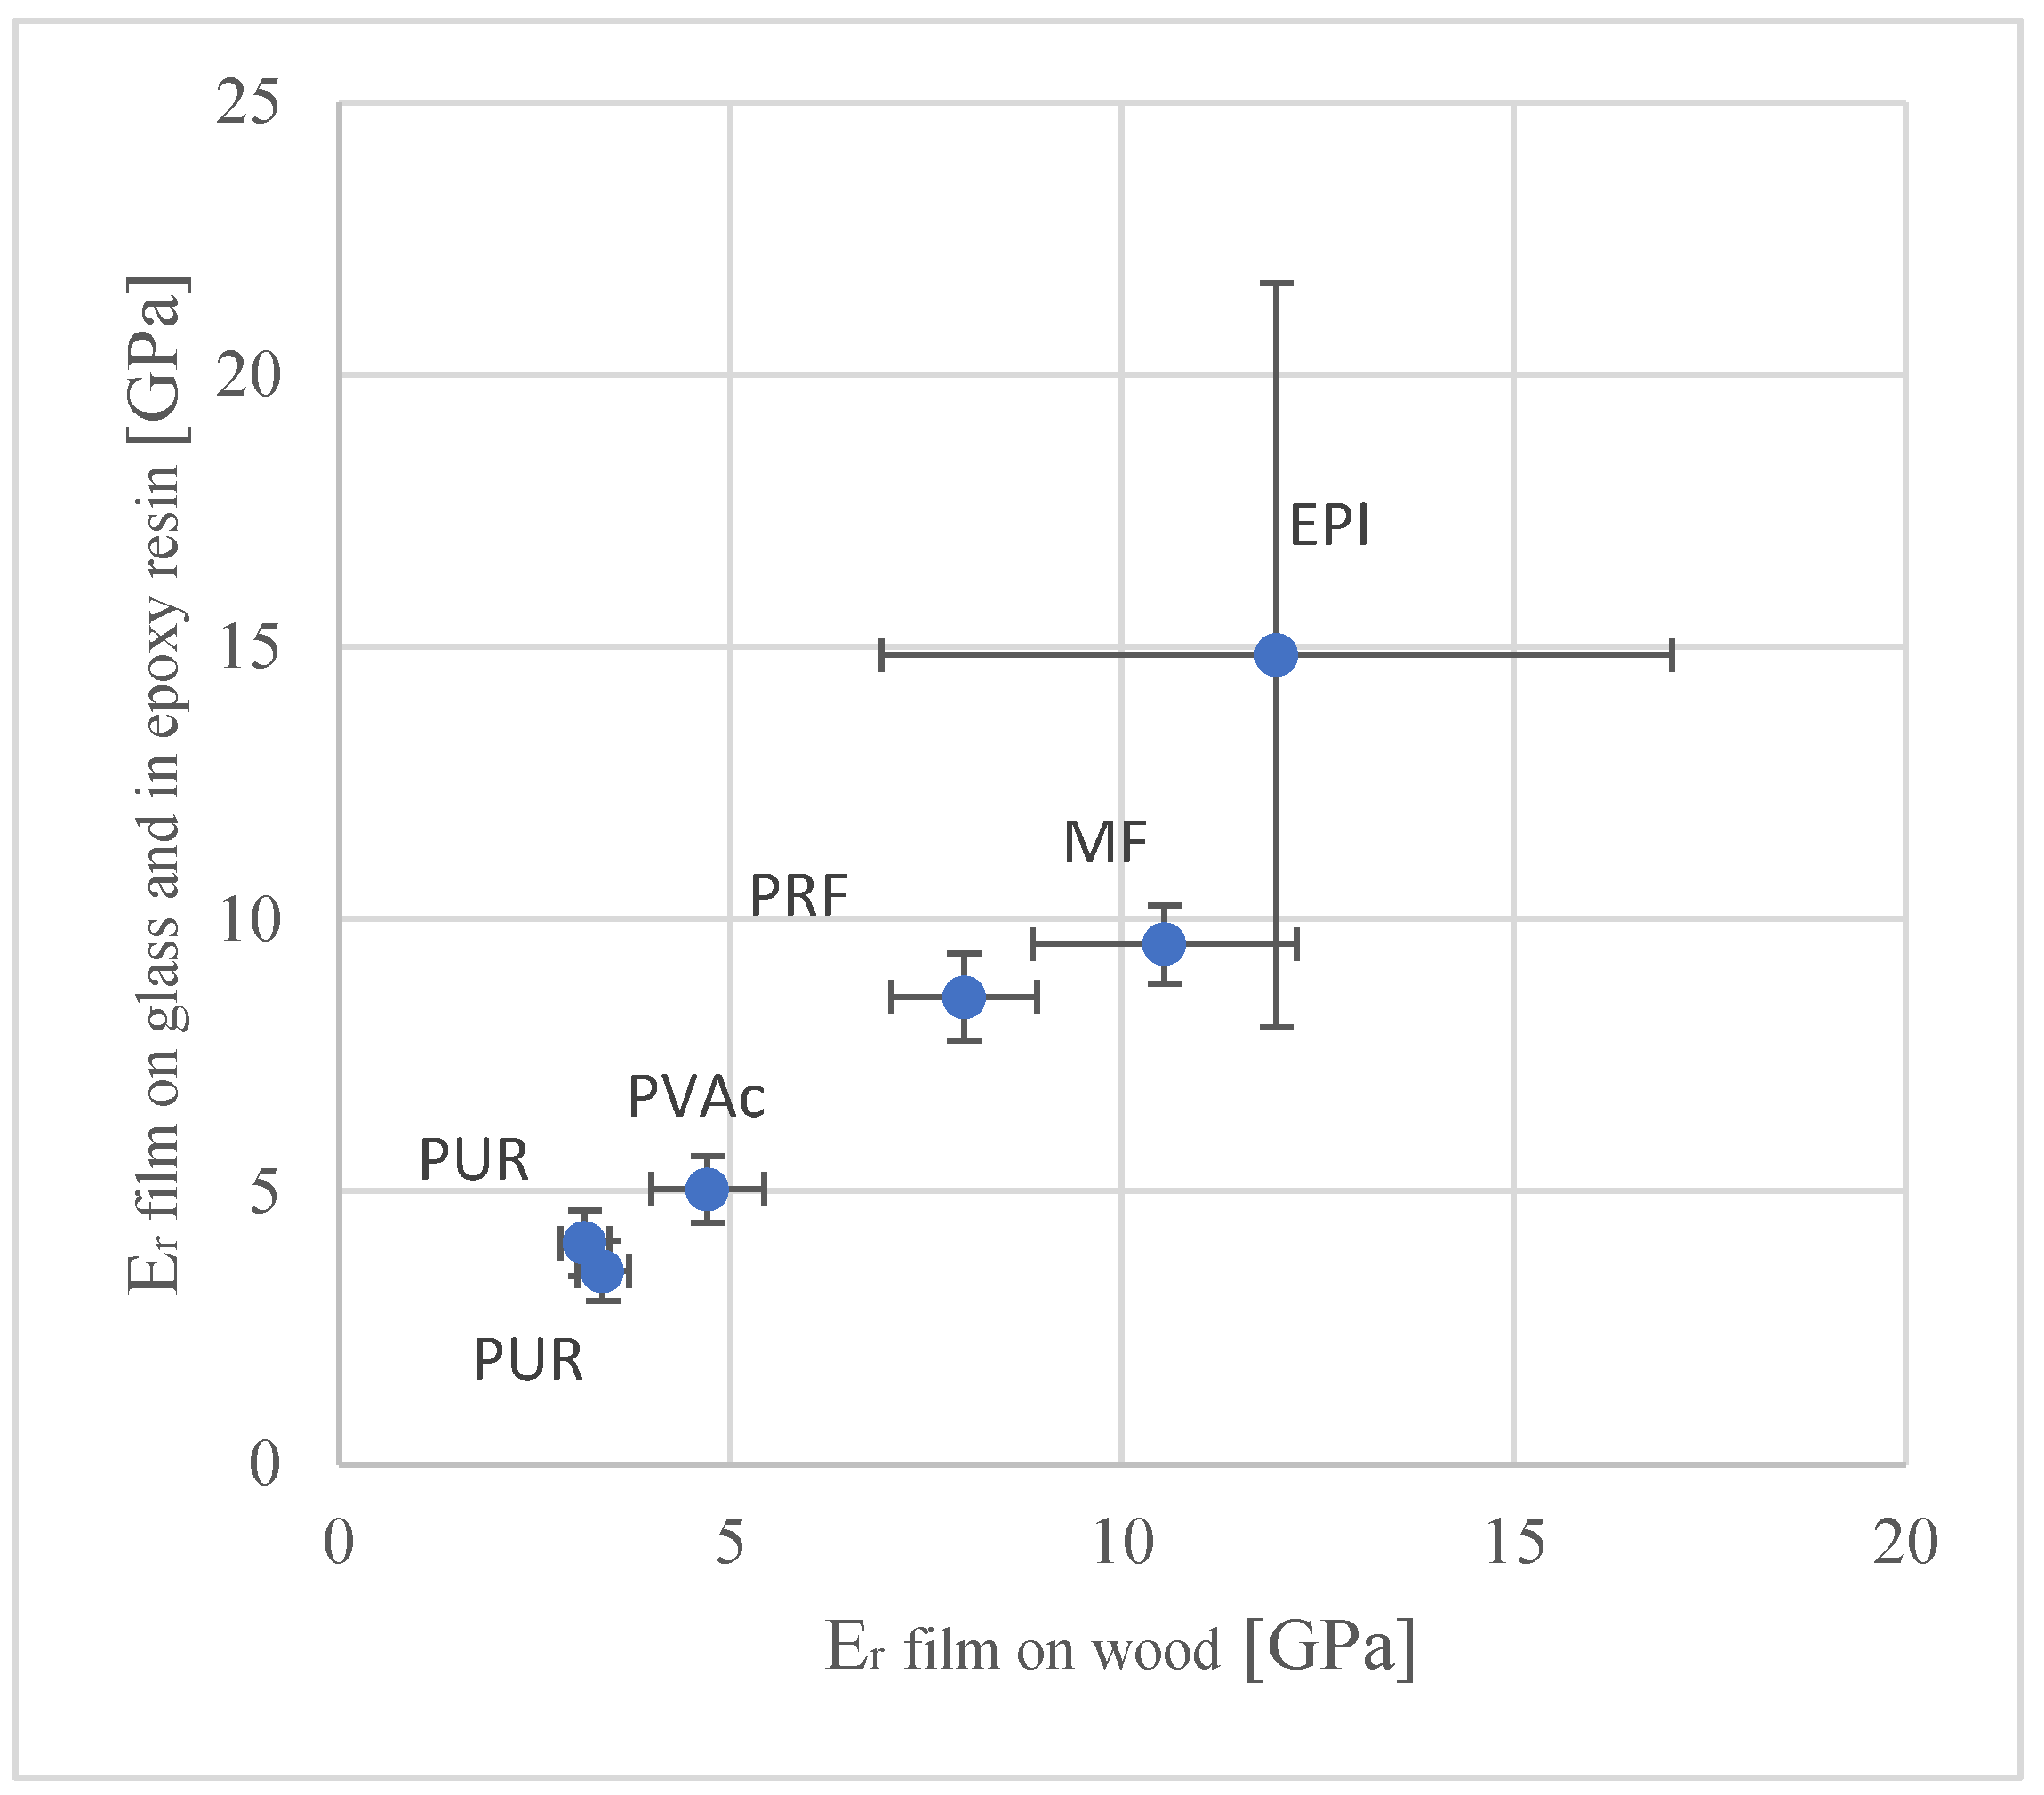
Elastic modulus is used as a synonym for the reduced modulus Er.
The highest values of the elastic modulus have EPI, MF and then, decreasing, RPF, PVAc and PUR.
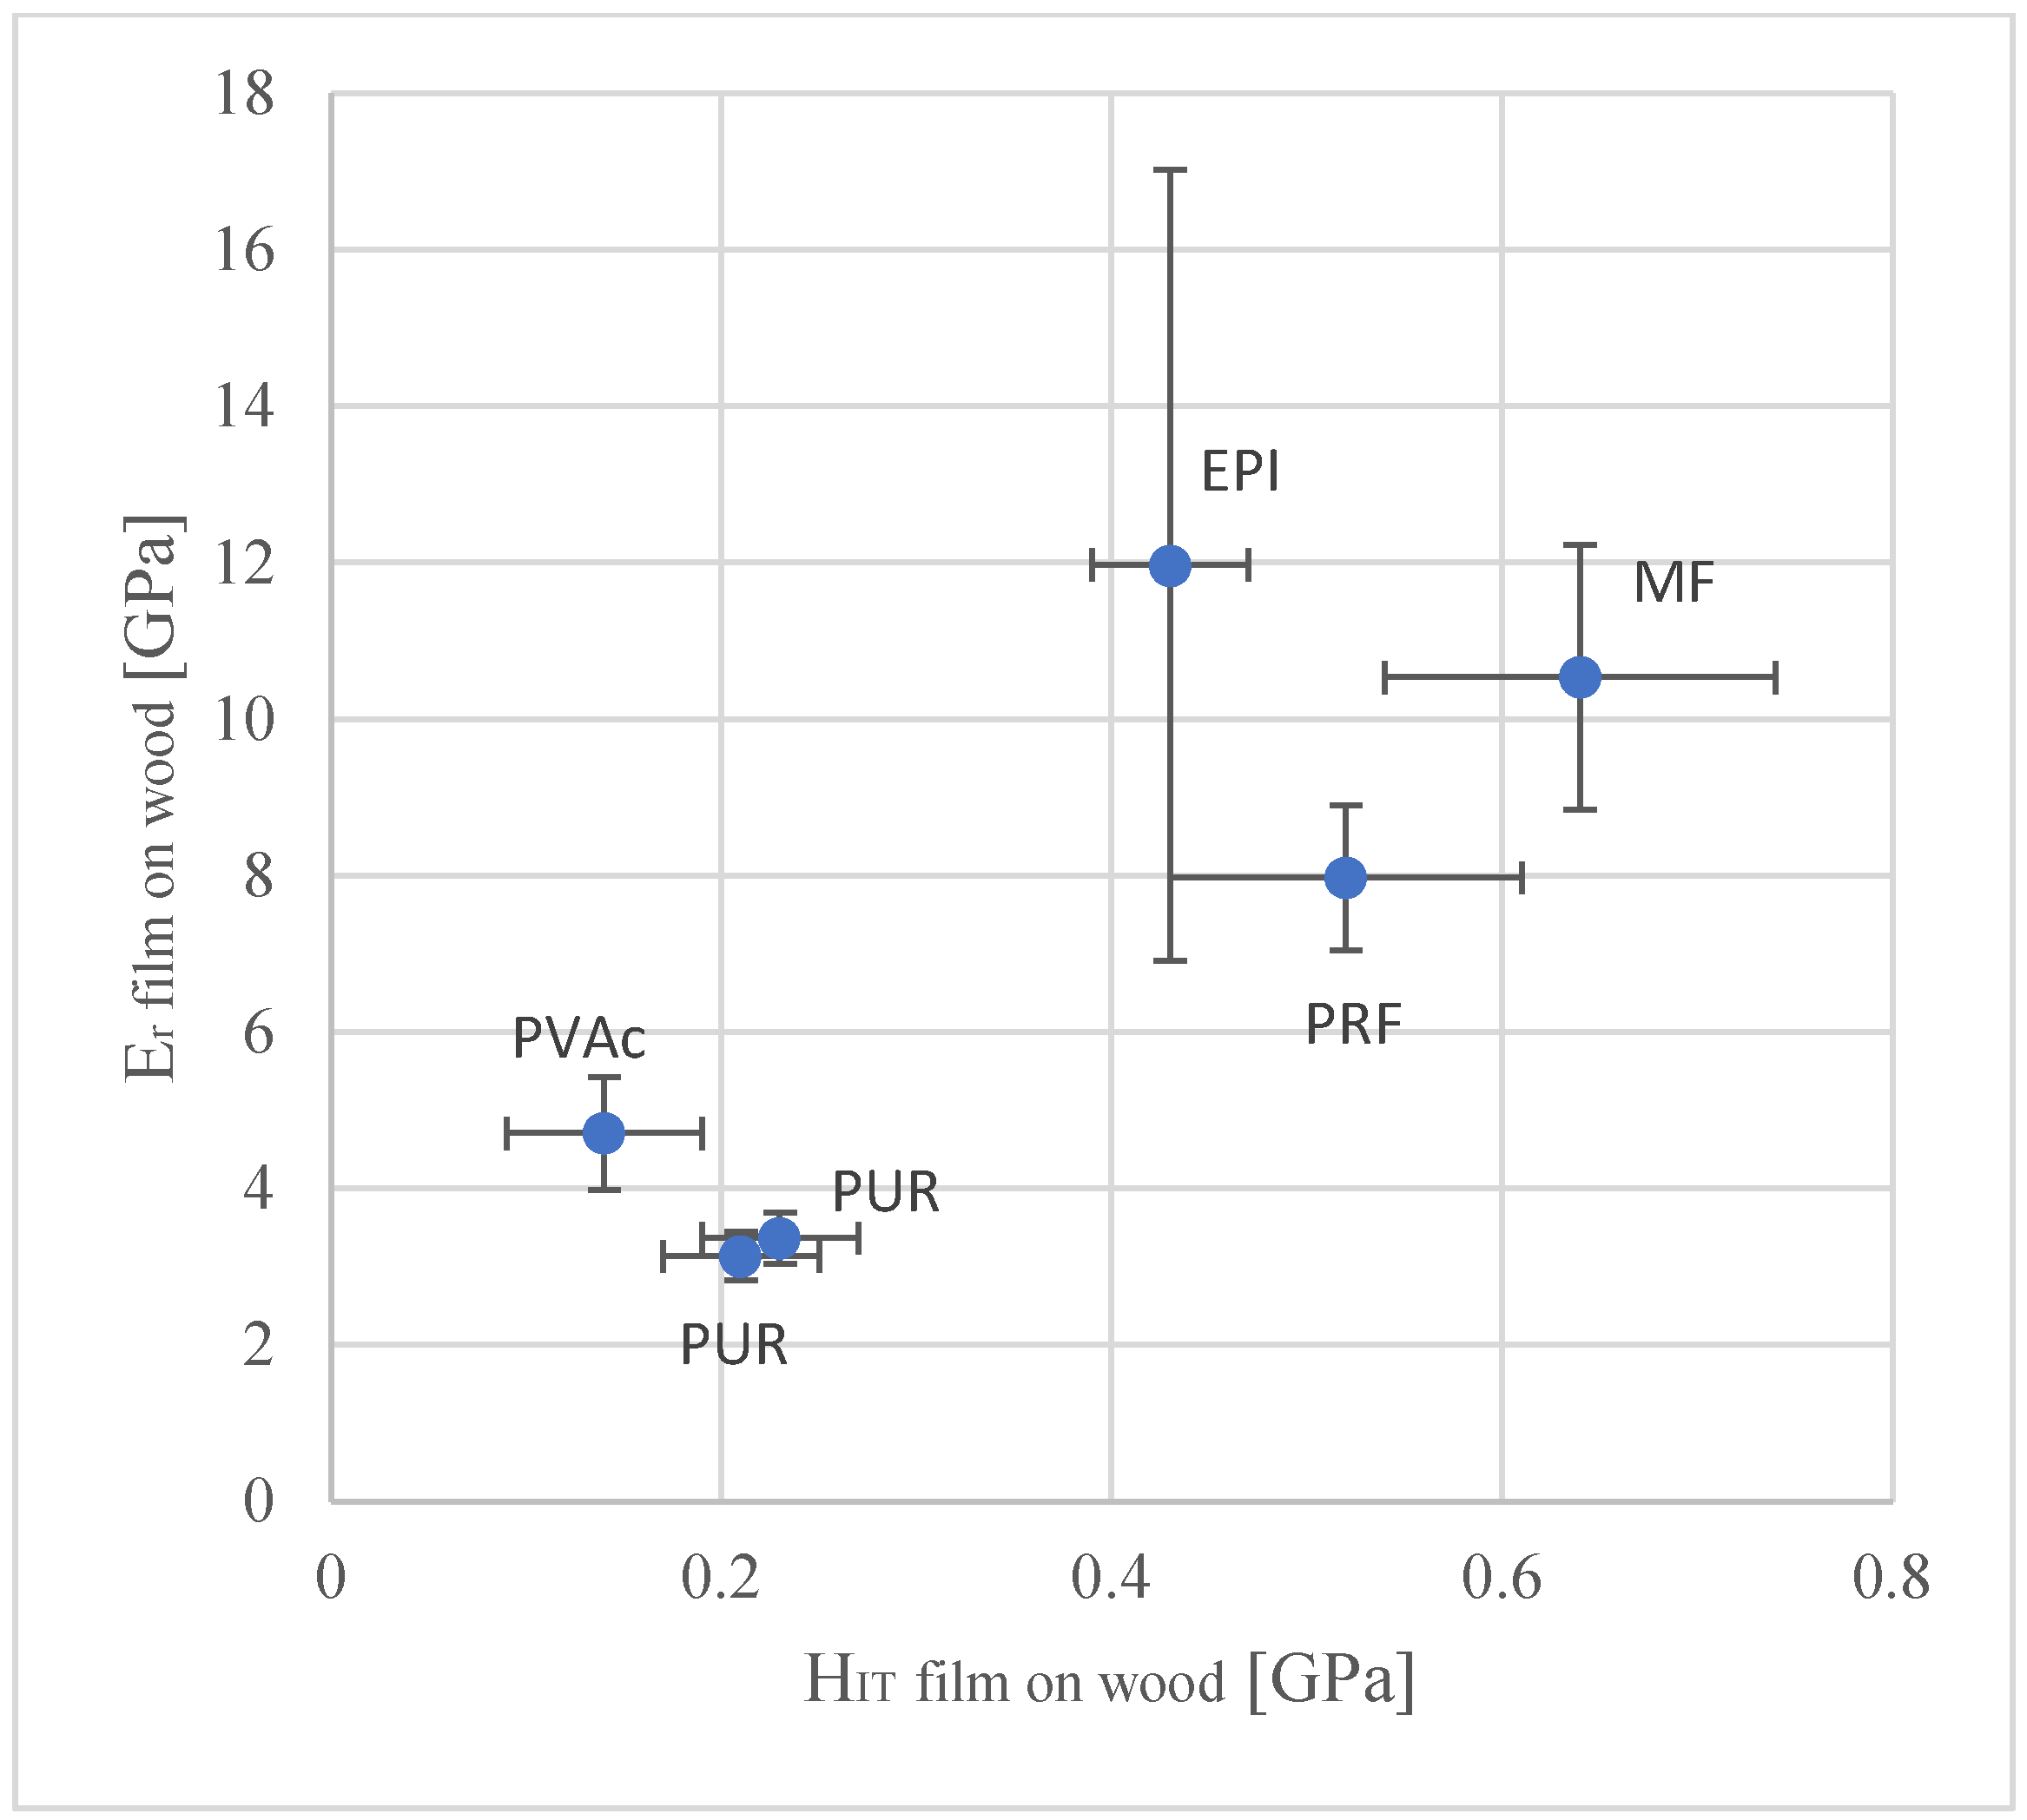
In the case of the elastic modulus, the method (adhesive layer on glass) showed also for the variant EPI, a much bigger spread. For this reason, the comparison of hardness and the elastic modulus was made, using the second method (adhesive on the wood)—
Figure 6 and
Figure 7.
This method is also less time consuming and requires less effort.
The results correlate with the literature data mentioned in
Table 6 and
Table 7.
4. Discussion
4.1. X-ray Micro Computed Tomography
In the case of the PUR adhesives, the CO2 gas bubbles are created during polymerization. During this process, water and moisture from the wood and the surrounding area are reacting with the adhesive.
PUR 2 has a higher proportion of gas bubbles, compared to PUR 1, due to a higher adhesive joint thickness.
In the case of the condensation resins, bubbles are formed during polycondensation, when water is released.
The PVAc adhesives are also cured physically by releasing water.
A high proportion of voids can significantly weaken the adhesive joint, because it creates deficiencies in a homogeneous adhesive joint. If the void is big enough to create a leak of adhesives between two wooden layers, it creates a weak spot.
The highest proportion of voids was observed by the PUR and PVAc adhesives.
It has been proven that the thickness of the adhesive joint and the type of adhesive have a large influence on the formation of voids in the adhesive joint. This has a significant impact on the final strength of the glued elements. Following the analysis of the results, it is recommended to achieve a joint thickness in the range of 100–150 µm for the appropriate application of the adhesive.
The variety of delamination is a result of both the specific nature of the substrate and the properties of the adhesive. These are the first research results in this area, and the authors are well aware of the complexity of the delamination—this paper uses an innovative method of analysis.
4.2. Nanoindentation
As shown, the PUR and PVAc adhesives show little variation. The examined methods of application to the adhesives differ slightly. In the case of the adhesive film applied to the glass in the case of the EPI adhesive, the standard deviation is quite large and for this reason this application method is not recommended any further. The highest hardness achieved is MF, then RPF and the EPI adhesive.
The modulus of elasticity of the films and the proportion of the voids are important for the shear strength (WFP) and delamination [
33].
The MOE of the PUR adhesives could vary due to the chemical structure (crosslinking, fillers) [
7].
It is known that the condensation resins, such as thermosets, have a higher hardness, but the EPI reached also high values, probably due to a very low proportion of voids in the adhesive joint. PUR adhesives have slightly higher values than the softest adhesive—PVAc.
Analyzing the glued samples, it can be concluded that lower glue application, as well as the higher pressing pressure and the proper surface preparation, can effectively lower the higher defect volume.
The preparation of the substrate surface, the content of the extractive substance on the surface and the surface tension, have a major impact on the curing of the adhesive and the formation of defects. This affects the hardness values and the e-modulus.
The glue joint should be thick enough to cover both bonded surfaces and penetrate them. However, it must not be too thick, as it will foam and there will be greater stress on the joint. For the best performance, the glue joint should be 0.1 mm [
37].


 ,
, 


