Abstract
The major goal of this study is to examine the impact of agricultural cooperative membership on the net return on production cost (ROC). The data used for the study were gathered from 233 rice farmers in the central Mekong River Delta’s province of Hau Giang, Vietnam. Propensity score matching and two-step Heckman selection models were employed to account for possible selection bias stemming from systematically different observable and unobservable attributes between cooperative members and non-members. The findings reveal that cooperative membership has a positive and statistically significant impact on rice farmers’ ROC, suggesting that agricultural cooperatives could help increase the profitability of rice farms.
1. Introduction
Cooperatives play a crucial role in the agricultural sector in developed and developing economies. They are viewed as the core institutional and organizational instrument that helps farmers reduce transaction costs and empower markets (Tortia et al. 2013). Deng et al. (2021) also emphasize that agricultural cooperatives are a vital part of the production system of modern agriculture. Studies on agricultural cooperatives have been interesting and considered by many scientists, researchers, and policy makers across countries and regions worldwide. A vast number of empirical studies have mainly focused on the impact estimation of cooperative membership. Considerable evidence from the literature on the role and impact of cooperatives shows that the causal effects of cooperatives on their members’ production outcomes and livelihoods are remarkably mixed.
Many empirical studies prove cooperative membership’s positive and significant impact on members’ outcomes, such as farm income, household income, yield, and the price for output. Specifically, using a propensity score-matching (PSM) model with a dataset of 579 rural households in Southwest of Nigeria, Afolabi and Ganiyu (2021) reveal that cooperative members generate a significantly higher total income than non-members. Similarly, Wang et al. (2021), employing the PSM method with data gathered from 1244 farmer households in Hubei province of China, report that farmers participating in cooperatives obtain dramatically greater savings or net income than non-members of cooperatives. They concluded that cooperatives positively enhance the income and quality of living of poor households in rural areas. A case study in the Jimma Zone of Ethiopia conducted by Mojo et al. (2017) indicated that cooperative membership helps significantly increase the total incomes and asset values of coffee-farming households (welfare) by employing endogenous switching regression (ESR) controlling for observable and unobservable selection biases.
With regard to cooperative membership’s impact on various outcome indicators, Hoken and Su (2018), through an investigation of a cooperative in the Jiangsu province of China, and using PSM to control for observable attributes between the two groups, confirmed that cooperative members achieve significantly higher rice farm income, profit, yield, and price for rice as compared to non-members. Likewise, controlling for observable selection biases by the PSM technique, Chagwiza et al. (2016) reveal a positive and remarkable impact on various outcomes of cooperative dairy farmers in Ethiopia, such as milk production, productivity, selling price, dairy income, and technological innovation. Employing the treatment effects model, Ma and Abdulai (2017) demonstrate that in China’s provinces of Gansu, Shaanxi, and Shandong, joining cooperatives specializing in apple production significantly increases apple growers’ outcomes such as the selling price, gross revenue, profit, and return on investment.
However, several studies pointed out a modest impact on members’ farm performance and income because of cooperative membership. For instance, Hu et al. (2021) report that participation in new-type agricultural cooperatives has positive and significant effects on the per capita income of poor households in Southwest China by using the ESR method, whereas the PSM model demonstrates no significant impact. The findings from an empirical study conducted in the Siem Reap and Battambang provinces of Cambodia by Ofori et al. (2019) indicate that cooperative membership slightly impacts the farm incomes of vegetable producer members. However, it has influenced members’ technology adoption, credit access, and information infusion. Shumeta and D’Haeseb (2016), using the PSM method demonstrated the insignificant effects of participation in cooperatives on the farm income and coffee production of member households in the Jimma and Kaffa zones in Ethiopia.
In summary, little is known about how cooperative membership influences farm profitability, particularly in Vietnam’s Mekong River Delta. This study, therefore, aims to contribute to the growing literature about the role of agricultural cooperatives on farm profitability through the return on cost (ROC) indicator in several ways. First, it explores the factors driving farmers’ choice to participate in cooperatives. Second, the results from this study help further understand the degree to which agricultural cooperative membership interacts with households’ farm profitability. Last, the paper proposes some key policy implications based on the empirical findings.
To achieve the aforementioned objectives, cross-sectional data were collected from face-to-face interviews of 233 rice households in Vietnam’s Mekong River Delta, which annually supplies approximately 56% of rice production and 90% of the rice export volume in Vietnam. Interestingly, the Vietnamese government has revised and renewed many policies regarding developing collective economies and cooperatives for three decades. The country has experienced several stages of rising and falling in developing cooperatives due to inappropriate policies in the earlier period. Studying the impacts of reformed policies on cooperatives in improving households’ farm economic performance in Vietnam is essential. To assess the true impact of cooperative membership on farm profitability, propensity score matching and two-stage Heckman models were employed to estimate the treatment effects controlling for possible selection biases in this study.
The remainder of this paper is structured as follows. Section 2 briefly reviews rice production and the development of cooperatives in Vietnam. Section 3 introduces a theoretical framework to estimate the causal treatment effects. The variables’ definitions and data information are presented in Section 4. The next section reports and discusses the empirical results. The study’s principal conclusions and policy implications are provided in the last section.
2. Rice and Agricultural Cooperatives in Vietnam
Vietnam, a net rice importer before 1989, is presently known as the third largest rice exporter in the global market. This marvelous achievement resulted from Doi Moi or renovation policy in 1986 (Pingali and Xuan 1992); since then, the country’s economy has shifted from a centrally planned system to a market-oriented economy. Indeed, during the 1985–2015 period, rice and food production in Vietnam increased more than threefold: from 16.4 million tons in 1985 to 50.4 million tons in 2015 (Song et al. 2020). In response to this reform, the government of Vietnam has promulgated many important policies driving agricultural and rural areas to adapt to the market-oriented economy such as reformed policies regarding cooperatives and the collective economy, emphasizing the development of cooperatives (National Assembly of Vietnam 1996, 2003, 2012).
It is thus important to recall the history of cooperatives in Vietnam and their significant changes. Vietnam has a long history of the formation and development of cooperatives in general and agricultural cooperatives in particular. Generally, the development of Vietnamese cooperatives can be divided into five stages (Tiep et al. 2020; Duong 2015). The first stage, between 1954 and 1959, was boosting to massively establish cooperatives that became a popular form in the economic sector, whereas functions of household and private economies were neglected. The second stage, from 1960 to 1986, was the dramatic development of Vietnamese cooperatives. However, cooperatives were mostly established by the state order with a centrally planned economy rather than by farmers’ autonomy or voluntariness. During this period, the first Vietnamese cooperative charter was promulgated in 1961.
The third phase, between 1987 and 1996, is known as a period of cooperative recession. The number of cooperatives dramatically declined. Vietnam began to shift from a centrally planned economy to a market-oriented one in 1986. Importantly, the National Assembly of Vietnam proposed the first law on cooperatives in 1996. The fourth stage, from 1997 to 2002, is considered the period of on-going decrease in the number of cooperatives. Most cooperatives that were not based on farmers’ needs were eliminated in this stage (Tiep et al. 2020).
The current stage, from 2003 onward, constitutes the recovery of the development of cooperatives. Cooperatives have been primarily formed in rural areas. In this current stage, the National Assembly of Vietnam issued the 2003 Law on Cooperatives (an amendment of the 1996 Cooperatives Law) and the 2012 Law on Cooperatives (an amendment of the 2003 Cooperatives Law). Vietnam has also applied and assessed a new mode of cooperatives within the context of the market-oriented economy and international integration between 2003 and 2013. Consequently, all cooperatives must be operated under the Cooperatives Law of 2012. Accordingly, cooperatives are primarily defined as follows: “…cooperatives are the representative of their members and protect their legal rights. Cooperatives represent members in their distribution activities with other organizations in accordance with legal regulations. Cooperatives are the place to receive government assistance. For farmers’ households, the cooperative’s activities effectively act as a bridge between the state and farmer households….” (National Assembly of Vietnam 2012). The new-type cooperative model constitutes cooperatives established and operated with the principle of voluntariness and autonomy followed by the 2012 Cooperative Law (Tiep et al. 2020). In other word, cooperatives that have been formed since 2012 are called “new-type cooperative models”.
Consequently, the new model of cooperatives has been remarkably developed in Vietnam, with about 24,204 cooperatives (of which 64% of are agricultural cooperatives) consisting of around 6 million members by 2020 (Ministry of Investment and Planning 2021). This implies that cooperatives in general and agricultural cooperatives in particular have played a crucial role in the farm and livelihoods of agricultural households in rural Vietnam. Recently, the central government has placed considerable emphasis on cooperatives so as to enhance rural and agricultural areas. Indeed, the government promulgated Decision No. 340/TTg (dated 12 March 2021) on the approval of the collective economy and cooperatives’ development strategies in the 2021–2030 period (Government of Vietnam 2021). Ambitiously, the core target of this decision is to reach 45,000 cooperatives (twofold) with around 8 million members by 2030.
In Vietnam, agricultural cooperatives are known as a form of farmers’ collective economy. Their operation and performance may strongly impact the agricultural production of household members. They play an important role in providing production inputs, marketing for output, and delivering other agricultural services, which may support farmers’ ability to achieve higher productivity, reduce input costs, and increase market efficiency.
3. Theoretical Framework
3.1. Role of Agricultural Cooperatives
Ma et al. (2018) report that agricultural cooperatives positively influence farms’ economic performance through several pathways. First, cooperatives enhance farmers’ access to advanced technologies, contributing to more efficient production input use. The technical efficiency of cooperative members is often higher than that of non-members (Ma et al. 2018; Neupane et al. 2022; Olagunju et al. 2021), resulting in an increase in farm yields. Indeed, empirical study results indicate that cooperative membership increases members’ production yields (Hoken and Su 2018; Michalek et al. 2018; Mishra et al. 2018). Cooperative membership improves the technical efficiency of farmers, thus enabling members to achieve higher productivity than non-members (Neupane et al. 2022; Olagunju et al. 2021). Agricultural cooperatives encourage farmers to adopt advanced technology, which thus increases farm productivity and income (Zhang et al. 2020).
Second, cooperatives can purchase and deliver farm inputs and supplies to their farmer members (Cropp and Ingalsbe 1989). Cooperatives can also facilitate better access to farm input, financial support, and linkage for the output market (Abebaw and Haile 2013). Agricultural cooperatives, a crucial institution of the agricultural sector, are also considered a vital actor in supply chains with respect to encouraging farmers to adopt sustainable practices. (Candemir et al. 2021). Consequently, farmer members may acquire better productive inputs at a reasonable cost.
Third, agricultural cooperatives, when used as an effective marketing channel, may help farmers gain significantly higher farm income per capita and household income per capita due to better selling prices (Liu et al. 2019). Agricultural cooperatives also provide their members with information about outlet channels and market prices, which may support farmers’ ability to sell their output at a higher price (Hao et al. 2018; Hoken and Su 2018; Ma and Abdulai 2017; Wollni and Zeller 2007). Cooperatives may play an important role in marketing, e.g., with respect to handling, processing, selling farm produce, and bargaining for higher prices (Cropp and Ingalsbe 1989).
In short, the three pathways for enhancing farm performance through cooperative membership are illustrated in Figure 1.
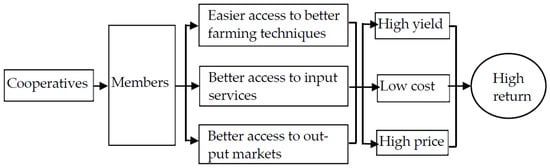
Figure 1.
Cooperatives’ pathways for improving farm performance.
3.2. Impact Estimation Strategies
The primary aim of this study is to investigate the impact of participation in agricultural cooperatives on return on cost (ROC). Thus, ROC is a linear function of a cooperative membership binary variable () and a vector of farm and household characteristics. The function can be specified as follows:
where is defined as ROC; is a binary variable, equaling 1 if household i is a cooperative member, and 0 otherwise; is a vector of farm and household characteristics; and are unknown parameters to be estimated; and is a random error term.
The core objective is to estimate the representing the marginal impact of cooperative membership on the outcome. However, many empirical studies have shown that agricultural households’ decision to join cooperatives depends on their farm and household characteristics or self-selection into cooperative membership rather than randomly assigned participation (e.g., Afolabi and Ganiyu 2021; Wang et al. 2021; Mojo et al. 2017; Hoken and Su 2018). This possibly results in selection bias. Consequently, if the ordinary least squares (OLS) model is employed to estimate the ROC of cooperative membership, Equation (1) may yield biased results.
To adjust for such selection bias, some econometric approaches such as the PSM method, instrumental variables, EWR, the treatment effects model, and the Heckman sample selection model were employed to correct possible selection bias (e.g., Olagunju et al. 2021; Hu et al. 2021; Ofori et al. 2019; Hoken and Su 2018; Ma et al. 2018; Ma and Abdulai 2017; Ahmed and Mesfin 2017; Mojo et al. 2017; Chagwiza et al. 2016; Shumeta and D’Haeseb 2016; Abebaw and Haile 2013; Zheng et al. 2011).
Following (Ofori et al. 2019; Chagwiza et al. 2016), and Shumeta and D’Haeseb (2016), this study employed the PSM method to estimate average treatment effects controlling for observable factors, but it cannot account for unobservable selection bias. Therefore, adopting the approaches used by Attipoe et al. (2021), Ma and Abdulai (2017), Zheng et al. (2011), and Miyata et al. (2009), a sample selection model developed by Heckman (1979), called the two-stage Heckman model, was further employed to examine the impact of cooperative membership on ROC while accounting for both observable and unobservable selection biases in our study.
Fortunately, both models proceed through a two-stage procedure. Within this framework, they model the determinants of households’ participation in cooperatives (first stage) and the impact of cooperative membership on households’ ROC (second stage).
Determinants of a household becoming a cooperative member (first stage): It should be based on a random utility framework in which farmers choose to participate in cooperatives. Contingently with this framework, a farmer may choose to become a cooperative member if the potential utility obtained from membership is larger than that gained from non-membership. Thus, we can express the utility gained from membership as a function of the observable attributes in a latent variable framework as follows:
where is a latent variable defined as the utility difference between becoming a member and non-membership. Zi is a vector of covariates that might influence farmers’ decisions to become a cooperative member, while γ denotes a vector of unknown parameters to be estimated. is random disturbance. is already denoted above.
Hence, binary regression (a probit model in this study) was employed to estimate the probability of cooperative membership.
Treatment effects estimated by PSM technique: Since we sought to measure the average treatment effect on the treated (ATT), the expected outcomes were primarily compared with and without membership in the agricultural cooperatives for the same household simultaneously. Assuming that is the ROC of the household as a member of the agricultural cooperative and is the ROC of the same household not being a member of the cooperative, ATT can be written as follows:
where ATT is defined as a difference between the mean values of the expected ROC of the household when participating and the expected ROC if this household is not participating in the cooperative. was defined earlier.
Estimating the ATT value in Equation (3) is impossible since the outcome created in the case of not participating in the cooperative for the same household that actually joined the cooperative cannot not be observed simultaneously. The counterfactual outcome—E[| = 1]—was missed or unmeasured; thus, a suitable substitute must be used to estimate the ATT. However, the value of the outcome for actual non-members—E[| = 0]—that is simply used to replace E[| = 1] is often not employed because variables affecting the decision to participate in the cooperatives might simultaneously influence the expected outcome, causing biased estimates (Caliendo and Kopeinig 2008).
Fortunately, the PSM technique developed by (Rosenbaum and Rubin 1983) can treat households that participate in the cooperatives as a treated group and other households that do not participate in the cooperatives but have similar propensity scores with households’ in the treated group as a control group. Consequently, the expected ROC of the control group is used as the counterfactual outcome: E[| = 1]. Thus, the ATT might be measured as the difference between the mean values of the treated and the control groups. In general, a PSM estimator can be written as follows:
where P(Zi) denotes the probability of participation in cooperatives for each household, which is known as the propensity score; this probability was computed by the probit regression model in the first stage.
The nearest neighbor-matching (NNM) and kernel-matching (KM) methods were used in the present study to match cooperative members with non-members regarding the propensity scores since these matching techniques were often seen as the most used (Becerril and Abdulai 2010). NNM uses the individual households in the control group to match a treated individual household that had the closest propensity score, thus reducing bias. Meanwhile, KM uses the weighted averages of all individual households in the control group to construct the counterfactual outcome, thereby yielding low variance since it uses all the information from the controls (Caliendo and Kopeinig 2008). As a consequence, these matching methods are primarily complementary.
It is necessary to thoroughly examine the matching procedure’s quality before discussing the causal impacts of cooperative membership. First, systematical differences should not remain among the covariates between the treated and untreated groups after matching based on the propensity score (Caliendo and Kopeinig 2008). Second, the mean absolute standardized bias in the matched samples should be less than 25% (Stuart and Rubin 2007), suggesting that the matching process is appropriate. Third, the pseudo-R2 values show how well the regressors explain the likelihood of participation in the cooperative from the propensity score estimation before and after matching. These values should be fairly low after matching since systematic differences were eliminated among the covariates between the two groups (Maertens and Vande Velde 2017).
Treatment effects estimated by the Heckman model: PSM is recognized as a non-parameter method, whereas the Heckman model is known as a parameter one. Indeed, the Heckman method (second stage) modified the OLS model by adding an inverse Mill’s ratio (IMR) generated in the first stage to correct possible selection bias stemming from self-selection in the simple OLS model. Thus, Equation (1) is rewritten as:
where is defined as the inverse Mill’s ratio (IMR); refers to the standard normal density function; denotes the standard normal distribution fuction; is a parameter to be estimated. The rest have already been described. Remarkably, the coefficients of or will display the status of the selectivity bias. If the coefficient of is statistically significant, it indicates the presence of selection bias and vice versa.
4. Data and Descriptive Statistics
4.1. Data Collection
The cross-sectional data used for empirical analysis were collected by a household survey conducted between April and December 2021. The survey was conducted in Hau Giang province’s Long My and Vi Thuy districts. Hau Giang is located in the central Mekong Delta province, where the local government has recently promoted and enhanced agricultural cooperatives.
A multi-stage-sampling method was employed for the data collection process. First, Hau Giang province was purposively chosen. The total number of agricultural cooperatives in Hau Giang is 202, of which 65 cooperatives specialize in rice production (Hau Giang Cooperatives Alliances 2021). Second, Long My and Vi Thuy districts were selected as the sampling sites since they are two major districts for rice production and have various cooperatives for the rice sub-sector as well. Third, all (twenty-five) the cooperatives specializing in rice production that have been established for at least two years in the two districts were purposively selected to gather basic information about the age or year of establishment, member size, charter capital, share capital, assets, facility, service supply, etc. This stage helps us understand the general activities and performance of rice cooperatives in Hau Giang province.
In the next step, three rice cooperatives of each district were randomly selected from the list of cooperatives surveyed at the third stage. As a result, a total of six cooperatives were selected from twenty-five units. Last, cooperative members and non-members were selected for face-to-face interviews. To gather the primary data, we randomly selected about 20 household members of each cooperative who had been members of a cooperative for at least two years and around 20 non-member households that had never joined any cooperatives. To ensure agro-ecological conditions, the transportation infrastructure and cultural status were relatively homogenous; the non-member households selected had to have resided in the same geographic location as the cooperative members. A total of 233 rice-farming households, including 116 members and 117 non-members of cooperatives, were finally selected as the sample of this study.
A structured questionnaire was used to gather data from cooperative members and non-members. The questions principally focused on demographic and farm characteristics, farm assets, and data on rice production such as the structure of the production cost, input supply, output market, farm-gate price, and yields.
4.2. Variable Definitions and Summary Descriptive Statistics
Based on previous empirical studies by Wang et al. (2021), Hao et al. (2018), Ma et al. (2018), Ma and Abdulai (2017), Chagwiza et al. (2016), Ito et al. (2012), and Zheng et al. (2012), and actual observations during the household survey, we selected ten explanatory variables (as presented in Table 1) for the empirical analysis.

Table 1.
Variable definitions and descriptive statistics.
The definitions and descriptive statistics of variables used in the empirical analysis are presented in Table 1. The average household head was around 52 years old and had about 27 years of experience in rice cultivation, implying that the farmers were involved in farming activities for more than half of their lives. The average values defining the number of schooling years for the household heads and spouses were about 7.63 and 6.48 years, respectively, showing that the education of household heads is relatively higher than that of their spouses. The sampled households had about 4.55 family members on average. The average area of rice land was about 1.68 ha. The percentage of households that owned agro-machinery such as tractors and combine harvesters was relatively low, at around 26 percent, whereas 63% of the surveyed farmers reported that they use the internet. There were 54% farmers reporting that their neighbors also joined farmer-based organizations such as cooperatives, collective economic groups, collaborative groups, famers’ clubs, etc. The mean distance from a given farmer’s house to the village head was around 2 km. Village heads who worked as the leaders of the hamlets or villages often travel around the village to observe and provide information to people within the village. This indicator was used to evaluate the accessibility of farmers to a local officer to obtain notices and information from local authorities.
5. Results and Discussion
5.1. Comparison of Cooperative Members and Non-Members
The surveyed households were divided into treatment (cooperative members) and comparison (non-members) groups. Table 2 reports that 116 (49.8%) of the respondents were cooperative members while 117 (50.2%) were non-members.
Table 2.
Characteristics and farm performance of cooperative members and non-members (t-test results).
The mean differences in the farm and household characteristics and farm economic performances between the cooperative members and non-members are presented in Table 2. There were some remarkable differences regarding the demographic and socioeconomic attributes that existed between cooperative members and non-members. More specifically, the household heads of cooperative members were older than non-members. The mean ages of the household heads for cooperative members and non-members were around 54 and 52 years, respectively. Similarly, the cooperative members also had more experience in rice production than non-members. Indeed, the members had around 28 years of experience, whereas this amounted to around 26 years for the non-members. The rice farm size of the cooperative members was also significantly larger than that of non-members. As a matter of fact, members owned approximately 2 ha of rice land while non-members had around 1.4 ha. Interestingly, cooperative members had more neighbors joining a farmer-based organization than non-members. Table 2 reports that 79% of the interviewed members had neighbors that were members of farmer-based organizations, whereas this statistic was 30% for non-members.
As presented in Table 2, the results showed that the other characteristics of the members and non-members were relatively homogeneous. For example, the education of household heads and their spouses for members and non-members were similar. Both groups have a similar number of family members. Regarding dummy variables, the member and non-member groups have similar shares of households owning agro-machinery and using broadband internet service. The average distance from farmers’ houses to the leaders of the hamlets for members and non-members was also not statistically different. In summary, significant mean differences exist across several covariates between the two groups. This suggests that the existence of these differences should be considered when estimating the true impact of cooperative membership.
The findings shown in Table 2 indicated that the crop performance values—such as the production cost, yield, farm-gate price, net return, and ROC—of the cooperative members were better than those of non-members. However, these comparisons did not account for the effects of the differential characteristics of the farms and households, which may confound the impact of cooperative membership on the outcomes with the effects of other factors. Notably, the total variable input cost included labor costs (hired and family labor), fertilizer costs, pesticide costs, seed costs, harvest costs, land preparation costs, and pumping costs.
5.2. Determinants of Cooperative Membership
Table 3 reports the estimates of the factors influencing farmers’ participation in cooperatives using the probit model as the first step of the Heckman sample selection and PSM models. Although the key objective of this study is to examine the impact of cooperative membership, the results from the probit regression model are also interesting. The results showed that three determinants are significantly associated with farmers’ participation in cooperatives. Specifically, the age of the household head was positively associated with the probability of the household’s participation in cooperatives. This probably shows that young farmers may not be interested in becoming cooperative members. This finding is in line with other studies (Mojo et al. 2017; Chagwiza et al. 2016; Shumeta and D’Haeseb 2016).
Table 3.
Factors influencing cooperative membership (probit model’s results).
The results, presented in Table 3, also demonstrate that the households’ land size dedicated to rice cultivation had a strongly positive association with the households’ propensity to join cooperatives, implying that households with larger farms are more likely to become cooperative members. This may suggest that small-scale farm households lack interest in or motivation to participate in cooperatives. This result is consistent with earlier empirical studies (Mojo et al. 2017; Ma and Abdulai 2017; Chagwiza et al. 2016; Shumeta and D’Haeseb 2016).
Interestingly, the strongest regressor for cooperative membership was the variable denoting a farmer’s neighbor was a member of a farmer-based organization. This reflects the fact that social networks influence farmers’ decisions to become cooperative members. This finding is consistent with earlier empirical studies (e.g., Ma and Abdulai 2017; Ito et al. 2012).
However, other covariates, including farming experience, the education of the head and spouse, the number of family members, ownership of agro-machinery, broadband internet use, and distance from the farmer’s house to the hamlet head, were not highly associated with becoming a cooperative member. Overall, the findings suggest that there is some self-selection to become a cooperative member. Indeed, cooperative membership is most likely biased towards the age of the household head, the rice farm’s size, and friend membership.
5.3. Impact of Cooperative Membership on Farm Economic Performances
We used ROC as an aggregate indicator to measure cooperative membership’s impact on farm economic performance or the profitability of rice households in the Mekong River Delta. In this section, the results of an empirical analysis by the PSM and Heckman models are comparatively reported and discussed.
Impact of cooperative membership estimated by PSM:
Before discussing the impact of cooperative membership using PSM, it is important to examine the matching procedure’s quality. Since the propensity scores derived from the probit model were used to match cooperative members to non-members, we first checked the common support region in which only observations were used for matching and other observations out of this region were dropped from the sample. The distribution of propensity scores and the area of common support for the empirical analysis are displayed in Figure 1. The bias in the propensity score distribution between the treated and untreated groups is also illustrated in Figure 2. The results reveal a sufficient overlap zone in the propensity scores of the treated and untreated groups, thereby suggesting that the common support assumption is satisfied, which may help avoid inappropriate matches.
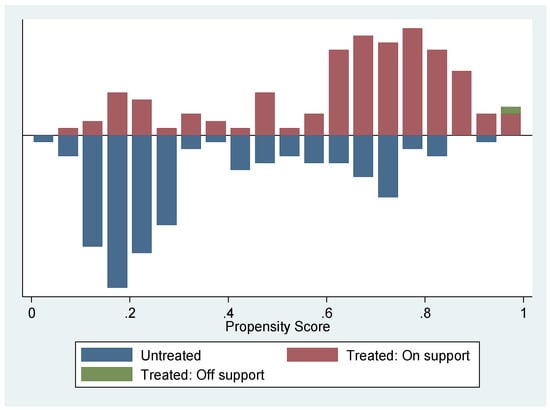
Figure 2.
Propensity score distribution and common support region. Note: “Treated: On support” and “Treated: Off support” represent consistent comparison and inconsistent comparison of observations in the treated group, respectively.
The balancing power was also measured by reducing the mean absolute standardized bias between the matched and unmatched samples. The results contained in Table 4 show that the standardized mean differences for all the confounding covariates used in the propensity score were dramatically reduced between 5.6% and 6.8% after matching using kernel and nearest neighbor-matching techniques. The data shown in Table 4 also report the remarkable decrease in the pseudo-R2 values after matching. The likelihood ratio tests of the joint regressors (p value) were insignificant after matching, while the p value was statistically significant before matching, implying that the covariate means of the treated and untreated groups after matching are insignificant. The implication of these results may be that some biases for the covariates are present, but using the matching techniques eliminated these biases. In summary, the matching methods used are dramatically relatively consistent, balancing the covariate distributions between members and non-member groups. Consequently, the ATT estimates are quite accurate (Rosenbaum and Rubin 1983).
Table 4.
PSM quality indicators before and after matching and sensitivity analysis.
The causal impacts of participation in cooperatives on the ROC using the KM and NNM techniques are shown in Table 5. The estimates using both matching methods were relatively similar and showed that cooperative membership had statistically significant impacts on the ROC. Specifically, participation in cooperatives can help farmers increase at least 21% of their net return on total variable cost. This implies that rice production cooperatives help significantly improve rice farming’s profitability, thus contributing to enhancing rice households’ income in the Mekong River Delta.
Table 5.
The average impact of cooperative membership on ROC (PSM results).
Although the estimates obtained by the PSM method are robust, this method cannot account for selection bias due to unobservable attributes leading to biased results. Consequently, the two-stage Heckman model was further employed to countercheck the true impact of cooperative membership.
Impact of cooperative membership determined by Heckman model:
Prior to presenting and discussing the estimation results determined by the Heckman sample-selection model, it is crucial to remember the process of the Heckman model. Regarding the first stage, the results of the probit regression model were described and discussed in the previous section. Thus, in this section, we solely discuss the results generated by the second stage.
The findings show that the coefficient of () was not statistically significant, suggesting the absence of sample selection bias stemming from unobservable factors. This implies that the OLS model provides plausible results for examining the impact of cooperative membership on ROC. The fitness of both models was statistically significant at the one percent level (prob > chi2 = 0.000 and prob > F = 0.000). As presented in Table 6, the results from both models appear similar. Cooperative membership was positively and significantly correlated to the ROC. Accordingly, if farmers join cooperatives, their return on cost may increase by 21.5% and 19.2% based on the Heckman and OLS models, respectively. These estimated results are similar to those obtained using the PSM model.
Table 6.
Cooperative membership impact on ROC (Heckman results).
Based on the findings reported above, it can be firmly confirmed that participating in cooperatives helps farmers increase their rice-farming profitability by around 20%, implying that the new model of agricultural cooperatives significantly enhances rice farms’ economic performance, thereby contributing to the improvement of rice farm incomes. This remarkable profitability gain might be generated by the overall impacts of cooperatives’ activities and services on their members, such as providing production inputs, contracting with food companies to purchase members’ rice, and organizing technical training. This study’s findings are consistent with the empirical evidence from previous studies (e.g., Palkovič et al. 2022; Hu et al. 2021; Hoken and Su 2018; Ma and Abdulai 2017; Mojo et al. 2017; Chagwiza et al. 2016).
It was found that the other three factors also affect farm economic performance or ROC. First, the education level of the household head has a positive and statistically significant impact on ROC. If the education of the household head increases by one year of schooling, the profitability of rice cultivation will increase two percent, while the other factors are constant. This is reasonable because farmers with higher education likely employ better farming techniques and manage their farms well. Second, the variable denoting farmland size is likely to impact ROC positively and significantly. If rice farmers’ land for rice cultivation increase by one hectare, they can obtain 7.2% higher profitability, while the other conditions are constant. This is plausible due to the economies of scale. Last, agro-machinery ownership tends to have a positive and remarkable effect on ROC. If households own agro-machines, the profitability of their rice could increase 11.2%, with other factors remaining constant. This is probably reasonable because these households’ machinery can help reduce production costs for land preparation and harvesting. However, we excluded the cost of purchasing machinery in production since it is a long-term asset and can be used for other purposes.
It should be taken into account that the other factors—including the household head’s age, farming experience, the education of the spouse, family size, internet use, and the distance from a farmer’s house to their hamlet head—have no significant impacts on ROC.
6. Conclusions
This study is considered to be the first estimate of cooperative membership’s impact on the profitability of rice households in Vietnam’s Mekong Delta, wherein selection biases were taken into account using PSM and two-stage Heckman models. The findings reveal that cooperative membership positively and significantly impacts rice growers’ ROC in the Mekong River Delta. It was found that the probability of becoming a cooperative member is positively associated with the household head’s age and farmland size.
A possible implication of this study may be that the new model of agricultural cooperatives enables rice growers to produce rice with a lower cost and higher revenue due to the higher selling price and yield. This brings benefits to cooperative members by promoting considerably higher profitability or farm economic performance through the ROC indicator. It may be concluded that the policies regarding cooperatives promulgated by the Vietnamese government significantly impact the degree of rice production of farmer households in the Mekong River Delta. Therefore, expanding the number of farmers participating in cooperatives in the rice sub-sector seems to be an effective policy implementation to help farmers gain higher income and achieve the Vietnamese government’s goal of improving rice production and the livelihoods of farmer households in rural Vietnam’s Mekong River Delta.
This study investigated only one cropping season for rice to examine the impact of participation in agricultural cooperatives on the profitability of rice production. In Vietnam’s Mekong River Delta, farmers often cultivate two or three rice crops in a year. Thus, it would have improved our understanding of the long-term impact of cooperative membership on farmers’ rice cultivation if other rice crops had been observed.
Author Contributions
Methodology, N.Q.T., T.D.Q. and D.V.L.; Software, N.Q.T.; Validation, T.N.D., C.D.N.; Formal analysis, N.Q.T. and T.V.N.; Investigation, T.V.N., N.V.N.; T.D.Q. and D.V.L.; Data curation, N.Q.T. and T.V.N.; Writing—original draft preparation, N.Q.T. and N.V.N.; Writing—review and editing, N.Q.T., T.N.D. and C.D.N.; Supervision, N.Q.T. and T.N.D.; Project administration, N.Q.T., N.V.N. and D.V.L.; Funding acquisition, N.Q.T. All authors have read and agreed to the published version of the manuscript.
Funding
This study was funded by the Vietnamese Ministry of Education and Training, Grant Numbers: B2021-TCT-04.
Informed Consent Statement
Not applicable.
Data Availability Statement
Data is available upon request.
Acknowledgments
We would like to express our great thanks to anonymous reviewers and academic editor for helpful comments on the earlier manuscript.
Conflicts of Interest
The authors declare no conflict of interest.
References
- Abebaw, Degnet, and Mekbib Haile. 2013. The impact of cooperatives on agricultural technology adoption: Empirical evidence from Ethiopia. Food Policy 38: 82–91. [Google Scholar] [CrossRef]
- Afolabi, Sofoluwe Nurudeen, and Yinusa Olumuyiwa Ganiyu. 2021. Impact of cooperative membership on rural income generation in Southwest, Nigeria. Revesco 138: 1–12. [Google Scholar] [CrossRef]
- Ahmed, Musa Hasen, and Hiwot Mekonnen Mesfin. 2017. The impact of agricultural cooperatives membership on the wellbeing of smallholder farmers: Empirical evidence from eastern Ethiopia. Agricultural and Food Economics 5: 1–20. [Google Scholar] [CrossRef]
- Attipoe, Sonny Gad, Jian min Cao, Yaa Opoku-Kwanowaa, and Frank Ohene-Sefa. 2021. Assessing the impact of non-governmental organization’s extension programs on sustainable cocoa production and household income in Ghana. Journal of Integrative Agriculture 20: 2820–36. [Google Scholar] [CrossRef]
- Becerril, Javier, and Awudu Abdulai. 2010. The impact of improved maize varieties on poverty in Mexico: A propensity score-matching approach. World Development 38: 1024–35. [Google Scholar] [CrossRef]
- Caliendo, Marco, and Sabine Kopeinig. 2008. Some practical guidance for the implementation of propensity score matching. Journal of Economic Surveys 22: 31–72. [Google Scholar] [CrossRef]
- Candemir, Ahmet, Sabine Duvaleix, and Laure Latruffe. 2021. Agricultural cooperatives and farm sustainability—A literature review. Journal of Economic Surveys 35: 1118–44. [Google Scholar] [CrossRef]
- Chagwiza, Clarietta, Roldan Muradian, and Ruerd Ruben. 2016. Cooperative membership and dairy performance among smallholders in Ethiopia. Food Policy 59: 165–73. [Google Scholar] [CrossRef]
- Cropp, Robert, and Gene Ingalsbe. 1989. Structure and scope of agricultural cooperatives. In Cooperatives in Agriculture. Edited by David Cobia. Hoboken: Prentice-Hall, Inc., pp. 35–67. [Google Scholar]
- Deng, Lei, Lei Chen, Jingjie Zhao, and Ruimei Wang. 2021. Comparative analysis on environmental and economic performance of agricultural cooperatives and smallholder farmers: The case of grape production in Hebei, China. PLoS ONE 16: 245981. [Google Scholar] [CrossRef]
- Duong, Bao Pham. 2015. Some Theoretical and Practical Issues about the Innovation and Development of Cooperatives in Vietnam Rural Areas. Economic Research 49: 48–54. [Google Scholar]
- Government of Vietnam. 2021. Decision No. 340/TTG on Approval for Development Strategies of Collective Economy and Cooperatives in the 2021–30 Period. Hanoi: Government of Vietnam. (In Vietnamese) [Google Scholar]
- Hao, Jinghui, Jos Bijman, Cornelis Gardebroek, Nico Heerink, Wim Heijman, and Xuexi Huo. 2018. Cooperative membership and farmers’ choice of marketing channels—Evidence from apple farmers in Shaanxi and Shandong Provinces, China. Food Policy 74: 53–64. [Google Scholar] [CrossRef]
- Hau Giang Cooperatives Alliances. 2021. Summary Report on Activities of Collective Economy and Cooperatives in Hau Giang Province in 2020. Hau Giang: Hau Giang Cooperatives Alliances. (In Vietnamese) [Google Scholar]
- Heckman, J. James. 1979. Sample selection bias as a specification error. Econometrica 47: 153–61. [Google Scholar] [CrossRef]
- Hoken, Hisatoshi, and Qun Su. 2018. Measuring the effect of agricultural cooperatives on household income: Case study of a rice-producing cooperative in China. Agribusiness 34: 831–46. [Google Scholar] [CrossRef]
- Hu, Zhineng, Qiong Feng, Jing Ma, and Shuangyi Zheng. 2021. Poverty Reduction Effect of New-Type Agricultural Cooperatives: An Empirical Analysis Using Propensity Score Matching and Endogenous Switching Regression Models. Mathematical Problems in Engineering 2021: 9949802. [Google Scholar] [CrossRef]
- Ito, Junichi, Zongshun Bao, and Qun Su. 2012. Distributional effects of agricultural cooperatives in China: Exclusion of smallholders and potential gains on participation. Food Policy 37: 700–09. [Google Scholar] [CrossRef]
- Liu, Yuying, Wangling Ma, Alan Renwick, and Xinhong Fu. 2019. The role of agricultural cooperatives in serving as a marketing channel: Evidence from low-income regions of Sichuan province in China. International Food and Agribusiness Management Review 22: 265–82. [Google Scholar] [CrossRef]
- Ma, Wanglin, and Awudu Abdulai. 2017. The economic impacts of agricultural cooperatives on smallholder farmers in rural China. Agribusiness 33: 537–51. [Google Scholar] [CrossRef]
- Ma, Wanglin, Alan Renwick, Peng Yuan, and Nazmun Ratna. 2018. Agricultural cooperative membership and technical efficiency of apple farmers in China: An analysis accounting for selectivity bias. Food Policy 81: 122–32. [Google Scholar] [CrossRef]
- Maertens, Miet, and Katrien Vande Velde. 2017. Contract-farming in Staple Food Chains: The Case of Rice in Benin. World Development 95: 73–87. [Google Scholar] [CrossRef]
- Michalek, Jerzy, Pavel Ciaian, and Jan Pokrivcak. 2018. The impact of producer organizations on farm performance: The case study of large farms from Slovakia. Food Policy 75: 80–92. [Google Scholar] [CrossRef]
- Ministry of Investment and Planning. 2021. Vietnamese Cooperatives White Book. Ho Chi Minh: Statistical Publishing House. 492p. [Google Scholar]
- Mishra, Ashok, Anjani Kumar, Pramod Joshi, and Alwin D’Souza. 2018. Cooperatives, contract farming, and farm size: The case of tomato producers in Nepal. Agribusiness 34: 865–86. [Google Scholar] [CrossRef]
- Miyata, Sachiko, Nicholas Minot, and Dinghuan Hu. 2009. Impact of Contract Farming on Income: Linking Small Farmers, Packers, and Supermarkets in China. World Development 37: 1781–90. [Google Scholar] [CrossRef]
- Mojo, Dagne, Christian Fischer, and Terefe Degefa. 2017. The determinants and economic impacts of membership in coffee farmer cooperatives: Recent evidence from rural Ethiopia. Journal of Rural Studies 50: 84–94. [Google Scholar] [CrossRef]
- National Assembly of Vietnam. 1996. The 2006 Cooperatives Law. Hanoi: National Assembly of Vietnam. (In Vietnamese) [Google Scholar]
- National Assembly of Vietnam. 2003. The 2003 Cooperatives Law. Hanoi: National Assembly of Vietnam. (In Vietnamese) [Google Scholar]
- National Assembly of Vietnam. 2012. The 2012 Cooperatives Law. Hanoi: National Assembly of Vietnam. (In Vietnamese) [Google Scholar]
- Neupane, Huma, Krishna Paudel, Mandeep Adhikari, and Qinying He. 2022. Impact of cooperative membership on production efficiency of smallholder goat farmers in Nepal. Annals of Public and Cooperative Economics 93: 337–56. [Google Scholar] [CrossRef]
- Ofori, Eric, Gabriel Sampson, and Jessie Vipham. 2019. The effects of agricultural cooperatives on smallholder livelihoods and agricultural performance in Cambodia. Natural Resources Forum 43: 218–29. [Google Scholar] [CrossRef]
- Olagunju, Kehinde Oluseyl, Adebayo Isalah Ogunniyi, Oyetunde-Usman Zainab, Abiodun Olusola Omotayo, and Bola Amoke Awotide. 2021. Does agricultural cooperative membership impact technical efficiency of maize production in Nigeria: An analysis correcting for biases from observed and unobserved. PLoS ONE 16: e0245426. [Google Scholar] [CrossRef]
- Palkovič, Jozef, Eva Matejková, and Eva Richterová. 2022. Agricultural Cooperatives and Their Impact on Economic Performance of Farms in Slovakia. Agris On-Line Papers in Economics and Informatics 14: 85–95. [Google Scholar] [CrossRef]
- Pingali, Prabhu, and Vo-Tong Xuan. 1992. Vietnam: Decollectivization and rice productivity growth. Economic Development & Cultural Change 40: 697–718. [Google Scholar] [CrossRef]
- Rosenbaum, Paul R., and Donald B. Rubin. 1983. The central role of the propensity score in observational studies for causal effects. Biometrika 70: 41–55. [Google Scholar] [CrossRef]
- Shumeta, Zekarias, and Marijke D’Haeseb. 2016. Do coffee cooperatives benefit farmers? An exploration of heterogeneous impact of coffee cooperative membership in Southwest Ethiopia. International Food and Agribusiness Management Review 19: 37–52. [Google Scholar] [CrossRef]
- Song, Van Nguyen, Nguyen Thi Minh Phuong, Ho Ngoc Cuong, Nguyen Xuan Diep, Do Thi Diep, Vu Ngoc Huyen, Vuong Thi Khanh Huyen, Nguyen Cong Tiep, and Tran Thi Thu Trang. 2020. Vietnamese Agriculture before and after Opening Economy. Modern Economy 11: 894–907. [Google Scholar] [CrossRef][Green Version]
- Tiep, Cong Nguyen, Nguyen Van Song, Nguyen Tho Quang Anh, Ho Ngoc Cuong, Do Thi Diep, Vuong Thi Khanh Huyen, Nguyen Thi Thuy, Tran Thi Thu Trang, and Nguyen Van Tuan. 2020. Agricultural Cooperative Development in Thaibinh Province, Vietnam: Situation and Solutions. Modern Economy 11: 1376–400. [Google Scholar] [CrossRef]
- Tortia, Ermanno, Vladislav Valentinov, and Constantine Iliopoulos. 2013. Agricultural cooperatives. Journal of Entrepreneurial and Organizational Diversity 2: 23–36. [Google Scholar] [CrossRef]
- Stuart, Elizabeth A, and Donald B. Rubin. 2007. Best practices in quasi-experimental designs: Matching methods for causal inference. In Best Practices in Quantitative Social Science. Edited by Jason Osborne. Thousand Oaks: Sage, pp. 155–76. [Google Scholar]
- Wang, Meiyuan, Bin He, Jinsong Zhang, and Yanan Jin. 2021. Analysis of the effect of cooperatives on increasing farmers’ income from the perspective of industry prosperity based on the PSM empirical study in Shennongjia region. Sustainability 13: 13172. [Google Scholar] [CrossRef]
- Wollni, Meike, and Manfred Zeller. 2007. Do farmers benefit from participating in specialty markets and cooperatives? The case of coffee marketing in Costa Rica. Agricultural Economics 37: 243–48. [Google Scholar] [CrossRef]
- Zhang, Shemei, Zhanli Sun, Wanglin Ma, and Vladislav Valentinov. 2020. The effect of cooperative membership on agricultural technology adoption in China. China Economic Review Journal 62: 101334. [Google Scholar] [CrossRef]
- Zheng, Shi, Zhigang Wang, and Titus Awokuse. 2012. Determinants of producers’ participation in agricultural cooperatives: Evidence from Northern china. Applied Economic Perspectives and Policy 34: 167–86. [Google Scholar] [CrossRef]
- Zheng, Shi, Zhigang Wang, and Shunfeng Song. 2011. Farmers’ behaviors and performance in cooperatives in Jilin Province of China: A case study. Social Science Journal 48: 449–57. [Google Scholar] [CrossRef]
Publisher’s Note: MDPI stays neutral with regard to jurisdictional claims in published maps and institutional affiliations. |
© 2022 by the authors. Licensee MDPI, Basel, Switzerland. This article is an open access article distributed under the terms and conditions of the Creative Commons Attribution (CC BY) license (https://creativecommons.org/licenses/by/4.0/).