
Assessing the Efficiency and Productivity of the Hospital Clinics on the Island of Rhodes during the COVID-19 Pandemic

Abstract
1. Introduction
2. Materials and Methods
3. Results
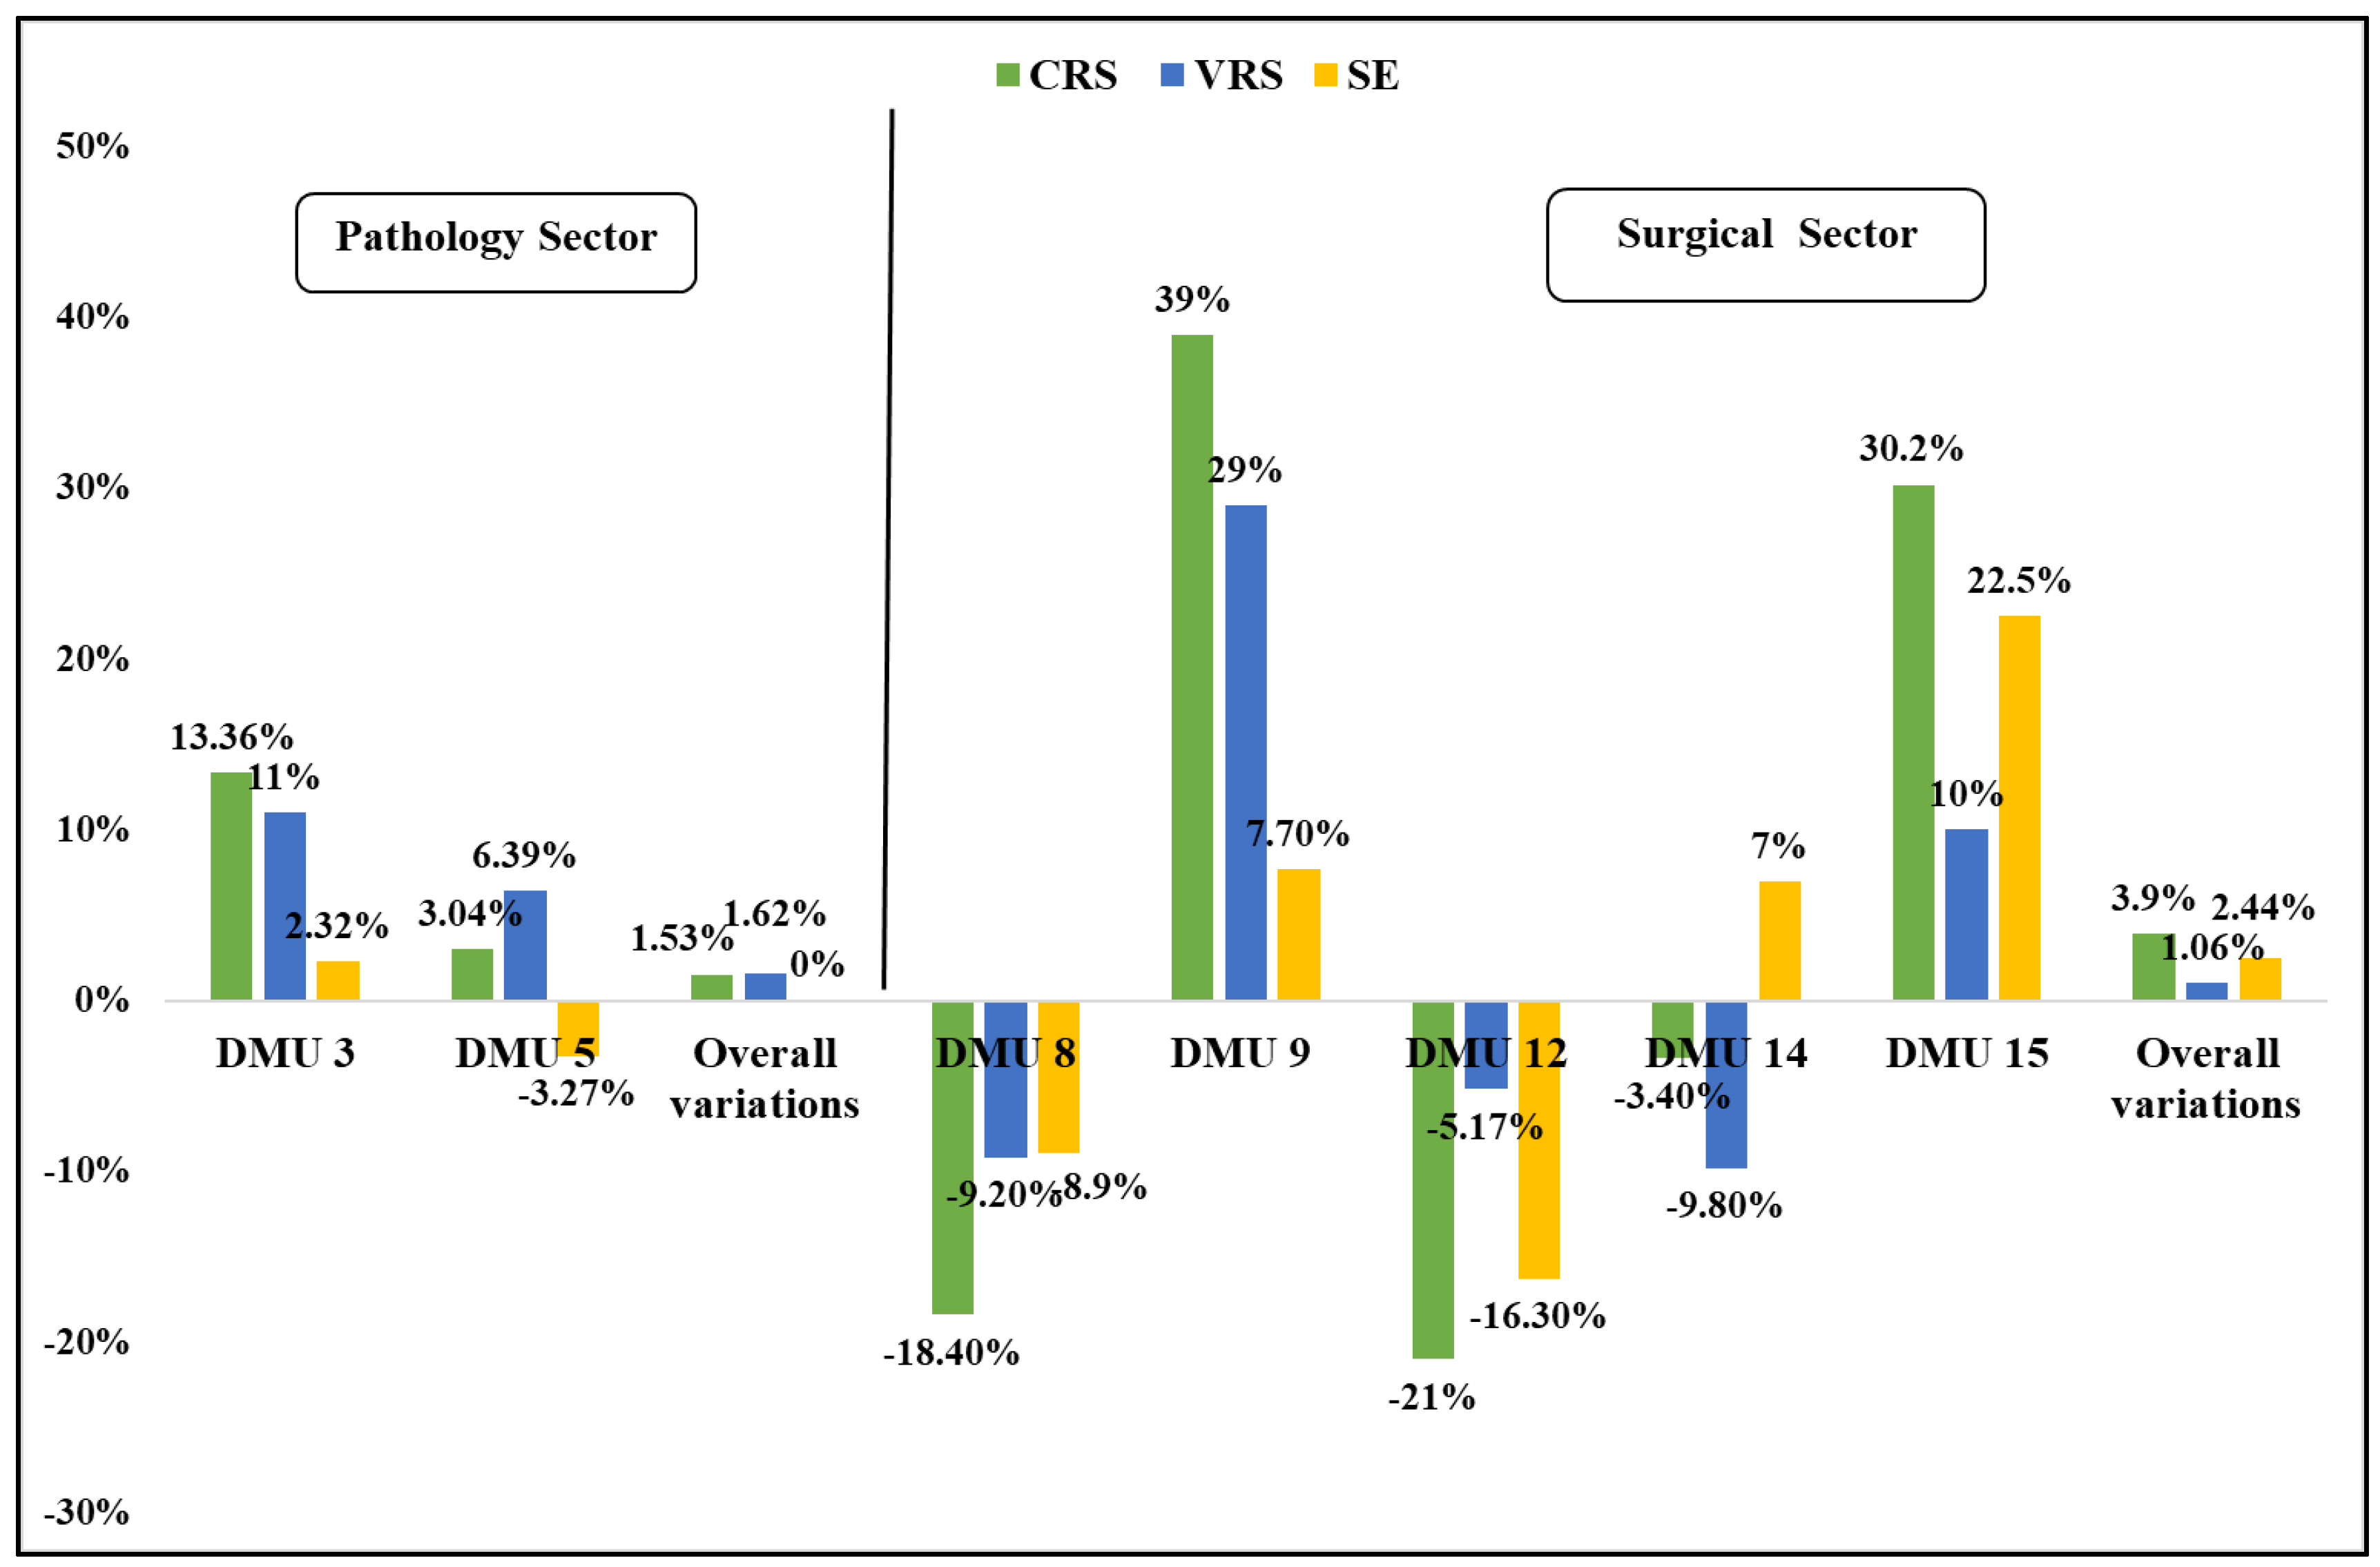
3.1. Analysis of Efficiency
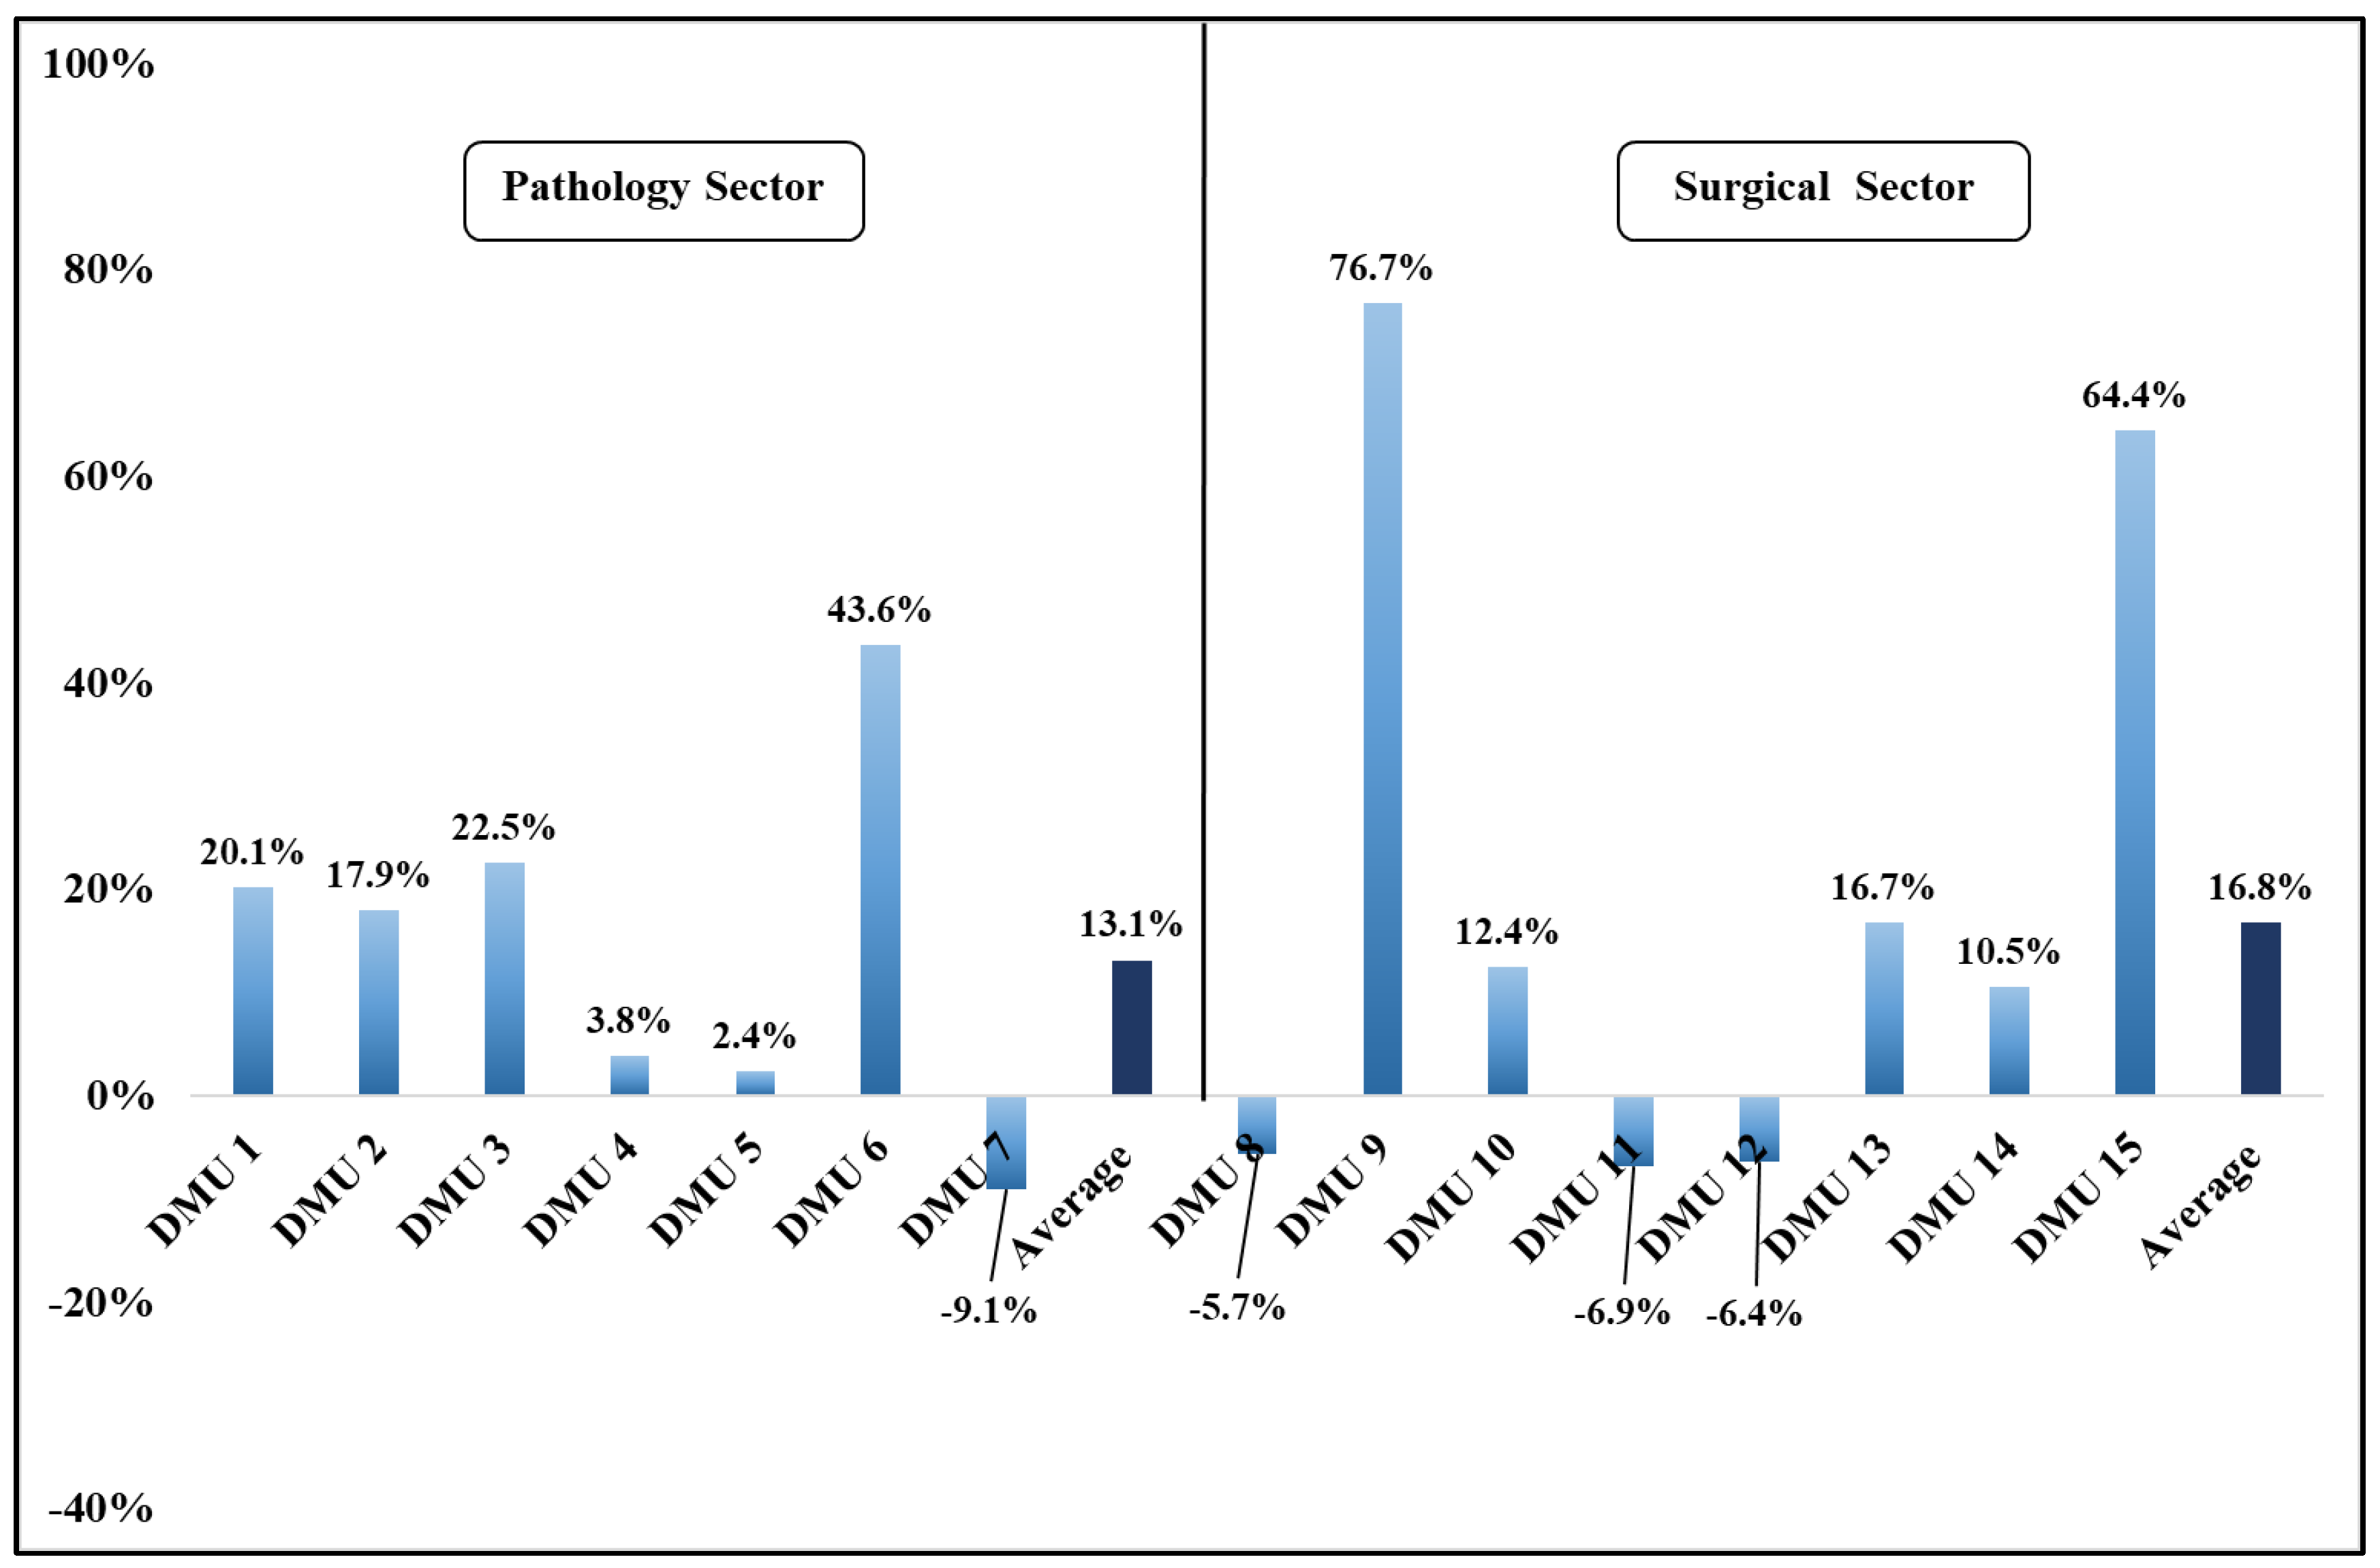
3.2. Analysis of Productivity
4. Discussion
Limitations of the Study
5. Conclusions
Author Contributions
Funding
Institutional Review Board Statement
Informed Consent Statement
Data Availability Statement
Acknowledgments
Conflicts of Interest
Disclaimer
References
- World Health Organization. Health Systems Resilience during COVID-19: Lessons for Building Back Better; European Observatory on Health Systems and Policies: Brussels, Belgium, 2021. [Google Scholar]
- Androutsou, L.; Latsou, D.; Geitona, M. Health Systems Challenges and Responses for Recovery in the Pre and Post COVID-19 Era. J. Serv. Sci. Manag. 2021, 14, 444–460. [Google Scholar] [CrossRef]
- European Commission. Eurostat How Much Did Governments Spend on Health in 2020? 2022. Available online: https://ec.europa.eu/eurostat/web/products-eurostat-news/-/ddn-20220311-1 (accessed on 20 June 2022).
- Lupu, D.; Tiganasu, R. COVID-19 and the efficiency of health systems in Europe. Health Econ. Rev. 2022, 12, 14. [Google Scholar] [CrossRef] [PubMed]
- Palmer, S.; Torgerson, D. Definitions of efficiency. BMJ 1999, 318, 1136. [Google Scholar] [CrossRef]
- Hollingworth, B. Non-Parametric and Parametric Applications Measuring Efficiency in Health Care. Health Care Manag. Sci. 2003, 6, 203–218. [Google Scholar] [CrossRef] [PubMed]
- Färe, R.; Primont, D. Multi-Output Production and Quality: Theory and Applications; Kluwer Academic Publishers: Boston, MA, USA, 1995. [Google Scholar]
- Fried, H.; Lovell, C.; Schmidt, S. The Measurement of Productive Efficiency; Oxford University Press: New York, NY, USA, 1993. [Google Scholar]
- Charnes, A.; Cooper, W.; Rhodes, E. Measuring efficiency of decision-making units. Eur. J. Oper. Res. 1978, 2, 429–444. [Google Scholar] [CrossRef]
- Banker, R.; Morey, R. The use of categorical variables in data envelopment analysis. Manag. Sci. 1986, 32, 1613–1627. [Google Scholar] [CrossRef]
- Banker, R.; Charnes, A.; Cooper, W. Some models for estimation of technical and scale efficiencies in data envelopment analysis. Manag. Sci. 1984, 30, 1078–1092. [Google Scholar] [CrossRef]
- Färe, R.; Grosskopf, S.; Lindgren, B.; Roos, P. Productivity Developments in Swedish Hospitals: A Malmquist Output Index Approach. In Data Envelopment Analysis: Theory, Methodology, and Applications; Springer: Dordrecht, The Netherlands, 1994. [Google Scholar] [CrossRef]
- Hollingsworth, B.; Dawson, P.; Maniadakis, N. Efficiency measurement of health care: A review of non-parametric methods and applications. Health Care Man. Sci. 1999, 2, 161–172. [Google Scholar] [CrossRef]
- Malmquist, S. Index numbers and indifference curves. Trabajos de Estatistica 1953, 4, 1209–1242. [Google Scholar] [CrossRef]
- Caves, D.W.; Christensen, L.R.; Diewert, W.E. The economic theory of index numbers and measurement of input, output and productivity. Econometrica 1982, 50, 1393–1414. [Google Scholar] [CrossRef]
- Coelli, T.; Perelman, S. Efficiency Measurement, Multiple-Output Technologies and Distance Functions: With Application to European Railways; CREPP, University of Liege: Liège, Belgium, 1996. [Google Scholar]
- Charnes, A.; Cooper, W.W.; Lewin, A.Y.; Seiford, L.M. Data Envelopment Analysis: Theory, Methodology and Applications; Kluwer Academic Publisher: Boston, MA, USA, 1994. [Google Scholar]
- Coelli, T.J. A Guide to DEAP, Version 2.1: A Data Envelopment Analysis (Computer) Program; Working Paper, Papers No. 8/96; Center for Efficiency and Productivity Analysis, Department of Econometrics, University of New England: Armidale, NSW, Australia, 1996. [Google Scholar]
- Coelli, T.; Perelman, S. Comparison of parametric and nonparametric distance functions: With application to European railways. Eur. J. Oper. Res. 1999, 117, 326–339. [Google Scholar] [CrossRef]
- Coelli, T.; Rao, D.; Battase, G.E. An Introduction to Efficiency and Productivity Analysis; Kluwer: Boston, MA, USA, 1998. [Google Scholar]
- Newhouse, J.P. Frontier estimation: How useful a tool for health economics? J. Health Econ. 1994, 13, 317–322. [Google Scholar] [CrossRef] [PubMed]
- Cooper, W.; Seiford, L.; Tone, K. Introduction to Data Envelopment Analysis and Its Uses; Springer Sci.: New York, NY, USA, 2006. [Google Scholar]
- Cooper, W.; Seiford, L.; Kaoru, T. Data Envelopment Analysis: A Comprehensive Text with Models, Applications, References and DEA-Solver Software, 2nd ed.; Springer: New York, NY, USA, 2007. [Google Scholar]
- Ozcan, Y. Health Care Benchmarking and Performance Evaluation. An Assessment Using Data Envelopment Analysis (DEA); International Series in Operations Research & Management Science; Springer: New York, NY, USA, 2008. [Google Scholar]
- Färe, R.; Grosskopf, S.; Margaritis, D. The diet problem and DEA. J. Oper. Res. Soc. 2011, 62, 1420–1422. [Google Scholar] [CrossRef]
- Ferrier, G.; Rosko, M.; Valdmanis, V. Response to modelling and notation of DEA with strong and weak disposable outputs. Health Care Manag. Sci. 2011, 14, 389–390. [Google Scholar] [CrossRef][Green Version]
- Ferrier, G.; Trivitt, J. Incorporating quality into the measurement of hospital efficiency: A double DEA approach. J. Product. Anal. 2013, 40, 337–355. [Google Scholar] [CrossRef]
- Chilingerian, J.; Sherman, D. Health-Care Applications: From Hospitals to Physicians, from Productive Efficiency to Quality Frontiers. In Handbook on Data Envelopment Analysis; International Series in Operations Research & Management Science; Cooper, W., Seiford, L., Zhu, J., Eds.; Springer: Boston, MA, USA, 2011; Volume 164. [Google Scholar] [CrossRef]
- Charles, V.; Färe, R.; Grosskopf, S. A translation invariant pure DEA model. Eur. J. Oper. Res. 2016, 249, 390–392. [Google Scholar] [CrossRef]
- Zakowska, I.; Godycki-Cwirko, M. Data envelopment analysis applications in primary health care: A systematic review. Fam. Pract. 2020, 37, 147–153. Available online: https://pubmed.ncbi.nlm.nih.gov/31605609/ (accessed on 8 November 2022). [CrossRef]
- Emrouznejad, A.; Yang, G. A survey and analysis of the first 40 years of scholarly literature in DEA: 1978–2016. Socio-Econ. Plan. Sci. 2017, 61, 4–8. [Google Scholar] [CrossRef]
- Kontodimopoulos, N.; Niakas, D. A 12-year Analysis of Malmquist Total Factor Productivity in Dialysis Facilities. J. Med. Syst. 2006, 30, 333–342. [Google Scholar] [CrossRef]
- Prezerakos, P.; Maniadakis, N.; Kaitelidou, N.; Kotsopoulos, N. Measuring across hospital efficiency and productivity: The case of second Regional Health Authority of Attica. Eur. Res. Stud. 2007, 10, 83–96. [Google Scholar] [CrossRef]
- Kontodimopoulos, N.; Moschovakis, G.; Aletras, V.; Niakas, D. The effect of environmental factors on technical and scale efficiency of primary health care providers in Greece. Cost Eff. Resour. Alloc. 2007, 5, 14. [Google Scholar] [CrossRef] [PubMed]
- Kontodimopoulos, N.; Nanos, P.; Niakas, D. Balancing efficiency of health services and equity of access in remote areas in Greece. Health Policy 2006, 76, 49–57. [Google Scholar] [CrossRef]
- Aletras, V.; Kontodimopoulos, N.; Zagouldoudis, A.; Niakas, D. The short-term effect on technical and scale efficiency in establishing regional health systems and general management in Greek NHS hospitals. Health Policy 2007, 83, 236–245. [Google Scholar] [CrossRef] [PubMed]
- Katharaki, M. Approaching the management of hospital units with an operation research technique: The case of 32 Greek obstetrics and gynecology public units. Health Policy 2008, 85, 19–31. [Google Scholar] [CrossRef] [PubMed]
- O’Neill, L.; Rauner, M.; Heidenberger, K.; Kraus, M. A cross-national comparison and taxonomy of DEA-based hospital efficiency studies. Socio-Econ. Plan. Sci. 2008, 42, 158–189. [Google Scholar] [CrossRef]
- Maniadakis, N.; Kotsopoulos, N.; Prezerakos, P.; Yfantopoulos, J. Measuring intra-hospital clinic efficiency and productivity: Application to a Greek university general hospital. Eur. Res. Stud. 2007, 11, 95–100. [Google Scholar]
- Halkos, G.E.; Tzeremes, N.G. A conditional nonparametric analysis for measuring the efficiency of regional public healthcare delivery: An application to Greek prefectures. Health Policy 2011, 103, 73–82. [Google Scholar] [CrossRef]
- Geitona, M.; Androutsou, L.; Theodoratou, D. Cost estimation of patients admitted to the intensive care unit: A case study of the Teaching University Hospital of Thessaly. J. Med. Econ. 2010, 13, 179–184. [Google Scholar] [CrossRef]
- Androutsou, L.; Geitona, M.; Yfantopoulos, J. Measuring efficiency and productivity across hospitals in the regional health authority of Thessaly, in Greece. J. Health Manag. 2011, 13, 121–140. [Google Scholar] [CrossRef]
- Polyzos, N. A three-year Performance Evaluation of the NHS Hospitals in Greece. Hippokratia 2012, 16, 350–355. Available online: https://www.ncbi.nlm.nih.gov/pmc/articles/PMC3738611/ (accessed on 6 November 2022).
- Karagianni, R. Technical and Scale Efficiency of Public Hospitals in Greece. Greek Econ. Outlook 2012, 12, 66–70. [Google Scholar]
- Kounetas, K.; Papathanassopoulos, F. How efficient are Greek Hospitals? A case study using a double bootstrap DEA approach. Eur. J. Health Econ. 2013, 14, 979–994. Available online: https://www.jstor.org/stable/42002304 (accessed on 7 November 2022). [CrossRef] [PubMed]
- Cheng, Z.; Tao, H.; Cai, M.; Lin, H.; Lin, X.; Shu, Q.; Zhang, R. Technical efficiency and productivity of Chinese county hospitals: An exploratory study in Henan province, China. BMJ Open 2015, 5, e007267. [Google Scholar] [CrossRef] [PubMed]
- Xenos, P.; Nektarios, M.; Constantopoulos, A.; Yfantopoulos, J. Two-stage hospital efficiency analysis including qualitative evidence: A Greek case. J. Hosp. Adm. 2016, 5, 1. [Google Scholar] [CrossRef]
- Xenos, P.; Yfantopoulos, J.; Nektarios, M.; Polyzos, N.; Tinios, P.; Constantopoulos, A. Efficiency and productivity assessment of public hospitals in Greece during the crisis period 2009–2012. Cost Eff. Resour. Alloc. 2017, 15, 6. [Google Scholar] [CrossRef]
- Flokou, A.; Aletras, V.; Niakas, D. Decomposition of potential efficiency gains from hospital mergers in Greece. Health Care Manag. Sci. 2017, 20, 467–484. [Google Scholar] [CrossRef]
- Geitona, M.; Androutsou, L.; Yfantopoulos, G. Efficiency Assessment across Homogeneous Specialty Clinics in the Region of Thessaly, Greece. Open Public Health J. 2013, 6, 11–20. [Google Scholar] [CrossRef][Green Version]
- Ancarani, A.; Di Mauro, C.; Gitto, S.; Mancuso, P.; Ayach, A. Technology acquisition and efficiency in Dubai hospitals. Technol. Forecast. Soc. Change 2016, 13, 475–485. [Google Scholar] [CrossRef]
- Magnusen, J.; Nyland, K. Measuring efficiency in clinical departments. Health Policy 2008, 87, 1–7. [Google Scholar] [CrossRef]
- Kousi, T.; Mitsi, L.C.; Simos, J. The early stage of COVID-19 outbreak in Greece: A review of the National response and the socioeconomic impact. Int. J. Environ. Health Res. 2021, 18, 322. [Google Scholar] [CrossRef]
- Ladi, S.; Angelou, A.; Panagiotatou, D. Regaining trust: Evidence-informed policymaking during the first phase of the COVID-19 crisis in Greece. South Eur. Soc. Politics 2021, 1–26. [Google Scholar] [CrossRef]
- European Commission. Greece: Details of Greece’s Support Measures to Help Citizens and Companies during the Significant Economic Impact of the Coronavirus Pandemic. 2022. Available online: https://ec.europa.eu/info/live-work-travel-eu/coronavirus-response/jobs-and-economy-during-coronavirus-pandemic/state-aid-cases/greece_en (accessed on 10 May 2022).
- Hellenic Statistical Authority. Population-Housing Census–2021. 2022. Available online: https://elstat-outsourcers.statistics.gr/Census2022_GR.pdf (accessed on 10 August 2022). (In Greek).
- Brown, M.; Popkin, J. A measure of technological change and returns to scale. Rev. Econ. Stat. 1962, 44, 402–411. [Google Scholar] [CrossRef]
- Farrell, M.J. The measurement of productivity efficiency. J. R. Stat. Soc. 1957, 120, 153–281. [Google Scholar] [CrossRef]
- Lovell, C. Production Frontiers and Productive Efficiency in the Measurement of Productive Efficiency: Techniques and Applications. In The Measurement of Productive Efficiency: Techniques and Applications; Fried, H.O., Schmidt, S.S., Lovell, C.K., Eds.; Oxford University Press: New York, NY, USA, 1993; pp. 3–67. [Google Scholar]
- McCallion, G.; Colin Glass, J.; Jackson, R.; Kerr, C.A.; McKillop, D.G. Investigating productivity change and hospital size: A nonparametric frontier approach. Appl. Econ. 2000, 32, 161–174. [Google Scholar] [CrossRef]
- Ferrier, G.D.; Valdmanis, V.G. Efficiency and Productivity Changes in Large Urban Hospitals 1994–2002: Ownership, Markets and the Uninsured. In Advanced in Health Economics and Health Service Research: Evaluating Hospital Policy and Performance; Blank, J.L.T., Valdmanis, V.G., Eds.; Contributions from Hospital Policy and Productivity Research: New York, NY, USA, 2008. [Google Scholar]
- Chowdhury, Z.V.; Wodchis, W.; Laporte, A. Efficiency and Technological Change in Health Care Services in Ontario. Int. J. Product. Perform. Manag. 2010, 60, 721–745. Available online: https://ideas.repec.org/p/qld/uqcepa/54.html (accessed on 8 September 2022). [CrossRef]
- Chai, P.; Zhang, Y.; Zhou, M.; Liu, S.; Kinfu, Y. Technical and scale efficiency of provincial health systems in China: A bootstrapping data envelopment analysis. BMJ Open 2019, 9, e027539. [Google Scholar] [CrossRef]
- Ozcan, Y.A.; Roice, D.L. Health Care Delivery Restructuring and Productivity Change: Assessing the Veterans Integrated Service Network (VISNs) Using the Malmquist Approach. Med. Care Res. Rev. 2010, 68 (Suppl. 1), 20S–35S. [Google Scholar] [CrossRef]
- Sahin, B.; İlgün, G. Assessment of the impact of public hospital associations (PHAs) on the efficiency of hospitals under the Ministry of health in Turkey with data envelopment analysis. Health Care Manag. Sci. 2019, 22, 437–446. [Google Scholar] [CrossRef]
- Selamzade, F.; Yuksl, O. Examination of efficiency Change of Provincial Hospital in Azerbaijan with Malmquist Index. J. Int. Health Sci. Manag. 2021, 7, 14–53. [Google Scholar] [CrossRef]
- Shaikh, Z.M. Zuber’s Coronavirus Disease (COVID-19), Standards for Hospitals. Int. J. Health Sci. Pharm. 2021, 5, 2581–6411. [Google Scholar] [CrossRef]
- Giancotti, M.; Guglielmo, A.; Mauro, M. Efficiency and optimal size of hospitals: Results of a systemic search. PLoS ONE 2017, 12, e0174533. Available online: https://journals.plos.org/plosone/article?id=10.1371/journal.pone.0174533 (accessed on 2 September 2022). [CrossRef] [PubMed]
- Alatawi, A.D.; Niessen, L.W.; Khan, J.A. Efficiency evaluation of public hospitals in Saudi Arabia: An application of data envelopment analysis. BMJ Open 2020, 10, e031924. [Google Scholar] [CrossRef] [PubMed]
- Coyle, D.; Dreesbeimdieck, K.; Manley, A. Productivity in UK healthcare during and after the Covid-19 pandemic. Natl. Inst. Econ. Rev. 2021, 258, 90–116. [Google Scholar] [CrossRef]
- Medarević, A.; Vuković, D. Efficiency and Productivity of Public Hospitals in Serbia Using DEA-Malmquist Model and Tobit Regression Model, 2015–2019. Int. J. Environ. Health Res. 2021, 18, 12475. [Google Scholar] [CrossRef]
- Ferraz, D.; Mariano, E.; Manzine, P.; Moralles, H.; Morceiro, P.; Torres, B.; de Almeida, M.R.; Soares de Mello, J.C.; Rebelatto, D.A.D.N. COVID health structure index: The vulnerability of Brazilian microregions. Soc. Indic. Res. 2021, 158, 197–215. [Google Scholar] [CrossRef] [PubMed]
- Lytra, T.; Tsiordas, S. Total patient load, regional disparities and in-hospital mortality of intubated COVID-19 patients in Greece, from September 2020 to May 2021. Scand. J. Public Health 2022, 50, 671–675. [Google Scholar] [CrossRef]
- Nepomuceno, T.C.; Wilka, M.N.S.; Nepomuceno, K.T.C.; Barros, I.K.F. A DEA-based complexity of needs approach for hospital beds evacuation during the COVID-19 outbreak. J. Healthc. Eng. 2020, 2020, 8857553. [Google Scholar] [CrossRef]
- Nunes, A.; Ferreira, D. Evaluating Portuguese Public Hospitals Performance: Any Difference Before and During COVID-19? Preprints 2022, 2022100201. [Google Scholar] [CrossRef]
- Nurhafiza, M.H.; Ming-Miin, Y.; Kok, F.S. Assessing the efficiency of Malaysia health-system in COVID-19 prevention and treatment response. Health Care Manag. Sci. 2021, 24, 273–285. [Google Scholar] [CrossRef]
- Kamel, M.A.; Mousa, M.E. Measuring operational efficiency of isolation hospitals during COVID-19 pandemic using data envelopment analysis: A case of Egypt. Benchmarking Int. J. 2021, 28, 2178–2201. Available online: https://pesquisa.bvsalud.org/global-literature-on-novel-coronavirus-2019-ncov/resource/pt/covidwho-1062959 (accessed on 2 September 2022). [CrossRef]
- Klein, M.G.; Cheng, C.J.; Lii, E.; Mao, K.; Mesbahi, H.; Zhu, T.; Muckstadt, J.A.; Hupert, N. COVID-19 Models for Hospital Surge Capacity Planning: A Systematic Review. Disaster Med. Public Health Prep. 2022, 16, 390–397. [Google Scholar] [CrossRef] [PubMed]
- Maniadakis, N.; Thanassoulis, E. Assessing productivity changes in UK hospitals reflecting technology and input prices. Appl. Econ. 2000, 32, 1575–1589. [Google Scholar] [CrossRef]
- Athanassopoulos, A.D.; Gounaris, C. Assessing the technical and allocative of hospital allocations in Greece and its resource allocation implications. Eur. J. Oper. Res. 2001, 133, 416–431. [Google Scholar] [CrossRef]
- Tsekouras, K.; Papathanassopoulos, F.; Kounetas, K.; Pappous, G. Does the adoption of new technology boost productive efficiency in the public sector? The case of ICUs system. Int. J. Prod. Econ. 2010, 128, 427–433. [Google Scholar] [CrossRef]
- Dimas, G.; Goula, A.; Soulis, S. Productive performance and its components in Greek public hospitals. Oper. Res. 2012, 12, 15–27. [Google Scholar] [CrossRef]
- Mitropoulos, P.; Mitropoulos, I.; Giannikos, I. Combining DEA with location analysis for the effective consolidation of services in the health sector. Comput. Oper. Res. 2013, 40, 2241–2250. [Google Scholar] [CrossRef]


| Clinics of the Pathology Sector | Clinics of the Surgical Sector |
|---|---|
| DMU 1: Hematology | DMU 8: A’ Surgery-COVID-19 |
| DMU 2: Cardiology | DMU 9: B’ Surgery |
| DMU 3: A’ Pathology–COVID-19 | DMU 10: Obstetrics and Gynecology |
| DMU 4: B’ Pathology | DMU 11: Urology |
| DMU 5: Pediatric | DMU 12: Ear, Nose, Throat (E.N.T.) |
| DMU 6: Neurology | DMU 13: Ophthalmology |
| DMU 7: Gastroenterology | DMU 14: Orthopedics DMU 15: Neurosurgery |
| Total number of clinics: 7 | Total number of clinics: 8 |
| CRS | VRS | SE-CRS/VRS | ||||
|---|---|---|---|---|---|---|
| DMU | 2020 | 2021 | 2020 | 2021 | 2020 | 2021 |
| Pathology Sector | ||||||
| DMU 1 | 1.000 | 1.000 | 1.000 | 1.000 | 1.000 | 1.000 |
| DMU 2 | 1.000 | 1.000 | 1.000 | 1.000 | 1.000 | 1.000 |
| DMU 3 | 0.651 | 0.738 | 0.686 | 0.761 | 0.948 | 0.970 |
| DMU 4 | 1.000 | 1.000 | 1.000 | 1.000 | 1.000 | 1.000 |
| DMU 5 | 0.296 | 0.305 | 0.360 | 0.383 | 0.824 | 0.797 |
| DMU 6 | 1.000 | 1.000 | 1.000 | 1.000 | 1.000 | 1.000 |
| DMU 7 | 1.000 | 1.000 | 1.000 | 1.000 | 1.000 | 1.000 |
| Average | 0.850 | 0.863 | 0.864 | 0.878 | 0.967 | 0.967 |
| Surgical Sector | ||||||
| DMU 8 | 0.934 | 0.762 | 0.982 | 0.879 | 0.951 | 0.867 |
| DMU 9 | 0.720 | 1.000 | 0.775 | 1.000 | 0.929 | 1.000 |
| DMU 10 | 1.000 | 1.000 | 1.000 | 1.000 | 1.000 | 1.000 |
| DMU 11 | 1.000 | 1.000 | 1.000 | 1.000 | 1.000 | 1.000 |
| DMU 12 | 0.552 | 0.436 | 0.848 | 0.800 | 0.651 | 0.545 |
| DMU 13 | 1.000 | 1.000 | 1.000 | 1.000 | 1.000 | 1.000 |
| DMU 14 | 0.912 | 0.881 | 1.000 | 0.902 | 0.912 | 0.976 |
| DMU 15 | 0.698 | 1.000 | 0.901 | 1.000 | 0.775 | 1.000 |
| Average | 0.852 | 0.885 | 0.938 | 0.948 | 0.902 | 0.924 |
| DMU | EFFCH | TECHCH | PECH | SECH | TFPCH |
|---|---|---|---|---|---|
| Pathology Sector | |||||
| DMU 1 | 1.000 | 1.201 | 1.000 | 1.000 | 1.201 |
| DMU 2 | 1.000 | 1.179 | 1.000 | 1.000 | 1.179 |
| DMU 3 | 1.134 | 1.080 | 1.109 | 1.022 | 1.225 |
| DMU 4 | 1.000 | 1.038 | 1.000 | 1.000 | 1.038 |
| DMU 5 | 1.030 | 0.994 | 1.065 | 0.967 | 1.024 |
| DMU 6 | 1.000 | 1.436 | 1.000 | 1.000 | 1.436 |
| DMU 7 | 1.000 | 0.909 | 1.000 | 1.000 | 0.909 |
| Average | 1.022 | 1.109 | 1.024 | 0.998 | 1.134 |
| Surgical Sector | |||||
| DMU 8 | 0.816 | 1.156 | 0.895 | 0.912 | 0.943 |
| DMU 9 | 1.389 | 1.272 | 1.290 | 1.077 | 1.767 |
| DMU 10 | 1.000 | 1.124 | 1.000 | 1.000 | 1.124 |
| DMU 11 | 1.000 | 0.931 | 1.000 | 1.000 | 0.931 |
| DMU 12 | 0.790 | 1.186 | 0.943 | 0.837 | 0.936 |
| DMU 13 | 1.000 | 1.167 | 1.000 | 1.000 | 1.167 |
| DMU 14 | 0.966 | 1.144 | 0.902 | 1.071 | 1.105 |
| DMU 15 | 1.432 | 1.148 | 1.110 | 1.290 | 1.644 |
| Average | 1.023 | 1.137 | 1.011 | 1.016 | 1.168 |
| EFFCH | TECHCH | PECH | SECH | |
|---|---|---|---|---|
| Pathology Sector | ||||
| DMU 1 | 20.1% | |||
| DMU 2 | 17.9% | |||
| DMU 3 | 13.1% | 8.0% | 10.9% | 2.2% |
| DMU 4 | 3.8% | |||
| DMU 5 | 3.0% | −0.6% | 6.5% | −3.3% |
| DMU 6 | 43.6% | |||
| DMU 7 | −9.1% | |||
| Average | 2.2% | 10.9% | 2.4% | −0.2% |
| Surgical Sector | ||||
| DMU 8 | −18.4% | 15.6% | −10.4% | −8.8% |
| DMU 9 | 38.3% | 27.2% | 29.0% | 7.7% |
| DMU 10 | 12.4% | |||
| DMU 11 | −6.9% | |||
| DMU 12 | −21.0% | 18.6% | −5.7% | −16.3% |
| DMU 13 | 16.7% | |||
| DMU 14 | −3.4% | 14.4% | −9.8% | 7.1% |
| DMU 15 | 43.2% | 14.8% | 11.0% | 12.9% |
| Average | 2.3% | 13.7% | 1.1% | 1.6% |
Publisher’s Note: MDPI stays neutral with regard to jurisdictional claims in published maps and institutional affiliations. |
© 2022 by the authors. Licensee MDPI, Basel, Switzerland. This article is an open access article distributed under the terms and conditions of the Creative Commons Attribution (CC BY) license (https://creativecommons.org/licenses/by/4.0/).
Share and Cite
Androutsou, L.; Kokkinos, M.; Latsou, D.; Geitona, M. Assessing the Efficiency and Productivity of the Hospital Clinics on the Island of Rhodes during the COVID-19 Pandemic. Int. J. Environ. Res. Public Health 2022, 19, 15640. https://doi.org/10.3390/ijerph192315640
Androutsou L, Kokkinos M, Latsou D, Geitona M. Assessing the Efficiency and Productivity of the Hospital Clinics on the Island of Rhodes during the COVID-19 Pandemic. International Journal of Environmental Research and Public Health. 2022; 19(23):15640. https://doi.org/10.3390/ijerph192315640
Chicago/Turabian StyleAndroutsou, Lorena, Michail Kokkinos, Dimitra Latsou, and Mary Geitona. 2022. "Assessing the Efficiency and Productivity of the Hospital Clinics on the Island of Rhodes during the COVID-19 Pandemic" International Journal of Environmental Research and Public Health 19, no. 23: 15640. https://doi.org/10.3390/ijerph192315640
APA StyleAndroutsou, L., Kokkinos, M., Latsou, D., & Geitona, M. (2022). Assessing the Efficiency and Productivity of the Hospital Clinics on the Island of Rhodes during the COVID-19 Pandemic. International Journal of Environmental Research and Public Health, 19(23), 15640. https://doi.org/10.3390/ijerph192315640