Article

Social Simulation Model of the Spread and Prevention of the Omicron SARS-CoV-2 Variant

1
School of Computer Science and Technology, Taiyuan University of Science and Technology, Taiyuan 030024, China
2
Institute of Geographic Sciences and Natural Resources Research, Chinese Academy of Sciences, Beijing 100101, China
*
Author to whom correspondence should be addressed.
Axioms 2022, 11(12), 660; https://doi.org/10.3390/axioms11120660
Submission received: 9 September 2022 / Revised: 18 October 2022 / Accepted: 9 November 2022 / Published: 22 November 2022
(This article belongs to the Section Mathematical Analysis)

Abstract

:
The enhanced virulence and infectiousness of the Omicron variant of SARS-CoV-2 is having more significant impacts on certain socioeconomic areas, and rapidly suppressing the spread of the epidemic remains a priority for maintaining public health security throughout the world. Thus, we applied multi-agent modeling theory to create a social simulation model of Omicron variant transmission and prevention and control in order to analyze the virus transmission status in complex urban systems and its changing trends under different interventions. By considering the six municipal districts under the jurisdiction of Taiyuan City as examples, we developed state transition rules between five types of resident agents, mobility and contact behavior rules, and rules for patient admission behavior by hospital agents. We then conducted multi-scenario simulation experiments based on single measures of pharmacological and non-pharmacological interventions under non-governmental control as well as multiple interventions in combination to evaluate the effects of different measures on rapidly suppressing the spread of the epidemic. The experimental results demonstrated the utility of the model and the multi-agent modeling method effectively analyzed the transmission trends for the Omicron variant, thereby allowing a comprehensive diagnosis of the future urban epidemic situation and providing an important scientific basis for exploring more accurate normalized prevention and control measures.

1. Introduction

The outbreak of a novel coronavirus pneumonia attracted worldwide attention as an important event in the history of global public health security. In early 2020, the World Health Organization (WHO) named the disease caused by this pathogen as COVID-19 [1]. Subsequently, the Omicron strain, also known as B. 1.1.529, was first identified in South Africa in November as a variant of the 2021 coronavirus [2]. Omicron spread rapidly to many countries in a short time due to its high viral load and strong infectivity [3]. Within two weeks of its emergence, the Omicron variant had caught the world’s attention by spreading several times faster than the original strain as well as other variants of the virus [4]. It has rapidly become a major epidemic strain in several countries, attracting widespread attention from scholars at home and abroad [5,6,7]. Since the outbreak of the domestic epidemic, the growth of the local epidemic has been controlled to some extent by the active preventive and control measures of the Chinese government and the concerted efforts of the whole country [8,9], but the recurrence of the epidemic in many scattered locations and the long-term isolation and prevention and control initiatives have brought many inconveniences to the daily life of the people. Thus, it seems that the previous preventive and control measures against the original novel coronavirus pneumonia have been unable to fully meet the transmission characteristics of the present and even future mutated strains, and the effectiveness of the existing coronavirus vaccine in blocking the infection of the mutated strains has been somewhat compromised [10]. The transmission of variant strains of Omicron is very different from that of the original novel coronavirus, with stronger infectivity, different symptoms of infection, and greater susceptibility to genetic mutations [11]. Therefore, based on the current knowledge we have about the Omicron variant, there is an urgent need to construct a social simulation model for the transmission and prevention and control of Omicron strains to test the effectiveness of different prevention and control strategies in order to provide decision support for urban virus prevention and control.
In the global cooperative anti-epidemic process, researchers in China and other countries established various models to study the spread of the original coronavirus and its developmental trend [12]. Auto-regressive models, system dynamics models, logistic models, SIR models, and SEIR models are widely used at present. Huaxiong et al. [13] used a logistic model, SIR model, and differential recurrence method to analyze and predict the changes in the epidemic situation in different cities. Annas S et al. [14] improved the SEIR model by introducing vaccine and isolation factors to serve as a reference model for the spread of COVID-19 in Indonesia. Wenjing et al. [15] constructed the directional transmission relationship among confirmed patients according to the contact history published for cases in Anhui Province and constructed an auto-regressive transmission model of the later stage of the epidemic situation in Anhui Province. Bin et al. [16] analyzed outbreak transmission and human contact networks separately by using the SEIR model to simulate artificial social scenarios. Saikia et al. [17] constructed an SEIR model of the COVID-19 epidemic in India by incorporating the time-varying incubation period of the virus and asymptomatic infected individuals in order to analyze and predict the development of the epidemic in India. Ruguo et al. [18] developed an SEIR propagation dynamics model based on complex network theory to simulate different scenarios, and to predict and analyze epidemic inflection points. Li D et al. [19] combined a novel population intelligence algorithm with the SISR model to find the optimal parameters to improve the accuracy of the simulation. Huang J et al. [1] fused temperature and humidity from climate factors into the new crown prediction model to improve the accuracy of the prediction. Most of the aforementioned models were improved based on existing models of infectious diseases to analyze the transmission regularity and factors that influenced the original coronavirus over time, but no studies have been conducted on the transmission characteristics of the new crown variant strains, and the influence of spatial effects, autonomous human decision making, and variability across groups on virus transmission has been ignored.
In the present study, we constructed a social simulation model for the transmission and control of the Omicron virus strain by using the multi-agent simulation method. In particular, we abstracted human beings as agents to simulate the decision-making behavior of micro-agents. We divided humans into groups of different states to analyze the impact on the propagation trend of the virus and to translate the complex response relationship between the agents and the environment layer into the behavior rules of the agents. This method was used to simulate the adaptive changes in the decision-making behavior of residents with changes in the environment to more accurately identify the roles of people in preventing and controlling the spread of the virus. The physical geography and social environment in Taiyuan were taken as an example and the model was used to conduct multi-scenario simulation experiments based on multiple interventions. The different interventions included non-governmental control with a single intervention and a combination of interventions. We analyzed the prevention and control effect of these interventions on the Omicron variant virus strain to comprehensively assess the urban epidemic situation. Our model may help epidemic prevention personnel to conduct epidemiological investigations and adjust the prevention and control strategy in a timely manner, which is of great importance for stopping the spread of the epidemic.

2. Multi-Agent Behavior Design

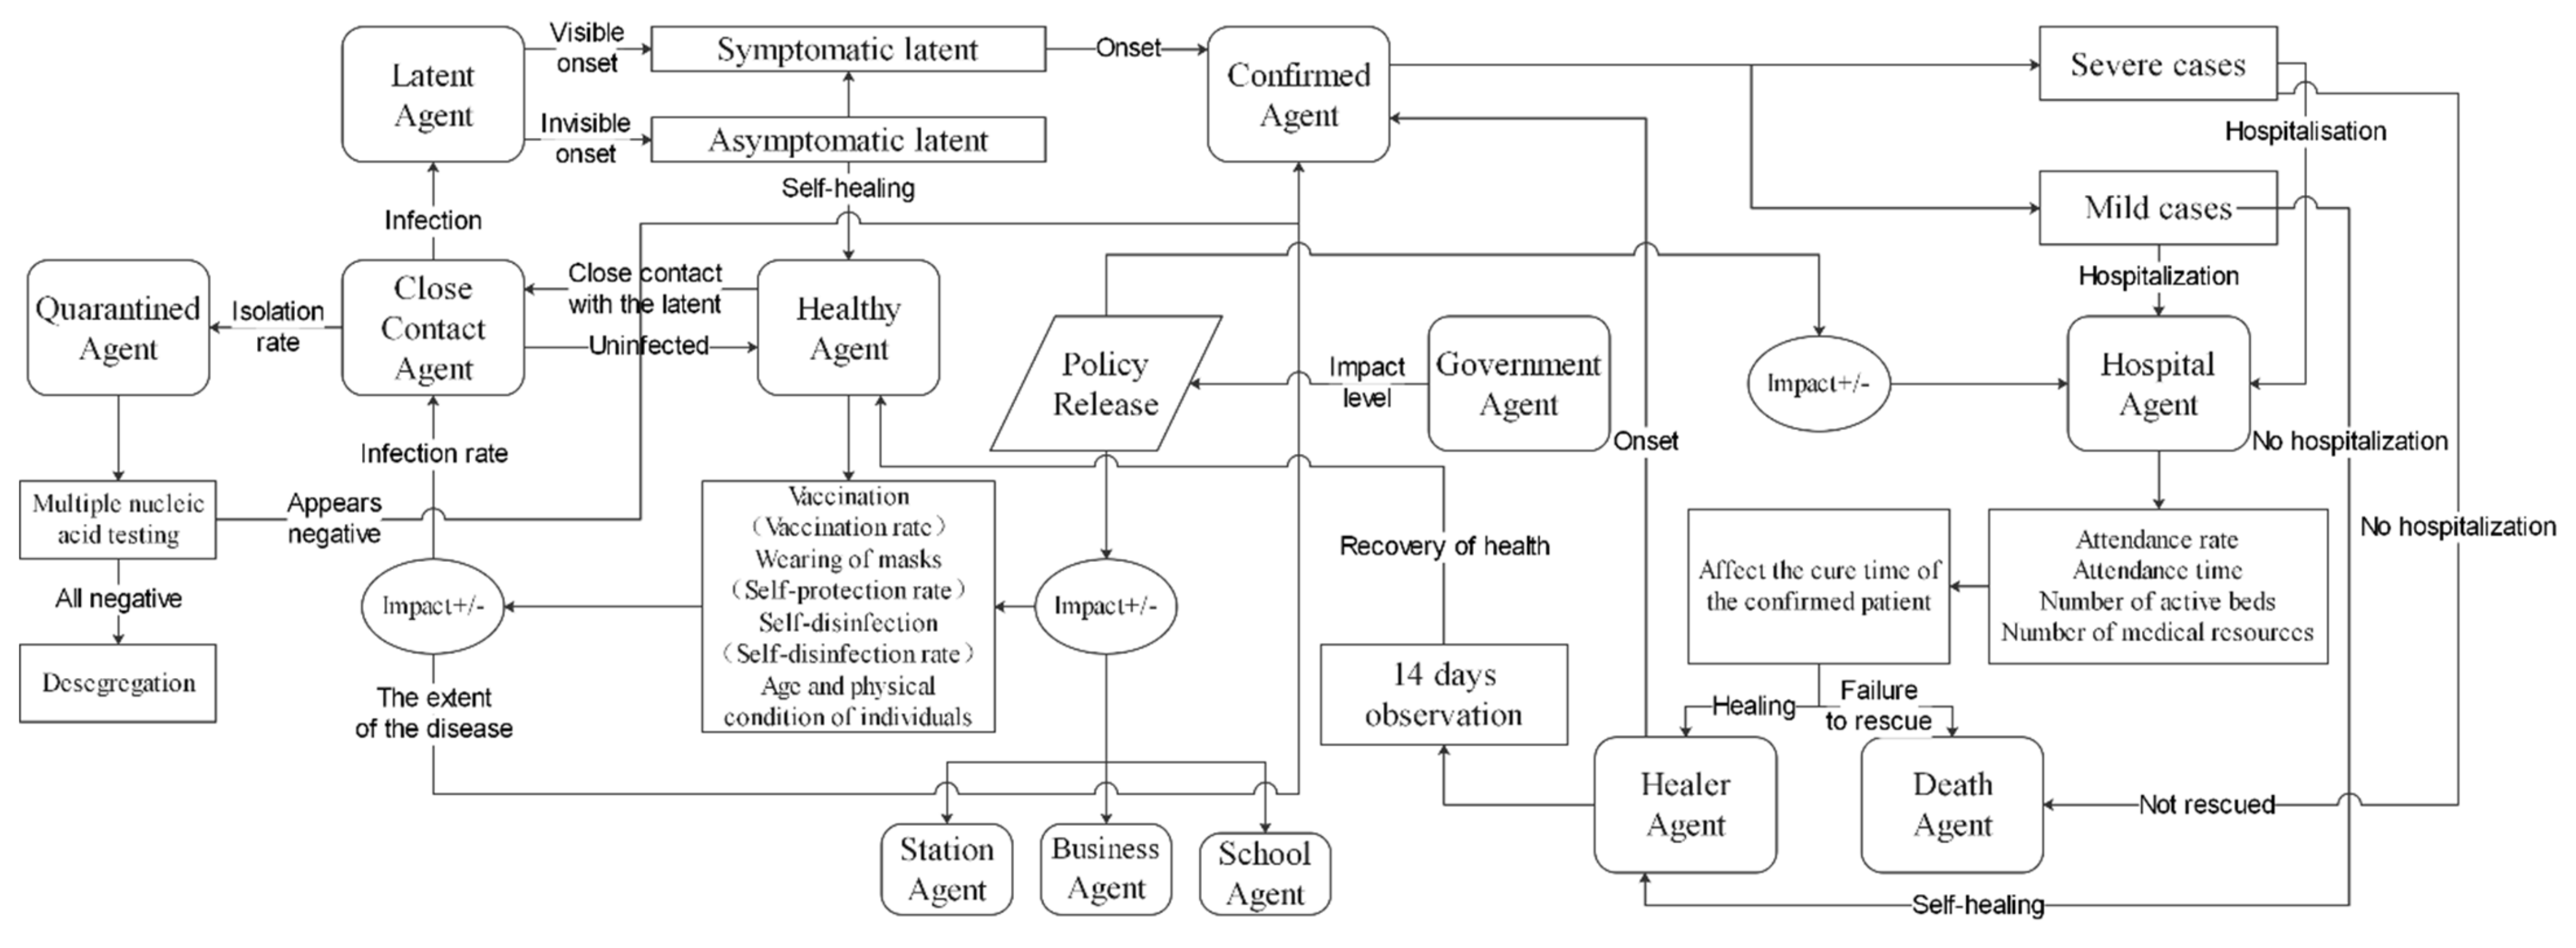
2.1. Overview of Agent Behavior

The social simulation model of the transmission and control of the Omicron virus strain is a virtual simulation system. The changes in the states of the residents, behavioral decisions of residents, adjustment of the response level and prevention and control policy in an urban system to public health emergencies, and the allocation of medical resources are part of a complex interactive process, which is closely connected with time and space via complex dynamics [20,21]. The model contains five types of resident agents, as well as government, hospital, airport, railway station, bus station, university, and business circle agents. The distribution of various resources and environments in the urban social system, locations of various buildings, implementation of different prevention and control measures, and the cooperation of residents with prevention and control measures are the main factors that affect the spread of the epidemic, and the different agents in the model follow certain rules and carry out periodic activities according to the evolution of time and space and the interaction between different agents [22]. These behavioral activities are a realistic reflection of the real Omicron virus transmission and control process.
Based on the perception of the space environment, a resident agent makes its own decision, which leads to the space flow behavior and behavioral state transition under certain conditions. The healthy agent can perceive self-protection behaviors in real time, such as mask wearing, self-disinfection, or vaccination. The latent agent and close contact agent can flow through the relevant tracks, where the healthy agent within a certain range will be affected by close contact behavior and virus infection behavior, and the healthy agent is then transformed into other state agent types. According to the personal prevention and control measures taken previously and the current level of prevention and control, a state transition occurs from a close contact agent to a latent agent or quarantined agent. The quarantined agent is detected by nucleic acid analysis according to a certain time interval and period, and then transformed into a confirmed agent according to the corresponding nucleic acid detection results. The confirmed agent determines the course of the disease through the preventive and control measures taken before the disease is diagnosed, the timely treatment after diagnosis, and its own physical indicators; the hospital agent treats the confirmed agent according to the available effective treatment beds, medical resources, and the number of medical and nursing staff. According to the numbers of currently confirmed agents, close contact agents, and quarantined agents, the station agent, business circle agent, and university agent adjust the prevention and control policy in real time, and conduct inspection behavior or closed behavior to different degrees. For example, inspection may involve one or more combinations of checking itinerary codes, health codes, vaccination records, or a negative certificate for a nucleic acid test. The station agent can also track a confirmed agent after it appears in its jurisdiction and transform a healthy agent into a close contact agent.

2.2. Resident Agent Flow Behavior Rules

In the simulation of Omicron virus transmission and control, the resident agent has anthropomorphic characteristics, and its most important behavior is to move and contact through autonomous decision-making behavior, and its willingness to move is based on a comprehensive index [23,24]. In this model, the quarantined agent and confirmed agent lack mobility, whereas the other three resident agent types make purposeful movements through autonomous decision-making. The initial states of the healthy agents are distributed in the model according to the proportion of the real population distribution in the six municipal districts under the jurisdiction of Taiyuan City in 2020, as shown in Table 1.
Each agent’s initial position L m ( x 1 , y 1 ) is randomly distributed within the designated municipal area, where m is the municipal area code and 1 m 6 , x 1 is the horizontal coordinate of the initial position point, and y 1 is the vertical coordinate of the initial position. The probability of target points flowing to different municipal districts is different. According to the number of people, airports, stations, hospitals, universities, and so on contained in the current municipal area, the principal component analysis method is used to determine the different weights, then, according to the weight of the random factors generated, the flow to the target jurisdiction sequence number. The central limit theorem states that a new variable obtained by combining a large number of random factors with different distributions will eventually have a Gaussian distribution [25]. Applying this theorem to the present model, the points in the current jurisdiction will combine multiple random factors to generate their target location points G m ( x 2 , y 2 ) , x 2 as the horizontal coordinates of the target point, and y 2 as the vertical coordinates of the target point. The selection of the target points is based on many random factors, where the moving target points of the agent are set as random target points with a Gaussian distribution in the specified municipal area.
A social simulation model of Omicron virus transmission and control was developed for the central Chinese city of Taiyuan based on the different population densities, locations of public facilities, and the natural geographical environment in the six municipal districts in Taiyuan. Taiyuan, the capital city of Shanxi Province, is located in the center of Shanxi Province, at the northern end of the Taiyuan Basin, in the middle of the Yellow River Basin in North China. The city has six districts (Xiaodian District, Yingze District, Xinghualing District, Jiancaoping District, Wanbailin District, and Jinyuan District), three counties (Qingxu County, Yangqu County, and Gujiao County), and one county-level city (Gujiao City) under its escrow. As shown in Figure 1, the pink areas are the six municipal districts of Taiyuan simulated by the model. A study was also conducted to select 1:13 of the land in the urban district of Taiyuan, where the grid technique was used to set up the coordinate system for the geographical space.
The resident agent could sense stimuli from surrounding entities and the environment, and react instinctively. In the model, the motivation to move is expressed by F l o w i . The resident agents’ motivation to move increases in the areas around the business circle, railway station, and bus station agents. The willingness to move of resident agents is reduced in the vicinity of university agents according to the number of confirmed agents, close contact agents, and quarantined agents in order to adjust the control policy with a certain weight to affect the flow of resident agents. The individual mobility intention value is the sum of the mean mobility intention and the random mobility intention, as shown in Equation (1):
F l o w i = σ × R m o v e i + μ
where R m o v e i is a Gaussian-distributed random number generated based on the weight of the willingness to flow β j , where β j = { β 1 , β 2 , , β n } , and the cumulative sum of β j is 1. Willingness to flow F l o w i obeys a normal distribution that has a mean of μ and a variance of σ 2 , and the volatility of the value of individual mobility intentions is denoted by σ . The larger the value, the greater the variation in mobility intention among individuals, which affects the distribution pattern as well as the overall mobility intention distribution of the population. μ indicates the mean value of mobility intention, which affects the position of the central axis of the normal distribution. During the iterative modeling process, the normalized value of the individual’s willingness to move, F l o w i , determines whether an agent moves, and where movement occurs when the value is positive. The distance L m ( x 1 , y 1 ) between the initial point G m ( x 2 , y 2 ) and the target point D determines whether the agent has reached the target point, as shown in Equation (2).
D = ( x 2 x 1 ) 2 + ( y 2 y 1 ) 2
If D < 1 , the target point has been reached, where D > 1 indicates that L is still in the process of moving toward G .

2.3. State Transition Rules for Resident Agents

In order to better describe the heterogeneity and stochastic nature of the Omicron virus transmission process, the model represents the resident agent in different states of health, i.e., latent, close contact, quarantined, morbidity, confirmed, death, and cured. During the simulation, the state of the resident agent changes with space and time, as shown in Figure 2.
In the initialization phase of the model, the resident agents are fed into the model according to the population size and health status of the different municipal districts, and different personal preventive and control measures are taken, such as wearing masks and vaccination. The agent exhibits contact behavior during movement (the quarantined agent and confirmed agent do not have the ability to move), and thus the virus propagates to varying degrees. The resident agent generates new state types and completes the corresponding state transitions in the process. The inputs of latent agents at railway stations and airports will make healthy agents in close contact with them transform into close contact agents during their latent movement. A close contact agent will change into a quarantined agent, mobile latent agent, or uninfected mobile close contact agent with a probability that depends on the current level of control and the control measures taken prior to becoming a close contact. During the period of isolation, the quarantined agent undergoes regular nucleic acid testing, and those with negative test results are transformed into healthy agents, whereas those with positive test results are transformed into confirmed agents, who may also be placed in isolation without timely treatment and death could occur. The confirmed agent will determine the probability of minor illness, major illness, death, cure, or the duration of treatment based on the age of the agent, preventive and control measures taken prior to exposure, adequacy of medical resources, and the promptness of treatment.

2.4. Contact Propagation Rules between Agents

Close contact transmission has been the main route of transmission since the outbreak of COVID-19, where people who have close contact with suspected and confirmed cases two days before the onset of the disease and who do not take effective preventive and control measures are defined as close contacts [26]. The COVID-19 Omicron variant is more virulent and contagious, and people who are in the same building two days before the onset of the case are defined as close contacts. Therefore, in the Omicron virus transmission and prevention and control simulation model, a larger spatial safety distance is set for the resident agent. When the distance between the healthy agent and latent agent is less than the safe distance, the state of the healthy agent transforms into a close contact agent and the model sets the close contact area R E as shown in Equation (3):
R E = A r e a ( G r i d i ± G r i d i ± 2 )
where A r e a ( x ) is the area of close contact at risk of infection, which is also known as the Moore domain, and G r i d i is the location of the grid where the latent agents are located. The grid is the basic unit of space in the Omicron virus transmission and prevention and control simulation model, and G r i d i ± 2 denotes the 16 grid cells immediately adjacent to the current grid cell.
Within each simulation time step, healthy agents in the Moore field where the latent agents are located are defined as close contacts and at risk of infection. The probability of infection is influenced by the time spent in this Moore field, the spatial distance from the source of infection, the condition of the agent itself, and the environment where it is located. The close contact agent b infection indicator is assumed to be I n f e c t b ( T ) during the T time period, as shown in Equation (4):
I n f e c t b ( T ) = t 1 t 2 γ ( t 1 t 2 ) K = 1 K V b D ε
where ε 0 , K 1 , and 0 < γ < 1 ; the time period is T = t 2 t 1 , where t 1 is the time of entry within the Moore domain, t 2 is the time of exit from the Moore domain, and γ is the decay rate of infection within time period T . The current close contact agents are assigned different weights to control the decay rate of infection for the time spent within this space and according to the personal precautions taken (wearing masks, vaccinations, etc.), age of the individual, and interventions implemented at the current location (checking trip codes, health codes, vaccination records, etc.). K is the number of all latent agents contacted by the close contact agent b at each moment. V b is the value of the infection received by the close contact agent b on a spatial scale with the current source of infection. D is the spatial distance between the close contact agent and the latent agent, ε is an index of the spatial distance D used to measure the extent to which the spatial distance affects V b , and the effect of spatial distance is not considered if ε = 0 . In the event of a change in the status of a close contact, such as being isolated or diagnosed, the probability of infection and the severity of symptoms following infection are determined by the interval in which the infection indicator is located, which then affects the probability of death and the probability of cure.

2.5. Rules of Conduct for the Admission of Patients to Hospital Agents

Depending on the number of beds, medical resources, and staff available, the hospital agent will admit a certain number of confirmed agents and treat the admitted agents to varying degrees depending on the current situation. The hospital agents in the model are based on 11 hospitals at tertiary level and above in the Taiyuan City district with the capacity to treat patients with novel coronavirus pneumonia, as shown in Table 2.
In this model, when an agent with a positive nucleic acid test is converted into a confirmatory resident agent, a signal is sent to the hospital agent in the current municipal district and the straight-line distance from each hospital agent is calculated, before preferably selecting the closest hospital for admission. Dijkstra’s algorithm is used to select the shortest path from the location of the confirmed agent to the location of the hospital agent by constructing an empty set M and set P covering all vertices on the shortest path. The vertex with the lowest cost in the set P is selected within each simulation time step and transferred to M , before iterating until P is N u l l , where the set M then represents the least costly shortest path, as shown in Equation (5):
A i j = W N o d e s < i , j > a r e   c o n n e c t e d 0 N o d e < i , j > i s   t h e   s a m e N o d e s < i , j > a r e   n o t   c o n n e c t e d
where A i j is the shortest path matrix, W is the weight between two nodes, and < i , j > covers all nodes in the set. The nearest hospital agent is checked to determine whether the hospital has sufficient medical resources and effective beds. If the resources are sufficient immediately on the day, then admission occurs. If the resources are not sufficient, it is necessary to check whether other hospitals can provide delayed treatment within a certain time. The level of medical resources and average response time of the hospital agent on the day determine the final response time as R e s p o n s e t in Equation (6):
R e s p o n s e t = S c o p e [ R a d o m N u m ( a , b ) ] ( E m p t y B e d > 0 V t V min ) ( E m p t y B e d < 0 V t < V min )
where S c o p e ( x ) is the rounding function for the relevant parameters calculated in conjunction with the actual admission of new coronavirus patients to Taiyuan Hospital, where 2–3 days are required to complete professional transport, control, nucleic acid testing, and hospitalization; R a d o m N u m ( a , b ) indicates the generation of a random number between a and b ; E m p t y B e d represents the number of active empty beds in the hospital; and V t represents the current doctor–patient ratio in the hospital calculated with Equation (7):
V t = A m o u n t M e d i c a l S t a f f A m o u n t P a t i e n t
where the current number of health care workers with normal service capacity is denoted by A m o u n t M e d i c a l S t a f f and the number of people who have been admitted to the current hospital agents with a confirmed diagnosis is denoted by A m o u n t P a t i e n t . According to the “Implementation Rules of the Tertiary General Hospital Accreditation Standards,” each tertiary hospital is required to have an average of 0.6 medical and nursing staff per confirmed bed for service, with an adjustable doctor–patient ratio of 0.4 when the patient’s condition remains stable. V t 0.6 indicates that the health care resources are sufficient for the normal services of the hospital agent for the confirmed agent, and 0.4 < V t < 0.6 indicates that the hospital agent services are barely maintained and the medical staff are overworked. V t 0.4 indicates that it is no longer possible to complete the admission of a confirmed agent. According to Equations (8) and (9), each successful admission of a confirmed agent is updated in real time based on the effectiveness of the health care resources and available active beds:
E m p t y B e d t = E m p t y B e d t 1 A m o u n t P a t i e n t _ t
P o w e r t = P o w e r t 1 V t A m o u n t P a t i e n t _ t
where E m p t y B e d t represents the number of active empty beds on day t , the initial value of P o w e r t is the effectiveness of the hospital agent’s health care staff, which changes over time, and A m o u n t P a t i e n t _ t represents the number of confirmed agents admitted on day t . The time required by the hospital agent to cure the confirmed agent is a composite measure with different weights determined using the APH analytic hierarchy process based on the age of the agent, preventive and control measures taken prior to exposure to the virus, rationing of medical resources, and the timeliness of treatment, which affect the probability of minor illness, major illness, death, or cure, as well as the time to treatment, as shown in Equation (10):
C u r e t = i = 1 n α 1 N o r m i
where C u r e t represents the time required to cure, which varies according to the symptoms and time, N o r m i denotes the indicators for the current agent, and α = { α 1 , α 2 , , α n } denotes the weighting given to each indicator.

3. Implementation of a Multi-Agent-Based Model for the Spread and Control of Omicron Strains

In this study, we examined the transmission and prevention and control of the Omicron strain in six different municipal districts of Taiyuan, Shanxi Province to investigate the effects of virus transmission and prevention and control under the complex interactions between changes in the status of residents, their behavioral decisions, the adjustment of intervention policies by different organizations, and the allocation of medical resources in order to provide decision support for urban virus prevention and control. The parameter settings for the control measures model in the example mainly included pharmacological interventions and non-pharmacological interventions. The pharmacological interventions included vaccine interventions and hospital treatment interventions, and the non-pharmacological interventions included wearing masks, self-hygiene protection, closure of premises, restrictions on the movement of people, close contact tracing, and isolation. For each measure, the timing of loading, scope of action, and target group were investigated, as well as the time and proportion of diagnosis, proportion of agents in different states, and proportion of diagnosed persons in different age groups according to the experimental results. In order to ensure the consistency of the modeling results with reality, we used real data from six municipal districts in Taiyuan, Shanxi Province to conduct the simulations, and the main model parameters are shown in Table 3.
The model was loosely integrated with Repast Simphony and ArcGIS using multi-threading techniques, agent state transformation and isolation mechanisms, and Repast prioritization for simulation. The runtime interface of the model is shown in Figure 3, with the view catalogue in the first column on the left of the interface, and it is possible to control the parameters in the corresponding view. The map section of the interface shows the corresponding model spatial environment and the current operational status of virus transmission and prevention. Different landmarks indicate the locations of different spatial agents, where red landmarks indicate hospitals, blue landmarks indicate railway stations, yellow landmarks indicate bus stations, purple landmarks indicate universities, pink landmarks indicate business districts, dark blue landmarks indicate airports, etc. The map shows a healthy agent as a moving green square, a close contact agent as a yellow figure, a quarantined agent as a green house where they are forbidden to move, a latent agent as a blue figure, and a confirmed agent as a red figure. The bottom half of the interface contains statistical charts for the model’s run cycle by counting a series of data, such as the number of resident agents in different states, number of resident agents in each different age group, and the number of confirmed diagnoses under the influence of changes in hospital medical resources, where they are presented in the form of line graphs [32].

Model Validation

To verify the accuracy of the model and parameters, the model was compared with the existing simulation model of COVID-19 virus prevention and control in Taiyuan City [22]. Real data on the spread of the Omicron virus in Taiyuan City in April 2022 were used for the fitting. Since the outbreak of the new coronavirus at the end of 2019, the real society has mastered certain prevention and control measures, such as adhering to the general strategy of “external prevention of importation and internal prevention of rebound” and the general policy of “dynamic clearing”. The vaccination rate in this model is based on the real vaccination situation in Taiyuan City [33], and the daily vaccination changes in the model are based on the vaccination situation in Taiyuan City on that day. The results are shown in Figure 4. Through 48 days of simulation, the cumulative number of confirmed cases in this model was 89, the cumulative number of confirmed cases in the existing model was 117, and the actual number was 83; the cumulative number of latent cases in this model was 283, the cumulative number of latent cases in the existing model was 310, and the actual number was 274; the cumulative number of cured cases in this model was 89, the cumulative number of cured cases in the existing model was 117, and the actual number was 83. The cumulative number of quarantined cases in this model was 1199, the cumulative number of quarantined cases in the existing model was 1245, and the actual number was 1187; the error value of the cumulative number of different states in this model is significantly reduced, and the growth trend better fits the actual data, which can better fit the development trend of the epidemic in Taiyuan.
The existing models take a geographic space that includes counties and regions, and take into account sparsely populated areas that have hardly caused the spread of the epidemic, which affects the accuracy of the spread of the epidemic. In contrast, this model narrows the geographic space to the densely populated municipal districts that are the main cause of the spread of the epidemic, and takes into account factors such as hospitals, stations, shopping areas, and universities that affect the gathering of people as well as the rate of movement. In addition, on the basis of the existing model, the impact of nucleic acid testing, vaccination, close contacts, timeliness of treatment, degree of treatment, distribution of medical resources, analysis of mild and severe cases among confirmed cases on the spread of the epidemic is taken into account, and additional agents such as stations, shopping areas, and colleges will be adjusted in real time according to the current situation of the epidemic in the environment, and the rules of the model are also designed according to the transmission characteristics of the variant strain of Omicron. Therefore, the fitting results of the present model are closer to the real situation of Omicron than the existing models.

4. Analysis of Simulation Scenarios and Experimental Results

4.1. No-Intervention Scenario

In the no-intervention scenario, we simulated the incubation phase of Omicron virus transmission without any intervention, with all resident agents moving freely and without any protection, and without any intervention by the government or any organizational unit at all levels. The model was initially set with vaccination and mask wearing rates of 0, the personal mobility intention was set to the fastest rate of crowd mobility at 0.99, the impact index was set to 0 due to the absence of reductions in the spatial distance of aggregation, the mean time to death was 16.7 days [34], the hospital admission response time was 4 days, the number of beds meeting the management protocol for the management of novel coronavirus pneumonia was 0 and the self-protection rate was 0. Figure 5 shows the changes in the number of resident agents in different states in this scenario.
The number of latent and confirmed cases increased explosively in line with the alarming rate of Omicron virus transmission. The number of confirmed and latent cases began to rise gradually around day 11 due to the lack of interventions at all levels by the joint prevention and control organization. In this scenario, the number of cured patients was zero and deaths continued to occur on day 22 because the hospital agent was currently unable to provide effective treatment and had to rely on the age and physical condition of the latent and confirmed agents to cope with complications. The simulation results showed that the number of latent and confirmed cases increased due to the lack of intervention by the government and organizational units of the joint prevention and control at all levels, lack of medical care to cure confirmed cases, lack of awareness among the population of the danger of the rapid spread of the Omicron virus, lack of restrictions on people’s movements, inability to effectively isolate and treat residents already infected with the Omicron virus, which increased the chance of infection, and the lack of significant suppression of the spread of the Omicron virus based only on the resistance of the resident agent itself (only the age of the individual was considered in this experiment).

4.2. Non-Pharmacological Intervention Scenarios

Self-Hygiene Prevention and Control

In this scenario, we simulated the absence of pharmacological interventions, where the resident agents adopted self-protection measures based on policies issued by government agents with awareness of the dangers of Omicron virus transmission. The main measures comprised wearing masks and autonomous disinfection. The model parameters were based on a no-intervention scenario, with a personal mobility intention of 0 (people reduced their own movements), a self-protection rate of 80%, and spatial distance influence index of 0.5 (individual residents started to protect themselves). The changes in the numbers of various types of resident agents in this scenario are shown in Figure 6.
The resident agents in this scenario adopted various types of self-protection, where wearing a mask as a core self-protection measure reduced exposure transmission by 80% [35]. The rates of increases in confirmed agents and latent agents were slower compared with the no-measures scenario. The number of cured and quarantined agents remained at 0. The proportion of deaths was 2.2% among all confirmed cases, and the ratio of minor to major illnesses among confirmed agents was significantly better than that of the no-measures scenario. The ratio was significantly better than that of the no-measures scenario, thereby suggesting that wearing masks and increased disinfection reduced the risk of serious illness. This experiment showed that although self-protection measures could reduce the chance of being infected to a certain extent, the lack of timely isolation and effective medical treatment for agents carrying the virus made it difficult for these agents to move freely and come into contact with different groups of people, thereby making it difficult to control the rapid spread of the virus, and this situation was still not optimal for the overall prevention and control of the epidemic.

4.3. Drug Intervention Scenarios

4.3.1. Hospital Treatment

In this scenario, we simulated the spread of the Omicron virus under a certain level of care. According to the “Guidelines for the Establishment and Management of Hospitals for the Treatment of New Coronary Pneumonia,” the doctor to nurse ratio should be 1:2.5, and the bed to nurse ratio should 1:1 for mild cases and 1:3 and 1:6 for severe cases. The hospital agents provided a certain number of medical supplies and effective treatment beds for the isolation and treatment of confirmed agents according to this criterion, but otherwise the resident agents remained free to move around without any intervention by the government and organizational units at all levels. The model was initialized with a personal mobility intention of 0 (the fastest rate of population mobility where people reduced their own movement), spatial distance impact index of 0.25 (confirmed individuals were isolated and treated), mean cure time of 14 days for mild cases and 18 days for severe cases [29] (at the highest level of medical care), increased hospital admission response time of two days, and 15% of the total number of beds and total number of health care workers were provided at the medical carrying capacity of each hospital for novel coronavirus pneumonia. The remaining parameters were the same as those in the previous scenario. The changes in the numbers of resident agents in different states and the changes in confirmed diagnosed and cured cases are shown in Figure 7.
The spread of the virus was slowed to some extent because the hospital agents could isolate and treat confirmed agents. As shown in Figure 7a, during the first three days of the spread of the epidemic, the hospital agents mainly identified diseases and ruled out known viruses. After day 2, isolation and medical observation of potential close contact agents began, and the number of quarantined agents continued to increase and peaked at day 16. However, close contacts were not all tracked and isolated due to the lack of government control. Close contacts peaked one day earlier than those isolated and began to decrease after 15 days due to changes in the status of close contacts over a period of time, such as confirmed, continuing latent with the virus, or uninfected to healthy. The confirmed agents continued to rise and peaked at 28 days, as shown in Figure 7b. The proportion of severe cases was larger because there was no agent vaccination in this scenario, and the government did not actively take effective measures such as mandatory tracking and isolation, and the awareness of personal protection was limited, thereby resulting in a much larger proportion of confirmed severe cases than mild cases. The number of confirmed agents cured in a certain period of time was followed by medical isolation observation and nucleic acid testing, and the discharge of cured cases began on day 23 of the simulation. The number of new cures increased each day over time, but the number of confirmed agents tended to decrease. The intersection of the numbers of confirmed and cured cases occurred on day 39, thereby indicating a gradual improvement in the treatment of the Omicron virus by hospital agents. The simulation results showed that the timely medical treatment of confirmed patients reduced their movement and transmission process, thereby inhibiting the spread of the Omicron virus to a certain extent, and the overall transmission trend improved. Thus, in the general epidemic prevention and control environment, all municipalities had sufficient medical resources with the capacity to treat patients with novel coronavirus pneumonia, and the spread of the Omicron virus was still in a manageable stage with effective medical prevention and control.

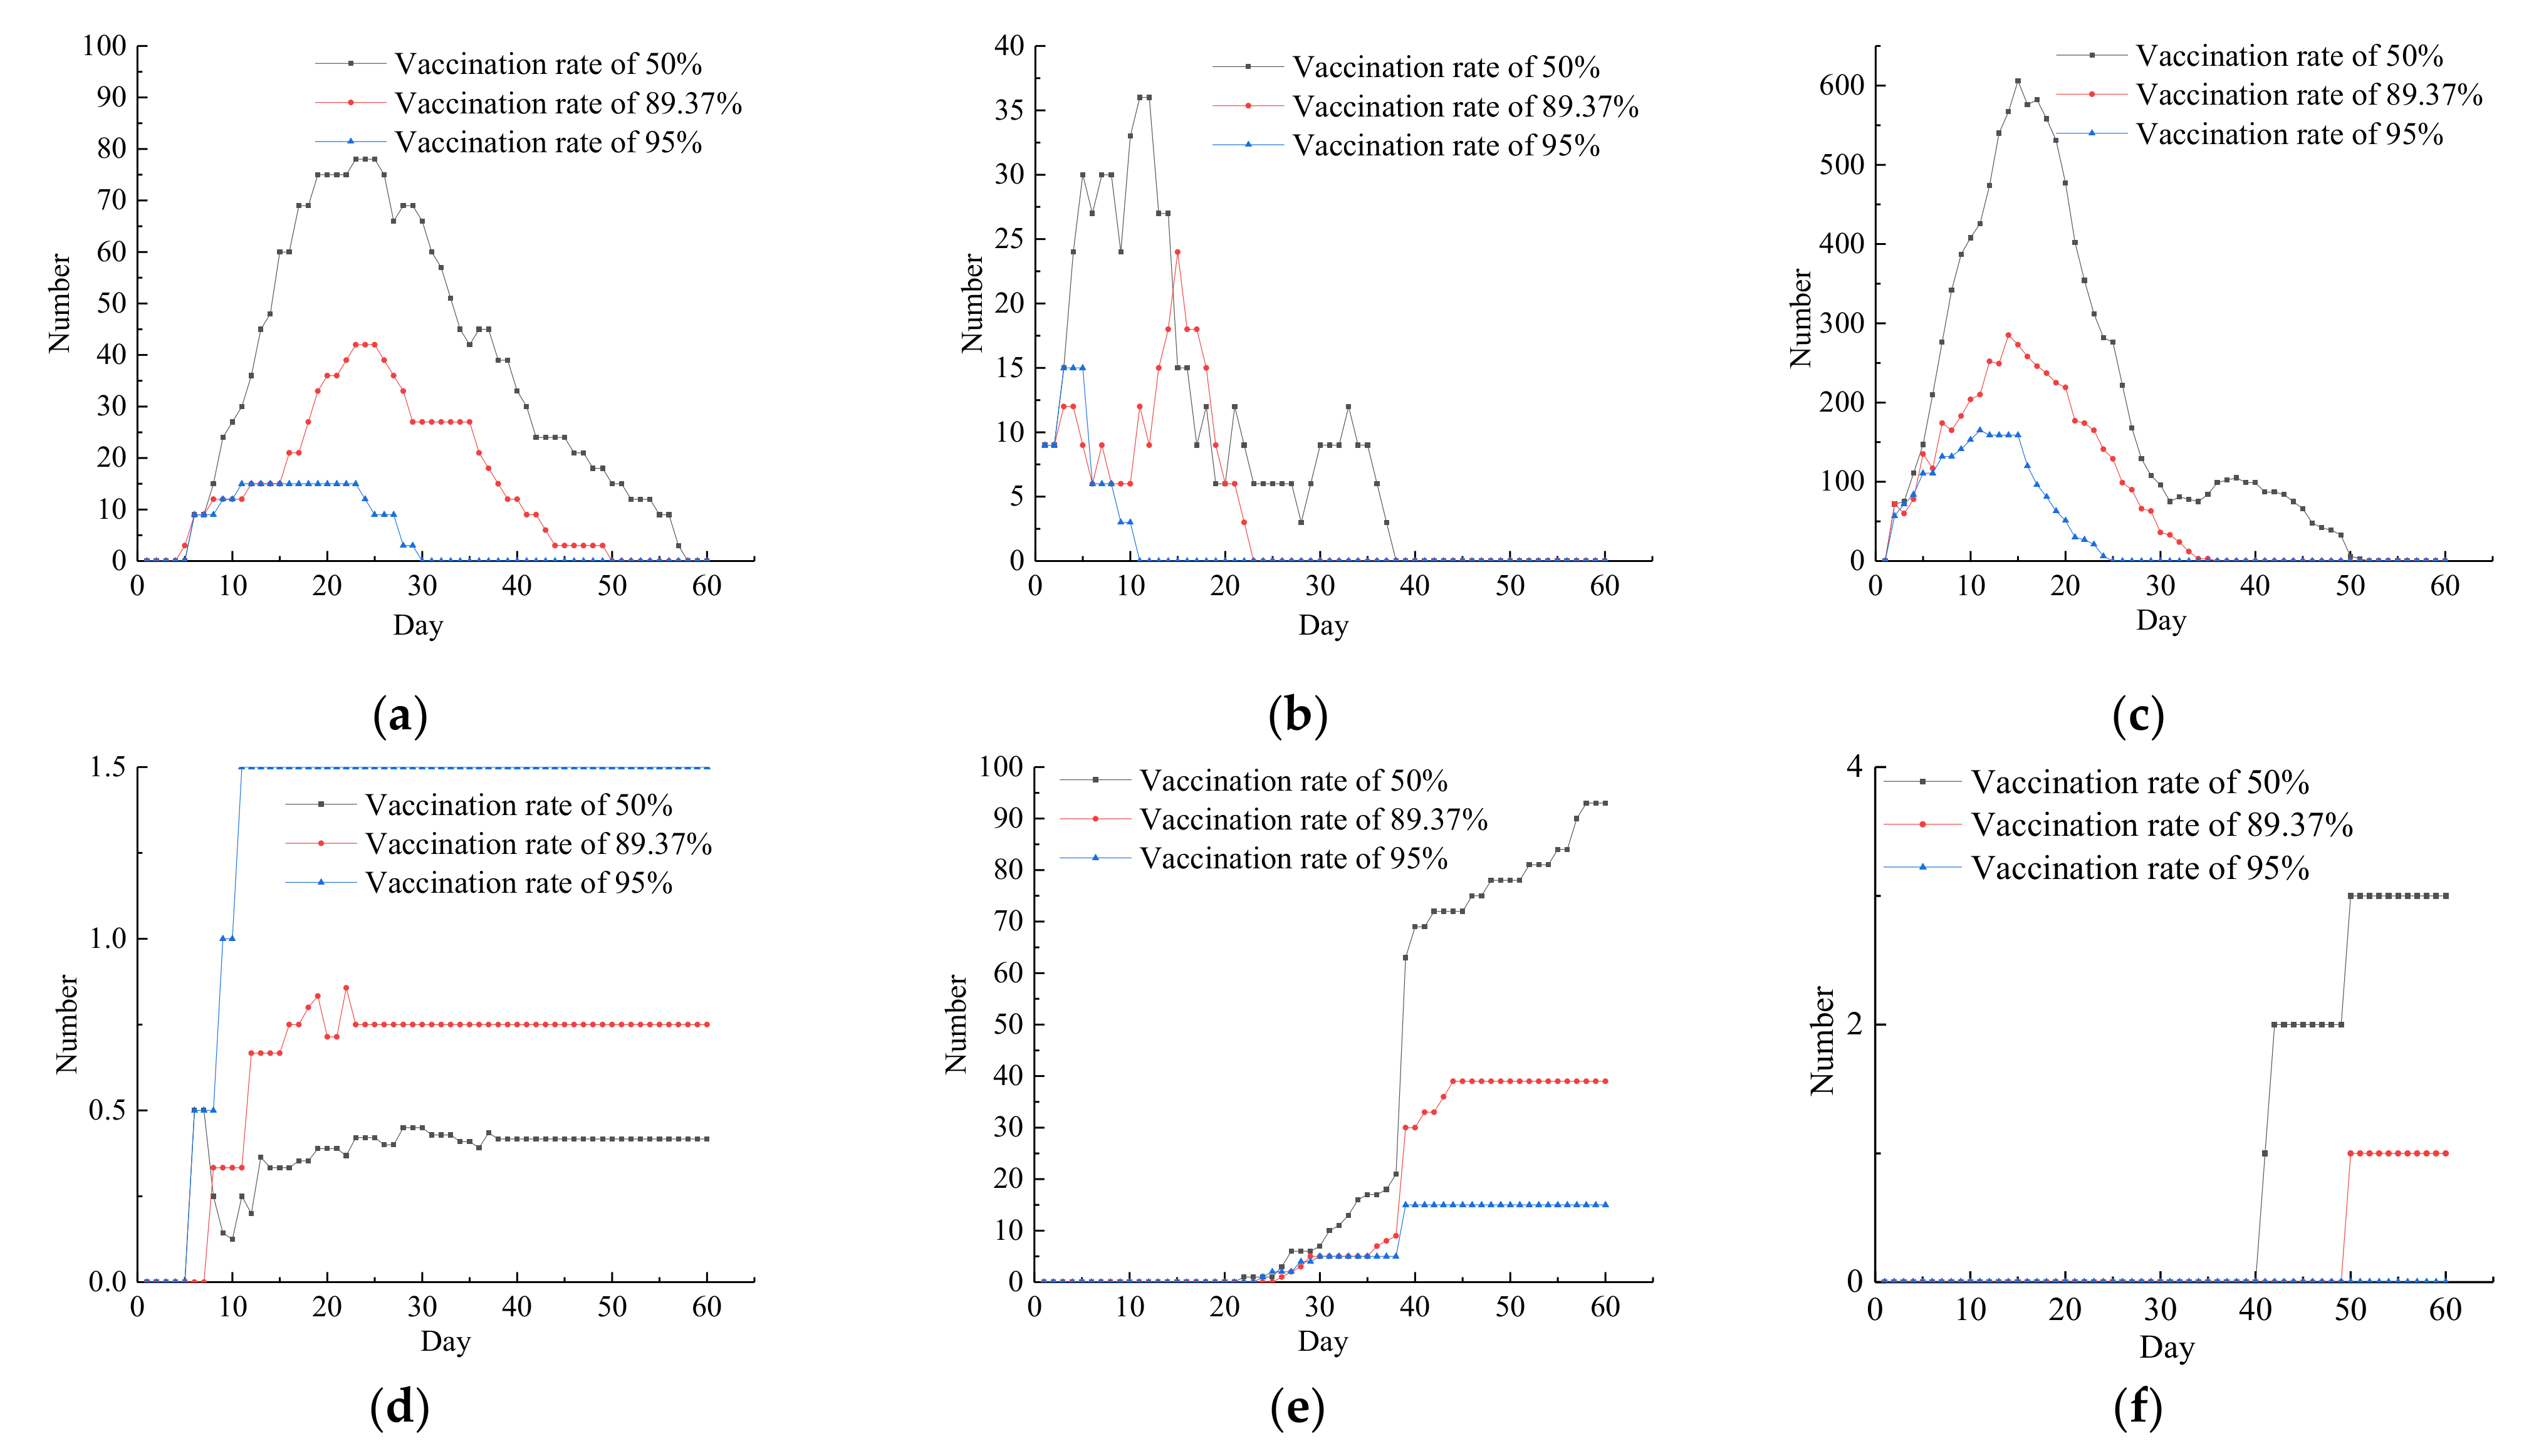
4.3.2. Vaccine Interventions

In this scenario, we simulated the mass vaccination of resident agents with medical treatment available. Based on the previous scenario, the vaccination rate was adjusted to 50%, 89.37% (the current actual vaccination rate in China), or 95% for comparison. We found that the risk of Omicron virus transmission was lower when the vaccination rate was higher, while the number of confirmed cases was lower, the proportion of mild cases after infection was greater, and recovery was more rapid. As shown in Figure 8b, with a vaccination rate of 95%, the number of latent cases decreased to zero after a short rise at just 11 days, whereas it started to decrease at 15 days with a vaccination rate of 89.37%. With a vaccination rate of 50%, the number of latent cases fluctuated more because of the weak immunity of the population, the complexity of virus transmission, and the tendency to “rebound” from the outbreak. As shown in Figure 8c, when the vaccination rate was higher, the level of immunity was greater in the population and the intensity of Omicron virus transmission was weaker, and thus the number of close contacts decreased significantly. Figure 8d shows that when the vaccination rate was higher, the proportion of mild cases was greater after diagnosis, thereby indicating that the most significant variable that contributed to the reduced risk of severe disease was the vaccination rate. Figure 8e shows that with a vaccination rate of 50%, the first patient was cured at 22 days, which was earlier than under the other two vaccination rates, possibly because patients were likely to be sick under a low vaccination rate, show symptoms earlier, and be identified and isolated by health care providers. With a vaccination rate of 89.37%, patients were cured after 26 days and the proportion of cured patients increased more slowly compared with the vaccination rate of 50%, where the maximum was reached at 44 days. With a vaccination rate of 95%, patients were cured after 24 days due to increased resistance and the later onset of the disease after vaccination. The vaccine was highly effective at preventing novel coronavirus pneumonia-related deaths according to Figure 8f. The deaths with low vaccination rates all occurred in unvaccinated people aged over 65 years, thereby indicating that the vaccination rate against novel coronavirus was lower in older people compared with the overall population. Thus, older people were a high-risk group for death from disease, probably due to the complex health status of older people, with a high probability of concomitant acute disease or uncontrolled serious chronic disease if not vaccinated in time.
The results showed that in the absence of an effective drug, inactivated vaccines against novel coronavirus pneumonia are the most effective and economical means of containing the spread of the Omicron virus strain worldwide. Comparative experiments showed that the speed and intensity of Omicron virus transmission was significantly reduced to some extent due to the presence of a certain level of immunity in the population as a result of natural infection and vaccination. The inactivated new coronavirus vaccination is designed for individual protection and treatment but also, more importantly, to form an immune barrier and achieve herd immunity.

4.4. Combination of Multiple Interventions

All of the prevention and control measures in the scenarios described above were combined. The spatial distance impact index was set at 0.5, the vaccination rate was 89.37% (the current actual vaccination rate in China), the individual mobility intention was set to the slowest population mobility rate of –0.99, and the remaining parameters were consistent with those in the drug intervention scenarios. The changes in the numbers of various types of resident agents in this scenario are shown in Figure 9. All of the organizational units of the joint prevention and control at all levels started to focus on prevention and control of the epidemic, so the tracking and isolation of close contacts increased significantly, and contacts could be isolated as soon as possible after making contact. The majority of the population was vaccinated with good immunity in the population, so the probability of being infected by a contact was reduced and the number of latent agents also increased by only three from the number of incoming ones at the beginning, who gradually developed the disease and were then cured. As the number of days in the simulation increased, the number of confirmed and quarantined agents decreased and reached zero along with an increasing number of cured agents, all of which were cured by day 28, with zero deaths, a significant increase in the rate of cure and follow-up isolation, a greater probability of mild disease after diagnosis, and a significant slowdown in the rate of virus transmission. The simulation results showed that due to the complex and diverse factors that affected the spread of the virus, it was difficult to achieve comprehensive control using a single control measure, and thus combining multiple control measures achieved effective control of the spread of the epidemic.

5. Conclusions

In this study, we used multi-agent modeling theory to construct a social simulation model of the spread and prevention and control of the Omicron strain. The model combined spatial effects, randomness, contact patterns, and mixed heterogeneity in the virus transmission process. Humans were abstracted as agents to simulate the decision-making behavior of micro-subjects. The complex response relationships between agents and environmental layers were implemented as behavioral rules for agents. The results highlighted the importance of disease awareness for controlling the current epidemic. The model narrows down the geographic space to the densely populated municipal areas that are the main cause of the spread of the epidemic, and takes into account the factors that affect the gathering and movement rate of people, such as hospitals, stations, shopping areas, and universities. The model is based on the evolution of time and space and the interaction between different intelligences to carry out periodic activities according to certain rules, and to adjust the prevention and control measures in real time according to the current epidemic situation in the environment. It also adds the influence of nucleic acid testing, vaccination, close contacts, timeliness of treatment, degree of treatment, allocation of medical resources, and analysis of mild and severe cases among confirmed cases on the spread of the epidemic, which is logically more in line with objective facts. The rules of the model are also designed based on the transmission and prevention and control characteristics of the variant strain of Omicron, so the model fitting results are closer to the real situation of Omicron than the existing models. The model is also applicable to other cities and regions, and universally applicable to new coronavirus transmission analysis and prediction.
We used the model to simulate the spread of the Omicron virus in Taiyuan City under different control measures using buildings as spatial granularity and days as the time scale, as well as considering the actual natural environment, population type, and differences in control intensity. The resident agents in different states in the Omicron virus transmission system developed adaptive behaviors depending on the level of local healthcare resources and interventions. A baseline scenario without interventions was constructed to assess the effects of single pharmacological and non-pharmacological interventions, as well as multiple interventions in combination. The simulation results showed that it is difficult to achieve comprehensive control of the Omicron virus with a single control measure, and that the risk of viral transmission can be effectively suppressed by combining multiple control measures. The effectiveness of individual interventions in the urban population follows the order of: vaccination > isolation in designated hospitals > self-health protection. The core interventions are vaccination and hospital isolation treatment. Vaccination reduces the risk and severity of infection and it is a very important public health measure that can be combined with other public health measures to effectively prevent and control the spread of the Omicron virus. Strengthening personal protection measures is a complementary intervention that can reduce the rate of transmission via contact between residents to a certain extent, but the rapid spread of the virus cannot be achieved using this measure alone.
The model is based on real data and the experimental results reflect the transmission dynamics of the Omicron strain in different scenarios and conditions from multiple levels and perspectives. Our results provide insights into the pattern of virus transmission and a deeper understanding of how different population groups are affected by the epidemic, thereby providing an important reference basis for future epidemic prevention research. The model should also be combined with simulation experiments and epidemiological theories to study the negative effects of different prevention and control measures on social order and economic development. It is also necessary to further subdivide the population and geographical areas to reduce the viral spread caused by the cross-domain movement of the population. Comprehensive consideration of prevention and control effects requires balancing the advantages and disadvantages to identify more accurate prevention and control measures to provide more effective support for urban health decision-makers.

Author Contributions

Conceptualization, L.P. and H.Y.; methodology, Y.S. and L.P.; software, Y.S.; formal analysis, G.Z.; writing—original draft preparation, Y.S.; writing—review and editing, R.Z.; project administration, R.Z. and Y.S.; funding acquisition, H.Y. and L.P. All authors have read and agreed to the published version of the manuscript.

Funding

This work was supported by the Natural Science Foundation of Shanxi province-A large-scale artificial social model simulation based on high performance computing (no. 201901D111258), Shanxi Province Intelligent Software and Human Machine Environment System Postgraduate Joint Training Demonstration Base (no. 2022JD11), Excellent Innovation Project for Postgraduates in Shanxi Province-Research on multi-agent simulation model of COVID-19 spread and prevention and control based on mesoscience (no. 2022Y698).

Institutional Review Board Statement

Not applicable.

Informed Consent Statement

Not applicable.

Data Availability Statement

Not applicable.

Conflicts of Interest

The authors declare no conflict of interest. The opinions, findings, and conclusions expressed in this work are those of the authors and do not necessarily reflect the views of the sponsors.

References

  1. Huang, J.; Zhang, L.; Liu, X.; Wei, Y.; Liu, C.; Lian, X.; Huang, Z.; Chou, J.; Liu, X.; Li, X.; et al. Global prediction system for COVID-19 pandemic. Sci. Bull. 2020, 65, 1884–1887. [Google Scholar] [CrossRef] [PubMed]
  2. Sanyaolu, A.; Marinkovic, A.; Prakash, S.; Haider, N.; Williams, M.; Okorie, C.; Badaru, O.; Smith, S. SARS-CoV-2 Omicron variant (B.1.1.529): A concern with immune escape. World J. Virol. 2022, 11, 137–143. [Google Scholar] [CrossRef] [PubMed]
  3. WHO. Classification of Omicron (B.1.1.529): SARS-CoV-2 Variant of Concern. Available online: https://www.who.int/news/item/26-11-2021-classification-of-omicron-(b.1.1.529)-sars-cov-2-variant-of-concern (accessed on 26 November 2021).
  4. Ren, S.-Y.; Wang, W.-B.; Gao, R.-D.; Zhou, A.-M. Omicron variant (B.1.1.529) of SARS-CoV-2: Mutation, infectivity, transmission, and vaccine resistance. World J. Clin. Cases 2022, 10, 1–11. [Google Scholar] [CrossRef] [PubMed]
  5. Tang, B.; Wang, X.; Li, Q.; Bragazzi, N.L.; Tang, S.; Xiao, Y.; Wu, J. Estimation of the Transmission Risk of the 2019-nCoV and Its Implication for Public Health Interventions. J. Clin. Med. 2020, 9, 462. [Google Scholar] [CrossRef] [Green Version]
  6. Suryawanshi, R.K.; Chen, I.P.; Ma, T.; Syed, A.M.; Brazer, N.; Saldhi, P.; Simoneau, C.R.; Ciling, A.; Khalid, M.M.; Sreekumar, B.; et al. Limited cross-variant immunity from SARS-CoV-2 Omicron without vaccination. Nature 2022, 607, 351–355. [Google Scholar] [CrossRef]
  7. Chekol Abebe, E.; Tiruneh, G.; Medhin, M.; Behaile, T.; Mariam, A.; Asmamaw Dejenie, T.; Mengie Ayele, T.; Tadele Admasu, F.; Tilahun Muche, Z.; Asmare Adela, G. Mutational Pattern, Impacts and Potential Preventive Strategies of Omicron SARS-CoV-2 Variant Infection. Infect Drug Resist. 2022, 15, 1871–1887. [Google Scholar] [CrossRef]
  8. Liu, M.; Shi, L.; Chen, H.; Wang, X.; Yang, M.; Jiao, J.; Yang, J.; Sun, G. Comparison Between China and Brazil in the Two Waves of COVID-19 Prevention and Control. J. Epidemiol. Glob. Health 2022, 12, 168–181. [Google Scholar] [CrossRef]
  9. Jin, H.; Lu, L.; Liu, J.; Cui, M. COVID-19 emergencies around the globe: China’s experience in controlling COVID-19 and lessons learned. Int. J. Qual. Health Care 2021, 33, mzaa143. [Google Scholar] [CrossRef]
  10. Buchan, S.A.; Chung, H.; Brown, K.A.; Austin, P.C.; Fell, D.B.; Gubbay, J.B.; Nasreen, S.; Schwartz, K.L.; Sundaram, M.E.; Tadrous, M.; et al. Estimated Effectiveness of COVID-19 Vaccines Against Omicron or Delta Symptomatic Infection and Severe Outcomes. JAMA Netw. Open 2022, 5, e2232760. [Google Scholar] [CrossRef]
  11. Chen, Z.; Deng, X.; Fang, L.; Sun, K.; Wu, Y.; Che, T.; Zou, J.; Cai, J.; Liu, H.; Wang, Y.; et al. Epidemiological characteristics and transmission dynamics of the outbreak caused by the SARS-CoV-2 Omicron variant in Shanghai, China: A descriptive study. Lancet Reg. Health West. Pac. 2022, 29, 100592. [Google Scholar] [CrossRef]
  12. Alzahrani, S.I.; Aljamaan, I.A.; Al-Fakih, E.A. Forecasting the spread of the COVID-19 pandemic in Saudi Arabia using ARIMA prediction model under current public health interventions. J. Infect. Public Health 2020, 13, 914–919. [Google Scholar] [CrossRef]
  13. Sheng, H.; Wu, L.; Xiao, C. Modeling Analysis and Prediction on NCP Epidemic Transmission. J. Syst. Simul. 2020, 32, 759–766. [Google Scholar] [CrossRef]
  14. Annas, S.; Pratama, M.I.; Rifandi, M.; Sanusi, W.; Side, S. Stability analysis and numerical simulation of SEIR model for pandemic COVID-19 spread in Indonesia. Chaos Solitons Fractals 2020, 139, 110072. [Google Scholar] [CrossRef]
  15. Cao, W.J.; Liu, X.F.; Han, Z.; Feng, X.; Zhang, L.; Liu, X.F.; Xu, X.K.; Wu, Y. Statictical analysis and autoregressive modeling of confirmed coronavirus disease 2019 epidemic case. Acta Phys. Sin. 2020, 69, 40–46. [Google Scholar] [CrossRef]
  16. Chen, B.; Yang, M.; Ai, C.; Ma, L.; Zhu, Z.; Chen, H.; Zhu, M.; Xu, W. Prediction of Epidemic Transmission and Evaluation of Prevention and Control Measures Based on Artificial Society. J. Syst. Simul. 2020, 32, 2507–2514. [Google Scholar] [CrossRef]
  17. Saikia, D.; Bora, K.; Bora, M.P. COVID-19 outbreak in India: An SEIR model-based analysis. Nonlinear Dyn. 2021, 104, 4727–4751. [Google Scholar] [CrossRef]
  18. Fan, R.G.; Wang, Y.B.; Luo, M.; Zhang, Y.Q.; Zhu, C.P. SEIR-Based COVID-19 Transmission Model and Inflection Point Prediction Analysis. J. Univ. Electron. Sci. Technol. China 2020, 49, 369–374. [Google Scholar]
  19. Li, D.; Bai, R.R. Combined model of novel coronavirus transmission simulation. Stat. Decis. 2020, 36, 5–10. [Google Scholar] [CrossRef]
  20. Ma, X.; Zhang, X.; Qin, C. Research of the Sudden Public Health Incidents Response Policies Based on Policy Tools: Taking COVID-19 as an Example. Inf. Stud. Theory Appl. 2020, 43, 29–37. [Google Scholar]
  21. Li, C.J.; Liu, G.P. Data-driven consensus for non-linear networked multi-agent systems with switching topology and time-varying delays. IET Control Theory Appl. 2018, 12, 1773–1779. [Google Scholar] [CrossRef]
  22. Pan, L.; Qin, S.; Li, X.; Lu, F.; Yang, F. Multi-agent Simulation Model for COVID-19 Virus Prevention and Control. J. Syst. Simul. 2020, 32, 2244–2257. [Google Scholar] [CrossRef]
  23. Yin, L.; Liu, K.; Zhang, H.; Xi, G.; Li, X.; Li, Z.; Xue, J. Integrating Human Mobility into the Epidemiological Models of COVID-19: Progress and Challenges. J. Geo Inf. Sci. 2021, 23, 1894–1909. [Google Scholar]
  24. Zhai, P.; Ding, Y.; Wu, X.; Long, J.; Zhong, Y.; Li, Y. The epidemiology, diagnosis and treatment of COVID-19. Int. J. Antimicrob. Agents 2020, 55, 105955. [Google Scholar] [CrossRef] [PubMed]
  25. Mkolesia, A. On the Estimation of a Univariate Gaussian Distribution: A Comparative Approach. Open J. Stats 2015, 5, 445–454. [Google Scholar] [CrossRef] [Green Version]
  26. Prevention and Control Plan for Novel Coronavirus Pneumonia (Seventh Edition). Chin. J. Infect. Control 2020, 19, 1042–1048.
  27. Taiyuan Bureau of Statistics. Taiyuan Statistical Yearbook; China Statistics Press: Taiyuan, China, 2020. [Google Scholar]
  28. Kim, M.-K.; Lee, B.; Choi, Y.Y.; Um, J.; Lee, K.-S.; Sung, H.K.; Kim, Y.; Park, J.-S.; Lee, M.; Jang, H.-C.; et al. Clinical Characteristics of 40 Patients Infected With the SARS-CoV-2 Omicron Variant in Korea. J. Korean Med. Sci. 2022, 37, e31. [Google Scholar] [CrossRef]
  29. World Health Organization. Report of the WHO-China Joint Mission on Coronavirus Disease 2019 (COVID-19). 2020. Available online: https://www.who.int/publications-detail-redirect/report-of-the-who-china-joint-mission-on-coronavirus-disease-2019-(covid-19) (accessed on 15 July 2021).
  30. General Office of the National Health Care Commission. Notice on the Issuance of the Treatment Protocol for Novel Coronavirus Pneumonia (Trial Version 8). Available online: http://www.nhc.Gov.cn/yzygj/s7653p/202008/0a7bdf12bd4b46e5bd28ca7f9a7f5e5a.html (accessed on 15 September 2020).
  31. Liu, Y.; Rocklöv, J. The effective reproductive number of the Omicron variant of SARS-CoV-2 is several times relative to Delta. J. Travel Med. 2022, 29, taac037. [Google Scholar] [CrossRef]
  32. Pan, L.; Li, X.; Qin, S.; Zhang, Y.; Yan, H. Multi-Agent Simulation Model of Urban Safety Livability Change. J. Syst. Simul. 2019, 31, 1321–1333. [Google Scholar]
  33. The People’s Government of Shanxi Province. Status of Vaccination in Shanxi Province. Available online: http://www.shanxi.gov.cn/yw/sxyw/202203/t20220331_960920.shtml (accessed on 31 March 2022).
  34. Zhang, J.; Huimin, X.U.E.; Yaxin, G.O.N.G.; Qi, Q.I.N.; Changhua, N.I.N.G.; Lei, C.A.O.; Yongxiao, C.A.O. Analysis of death time of patients with coronavirus disease 2019. J. Xi’an Jiaotong Univ. Med. Sci. 2021, 42, 123–127. [Google Scholar]
  35. Chu, D.K.; Akl, E.A.; Duda, S.; Solo, K.; Yaacoub, S.; Schünemann, H.J.; El-Harakeh, A.; Bognanni, A.; Lotfi, T.; Loeb, M. Physical distancing, face masks, and eye protection to prevent person-to-person transmission of SARS-CoV-2 and COVID-19: A systematic review and meta-analysis. Lancet 2020, 395, 1973–1987. [Google Scholar] [CrossRef]
Figure 1. Location of Taiyuan Municipal District.
Axioms 11 00660 g001
Figure 2. Resident agent state transition diagram.
Axioms 11 00660 g002
Figure 3. Model operation interface diagram.
Axioms 11 00660 g003
Figure 4. Model fitting results: (a) cumulative confirmatory fitting results; (b) cumulative latent population fitting results; (c) cumulative number of cures fitting results; (d) cumulative isolation number fitting results.
Axioms 11 00660 g004
Figure 5. No-intervention scenario.
Axioms 11 00660 g005
Figure 6. Self-hygiene protection scenario.
Axioms 11 00660 g006
Figure 7. Medical life-saving intervention scenario: (a) number of resident agents in different states; (b) diagnosed and cured.
Axioms 11 00660 g007
Figure 8. Vaccine intervention scenario: (a) changes in the number of confirmed cases; (b) changes in the number of potential infections; (c) changes in the number of close contacts; (d) proportion of mild-to-severe cases; (e) changes in the cumulative number of cured agents; (f) cumulative death toll.
Axioms 11 00660 g008
Figure 9. Multi-intervention combination scenario.
Axioms 11 00660 g009
Table 1. Permanent Resident Population of Taiyuan.
Unit: Person, Household
SerialMunicipal DistrictPopulationTotal Households
1Yingze547,718161,954
2Xinghualing619,463190,583
3Wanbailin592,184177,510
4Jiancaoping333,077113,440
5Jinyuan215,55168,512
6Xiaodian694,166206,339
Total3,002,159918,338
Table 2. Taiyuan tertiary care hospital and above.
SerialHospital NameNumber of Medical and Nursing StaffNumber of BedsMunicipal District
1First hospital of Shanxi Medical University39852419Yingze
2Second hospital of Shanxi Medical University38002700Xinghualing
3Fourth People’s Hospital of Taiyuan359440Wanbailin
4The Third People’s Hospital of Shanxi province616850Yingze
5Shanxi Norman Bethune Hospital27203533Xiaodian
6Armed Police Hospital300500Xiaodian
7Shanxi provincial People’s Hospital24052000Yingze
8Taiyuan Seventh People’s Hospital369300Xinghualing
9Taigang General Hospital23961800Jiancaoping
10Children’s Hospital of Shanxi Province29431611Xinghualing
11Taiyuan Central Hospital15001076Xiaodian
Total 21,39317,178
Table 3. Model parameters for transmission and control model of the Omicron strain.
Name of ParameterSource of Initial ValueDescription
Total population in Taiyuan MunicipalityTaiyuan City Statistical Yearbook 2020 [27]300.2159 million people
Age composition of Taiyuan’s populationData from the 7th Census of Taiyuan in 20200–14 years: 15.55%, 15–59 years: 68.34%, 60 years and over: 16.11%
Vaccination rateComplete vaccination coverage in China as of 24 June 202289.37%
Case fatality rate (CFR)Case fatality rate in China as of 24 June 20222.3%
Latency timeClinical characteristics of 40 patients infected with the SARS-CoV-2 omicron variant in Korea [28]3.5 days
Mean time to healingReport of the WHO–China Joint Mission on Coronavirus Disease 2019 (COVID-19) [29]Approximately 2 weeks for mild cases, 3–6 weeks for severe and critical cases
Hospital admission response timeAverage admission time to tertiary and above hospitals in Taiyuan2 to 3 days
Hospital bedsTotal beds in Taiyuan’s tertiary and above hospitals17,178
Number of medical and nursing staffGeneral medical staff of tertiary and above hospitals in Taiyuan2.1393
Mean number of nucleic acid tests during isolationPrevention and control program for novel coronavirus pneumonia (8th edition) [30]4 times
Average number of effective reproduction (Re)The effective reproductive number for the Omicron variant of SARS-CoV-2 is several times relative to Omicron [31].3.4 (0.88~9.4)
Publisher’s Note: MDPI stays neutral with regard to jurisdictional claims in published maps and institutional affiliations.

