Doppler and microsphere methods, which simply measure flow. This technique is advantageous over labor-intensive 2D conventional analyses using histology and X-ray microangiography. Our data establish the appropriate thresholding for optimal vascular analyses and provide baseline measurements that can be used to analyze the role of angiogenesis in bone regeneration and repair in the craniofacial skeleton.
To better understand the process of bone healing as well as the pathological conditions that impact bony union, a com-prehensive grasp of blood supply is of paramount importance. The significance of the role angiogenesis plays in osteogenesis has been well appreciated since the 18th century when Albrecht von Haller wrote in his book
Experimentorum de ossium formatione (1763): “…the origin of bone is the artery carrying the blood and in it the mineral elements” [
1] (p400). The blood supply of the mandible has certain unique features that are important for experimental procedures and for the study of bone healing. Our laboratory has been actively engaged in building a foundation of analytical and developmental re- search that provides both the intellectual and methodological basis for the study of new bone formation and osseous healing.
Early works on angiogenesis during new bone formation and osseous healing have utilized a variety of techniques to evaluate vascular structures in animal models. Histology is the most commonly used method to analyze vascularity [
2]. Histological examination of blood vessels, however, is limited in its accuracy and reproducibility because of the subjectivity of the examiner, the problem of precisely accounting for the cross sectioning of the serpentine course of vasculature throughout the tissue samples, and the incomplete sampling involved in histologic analysis. Verdonck et al. utilized laser Doppler flow to assess bone vascularity in the edentulous human mandible after oral implant [
3]. Laser Doppler imaging (LDI) uses a laser scan to provide a color-coded, 2D image of tissue perfusion without disturbing the tissue of interest. This technique provides semiquantitative data and is more a measure of functionality. LDI, however, does not provide anatomic information at all and is limited by the fact that only the most superficial blood flow is measured. LDI cannot be used dynamically to image high-frequency blood flow fluctuations and also takes a long time to scan. Finally, LDI is operator dependent and provides low image resolution. Another popular technique, X-ray microangiography, pro- vides high-resolution 2D angiograms of the vascular network but lacks the ability to employ a quantitative, volumetric analysis [
4,
5].
Micro–computed tomography (micro-CT) imaging with perfused contrast agents has emerged as a promising imaging technology to visualize 3D vascular networks in organs or tumors of small animals [
6]. Previous studies from our laboratory have focused on utilizing biomechanical, densitometric, and histological analysis as the mainstay for reproducible outcome measures for investigation of new bone formation and osseous healing [
7]. Our goal now is to investigate the feasibility of using micro-CT imaging with a perfused contrast agent as a quantitative measure of vascularity and vasculogenesis in the murine mandible. To our knowledge this is the first description of this technique in the mandible and will lay down the groundwork for using micro-CT to quantitatively evaluate the temporal and spatial pattern of angiogenesis during distraction osteogenesis (DO) as well as other forms of bone regeneration and repair in the craniofacial skeleton.
Materials and Methods
Animals
Ten adult male Sprague-Dawley rats, weighing ~400 g, were obtained through the University of Michigan’s University Laboratory Animal Medicine department in compliance with their subdivision of the University Committee on Use and Care of Animals (UCUCA). They were housed two animals per cage in a pathogen-free, restricted-access facility upon arrival to our laboratory. They were weighed and provided water bottles and regular chow ad libitum before perfusion procedure.
Perfusion
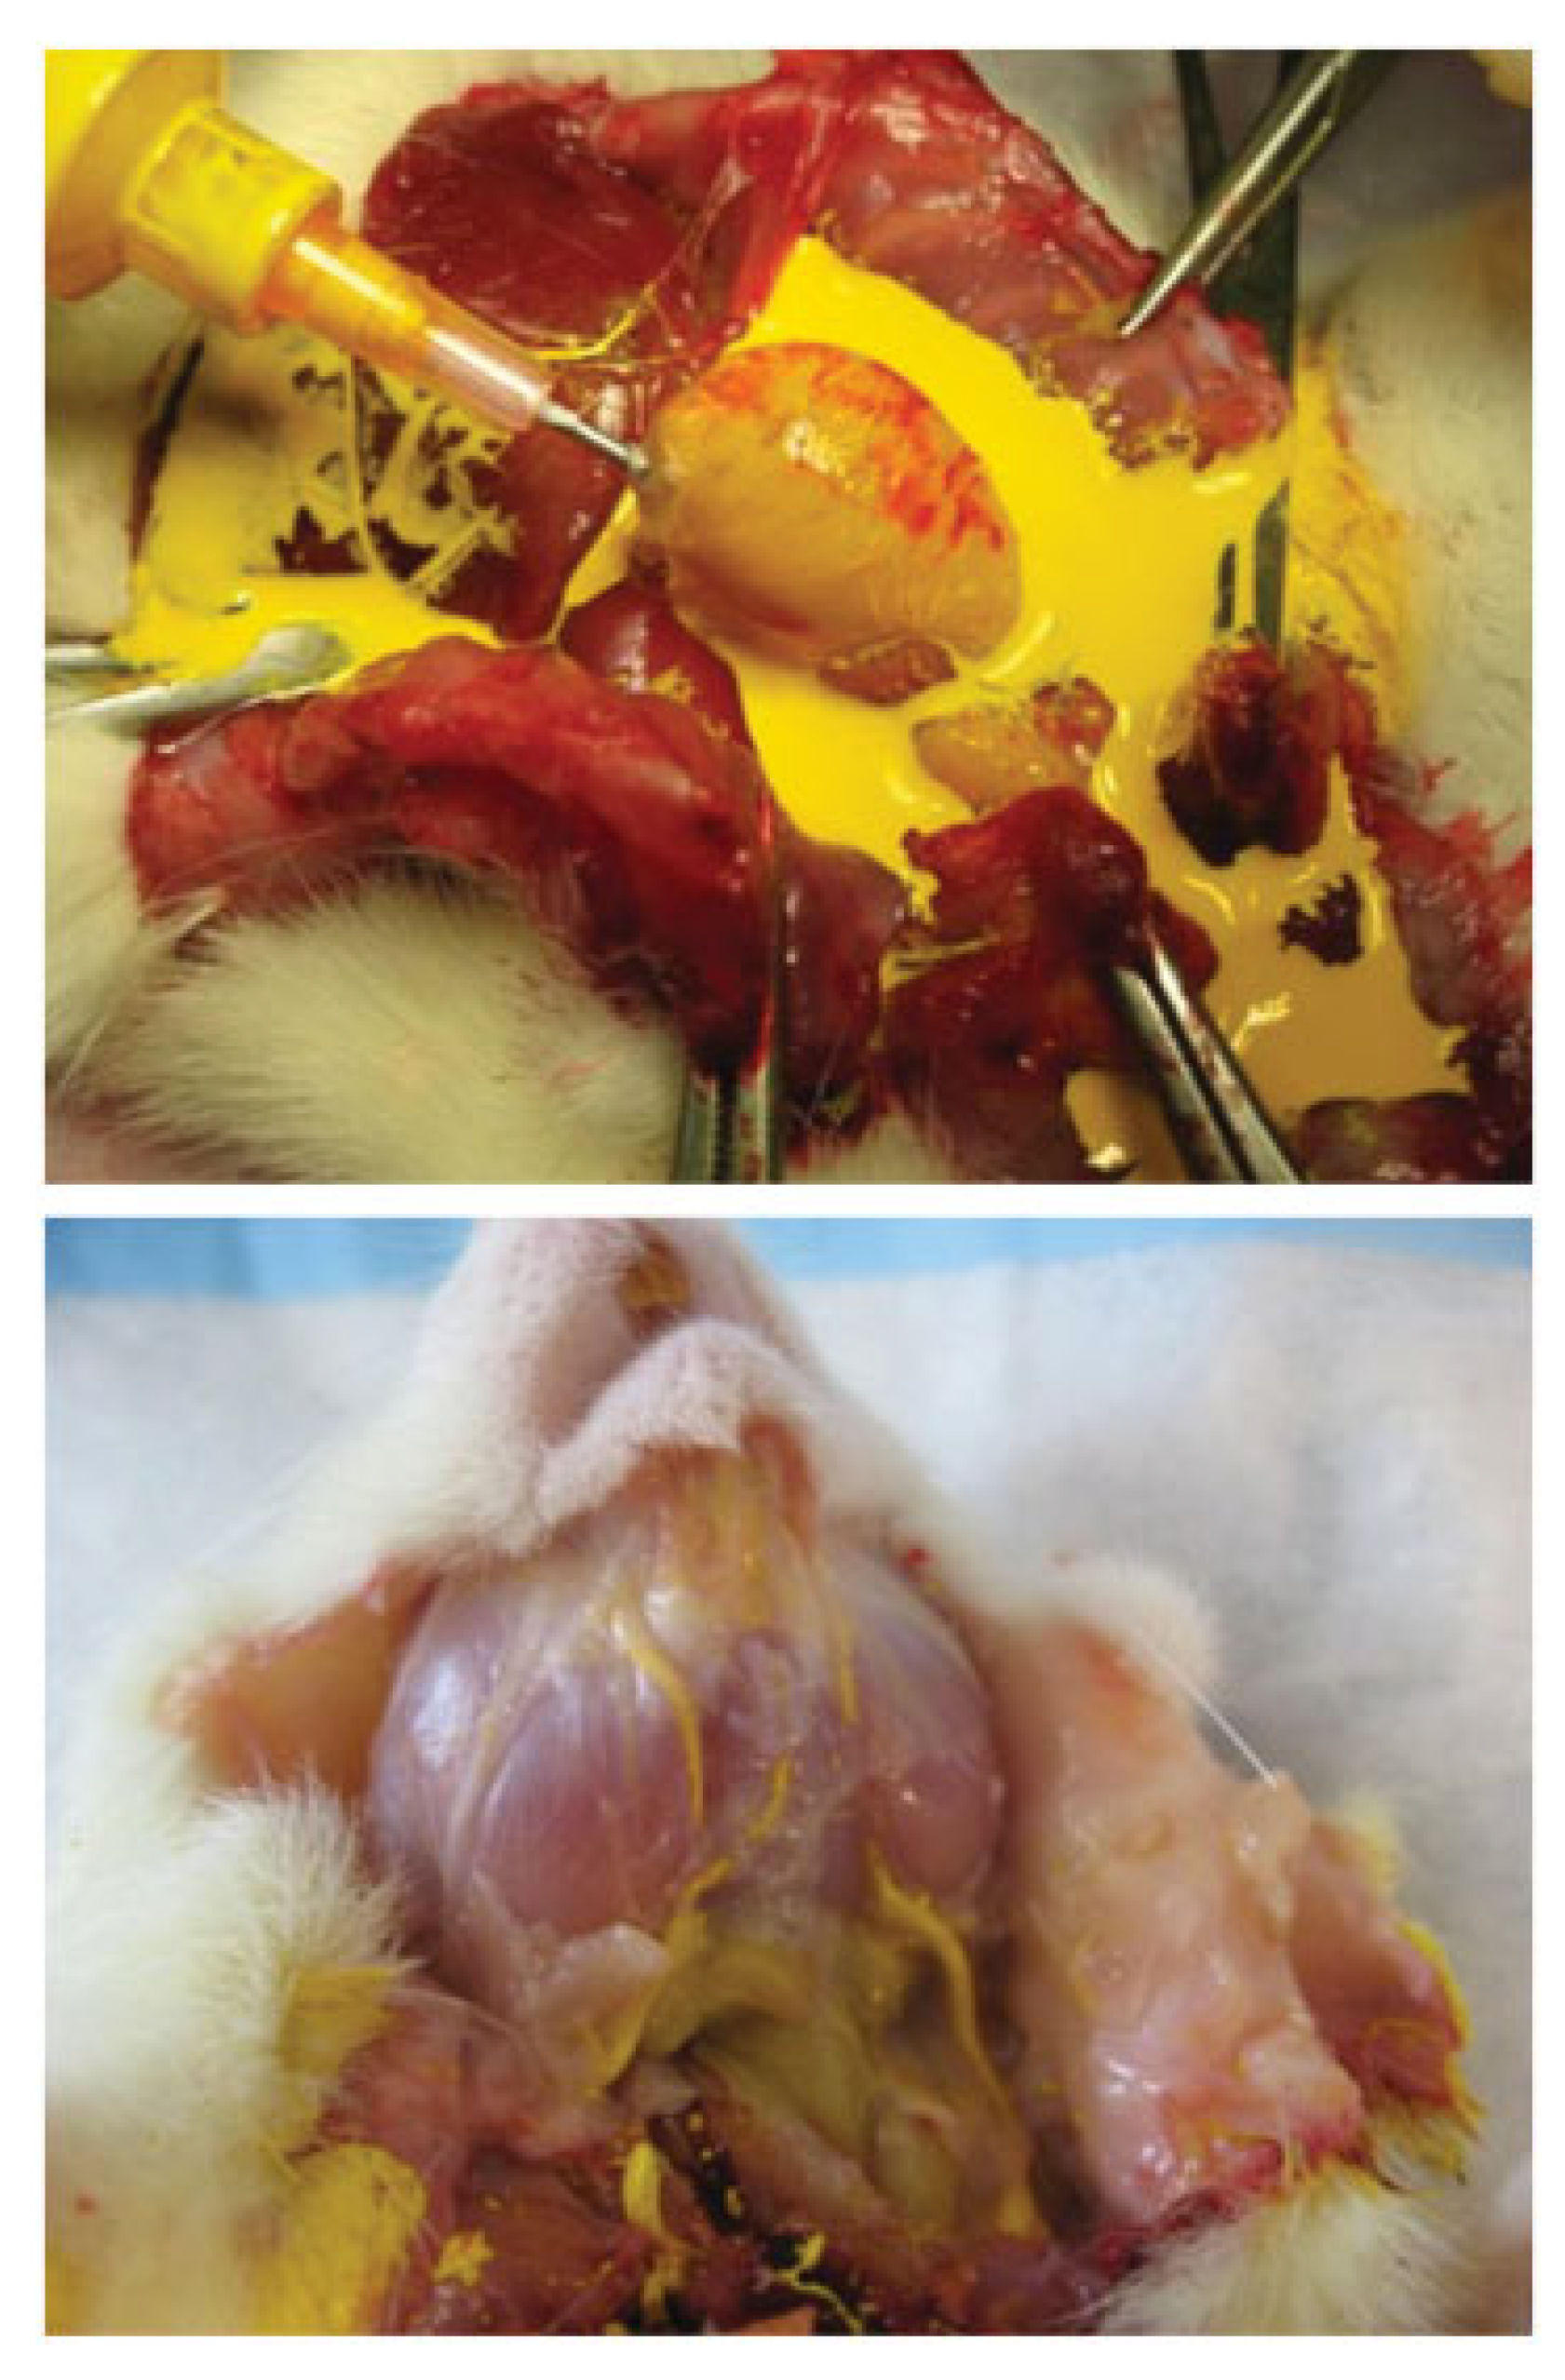
The animal was given an inhalation anesthetic and induced at 5% isoflurane in an induction chamber; it was then switched over to a face mask at 2% isoflurane. After adequate anesthesia was achieved by checking the absence of the pedal withdrawal reflex, the animal was placed supine on the operating table and a midline incision was performed from the sternal notch to the upper abdomen. The chest and pericardium were then opened with a scissor exposing the heart. The descending aorta was then identified by feeling a pulse and clamped off with a curved hemostat. The left ventricle was identified and catheterized with a 1-cm-long 18-gauge blunt needle. After administering 250 U (0.25 mL of 1000 U/mL) of heparin through the needle, 0.9% normal saline was then flushed into the heart and circulation. A small incision was then made in the right atrium to allow the blood and normal saline to drain. When ~200 mL of saline had been delivered, the isoflurane was increased to 5% and the animal was overdosed and euthanized. After 300 mL of saline had been delivered, the saline infusion was stopped and 300 mL of a 10% neutral buffered formalin solution was perfused through the animal until the neck and upper extremities became perfused. The upper limbs of the animal contracted as the formalin moved through. The contrast agent (Microfil MV-122, Flow Tech; Carver, MA) was then prepared by mixing it with a catalyst (17.1 mL contrast agent, 0.9 mL catalyst) while rinsing the vasculature again with ~100 mL of saline. Using a syringe connected to the needle hub, 18 mL of the microfilm/catalyst mixture was then delivered into the vasculature (
Figure 1). As the vasculature was perfused with the contrast agent, the coronary arteries and ascending aorta could be seen filling with yellow contrast, and the tongue turned yellow as well. After allowing the Microfil to polymerize for about an hour, the mandible was removed and all soft tissue was cleaned off the bone, taking care not to damage the penetrating vessels. The mandible was then placed in Cal-Ex II solution (Fisher Scientifics; Fairlawn, NJ) for decalcification of bones. This facilitated image thresholding of the mandibular vasculature from the surrounding tissues. To ensure complete decalcification of bone, µX-Ray radiographs (MX-20, Faxitron X-Ray corporation; Tucson, AZ) were obtained at 3× magnification with an exposure of 7 s at a 25-kV potential after each day the mandible was in the decalcification solution. Once complete decalcification was noted on these screening faxitrons, the specimens were placed in a 70% ethanol (ETOH) solution until needed for future micro-CT imaging.
Micro-CT Imaging
Mandibular vasculatures of the decalcified left mandibles were imaged using a high-resolution micro-CT imaging sys- tem (GE Healthcare Biosciences MS-8, London, Ontario, Canada). Images were obtained using 80-kV (peak), 80-μA, and 1100-ms exposure at a resolution of 18-μm voxel size. After an initial calibrating scan was performed using a phantom standard containing air, water, and hydroxyapatite-type material (Gammex, RMI, WI), each hemimandible was scanned in a custom polycarbonate cylindrical holder [
8]. The specimens were then immediately returned to their storage solutions (70% ethanol). The individual scans were corrected, reconstructed, and then reoriented following a distal to medial, left-to-right sagittal orientation along the x-axis. Radiomorphometric analysis based on direct distance transform methods was subsequently applied to the 3D images to quantify parameters of vascular network morphology.
Micro-CT Analysis of Blood Vessel Morphology in a Volume of Interest
Analysis of the decalcified left posterior hemimandible was performed with a Microview 2.2 computer program (GE Healthcare, Milwaukee, WI). One representative control was chosen at random to test the effects of different thresholds on the radiomorphometric analysis of vessel volume fraction, vessel volume, connectivity, number, thickness, and separation. A threshold of 1000 Hounsfield units (HU) was initially chosen based on visual interpretation of the 2D tomograms. Selection of an image threshold defines the cutoff gray-scale value that separate the image voxels into either demineralized bone in the background or part of the blood vessels. During reconstruction of the image projections, a gray-scale value that represents the capacity of the material within that space to attenuate X-ray is assigned to each voxel. At lower thresholds, smaller vessels that are apparent on the 2D tomograms will remain as part of the segmented object, but bigger vessels will appear artificially large because the partially filled voxels surrounding them will remain in the image. On the other hand, to gain the most accurate image of the larger vessels, a higher threshold must be used, and the smaller vessels are often omitted from the 3D image. GE Microview software threshold volume analysis was applied with in the region of interest. The threshold ranges used were > 1000 HU but < 3000 HU for blood vessels and < 1000 HU for demineralized bone, arrived at qualitatively by threshold overlay to provide the best separation. At a threshold of > 2000 HU, too many of the smaller vessels were omitted from the region of interest. A threshold of 1000, 1200, and 1400 HU was chosen to evaluate the radiomorphometric parameters. These three threshold values directly correlate to the linear coefficient of attenuation of the mate- rial in the image space. In this study, the radiomorphometric parameters were taken in a volume of interest (VOI) defined as the volume spanning from the end of the third molar and then every 15th serial coronal section for a total of five sections in the left hemimandible (
Figure 2). This VOI was chosen specifically so that it would reflect the distraction zone in future studies of DO in our murine model.
Vessel volume was computed based on the voxel size and the number of segmented voxels in the 3D image after applying the threshold. Connectivity was established using the method of Odgaard and Gunderson [
9]. Connectivity was defined as the maximal number of branches that can be broken within a structure before it was divided into two separate parts. Vessel number, thickness, and separation were calculated using a model independent method for assessing thickness in 3D images [
10]. The average of the local voxel thickness within the structure yielded the vessel thickness parameter, and a similar calculation on the background voxels determined the vessel separation. To calculate vessel number, the segmented volume is skeletonized, leaving only the voxels at the midaxes of the vessels in the structure. Vessel number is defined as the inverse of the mean spacing between the midaxes of the structures in the segmented volume.
Statistical Analysis
Variance was compared among all animals for each of the outlined radiomorphometric parameters (SPSS version16.0; SPSS, Inc., Chicago, IL, USA). All data are presented as means standard deviations.
Results
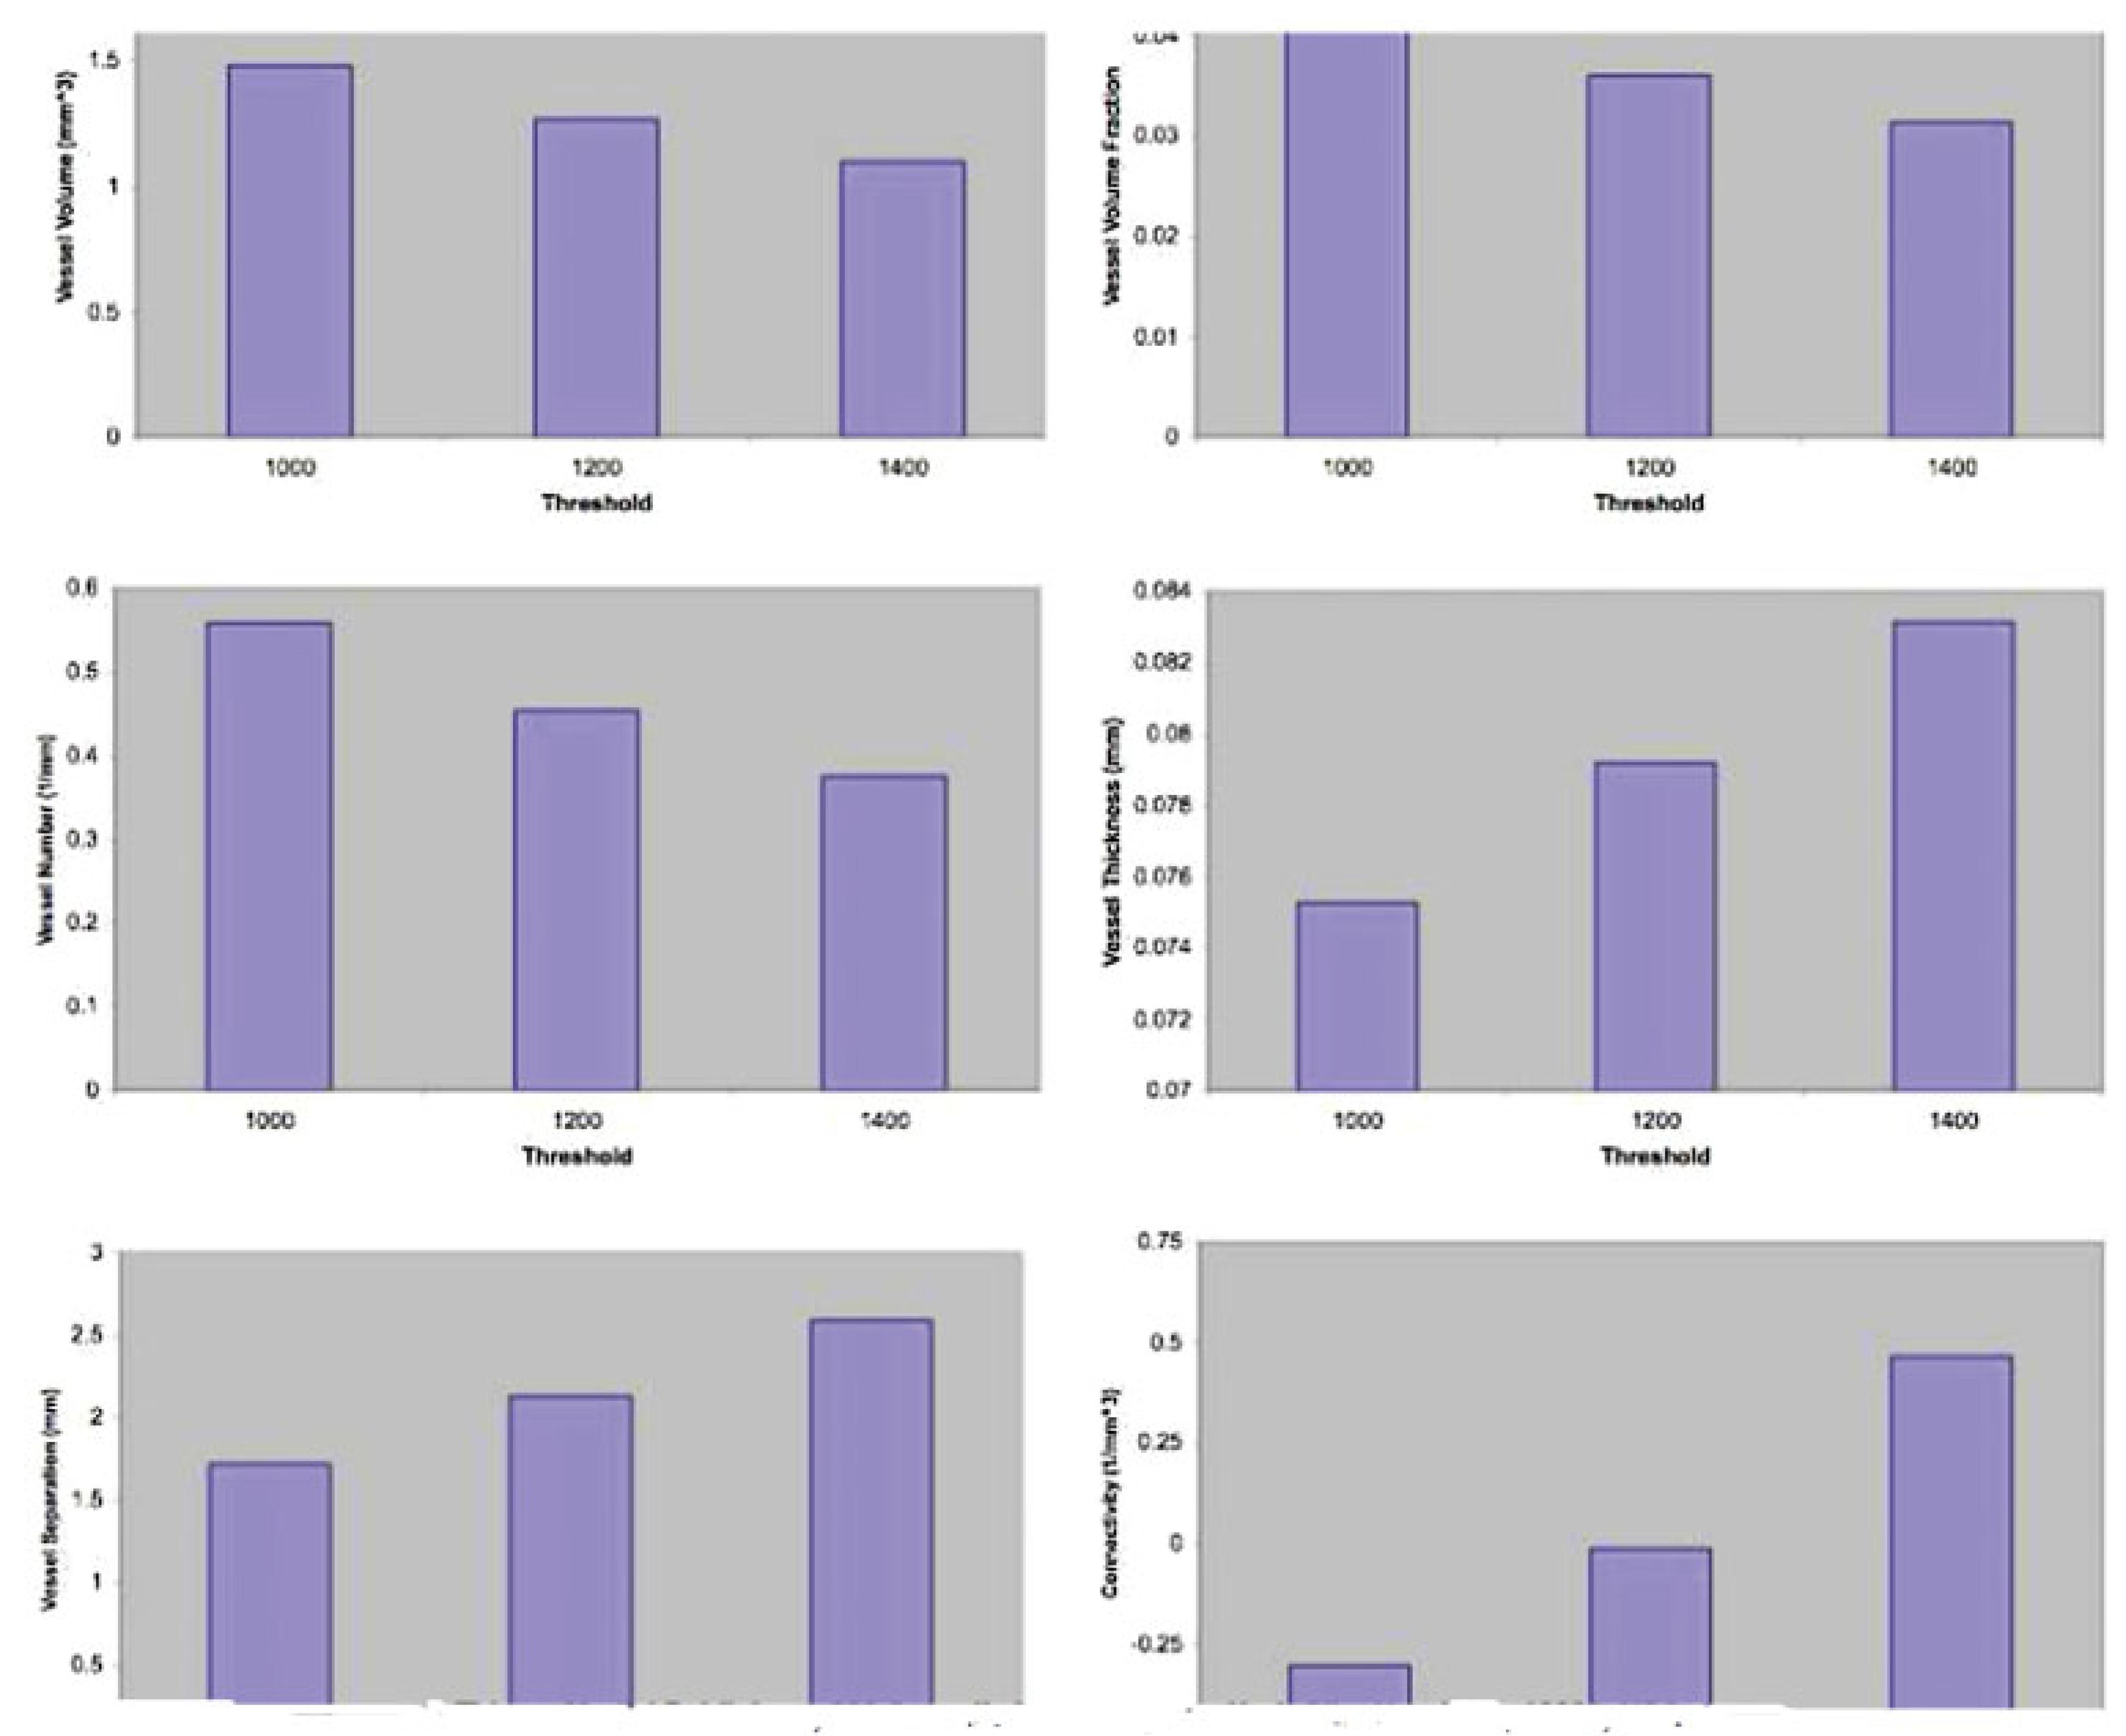
Radiomorphometric values including vessel volume, vessel volume fraction, connectivity, number, thickness, and separation were analyzed using three different thresholds at 1000 HU, 1200 HU, and 1400 HU respectively on micro-CT. Isotropic voxel size is a main determinant of the ability to resolve small objects on micro-CT scans and thus affects image quality. Although smaller voxel sizes result in longer scan times and much larger datasets, as can be seen in
Figure 3, they also afford the opportunity to resolve smaller caliber vessels that cannot be seen with larger voxel sizes.
Alteration of the thresholding had a visible effect on the radiomorphometric parameters of the vasculature (
Figure 3). As the threshold was increased, imaging of smaller vasculature was minimized and that of larger vasculature was maximized. To capture the maximal vascular content of the bone, it was evident from our examination of the imaging that 1000 HU was the optimal threshold for analysis.
In our study, data from 10 hemimandibles were compared. Three of the hemimandibles were excluded from the study due to less optimal perfusion technique, leaving a total of seven samples. Descriptive statistics were conducted for statistical analysis. Each result was reported as mean ± standard deviation and variance. Vessel volume was 1.60 ± 0.23 (variance ¼ 0.053); vessel volume fraction, 0.03 ± 0.01 (variance ¼ 0.000); vessel number 0.49 ± 0.09 (variance ¼ 0.004); vessel thickness, 0.06 ± 0.01 (variance ¼ 0.073); vessel separation, 2.05 ± 0.29 (variance ¼ 0.073); connectivity, 0.08 ± 0.50 (variance ¼ 0.206). Minimal variance in the quantitative measurements resulted in reproducible metrics for three of the radiomorphometric parameters (
Figure 4). Vessel connectivity had the largest variance with a mean of —0.08 and a standard deviation of 0.50. This could be due to the optimal threshold that we chose. The micro-CT image at thresholding of 1000 HU had more extensive vasculature, especially tiny capillaries. At higher thresholds of 1200 HU and 1400 HU, there were fewer tiny broken capillaries; therefore connectivity was affected by the thresholding we chose.
Discussion
Angiogenesis plays an essential role in bone development and fracture repair [
11]. In osseous healing, tension gives rise to vascular growth and development of osteoblasts, resulting in new bone formation. Flat bones, like the skull or jaw bone, develop from clusters of condensed mesenchyme. Areas of condensed mesenchyme lie around the shelves and spicules of bone. This is the process of intramembranous ossification, which is an essential component in the natural healing of bone fractures. New bone formation occurs in close spatial and temporal association and proximity to capillary invasion, suggesting that angiogenesis and osteogenesis are coupled. Although numerous animal models have been developed to successfully study the underlying molecular mechanisms of bone healing, a 3D, quantitative analysis of the vasculature would add critical anatomic information to more precisely understand the vital relationship between bone regeneration, healing, and angiogenesis. The purpose of this study was to use micro-CT after vessel perfusion to perform a 3D quantitative analysis of mandibular vascular networks. This novel technique is an accurate, nondestructive, rapid, stereological assessment of vascular network microarchitecture that utilizes automated computer algorithms capable of accurately quantifying and assessing differences in vessel volume and projection.
The radiomorphometric parameters outlined in our study may also serve as important outcome measures of healing and therapeutic interventions to assuage pathological conditions of bone. These precise measures of bone vascularity may now be added to the other accepted and conventional outcome measures of bone healing (i.e., biomechanical, radiodensitometric, and histological analysis) to perform a more comprehensive investigation of new bone formation and osseous healing.
Previous analytical techniques aimed at investigating bone vasculature included both histological methods and Doppler flow. Microscopic evaluation of tissue slides is labor intensive, and quantification is limited by sectioning and the restriction of 2D analyses. Doppler flow imaging addresses flow but is bereft of microarchitectural context and therefore cannot quantify vascularity or vascular networks. Microangiography is the closest technique to micro-CT imaging with contrast perfusion in that it is a quantitative measurement of vascularity. Historically, there were many studies done on the vasculature of animals using microangiography. In 1913 Goby introduced the concept of microradiography, the study of fine histological sections by radiography. Grechischkin and Prives in 1935 expanded this technique and applied it to the study of minute blood vessels, using thorotrast as a contrast medium. From 1947 to 1949, Barclay refined the technique and showed excellent illustrations of renal vasculature. In 1951, Tirman and Banker published clear illustrations of the microcirculation of the kidneys, liver, intestines, gallbladder, spleen, heart, and lungs. Bellman and Engstrom further refined the technique and renamed the process “microangiography” because the new term more clearly defined a procedure in which blood vessels were visualized by means of roentgen contrast media and microradiographic techniques. The early work of Cernavskis and Hunter demonstrated the vascular patterns of the rat mandible using X-ray micro-angiography in 1965 [
12,
13,
14,
15,
16,
17]. Microangiography, however, is also 2D and labor intensive and is more of a semiquantitative technique that does not lend itself easily to rapid and reproducible quantification of larger numbers of specimens.
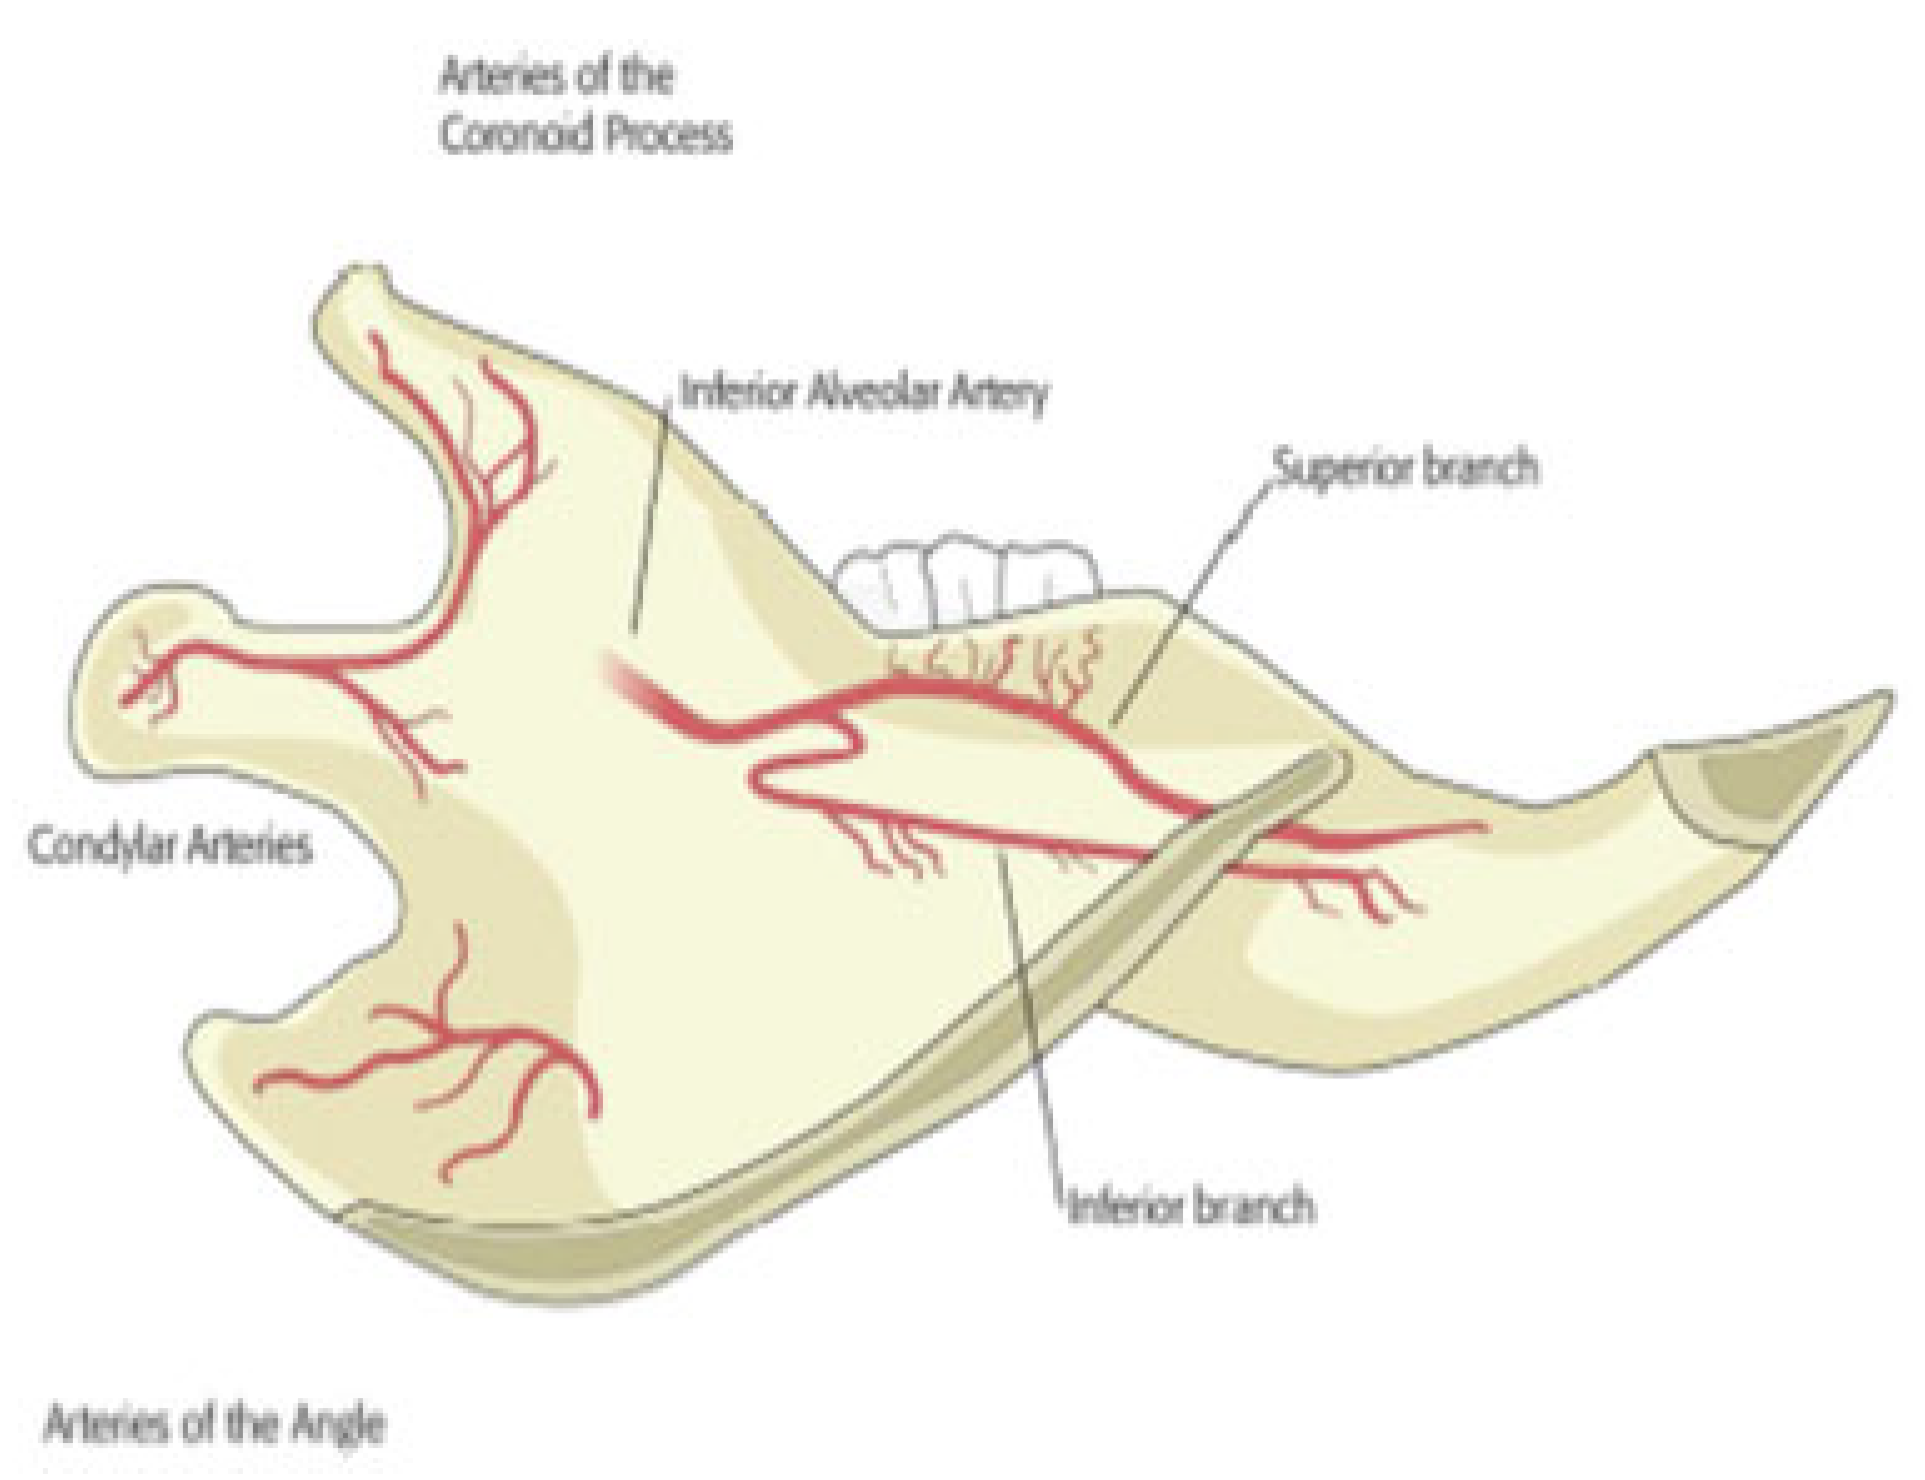
In addition to the computational anatomical metrics achievable by micro-CT with vessel perfusion, this powerful technique also generates 3D images that can be used for vascular mapping of microvascular networks. In this study, we demonstrated there are two anatomic zones of vasculature in the rat mandible. In the anterior zone near the incisor tooth and molar roots, there was a consistently greater number of blood vessels, most of which were smaller penetrating vessels. Conversely, in the posterior zone, approximating the coronoid, condyle, and angular processes of the mandible, there were fewer blood vessels (
Figure 5). Our findings using micro-CT after vessel perfusion were consistent with previous vascular studies by Huelke and Castelli in the murine mandibles using 2D microangiography [
18].
In our study we have also demonstrated the optimal thresholding for analysis of the 3D micro-CT images. Thresholding affects the fidelity of the quantification of vascular network morphometric parameters. An appropriate thresh- old is essential for analyzing 3D images on CT datasets. We initially choose 1000 HU, 1200 HU, and 1400 HU as the thresholds to evaluate the different radiomorphometric parameters based on visual interpretation of the 3D images. Selecting an image threshold is the process of defining a cutoff gray-scale value that separates the image into either the background or part of the study object. At a lower threshold of 1000 HU, smaller vessels are more apparent, but bigger vessels appear artificially large because of the partially filled voxels in the images. On the other hand, to gain the most accurate image of the larger vessels, a higher threshold must be used, but this omits the smaller vessels from the image. There is a tradeoff in choosing the best possible threshold. From our examination of the images, 1000 HU is the optimal threshold in calculating the radiomorphometric parameters. Our study established the utility of micro-CT after vessel perfusion as a vascular mapping and imaging modality capable of generating a 3D anatomic representation of the vasculature of the murine mandible. The reconstructed im- ages allowed discrimination and confirmation of the vasculature previously only identified through labor-intensive methodology. In addition, however, the vascular mapping utilized in this novel technique allowed rapid imaging of the course of the blood vessels within the mandible. This study has validated vascular analysis utilizing micro-CT after vessel perfusion as an innovative, rapid, and reproducible technique that can be employed for future studies involving the analysis of vascular anatomy.
For the first time, to our knowledge, we have demonstrated that micro-CT imaging combined with the use of perfused contrast agents and bone decalcification provides a robust methodology for evaluation of rat mandibular vascular net- works. Specifically, micro-CT is an advantageous quantitative method to calculate vascularization compared with X-ray microangiography, laser Doppler flow, microsphere analysis, or histological inspection because it provides high-resolution, quantitative, 3D, and objective data analysis. The data presented here will serve as baseline reproducible reference measurements that can be used to compare and assess the role of angiogenesis during mechanically induced bone formation in DO as well as other forms of bone regeneration and repair in the craniofacial skeleton.