Article

Numerical Study of Leakage and Diffusion of Underwater Oil Spill by Using Volume-of-Fluid (VOF) Technique and Remediation Strategies for Clean-Up

1
State Key Laboratory of Shale Oil and Gas Enrichment Mechanisms and Effective Development, Beijing 102206, China
2
SINOPEC Research Institute of Petroleum Engineering Co., Ltd, Beijing 102206, China
3
College of Petroleum Engineering, Northeast Petroleum University, Daqing 163318, China
*
Author to whom correspondence should be addressed.
Processes 2022, 10(11), 2338; https://doi.org/10.3390/pr10112338
Submission received: 25 October 2022 / Revised: 6 November 2022 / Accepted: 7 November 2022 / Published: 9 November 2022
(This article belongs to the Special Issue Remediation Strategies for Soil and Water)

Abstract

:
An oil spill accident will cause serious harm to marine ecology and the environment. Rapid response and effective prevention methods are required to minimize the damage of oil spill accidents. The critical problems that marine emergency rescue teams face are when the spilled oil reaches the sea surface, the extent of the spilled oil, and how far they are from the drilling platform. However, there is no reliable model to predict the diffusion distance of spilled oil. Accurately predicting the diffusion characteristics of underwater spilled oil can provide timely and accurate information for the treatment of oil spill accidents and guide the correct implementation of emergency treatment. In this paper, the computational fluid dynamics (CFD) method was used to establish a two-phase flow model for the diffusion of a submarine oil spill. The volume-of-fluid (VOF) technique was implemented to track the interface between oil–water phases. The effects of different parameters on leakage and diffusion characteristics were investigated by adjusting spilled oil velocity, ocean current velocity, crude oil density, and crude oil viscosity. The logarithmic velocity profile was adopted for ocean currents to conform to the actual flow near the sea surface. A user-defined function (UDF) was developed and applied for CFD modeling. The focus was on analyzing the diffusion range (rising height Hp and lateral migration distance Wp) from full-field data. The results indicate that the oil spill velocity, ocean current velocity, crude oil density, and crude oil viscosity impact the viscous shear force, the oil spill’s inertia force, and the current shear effect. The formula for calculating the lateral migration distance of spilled oil under different working conditions was obtained by fitting. The results of this study can provide a scientific basis for formulating an emergency treatment plan for offshore oil spill accidents and minimizing the harm to marine ecology and the environment.

1. Introduction

The exploration and extraction of offshore oil and gas resources have become essential to solving the shortage of limited onshore oil resources globally [1,2]. However, large-scale offshore oil and gas exploration and extraction will inevitably bring the risk of crude oil leakage [3,4]. Many severe underwater oil spill accidents have occurred worldwide in the past decades. For example, the Deepwater Horizon accident in the Gulf of Mexico in 2010 was the most severe offshore oil spill on record. The spill lasted three months, resulting in a large amount of crude oil leaking at sea [5,6,7].
The spread of oil spills at sea will cause serious harm to the marine ecological environment. Rapid response and effective prevention methods are required to minimize the damage of oil spill accidents [8]. The critical problems that marine emergency rescue teams face are when the spilled oil reaches the sea surface, the extent of the spilled oil, and how far they are from the drilling platform. Therefore, it is of great significance to predict the underwater diffusion characteristics of spilled oil and its migration distance under the action of ocean current for the emergency response of oil spill treatment [9,10].
For underwater oil spills, the oil phase gradually disperses in the process of rising to the water surface under the action of buoyancy, partially dissolves in seawater, and is biodegradable, partially deposited on the seabed and partially surfaced. Underwater oil spills are generally divided into two stages: the diffusion and migration process in seawater and the floating process after oil spills reach the sea surface [11]. Suppose the location of the spilled oil can be deduced according to the marine and meteorological conditions after the spilled oil on the sea surface is discovered. In that case, emergency remedial measures can be taken to plug the leak point in time. After the oil comes out of the water, it can be disposed of by means of emergency recovery, adsorption, combustion, etc. Some of the escaped pollutants migrate with the seawater, and further through volatilization, dissolution, sedimentation, biodegradation, etc. If we can predict the location of the spilled oil before it reaches the sea surface, and then deal with the oil spill at the beginning of its diffusion and drift, this will not only reduce the workload but also reduce the pollution of the marine environment.
As the field test of underwater crude oil leakage and diffusion is difficult, it is almost impossible to capture the entire spilled oil diffusion trajectory through experimental research. With the progress of science and technology, using numerical simulation instead of field tests has attracted the attention of researchers [4,12,13,14]. Many scholars are committed to the numerical simulation of offshore oil spills to achieve more accurate prediction after oil spills and provide a technical basis for the timely handling of accidents and the impact assessment of accidents.
However, the underwater environment is complex, and various factors will change the leakage and diffusion behavior of spilled oil. In this study, we use the computational fluid dynamics (CFD) method to establish a two-dimensional numerical model of the underwater oil spill. The volume-of-fluid (VOF) method was introduced to track the interface between oil–seawater phases. The simulated results were in agreement with the experimental results of Zhu et al. [15]. The effects of different parameters on leakage and diffusion characteristics were investigated by adjusting spilled oil velocity, ocean current velocity, crude oil density, and crude oil viscosity. The results of this study can provide helpful information for taking emergency response measures to reduce the impact of crude oil spillage.

2. Computational Methodologies

2.1. Governing Equations

Spilled oil and seawater are considered incompressible fluids, and it is assumed that there is no phase transition and slip at the oil–water interface. The volume-of-fluid (VOF) multiphase model is implemented to simulate the diffusion of underwater oil spill [16,17]. The interface tracking between the phases is accomplished by solving the continuity equation for the volume fraction of oil–water in two phases. The VOF method has been continuously improved and widely used for decades since it was proposed. It can naturally keep the mass of the fluid in balance. It can efficiently deal with the large deformation of the free surface and the change of the topology of the free surface. For calculating the fluid volume in a cell, it is only necessary to calculate the fluid volume in the cell adjacent to the cell. Based on this definition, the continuity equations for the oil and water phases can be written as follows.
α q t + ( α q u ) = 0
where u is the velocity vector of the fluid, α is the volume fraction of phase q, and the volume fraction of each phase is calculated based on the following formula:
q = 1 n α q = 1
The momentum equation is calculated by using a single-velocity field u acting on a mixed fluid with a density of ρ = α q ρ q + α p ρ p and a viscosity of μ = α q μ q + α p μ p . The momentum equation can be written as follows.
t ( ρ u ) + ( ρ u u ) = p + τ + ρ g + F
In which, p is the pressure, g is the gravity acceleration, τ is the stress tensor, and F describes the interaction forces acting on phases such as surface tension.
The realizable k-ε turbulence model is used to solve the velocity fluctuation caused by turbulence. Due to the excellent compromise between numerical requirements and stability, the realizable k-ε turbulence model has been widely used in industry in recent decades [18,19,20]. In the realizable k-ε model, the turbulent kinetic energy (TKE) k and its dissipation rate ε are described by the following two balance equations.
( ρ k ) t + ( ρ k u j ¯ ) x j = x j ( μ + μ t σ k ) k x j + G k ρ ε
( ρ ε ) t + ( ρ ε u j ¯ ) x j = x j ( μ + μ t σ ε ) ε x j + ρ C 1 S ε ρ C 2 ε 2 k + μ ρ ε
where σk and σɛ are turbulent Prandtl numbers of k (TKE) and ε (dissipation rate), Gk is the generation of TKE due to the average velocity gradient, described by:
G k = μ t S 2
In which, μt is the turbulent dynamic viscosity, which are defined by:
μ t = ρ C μ k 2 ε
S is the modulus of the mean rate of strain tensor, described by:
S = 2 S ij S ij
S ij = 1 2 u i x j + u j x i
The coefficients appearing in the above equations are as follows: C 1 = max 0.43 , η η + 5 , η = S k ε , σk = 1.0, σɛ = 1.2, C2 = 1.9.

2.2. Geometric Model and Boundary Conditions

Under the action of ocean currents, the leaked crude oil from the wellhead will migrate and diffuse downstream. A two-dimensional numerical simulation method is used to capture the migration behavior and diffusion process of the spilled oil. The selected two-dimensional geometric calculation domain is a section parallel to the current direction. At the bottom of the calculation area is a crude oil leakage wellhead located on the seabed and perpendicular to the calculation area, and it leaks crude oil into the sea at a certain speed. The density of seawater increases unevenly with the increase of depth, but in this paper, it is assumed that the density of seawater does not change with the increase in depth. The oil spill wellhead is located 5 m from the left and 15 m from the right endpoint. The water depth is H = 20 m, and the wellhead size is D = 0.5 m. The overall diagram of the geometric calculation area and boundary conditions is shown in Figure 1.
The logarithmic speed profile is assumed for ocean currents to conform to the actual flow near the sea surface. The current velocity flow distribution is given as:
U = U 0 2 y H y H 2
where U0 is the maximum current velocity that appears at the free surface; in this paper, U0 = 0.05~0.15 m/s is taken, and the maximum current velocity is located on the sea surface; H is the water depth, y is the height variable (0 ≤ yH).
The left side of the calculation domain and wellhead are set as the velocity-inlet boundary conditions. The velocity distribution of the ocean current meets the above velocity distribution relationship. The seabed and well wall at the bottom are set as the wall boundary conditions, and the other boundaries are selected as the outflow boundary conditions.
The governing equations are discretized by the finite volume method and solved by the Semi-Implicit Pressure Linked Equation (SIMPLE) algorithm. The time step was 0.001 s, the total number of time steps was set as 4 × 10⁴, and the total calculation time was 40 s. The convergence criterion is 10−5 for the residual error of governing equations.

2.3. Grid Details and Grid Mesh Independence

The computational domain is meshed with structured hexahedral mesh elements, and the mesh generation near the wellhead is denser, which can more accurately describe the leakage state. The hexahedral mesh generation method based on topological segmentation is adopted to obtain the topological segmentation method of the model and carry out all hexahedral mesh generation. In the computational domain far from the wellhead, the mesh division is sparse, reducing the calculation time while ensuring the results were accurate.
A comparison of the rising altitude of spilled oil among grid densities and the difference in the rising height between 188,702 and 285,902 hexahedral nodes is less than 0.5% (as shown in Table 1). The grids with 188,702 hexahedral grids produce grid-independent results per the accuracy selected to balance computational cost and accuracy. The schematic diagram of the grid details is shown in Figure 2.

2.4. Model Validation

The model’s accuracy was verified according to the underwater oil spill experiment results of Zhu et al., as shown in Figure 3. The modeling method adopted in this paper was used to establish a matching numerical model regarding the experimental geometric conditions and oil physical properties. As seen in Figure 3, the simulation results based on the VOF model were in good agreement with the experimental results. Therefore, the numerical results were reliable and can be used to study the diffusion law of underwater oil spills.

3. Results and Discussion

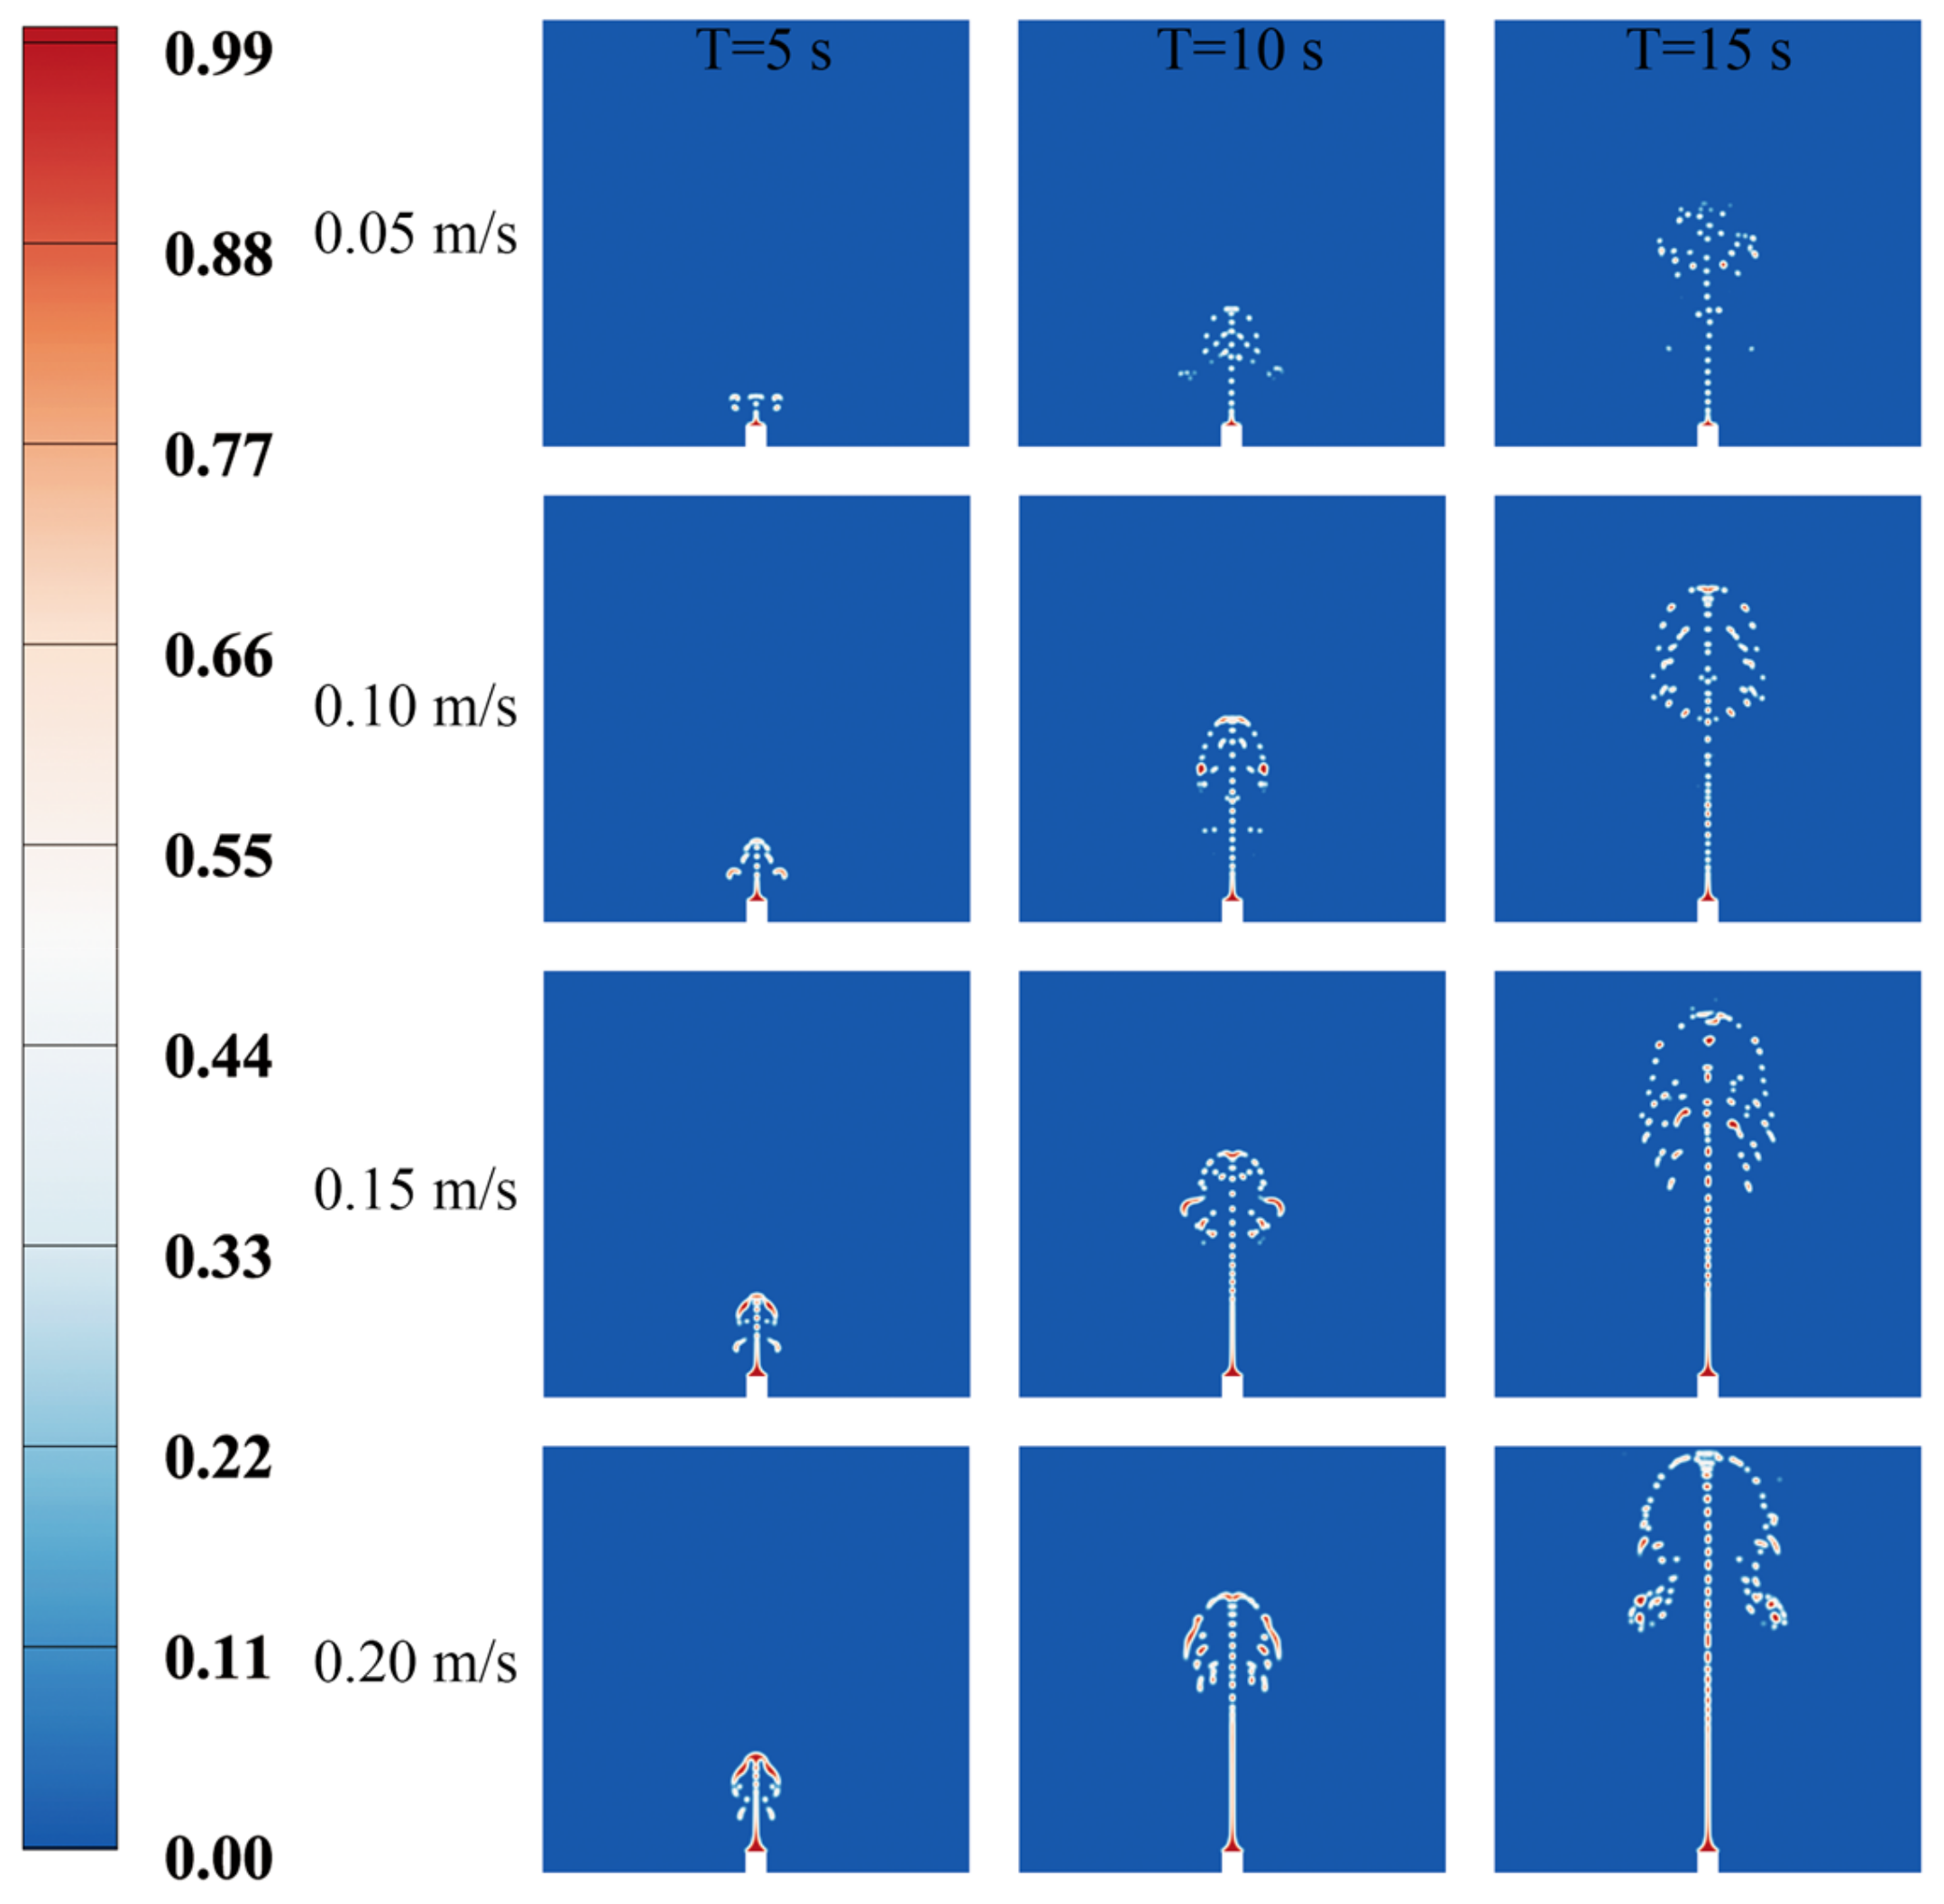
3.1. Effects of the Oil Spill Velocity

Firstly, the change of oil spill morphology with time at different oil spill velocities when U0 = 0 m/s is obtained, as displayed in Figure 4. The time variable is shown horizontally, and the oil spill distribution at T = 5 s, T = 10 s, and T = 15 s is shown from left to right. Longitudinal is the variable of oil spill velocity; that is, each row represents the cloud map of oil spill concentration distribution when the oil spill velocity is 0.05 m/s, 0.10 m/s, 0.15 m/s, and 0.20 m/s, respectively, and the oil spill velocity increases from top to bottom.
For the different initial oil spill velocities, the lateral migration distance of spilled oil does not change significantly with the increase of spill velocity in the absence of ocean current, which indicates that different spill velocities have no significant impact on the diffusion of the horizontal oil spill. Under different oil spill velocities, the changing trend of longitudinal distance is linear with spill velocity. When the crude oil leaves the wellhead, it is greatly affected by the initial momentum. Then, its acceleration gradually decreases as the oil droplets float upward. The migration of spilled oil mass can be divided into two successive stages: the accumulation stage and the buoyant droplet stage. In the floating process, the pressure difference is the main driving force in the initial stage, and the droplet buoyancy is the driving force in the other stages.

3.2. Effects of the Ocean Current Velocity

The ocean current velocity is the main factor affecting the diffusion of spilled oil. Ocean current can accelerate the dilution and purification of pollutants due to their rapid diffusion and correspondingly expand the scope of pollution. The change of oil spill diffusion morphology with time under different ocean current velocities is obtained when the oil spill velocity is Up = 0.15 m/s, as shown in Figure 5. Among them, longitudinal is the time variable; that is, each line from top to bottom represents the oil–water distribution when the time point is T = 10 s, T = 20 s, T = 30 s, and T = 40 s, respectively; the horizontal is the maximum current velocity; that is, each column represents the oil spill distribution with the maximum current velocity of 0.05 m/s, 0.10 m/s, and 0.15 m/s, respectively.
It can be acknowledged that the length of the oil column increases with the increase of ocean current velocity. The momentum effect loses its dominant position when the oil column rises to a certain height. The positive buoyancy formed by the density difference controls the free diffusion of the oil droplets, and the oil column is blown into oil droplets under the action of the ocean current. Under the action of the ocean current, the angle between the oil column and horizontal plane changes with the change of ocean current velocity, mainly due to the oil column being easier to tilt along the current direction. According to the oil–water distribution corresponding to T = 30 s and T = 40 s, the momentum effect of the upper half of the oil column basically disappears, and only a small amount of oil droplets disperses. The reason is that when the oil column rises to a certain height, its initial momentum will be weakened, which will reduce its ability to resist ocean currents, thus forming a depression in the upper part.
The local velocity distribution of the underwater oil spill is shown in Figure 6. The three different current velocities correspond to different oil spill diffusion areas. When U0 = 0.15 m/s, the corresponding diffusion range is the largest, and when U0 = 0.05 m/s, the corresponding diffusion range is the smallest. The size of the diffusion region mainly depends on the number of dispersed oil droplets. Near the sea level, on the one hand, the initial momentum of the oil column decreases greatly; on the other hand, due to the large current velocity near the sea surface, the number of oil droplets is also large. When U0 = 0.15 m/s, the crude oil will be affected by a strong current after being ejected from the wellhead. The upper half of the oil column will be blown away to form oil droplets, extending horizontally. At this time, the momentum of the oil column is not so significant, and it will be affected by the greater current velocity near the surface.
On this basis, the vorticity distribution characteristics of the spilled oil at T = 40 s are obtained, as shown in Figure 7. With the continuous overflow of crude oil from the wellhead, the oil spill trajectory has a centralized effect. The ocean current has a significant impact on the horizontal diffusion of the spilled oil, resulting in the dispersion effect of its motion trajectory. The main body of spilled oil inclines to the right and diffuses upward under the action of the transverse current, and a small part of the spilled oil diffuses to the left under the action of free drift; in the initial stage of the oil spill, the spilled oil is mainly distributed as dispersed oil droplets and oil blocks. With the increase of oil spill degree, a large number of continuous oil masses and oil belts also increase, the range of underwater pollution will also increase, and the more significant current velocity will also promote the growth of oil droplets.
The rising height Hp under different maximum current velocities is compared, as shown in Figure 8. In the first 5 s, the spilled oil has approximately the same rising height because the oil spill leaked from the wellhead has relatively large inertia, which exceeds the shear effect of the ocean current. The crude oil is dispersed or combined under the joint action of gravity, inertia force, buoyancy, and shear stress, and its size changes with time. At the same time, with the growth of rising height, the viscous shear force gradually weakens the inertia force of the spilled oil. With the increase of Hp to 5 m, the shear effect of the ocean current begins to strengthen, and the greater the velocity of the ocean current, the more shear stress and kinetic energy it exerts on the spilled oil, thus the rising height of the spilled oil is slightly increased.
The variation of lateral migration distance Wp with time under different current velocities is compared, as shown in Figure 9. The oil droplets move downstream by the shear action of the ocean current while floating. With the gradual increase of the maximum ocean current velocity, the lateral migration distance of the spilled oil gradually increases. When T = 10 s, the growth rate of the lateral migration distance of the spilled oil under the water is almost the same. In comparison, when T = 40 s, the lateral migration distance growth rate near the sea surface is significantly greater than its growth rate under the water. The crude oil moves downstream, and the lateral migration distance increases significantly with the decrease of water depth. The reason is that the upper seawater flow velocity is higher, exerting greater kinetic energy on the oil flow; therefore, the seawater flow plays an important role in the transportation and diffusion of crude oil. The impact of the actual seawater flow velocity distribution on the spilled oil trajectory should be considered, and a relatively accurate prediction should be made.

3.3. Effects of the Crude Oil Density

The variation of the rising height Hp under different crude oil densities is obtained, as shown in Figure 10. The crude oil density affects the diffusion speed and diffusion range in seawater. The greater the density, the longer it takes crude oil to diffuse from the seabed to the sea surface. When ρp = 750 kg/m3, the leaked oil diffuses from the leaking wellhead to the sea surface in about 28 s. When ρp = 900 kg/m3, the rising distance of the spilled oil is 9.7 m at T = 28 s, which is 10.3 m different from the crude oil with a density of ρp = 750 kg/m3 at the same time. This is because the higher the density of crude oil with the same volume, the greater the gravity and the same buoyancy. Therefore, the vertical upward force on high-density crude oil is smaller, and the rising speed is slower.
The lateral migration distance Wp with time under different crude oil densities is obtained, as shown in Figure 11. An increase in the density of crude oil leads to a decrease in lateral migration distance in seawater. When ρp = 750 kg/m3, the lateral migration distance of leaked oil in seawater after about 28 s is 14.7 m; when ρp = 900 kg/m3, the lateral migration distance of spilled oil at T = 28 s is 8.5 m, which is 6.2 m different from the crude oil with a density of ρp = 750 kg/m3 at the same time. Before the spilled oil reaches the sea surface, it is challenging to detect the lateral movement under the sea surface with monitoring instruments. In addition, floating containment booms are an essential device in the fight against coastal pollution, allowing us to contain the pollutant before its recovery [21]. Therefore, studying the maximum horizontal movement of crude oil with different densities is of great significance.

3.4. Effects of the Crude Oil Viscosity

The viscosity is an essential quantitative parameter to characterize fluid rheology and can indicate the difficulty of crude oil flow. The viscosity change will change the diffusion law of spilled oil underwater. Therefore, the variation of the rising height Hp with time under different viscosities is obtained, as shown in Figure 12. The smaller the viscosity of the leaked crude oil, the faster the oil leakage rises from the leaking wellhead to the sea surface, and the shorter the time. When crude oil viscosity is μ = 0.01 Pa.s at T = 30 s, the rising distance of the spilled oil is about 15.1 m, and when the crude oil viscosity is μ = 0.50 Pa.s, the rising distance is about 12.5 m.
The variation of crude oil lateral drift distance Wp with time under different crude oil viscosities is obtained, as displayed in Figure 13. The greater the viscosity of crude oil, the smaller the lateral diffusion distance in seawater. At μ = 0.01 Pa.s, the lateral migration distance of the leaked oil in the seawater after about 28 s is 13.6 m, when μ = 0.50 Pa.s at T = 28 s, the lateral diffusion distance of the spilled oil is 11.1 m, and the viscosity at the same time is μ = 0.01 Pa.s and crude oil has a difference of 2.5 m. The increase of the viscosity will reduce the diffusion speed and drift speed of the spilled oil, and the oil mass with high viscosity will also block the drift and dispersion of the spilled oil. Therefore, the thickness of the oil film in the high-viscosity spilled oil is relatively thick; The slower diffusion speed provides more response time for oil spill emergency response.

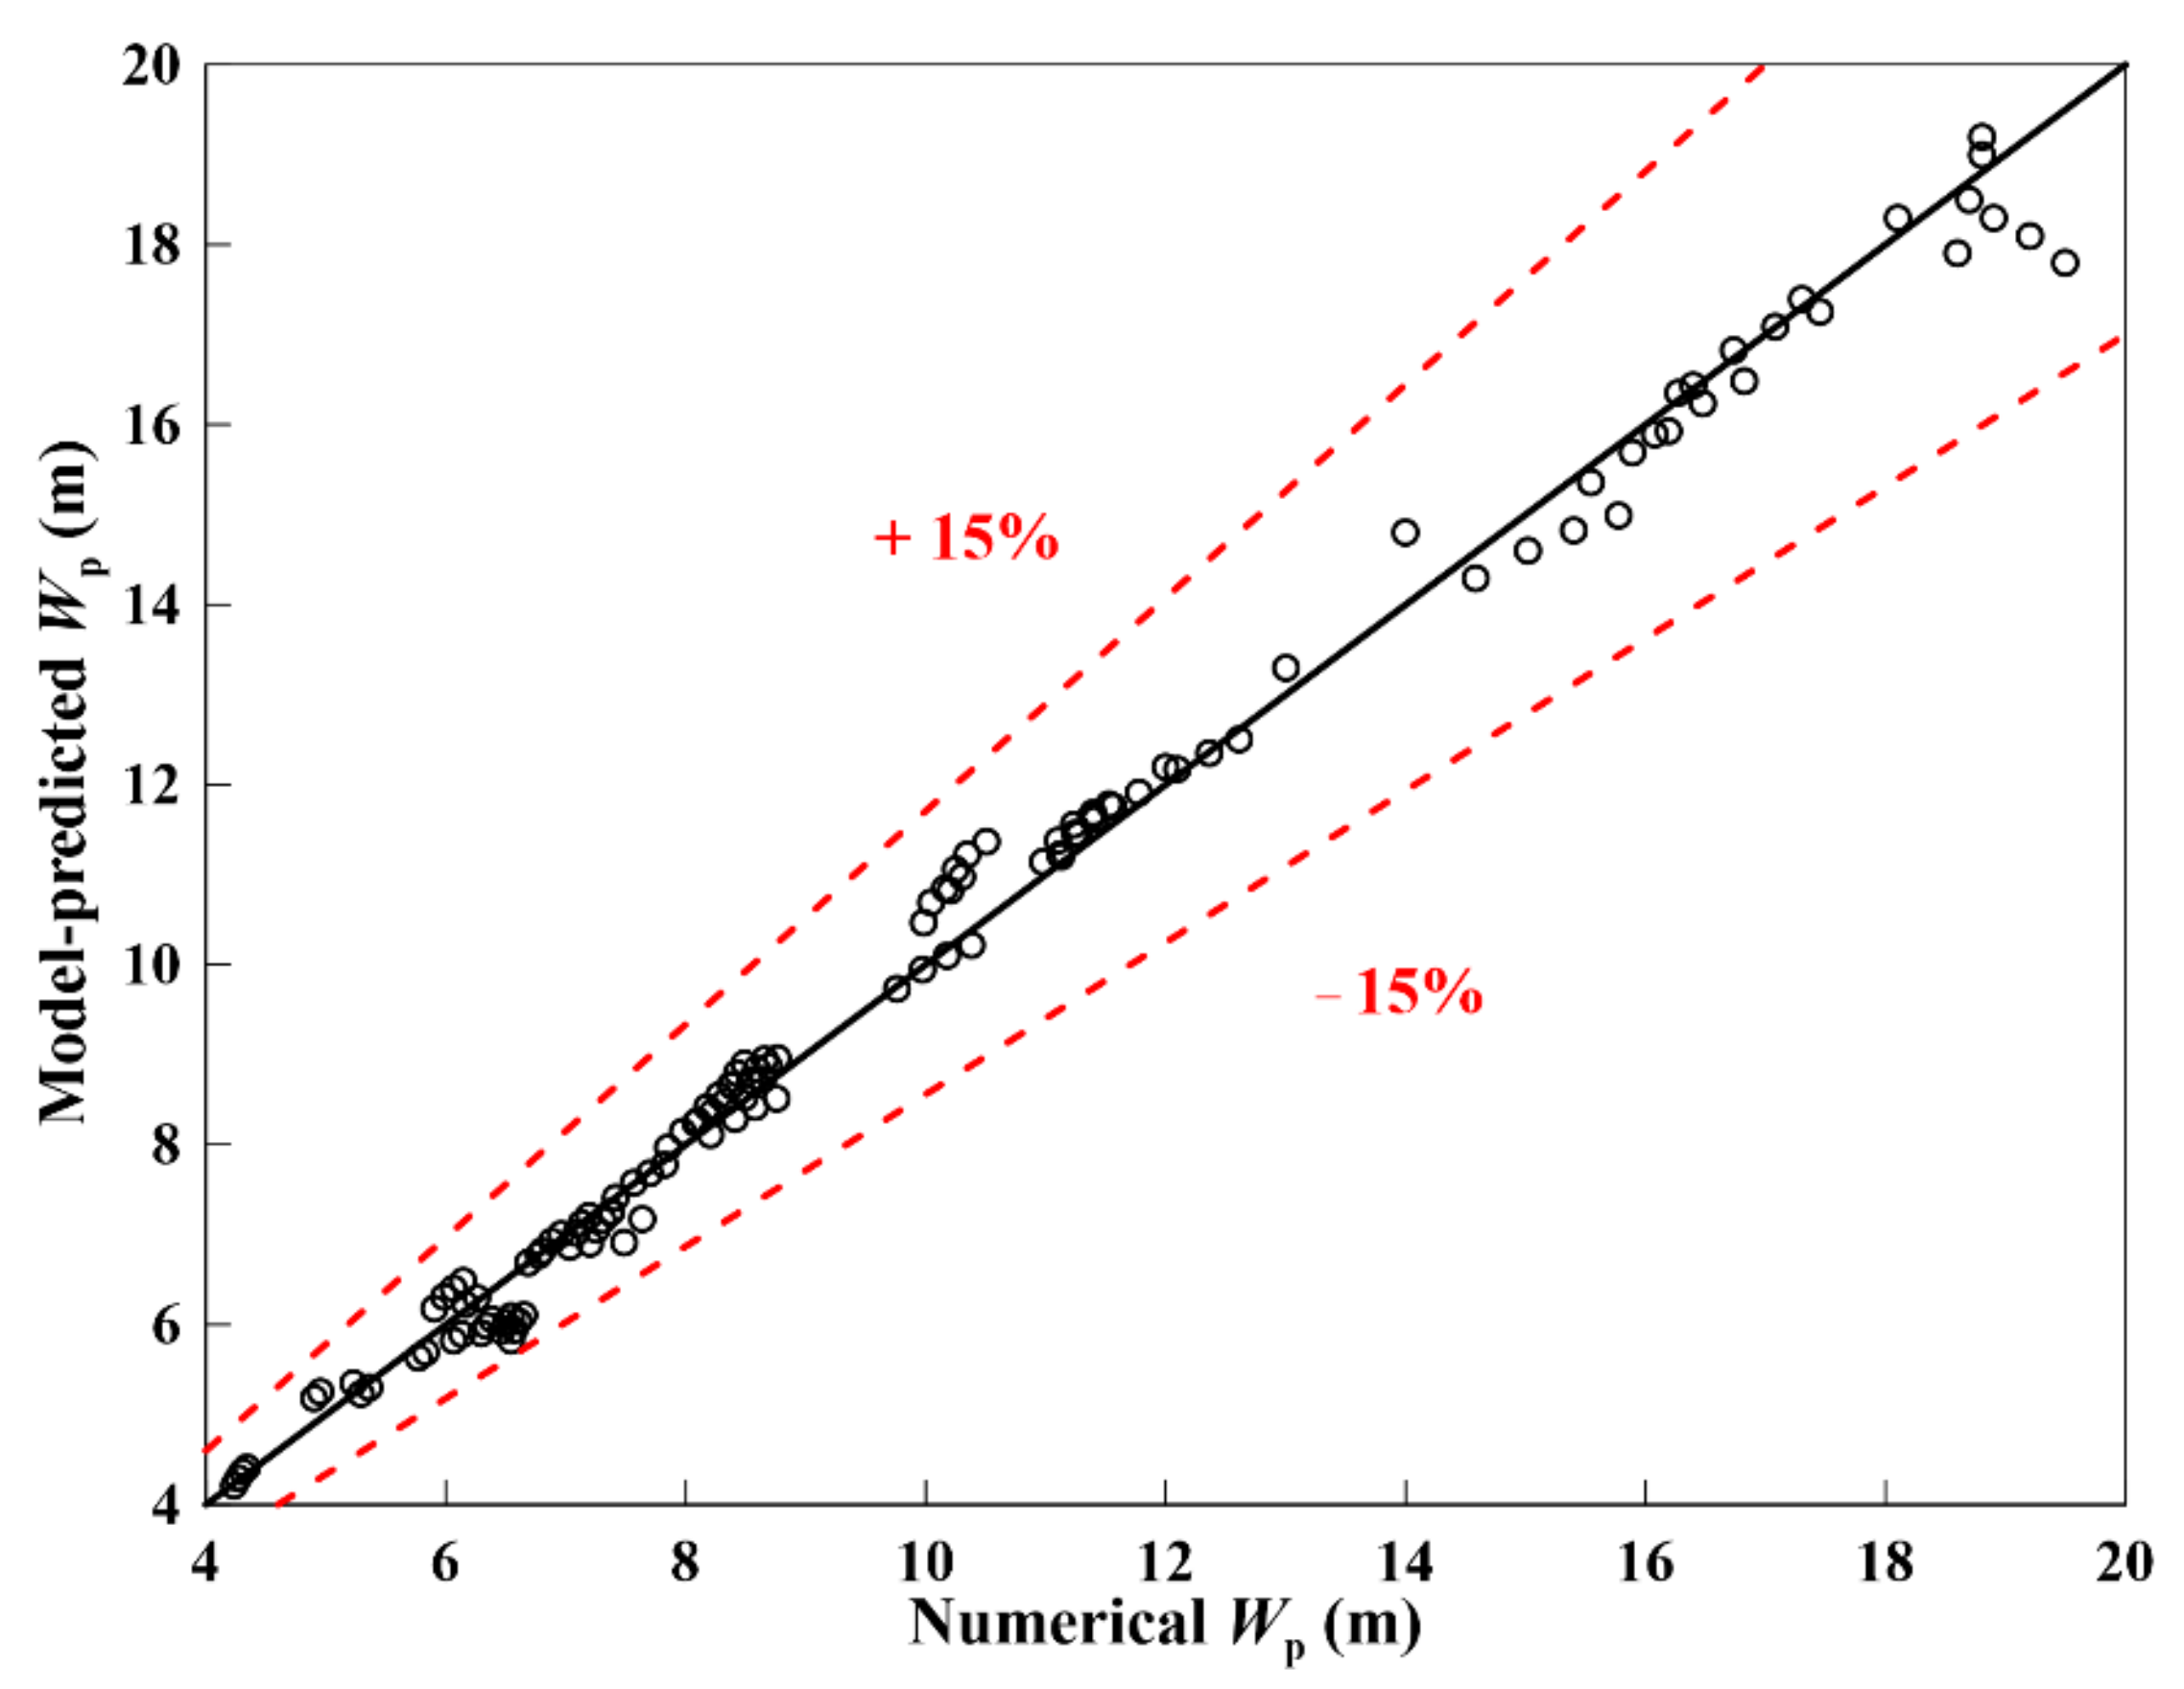
3.5. Parameter Fitting

According to the above analysis, the lateral migration distance Wp is an important index to determine the impact range of an oil spill, so it is necessary to provide the variation of Wp with oil spill time under different working conditions. According to the numerical simulation results, the lateral migration distance Wp at different times under various working conditions is obtained, and the parameters are fitted, as seen in Equation (11). It is satisfied between the oil spill time and various influencing factors, and the power relationship between the oil spill lateral migration distance Wp and various influencing factors.
W p = 50.8 μ 0.42 ρ 0 0.45 U 0 U p 0.98 T 1.25
Figure 14 shows fitted curves of the relationship between the simulated lateral migration distance and the model-predicted lateral migration distance. Our correlations reasonably agreed, within ±15%, in comparison with the numerical lateral migration distance.

3.6. Remediation Suggestions on Oil Spill Treatment Measures

Through the establishment of an emergency response mechanism for science, which can effectively protect the marine ecological environment, we propose to respond to underwater oil spill pollution. The results in this study show that it still takes some time for the oil droplets to reach the sea surface. So, improving the sensitivity, positioning accuracy, and response time of the oil spill early warning and detection device can maximize the emergency management time and reduce the damage of the oil spill accident to the environment. Emergency information construction can help people accurately judge the scope of oil spill accidents for the first time and judge the accident level and environmental damage risk.
In the buoyant droplet stage, the oil spill is greatly affected by the ocean current velocity, so it is necessary to strengthen the oil spill emergency information construction, such as real-time monitoring of the ocean current velocity change in the sea area where the drilling is located; real-time information processing, which can be used to guide the direction and scope of the sea area where the oil spill is spreading; and using unmanned aerial vehicle (UAV) and satellite monitoring technology to determine the sea area where the oil spill occurs in the shortest time, and take corresponding emergency treatment measures.
We propose strengthening the technical capacity of the emergency response team, including regular training and drills for emergency experts and professional emergency response teams, to improve the emergency management and disposal level of personnel; improving the specialization of oil spill removal equipment, such as oil spill recovery ships, oil containment booms, oil collectors and oil spill collection and storage equipment; and minimizing the damage to ecology and the environment as much as possible.

4. Conclusions

Using the computational fluid dynamics (CFD) method and the volume-of-fluid (VOF) technique, the oil spill leakage and diffusion process was simulated. The effects of oil spill velocity, ocean current velocity, crude oil density, and crude oil viscosity were analyzed, and the rising height and lateral migration distance were obtained. The continuous oil flow is formed after the crude oil overflows from the wellhead. Due to the small amount of oil spilled per unit of time, after a while the continuous oil flow is interrupted by the ocean current and the seawater turbulence. Therefore, the spilled oil is soon distributed in the water as an oil mass. The current velocity is the main factor affecting the oil spill diffusion. With the increase of the oil spill height, the viscous shear force gradually weakens the oil spill’s inertia force, and the current shear effect begins to increase. The greater the current velocity, the more shear stress and kinetic energy it exerts on the oil spill, so the oil spill’s vertical and horizontal diffusion distance slightly increases. The higher the density of crude oil with the same volume, the greater the gravity. The change of oil spill viscosity will change the diffusion law of oil spill underwater. The greater the oil spill viscosity, the horizontal and vertical migration distance of crude oil will be slightly reduced, and the leakage and diffusion range of oil spill will be slightly reduced. The results of this study can provide a scientific basis for formulating an emergency treatment plan for offshore oil spill accidents and minimizing the harm to marine ecology and the environment. Later, we will discuss different ocean current densities and crude oil mixed with natural gas.

Author Contributions

Conceptualization, R.L.; Investigation, G.J.; Methodology, S.D.; Writing—original draft, S.D.; Writing—review and editing, R.L. and G.J. All authors have read and agreed to the published version of the manuscript.

Funding

This work was supported by the National Natural Science Foundation Project of China (Basic Research Program on Deep Petroleum Resource Accumulation and Key Engineering Technologies, Grant No. U19B6003).

Conflicts of Interest

The authors declare no conflict of interest.

References

  1. Zhang, W.; Xie, P.; Li, Y.; Teng, L.; Zhu, J. Hydrodynamic characteristics and mass transfer performance of rotating packed bed for CO2 removal by chemical absorption: A review. J. Nat. Gas Sci. Eng. 2020, 79, 103373. [Google Scholar] [CrossRef]
  2. Zidane, A.; Firoozabadi, A. Fracture-cross-flow equilibrium in compositional two-phase reservoir simulation. SPE J. 2017, 22, 950–970. [Google Scholar] [CrossRef]
  3. Moreira, G.; Magalhães, H.L.F.; de Almeida Tavares, D.P.S.; de Brito Correia, B.R.; Leite, B.E.; da Costa Pereira, A.B.; de Farias Neto, S.R.; de Lima, A.G.B. Fluid Leakage in Submerged Offshore Pipeline: An Analysis of Oil Dispersion in Seawater. Open J. Fluid Dyn. 2020, 10, 95–121. [Google Scholar] [CrossRef]
  4. Yang, Z.; Yu, J.; Li, Z.; Chen, H.; Jiang, M.; Chen, X. Application of computational fluid dynamics simulation for submarine oil spill. Acta Oceanol. Sin. 2018, 37, 104–115. [Google Scholar] [CrossRef]
  5. Beyer, J.; Trannum, H.C.; Bakke, T.; Hodson, P.V.; Collier, T.K. Environmental effects of the Deepwater Horizon oil spill: A review. Mar. Pollut. Bull. 2016, 110, 28–51. [Google Scholar] [CrossRef] [Green Version]
  6. Wei, L.; Hu, Z.; Dong, L.; Zhao, W. A damage assessment model of oil spill accident combining historical data and satellite remote sensing information: A case study in Penglai 19-3 oil spill accident of China. Mar. Pollut. Bull. 2015, 91, 258–271. [Google Scholar] [CrossRef]
  7. Keramea, P.; Spanoudaki, K.; Zodiatis, G.; Gikas, G.; Sylaios, G. Oil spill modeling: A critical review on current trends, perspectives, and challenges. J. Mar. Sci. Eng. 2021, 9, 181. [Google Scholar] [CrossRef]
  8. Omar, M.Y.; Shehada, M.F.; Mehanna, A.K.; Elbatran, A.H.; Elmesiry, M.M. A case study of the Suez Gulf: Modelling of the oil spill behavior in the marine environment. Egypt. J. Aquat. Res. 2021, 47, 345–356. [Google Scholar] [CrossRef]
  9. Guo, W.; Zhang, S.; Wu, G. Quantitative oil spill risk from offshore fields in the Bohai Sea, China. Sci. Total Environ. 2019, 688, 494–504. [Google Scholar] [CrossRef]
  10. Ye, X.; Chen, B.; Lee, K.; Storesund, R.; Li, P.; Kang, Q.; Zhang, B. An emergency response system by dynamic simulation and enhanced particle swarm optimization and application for a marine oil spill accident. J. Clean. Prod. 2021, 297, 126591. [Google Scholar] [CrossRef]
  11. Zhu, H.; You, J.; Zhao, H. Underwater spreading and surface drifting of oil spilled from a submarine pipeline under the combined action of wave and current. Appl. Ocean Res. 2017, 64, 217–235. [Google Scholar] [CrossRef]
  12. Kyaw, W.P.; Sugiyama, M.; Takagi, Y.; Suzuki, H.; Kato, N. Numerical analysis of tsunami-triggered oil spill from industrial parks in Osaka Bay. J. Loss Prev. Process Ind. 2017, 50, 325–336. [Google Scholar] [CrossRef]
  13. Raznahan, M.; An, C.; Li, S.S.; Geng, X.; Boufadel, M. Multiphase CFD simulation of the nearshore spilled oil behaviors. Environ. Pollut. 2021, 288, 117730. [Google Scholar] [CrossRef]
  14. Zhu, H.; Lin, P.; Pan, Q. A CFD (computational fluid dynamic) simulation for oil leakage from damaged submarine pipeline. Energy 2014, 64, 887–899. [Google Scholar] [CrossRef]
  15. Zhu, H.; You, J.; Zhao, H. An experimental investigation of underwater spread of oil spill in a shear flow. Mar. Pollut. Bull. 2017, 116, 156–166. [Google Scholar] [CrossRef] [PubMed]
  16. Sun, Y.; Cao, X.; Liang, F. Investigation on underwater spreading characteristics and migration law of oil leakage from damaged submarine pipelines. Process Saf. Environ. Prot. 2019, 127, 329–347. [Google Scholar] [CrossRef]
  17. Ji, H.; Xu, M.; Huang, W.; Yang, K. The Influence of Oil leaking rate and Ocean Current Velocity on the Migration and Diffusion of Underwater Oil Spill. Sci. Rep. 2020, 10, 9226. [Google Scholar] [CrossRef] [PubMed]
  18. Xu, W.; Wang, S.; Liu, G.; Zhang, Q.; Hassan, M.; Lu, H. Experimental and numerical investigation on heat transfer of Therminol heat transfer fluid in an internally four-head ribbed tube. Int. J. Therm. Sci. 2017, 116, 32–44. [Google Scholar] [CrossRef]
  19. Xiong, J.; Cheng, R.; Lu, C.; Chai, X.; Liu, X.; Cheng, X. CFD simulation of swirling flow induced by twist vanes in a rod bundle. Nucl. Eng. Des. 2018, 338, 52–62. [Google Scholar] [CrossRef]
  20. Yan, T.; Qu, J.; Sun, X.; Chen, Y.; Hu, Q.; Li, W.; Zhang, H. Numerical investigation on horizontal wellbore hole cleaning with a four-lobed drill pipe using CFD-DEM method. Powder Technol. 2020, 375, 249–261. [Google Scholar] [CrossRef]
  21. Han, Y.; Nambi, I.M.; Prabhakar Clement, T. Environmental impacts of the Chennai oil spill accident—A case study. Sci. Total Environ. 2018, 626, 795–806. [Google Scholar] [CrossRef] [PubMed]
Figure 1. Underwater oil spill process.
Processes 10 02338 g001
Figure 2. Computational grid and solution domain.
Processes 10 02338 g002
Figure 3. Validation of CFD model against experimental data [11]. (a) oil spill experiment; (b) CFD results against experimental data.
Processes 10 02338 g003
Figure 4. Analysis of influence of spill velocity on oil spill leakage and diffusion (U0 = 0 m/s).
Processes 10 02338 g004
Figure 5. Effects of different current velocities on oil spill leakage and diffusion (UP = 0.15 m/s).
Processes 10 02338 g005
Figure 6. Influence of ocean current velocity on oil spill leakage and diffusion (UP = 0.15 m/s).
Processes 10 02338 g006
Figure 7. Contour plots of vorticity field influenced by ocean currents. (U0 = 0.15 m/s, UP = 0.15 m/s).
Processes 10 02338 g007
Figure 8. Rising height of spilled oil for three different maximum ocean current velocities. (UP = 0.10 m/s).
Processes 10 02338 g008
Figure 9. Lateral migration distance of spilled oil for three different maximum ocean current velocities. (UP = 0.10 m/s).
Processes 10 02338 g009
Figure 10. Rising height of spilled oil for three different oil densities. (UP = 0.10 m/s).
Processes 10 02338 g010
Figure 11. Lateral migration distance of spilled oil for three different oil densities. (UP = 0.10 m/s).
Processes 10 02338 g011
Figure 12. Rising height of spilled oil for three different oil viscosities.
Processes 10 02338 g012
Figure 13. Lateral migration distance of spilled oil for four different oil viscosities.
Processes 10 02338 g013
Figure 14. A comparison between the numerical results and the model-predicted results using the presented correlations.
Processes 10 02338 g014
Table 1. Sensitivity of grid size to simulation results.
Mesh NumbersRising Height of Spilled Oil (m)Error (%)
54,30217.48/
111,50218.576.24%
188,70218.831.40%
285,90218.910.42%
Publisher’s Note: MDPI stays neutral with regard to jurisdictional claims in published maps and institutional affiliations.

