Article

Quantification of Soil Deep Drainage and Aquifer Recharge Dynamics according to Land Use and Land Cover in the Basement Zone of Burkina Faso in West Africa

1
Laboratoire Eaux HydroSystèmes et Agriculture (LEHSA), Institut International d’Ingénierie de l’Eau et de l’Environnement (2iE), Ouagadougou 01 BP 594, Burkina Faso
2
Institut de Génie de l’Environnement et du Développement Durable (IGEDD), Université Joseph KI-ZERBO, Ouagadougou 03 BP 7021, Burkina Faso
*
Author to whom correspondence should be addressed.
Sustainability 2022, 14(22), 14687; https://doi.org/10.3390/su142214687
Submission received: 23 September 2022 / Revised: 29 October 2022 / Accepted: 4 November 2022 / Published: 8 November 2022
(This article belongs to the Special Issue Groundwater Recharge and Sustainable Use of Groundwater)

Abstract

:
Groundwater is a vital water supply for local populations and ecosystems globally. With the continuous population growth, the anthropic pressure on groundwater is ever increasing, thus reducing the amount of available water resource. Yet, estimating the impact of anthropogenic activities on aquifer recharge is still a significant challenge for research, especially in basement aquifers. This study aims to improve the actual knowledge of deep drainage and deep aquifer recharge pathways and dynamics in the basement as affected by land use/land cover (LULC). The methodology used in this study accounted for hydraulic processes in soil layers within both unsaturated and saturated zones in an integrated approach. An experimental setup consisting of three (3) experimental plots, respectively under natural vegetation (NV), cropped millet (CM) and cropped groundnut (CG) on which deep drainage was monitored during the years 2020 and 2021. The results show significant differences between the LULC types after two years of implementation. Deep drainage is improved under CM and CG plots located in the central valley, as compared to the NV plot located in the ridge zone. Deep drainage is estimated at 8%, 24% and 25% of the annual rainfall, respectively for NV, CM and CG. The ratio between the recharge value obtained by the water table fluctuation (WTF) method and the deep drainage tends to 1 for the CM and CG plots, highlighting a rapid water transfer between unsaturated and saturated zones. The central valley, which seems to be a preferential recharge pathway, provides promising insights under specific conditions for the implementation of artificial recharge infrastructures.

1. Introduction

Groundwater is an essential water supply to meet the domestic, industrial and agricultural needs for many people around the world [1]. It is estimated that about 50% of the world’s agricultural production relies on groundwater [2]. It also meets the domestic water needs for almost half the world’s population [1,2]. In sub-Saharan Africa, about 75% of the population in some countries depend on groundwater for domestic supply [3,4]. The continuous global population growth will heighten people’s dependence on groundwater, more precisely in arid or semi-arid areas where surface water resources are relatively more sensitive to climate change and human activities [1,5,6]. The amount of available groundwater and its distribution worldwide is greatly affected by human activities [7]. Therefore, estimating the impact of such activities on groundwater is of the utmost importance [8,9].
Land use/land cover (LULC) change is already known to be affecting the spatial variability of hydraulic properties of soils, especially in the unsaturated zone [7,10,11]. This, in turn, further impacts recharge pathways and processes [12,13]. A better understanding of the impact of LULC changes on deep drainage and groundwater recharge can help with the development of well-informed policies and decision support strategies to ensure sustainable water supply for populations living in arid and semi-arid areas [14,15,16]. Some evidence of the impact of LULC on surface water resources is already well established [17,18], especially for the case of West African Sahelian hydrosystems [11]; however, the impact of LULC on groundwater recharge is still poorly studied [10,19] and even less so in the Sahelian context.
Previous studies used chemical or isotopic tracers to highlight that the conversion of natural vegetation areas to agricultural land increases groundwater recharge rates [15,19,20,21,22,23]. The analysis of soil water profiles has highlighted the impact of cropping practices on deep drainage [15,20,24]. Further, modeling studies helped in assessing the impact of LULC on groundwater recharge, especially through similar land conversion narratives [15,20,24,25,26,27,28,29]. Additionally, the increase in urban built-up areas as opposed to the decreasing forest cover has shown to be causing a decrease in groundwater recharge [30,31,32]. However, the restriction of the assessment of the recharge process to only the unsaturated zone appears as a serious limitation to the majority of these studies, regarding the conceptual hydrogeological model in hard rock aquifers [33,34,35].
The use of LULC change models coupled to hydrological models, in order to assess water balance components such as actual evapotranspiration, surface runoff and infiltration increases the uncertainties not only on deep drainage but also on recharge [11,36]. As an alternative, monitoring specific key components of the water balance and further using these values as inputs to an integrated hydrogeological conceptual model (integrating both the unsaturated and saturated zones) sounds a promising alternative. This study aims at contributing to improve the understanding of deep drainage and recharge pathways and dynamics in the basement zone as affected by LULC, through an integrated approach considering various hydraulic processes at play in the soil layer and in both unsaturated and saturated zones. This approach is implemented in the experimental site of Sanon (14 km2) located in the Central region of Burkina Faso (in West Africa). The area belongs to the granitic and granite–gneissic zone, which is typically representative of the basement hard rocks in West Africa. Moreover, long-term monitoring data (since 1989) is available, while its location in the Sahelian zone is hardly affected by climate change and variability, making the Sanon experimental watershed an interesting case in the framework of this study.

2. Materials and Methods
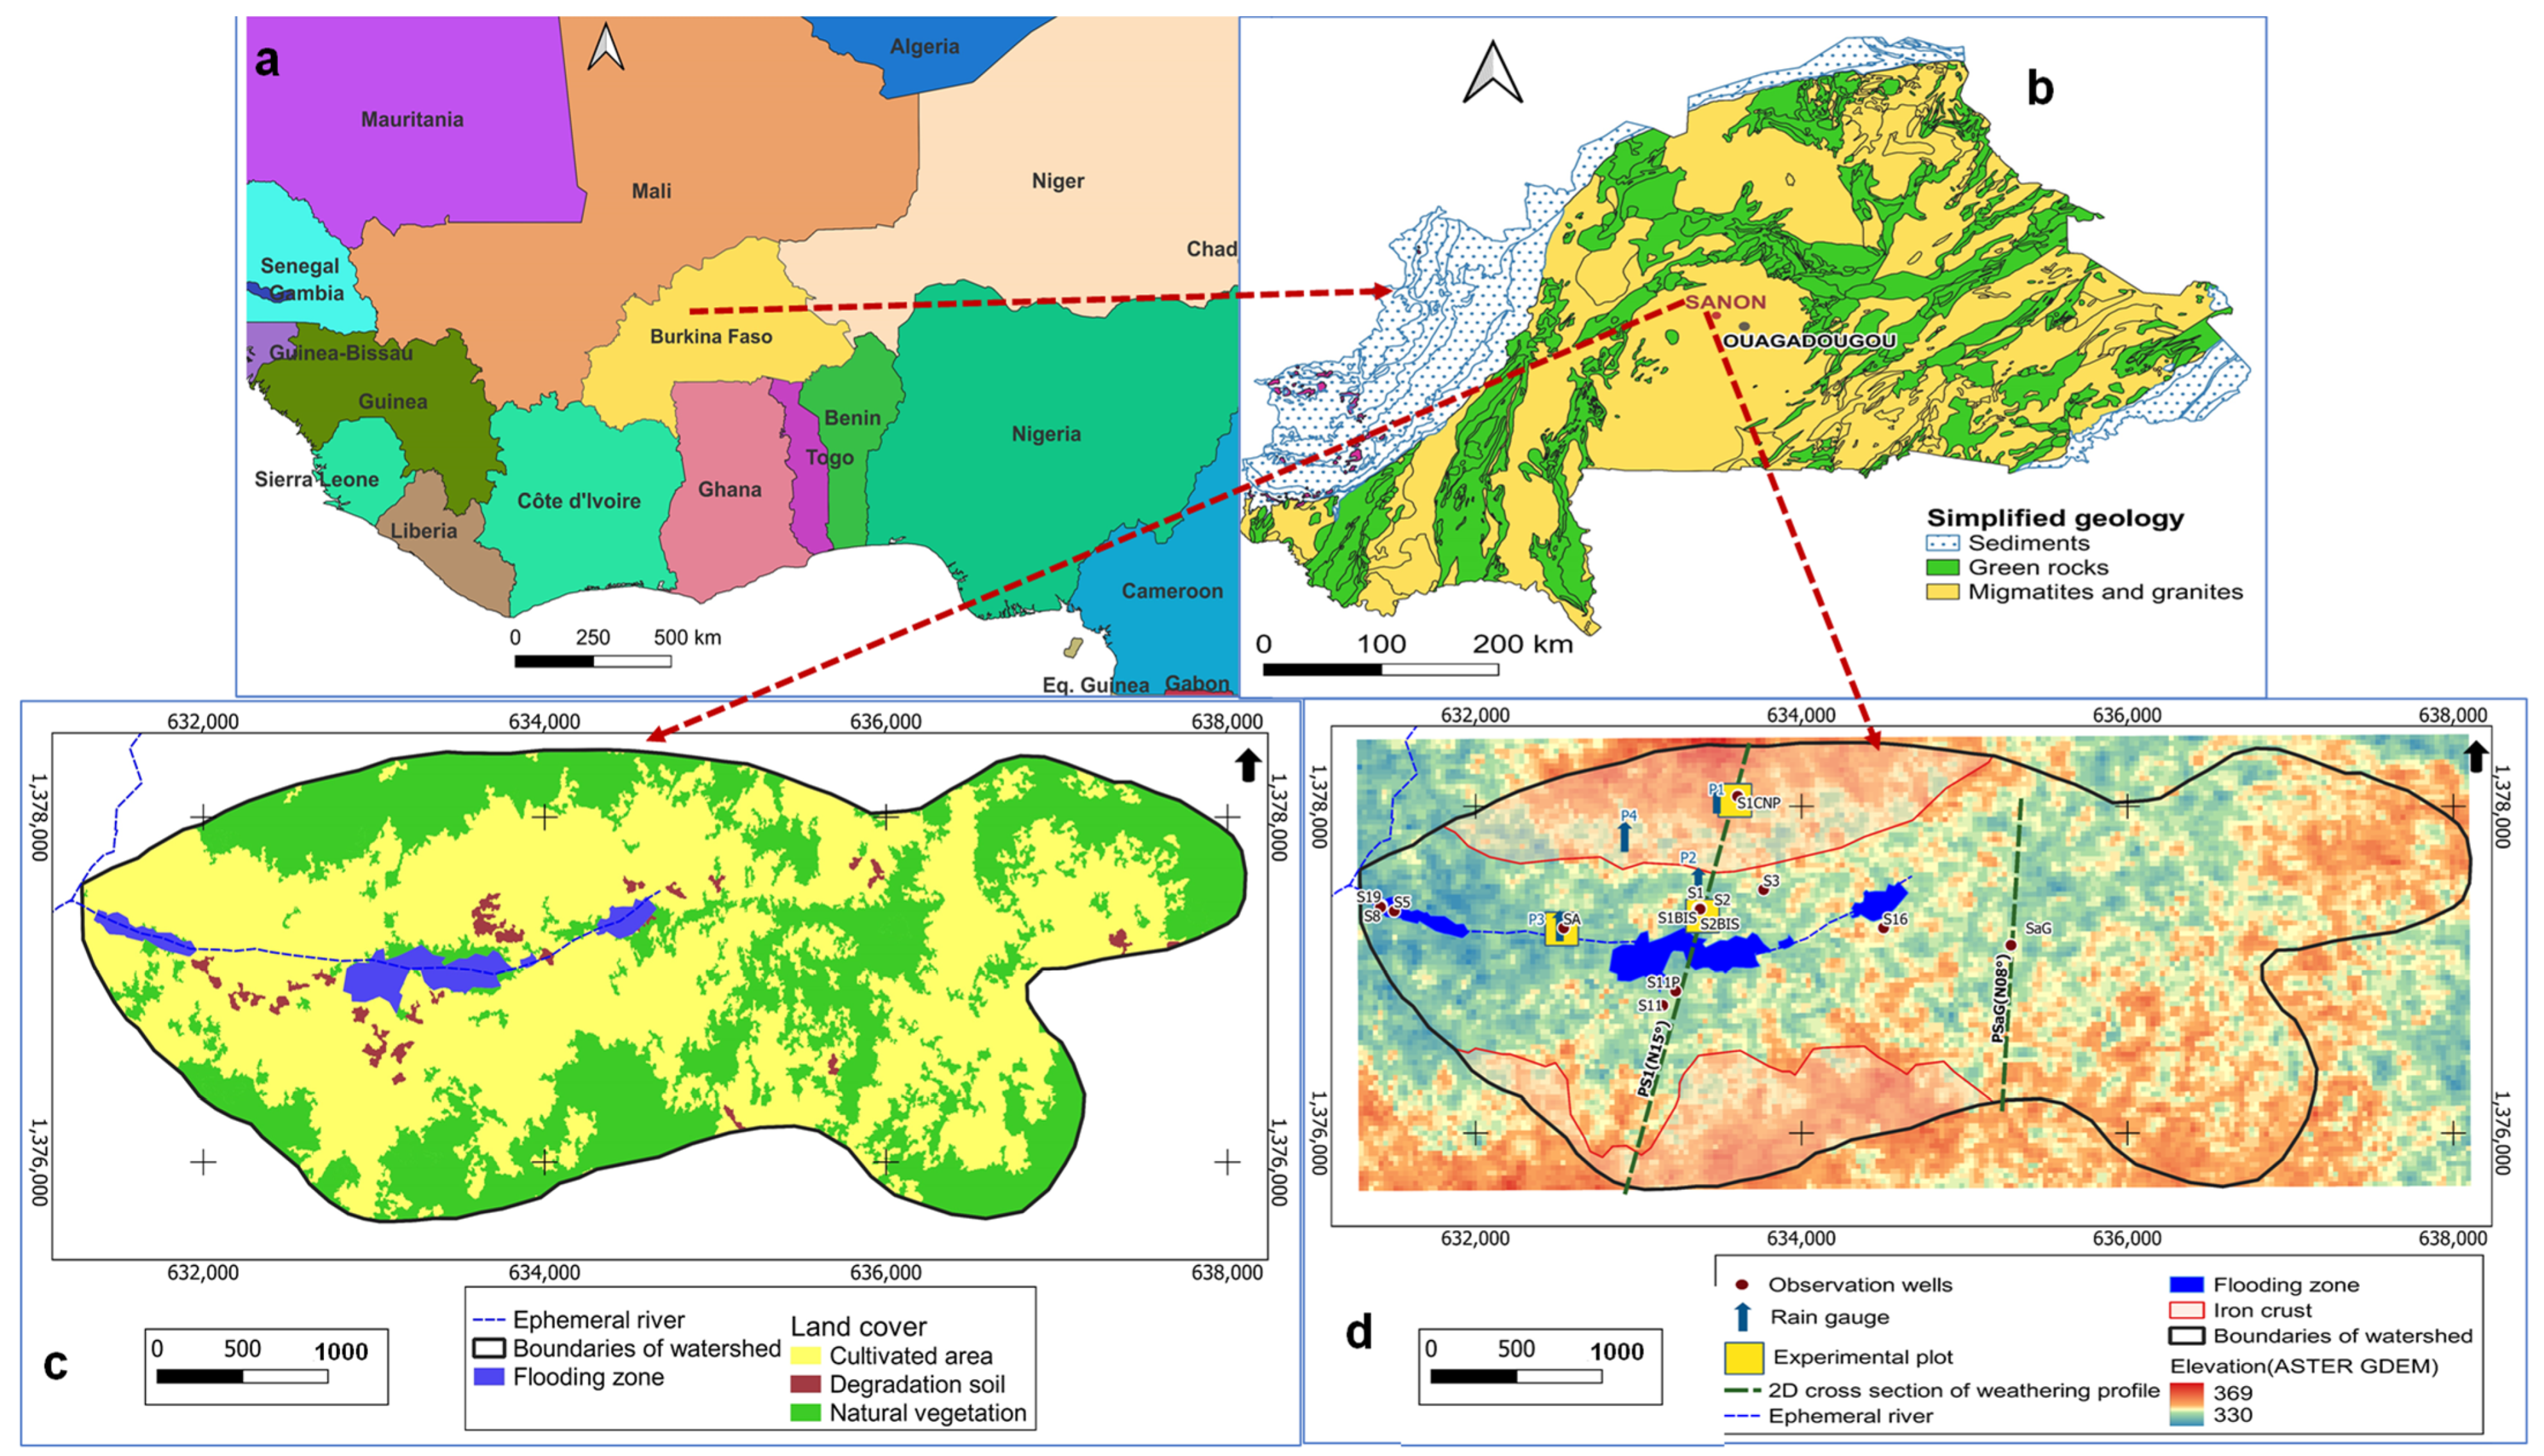
2.1. Study Area

2.1.1. Location and Physical Setting

The experimental site of Sanon is located in the Central region in Burkina Faso, an inland country within West Africa. The watershed lies at about 40 km northwest of Ouagadougou, the capital city (Figure 1b). It lies between 12°26′10″ and 12°28′11″ North in latitude and 1°48′35″ and 1°43′72″ West in longitude. The Sanon watershed covers an area of 14 km2 and belongs to the hydrological unit of the Red Volta (Nazinon). The relief of Sanon is relatively flat, with lateritic crust outcrops in the ridge area (350–370 masl), a flat central valley (average altitude of 340 masl) and a westward slope (Figure 1d). The hydrographic network in the central valley is poorly developed, consisting of anephemeral streams. The soils are deep, indurated, tropical ferruginous leached, with a predominantly clay–loam surface texture [37]. The catchment features three major LULC categories: agricultural areas, natural vegetation, and flooding zones (Figure 1c). The agricultural areas consist of rainfed and dry season vegetable crops. The flooding zone at the outlet of the lowland is used for rice cultivation [38,39].

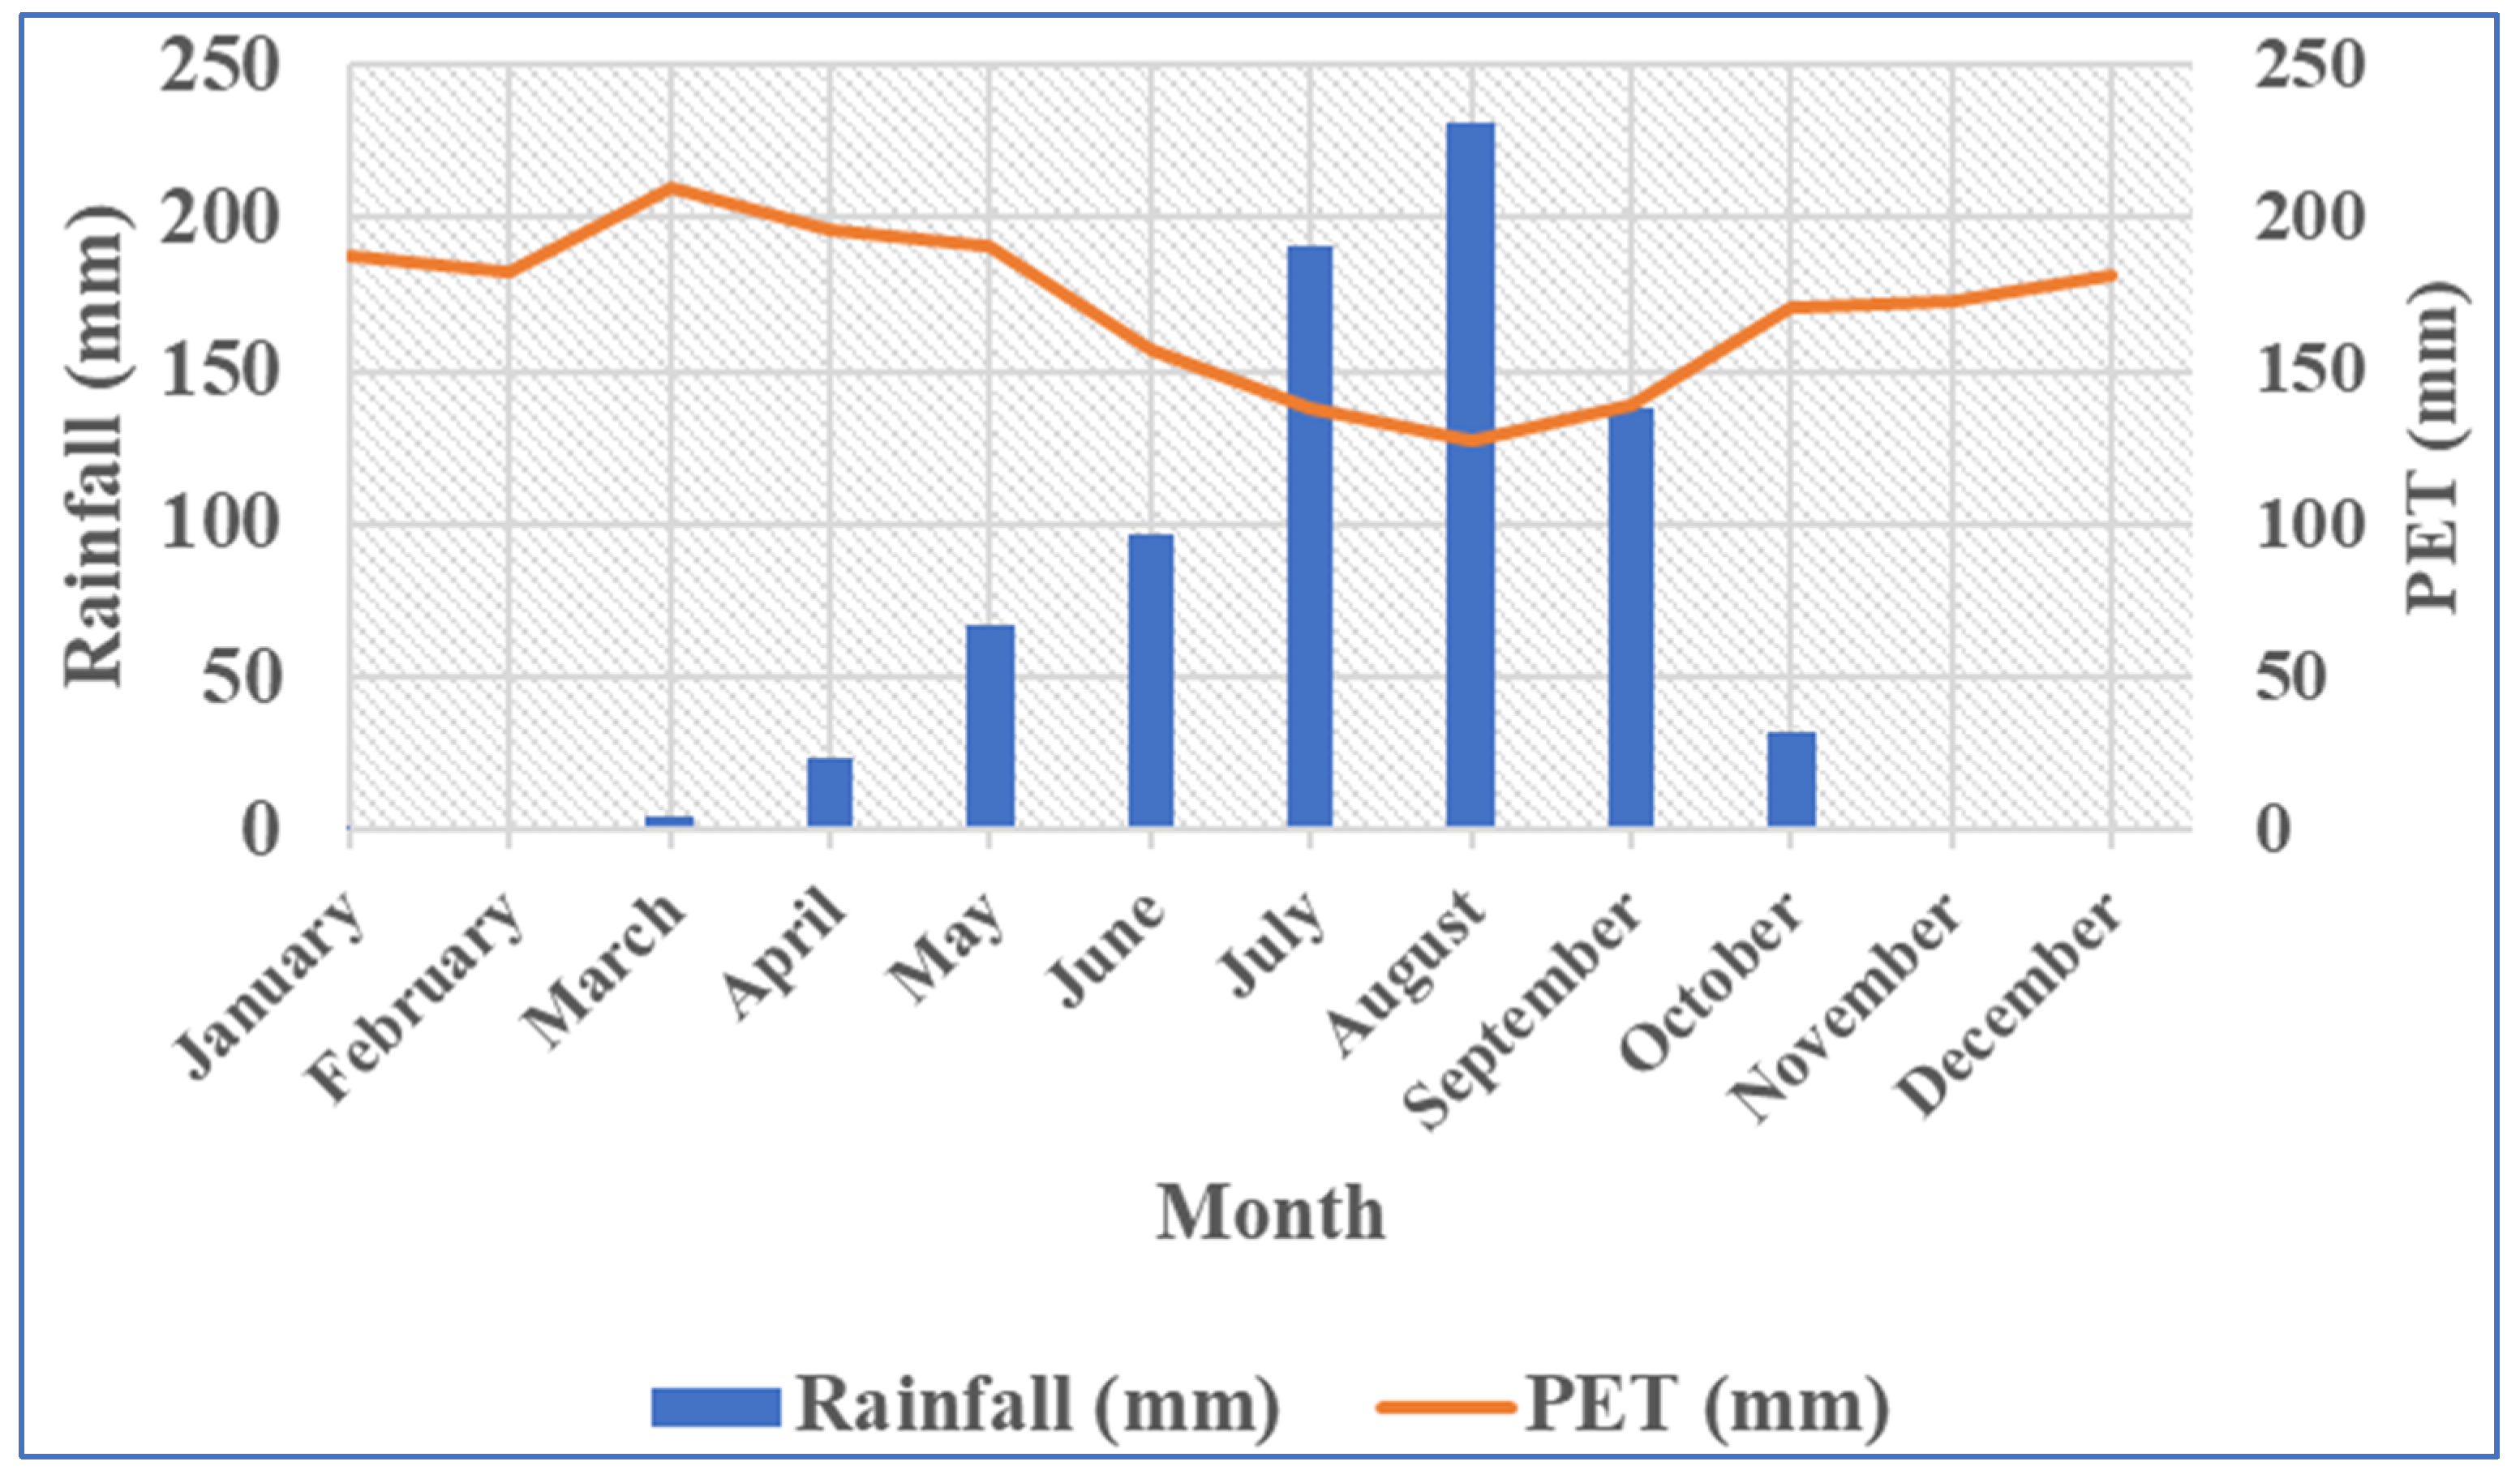
2.1.2. Rainfall Regime and Climate Evolution

The Sanon experimental watershed is under a semi-arid climate, with an average aridity index (ratio of annual rainfall over potential evaporation) of 0.38 over the 1961–2021 period [41]. The rainfall regime in Sanon watershed is unimodal, with a short rainy season extending from June to October and a dry season from November to May, presented in Figure 2. For all the months (except July and August) a water deficit (rainfall below potential evapotranspiration) is clearly visible, hence highlighting the aridity of the context (Figure 2).
The annual rainfall ranges from 571 mm to 1183 mm, with an average of 786 mm, while daily average temperature varies between 25 °C in January and 33 °C in March.

2.1.3. Geological Setting

The geology of Burkina Faso is part of the West African craton, which is composed of the Reguibat Ridge and the Leo Ridge, separated in Burkina Faso by sedimentary rocks which constitutes the Taoudéni basin. The Leo Ridge can be subdivided into two domains, according to the formation era: (i) the Archean domain or Kénéma-Man domain, which includes two orogenic cycles: the Leonian (from 3500 to 2900 million years (Myr)) and the Liberian (from 3000 to 2600 Myr); (ii) the Proterozoic domain or Baoulé-Mossi domain, which consists of geological formations dating from the Paleoproterozoic age of 2250 to 2000 Myr [43]. These formations, also called birimian formations, were affected by the Eburnian orogeny, which designates the set of tectonic, metamorphic, and plutonic events that affected the birimian terrains [44].
At the local scale, the geology of the Sanon site is made up of antebirrimian rocks, predominantly granitic–gneissic or even migmatic, with green rocks (amphibolites) intercalated within them [45,46]. It is representative of the hard rocks of West Africa that were set up during the Eburnian orogeny [46]. In Burkina Faso, basement rocks (Figure 1b) occupy 80% of the country’s area [47]. Geophysical characterization studies were undertaken by Soro et al. [39] on two cross-sections (PSAG and PS1) of the weathering profile (Figure 1d). The 2D geological model consisting of an alterite reservoir and an underlying fractured/cracked reservoir (Figure 3) has been adopted. These two reservoirs overlie the unweathered rock. The thicknesses of the alterites are relatively significantly thicker in the central valley (30 to 50 m) and progressively decrease towards the catchment ridges [45].
The fractured/fissured aquifers have an average thickness of about ten meters located between the fresh rock and the saprolite. The Sanon experimental site is equipped with 16 functional observation wells (Figure 1d), 7 of which (S1CNP, S2, S2BIS, S3, SA, S18, S19) capture only the saprolite (shallow reservoirs), 5 (S1CN, S1, S5, S11, S11P) capture only the fractured layers (deep reservoirs), and 4 (S1Bis, S8, S16, SaG) both reservoirs. The deepest piezometers are about 70 m deep. The purpose of having observation wells that capture only shallow saprolite aquifers, fractured aquifers, or both is to understand the hydrodynamic and geochemical processes that occur in each type of reservoir and the dynamics of exchange between surface and deep reservoirs.

2.2. Field Investigations and Data Collection

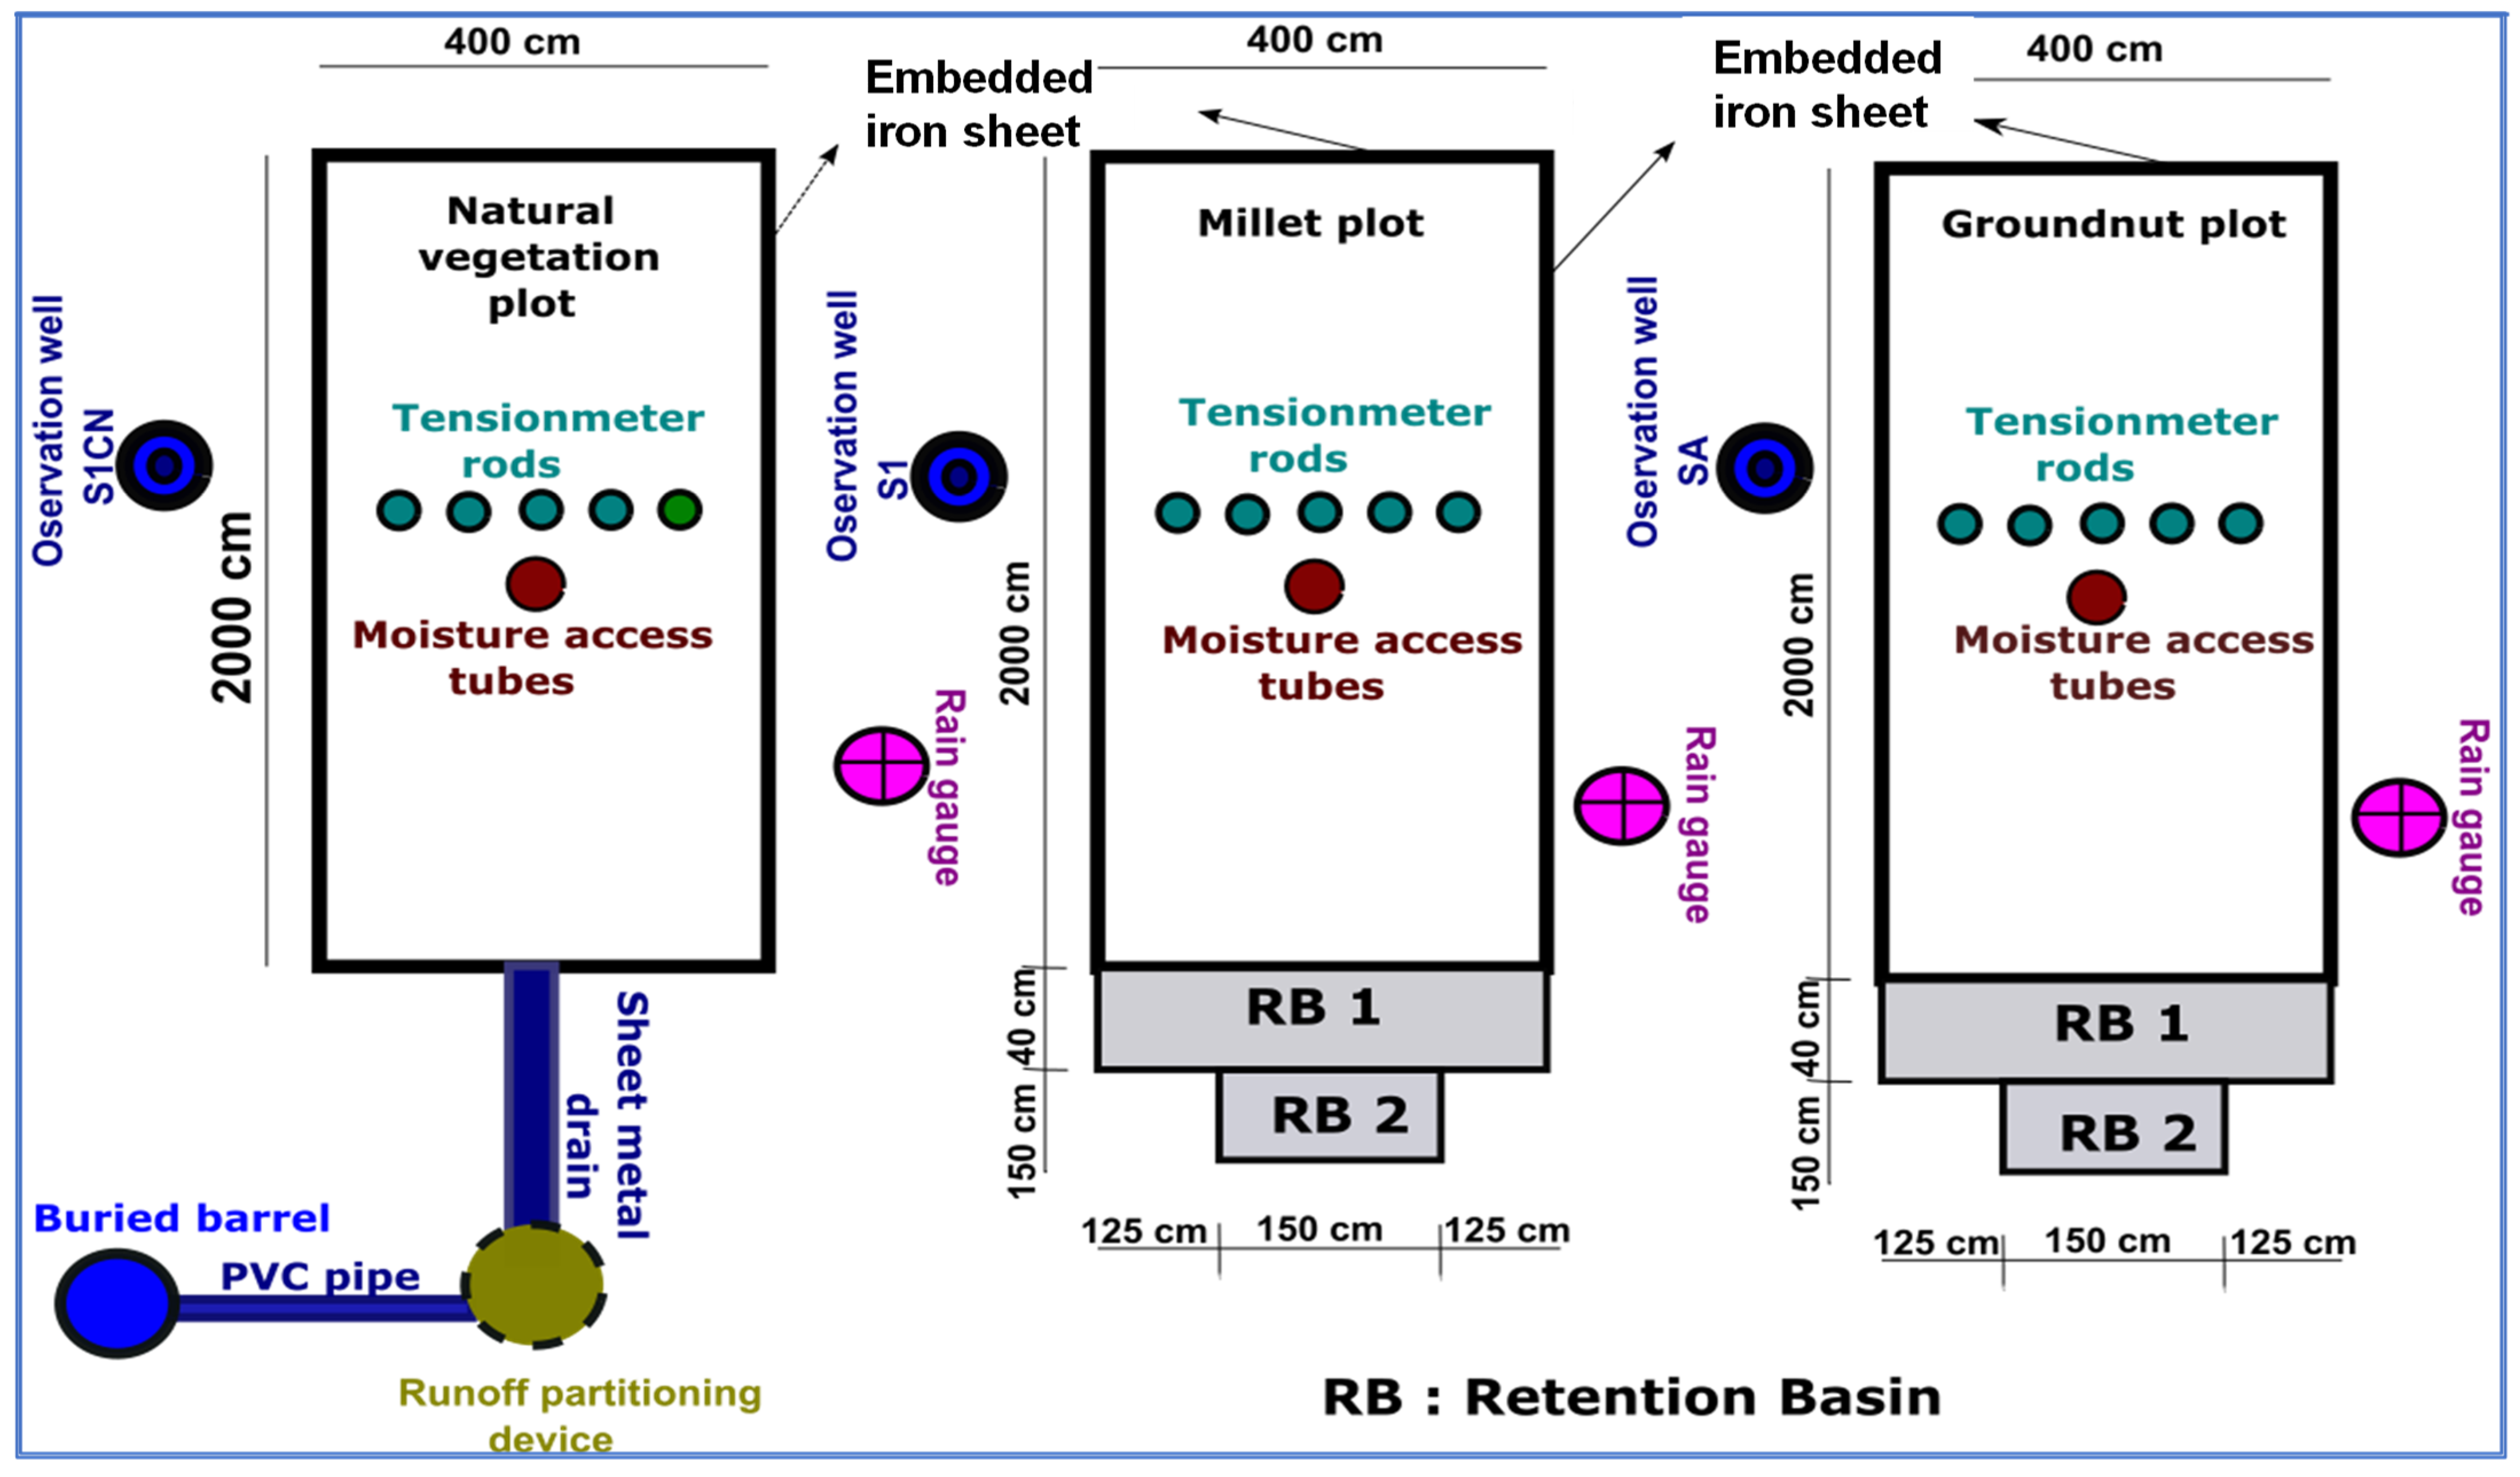
2.2.1. The Experimental Setup

The objective of the experiment was to study the effect of land use on surface water processes, deep drainage and groundwater recharge. The Sanon experimental setup consisted of three plots placed according to the land use/land cover and the drainage network (Figure 4). The first plot (NV) was located in the northern ridge zone, where natural vegetation is found. The second plot (CM) was in the central valley where millet is grown. The third plot (CG) was located midway between the outlet and the central valley, where the dominant crop is groundnut. Over the CM and CG plots, the cultivation practices are flat plowing perpendicular to the slope (to retain surface runoff). Such practice is predominant in the entire watershed [48]. The observed differences could be due to both the effect of land use and location on the hydrographic network. However, under these experimental conditions we assumed that the effect of plot location on the river system may be negligible compared to the effect of land use due to the small size of the plots according to the findings of Mounirou [49] and Mounirou et al. [50,51].
Each single observation plot was insulated with a 60 cm high corrugated iron sheet, the lower part of which was vertically embedded into the ground (at 30 cm depth) with concrete, to fully isolate each plot and prevent any lateral water exchange with the outside). The plots size were 4 m width and 20 m along the surface runoff slope, as shown of Figure 5. The observation well S1CN in the vicinity of the NV plot was 55 m deep and captured the fissured/fractured layer. The observation well S1 in the vicinity of the CM plot was 76.5 m deep and captured both the saprolite and fractured/fractured aquifer. The observation well SA located near the CG plot had a depth of 37 m and captured only the saprolite.

2.2.2. Monitoring and Data Collection

The surface runoff water was collected and measured on a rainfall event basis for the years 2020 and 2021. A direct-reading rain gauge was placed near each plot at the height of 1.5 m above the ground level for the continuous monitoring of rainfall. The outlet of the natural vegetation (NV) plot was equipped with a 100 cm diameter and 30 cm high metal pan serving as a surface runoff partitioning device (Figure 6a). The pan had 40 holes (30 mm diameter each) regularly spread around its circumference at its base. A single of these holes was connected to a calibrated barrel (of 250 L) buried into the ground from which the runoff volume was measured (Sheet S1 in the Supplementary Materials). The total water runoff volume considered for each event was calculated as the sum of the volume left in the tank and amount collected in the buried barrel times the number of orifices in the partitioning device. At the outlet of the millet (CM) and groundnut (CG) plots, two watertight retention basins were arranged in series (Figure 6b). The first retention basin was 150 cm deep and 40 cm wide, extending across the total width of the plot (Figure 6b) and communicated (through an orifice) with a second basin of dimensions 150 cm width by 150 cm large. This second retention basin was intended to collect the runoff excess water from the retention basin upstream. Each basin was equipped with a staff gauge for water volume monitoring.
At the center of each experimental plot, 5 tensiometer rods were installed at depths of 20, 40, 60, 80, and 120 cm to monitor the amount of drained below the root zone, similarly to Zouré et al. (2019) [24]. The pressure load was measured using an electronic tensiometer (SMS 2500S, SDEC France). Near the tensiometer rods, a 120 cm deep moisture access tube allowed the monitoring of the soil moisture every 10 cm depth using a TDR moisture sensor (TRIME-PICO T3/IPH44, SDEC France, Reignac-sur-Indre, France). In addition, each plot was equipped with a piezometer buried more than 30 m deep to monitor the variation of water levels in the aquifer. Piezometric, potentiometric, and soil moisture measurements were read from the piezometer daily at 6 am in the morning.
It should be acknowledged that the experimental setup does not claim to be representative of the entire watershed, as monitoring was local. However, through the estimation of water balance components, this study seeks to understand the relationship between surface water and fluctuations of piezometric levels at each piezometer according to various LULC and soil surface condition types.

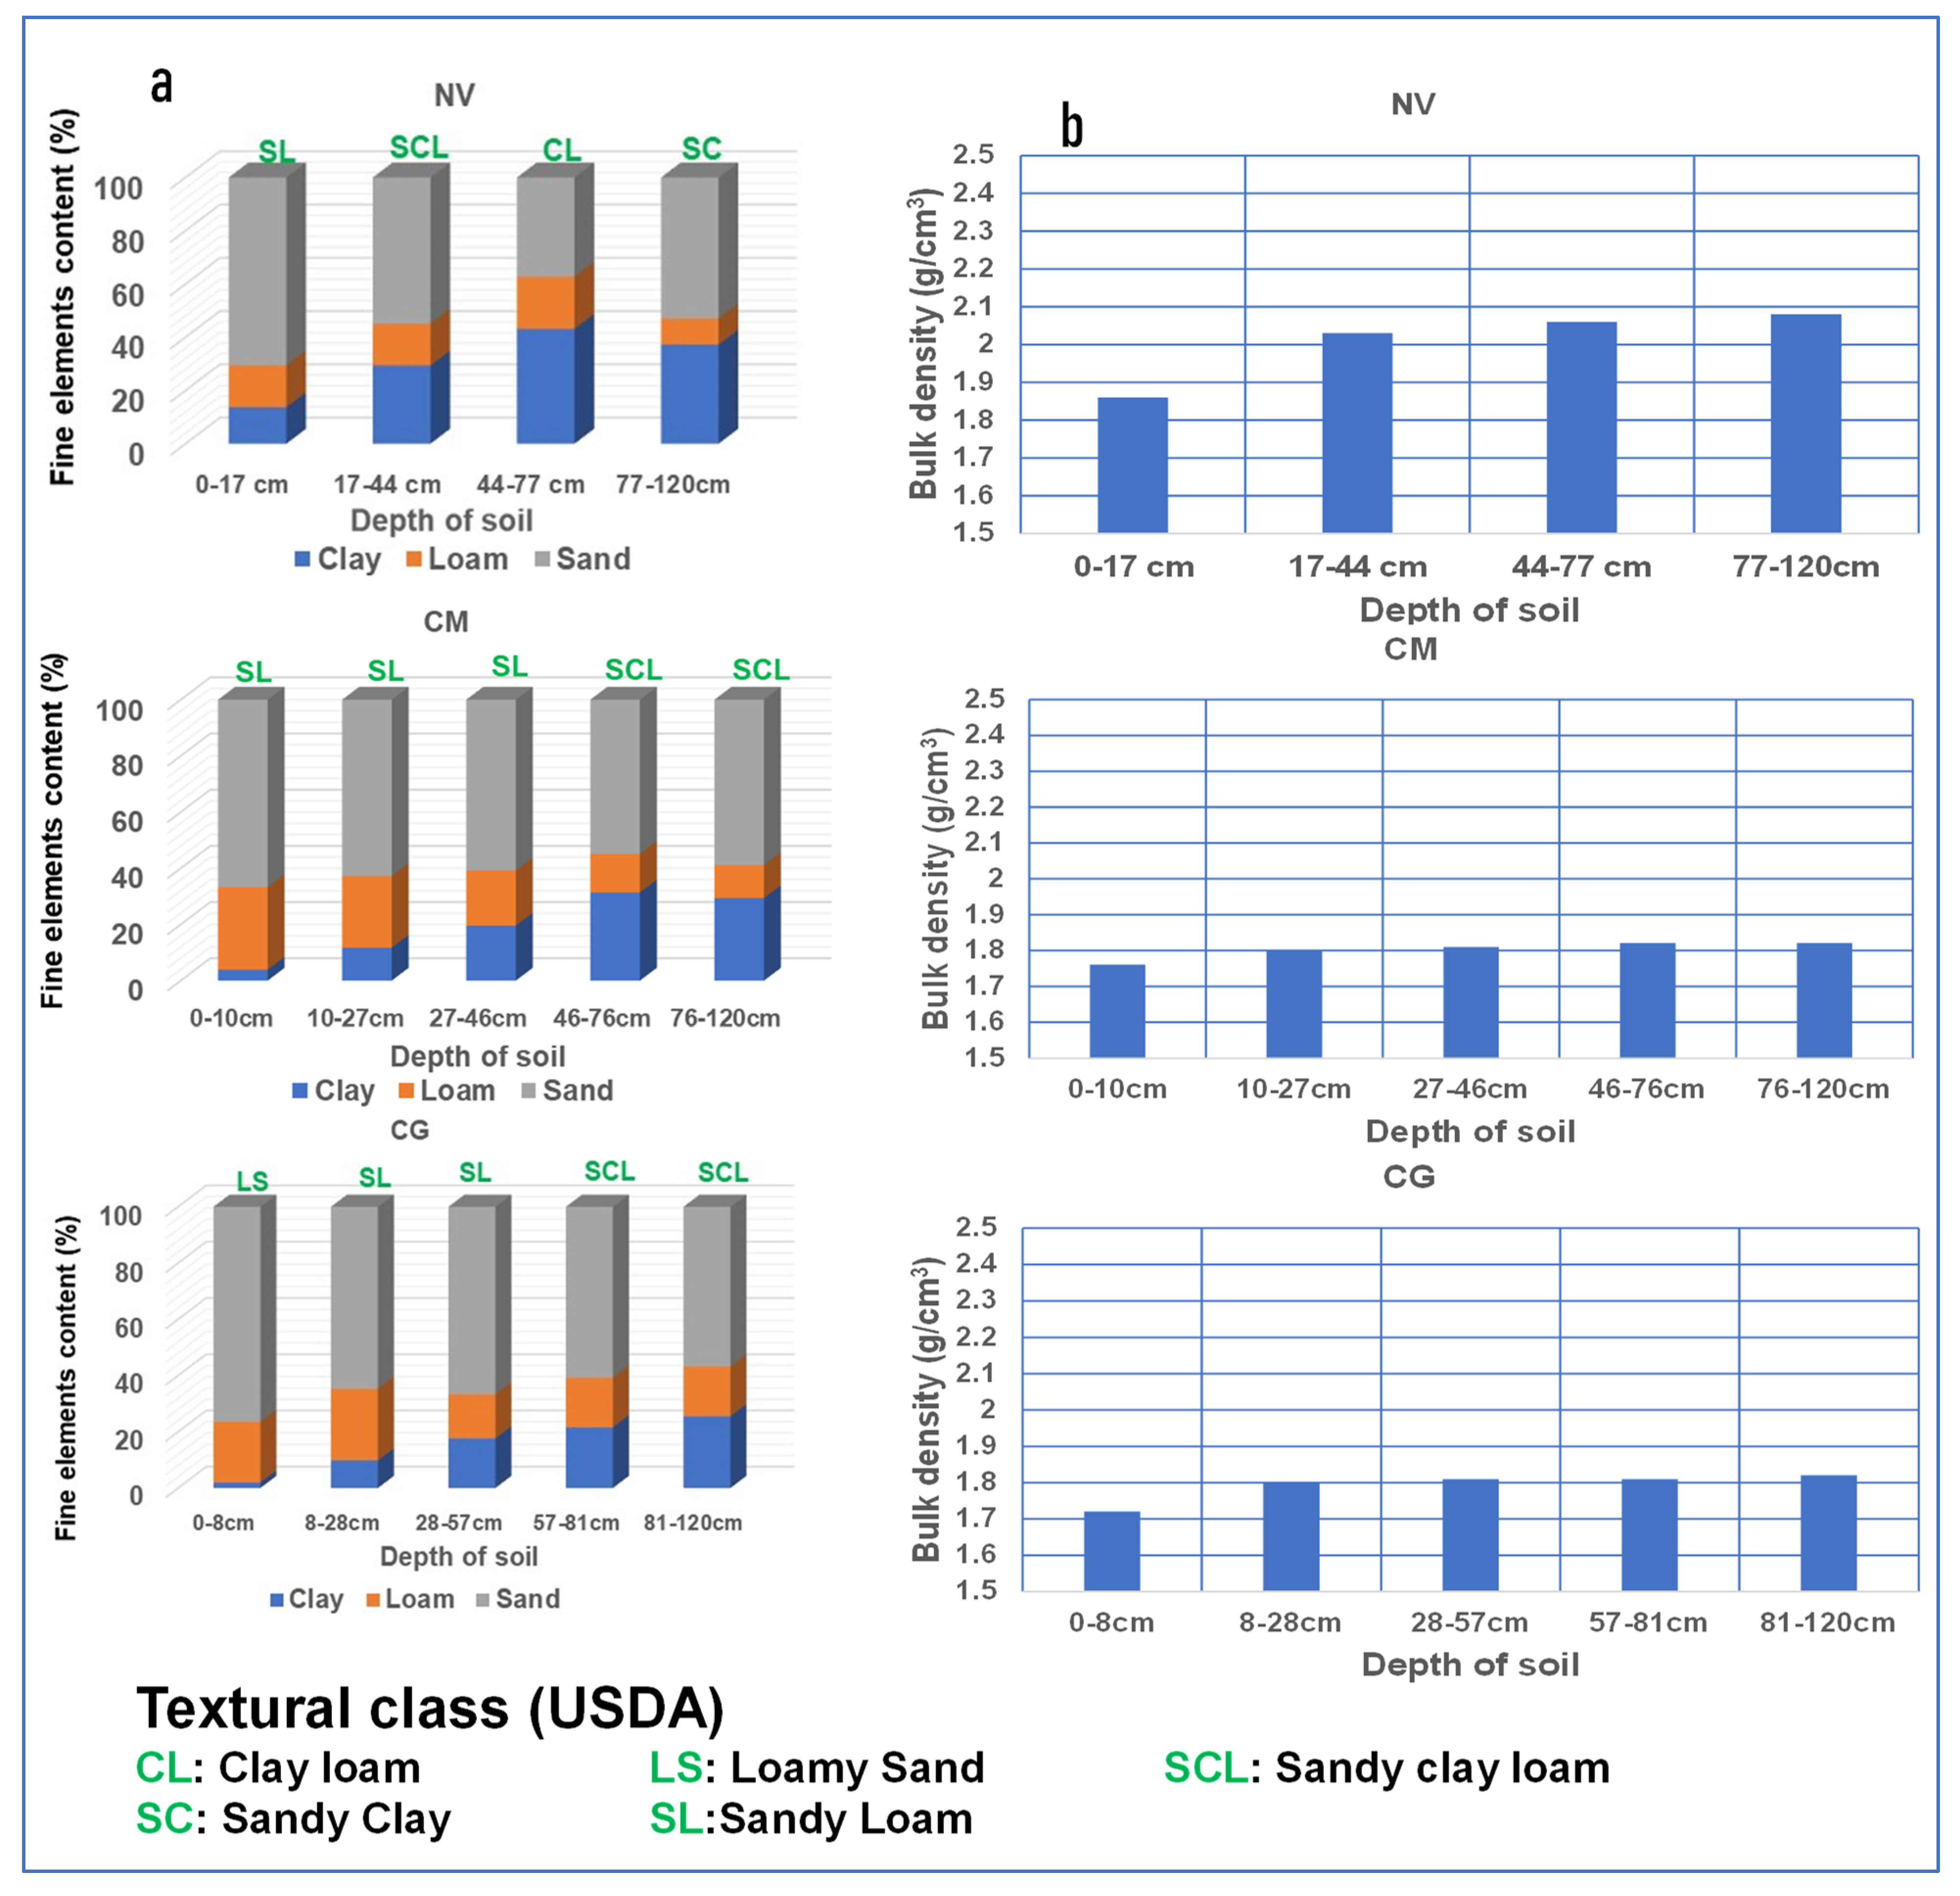
2.2.3. Determination of the Physical and Hydraulic Parameters of Soils

A north-west transect was investigated to analyze the toposequence and characterize the succession of the different soil surface and LULC conditions and define the soil pit locations (Figure 5). Five deep pits (1.20 m depth) along this transect were excavated and soil profile readings were carried out in the pits. Three pits (SD1, SM3, SA5), located in Figure 4, were sampled at each soil horizon level to determine grain size distribution and soil dry bulk density near the experimental plots. Apparent densities were further evaluated using soil samples collected using cylinders (5cm × 5cm) dried into an oven at 105 °C during 24 h. These analyses helped in determining the physical parameters to assess the subsurface infiltration process and determine the hydraulic parameters through pedotransfer functions [52].
Saturated hydraulic conductivities (Ksat) were evaluated using a double-ring infiltrometer [24,53] through 12 measurements at each plot (36 measurements in total).

2.3. Calculation of Water Balance Components

The water balance equation is given as in Equation (1):
P − (R + D + ETa) = ∆S
where P is the rainfall volume (mm), R is the surface runoff volume (mm), D is the drainage amount (mm), Eta is the actual evapotranspiration (mm) and ΔS is the soil water storage variation (mm).

2.3.1. Rainfall (P) and Runoff (R) Analysis

Rainfall and surface runoff data collected on daily event basis during the years 2020 and 2021 were analyzed using descriptive statistics to determine the number of rainfall events, annual cumulative rainfall, dry spells, annual runoff volume and runoff coefficients. A dry spell is defined as the number of consecutive days without significant rainfall event (p < 2 mm). A graphical method opposing rainfall to surface runoff in a scatterplot was used to estimate the minimum rainfall amount triggering surface runoff according to the LULC and soil surface conditions.

2.3.2. Deep Drainage

Deep drainage was calculated using Darcy’s law which relates the hydrodynamic characteristics of the soil medium to the flow through it [54], as shown in the Equation (2):
q = k h dH dZ
where q is the water flux (m/day), dH/dZ is the hydraulic gradient (m/m), with H = h − Z defined as the hydraulic head (m). The depth axis was positively oriented downwards, considering the surface as the reference. The k(h) function was determined using pedotransfer functions (PTF) implemented in the Hydrus 1D software [52]. These PTF were used to obtain Ksat values, along with the Van Genuchten parameters α, n, and m [55] using the grain size class and bulk densities of the soil samples collected from the soil pits. Measurements from the tensiometers helped in determining the daily pressure head at depths 80 and 120 cm. The reference depth for calculating the drained water level was set at 100 cm, considering the evolution of the crop roots and the maximum rooting depth of the natural vegetation in the area [37].
Furthermore, deep drainage values were recorded to compare the drained water levels with the piezometric fluctuations according to each LULC type. Therefore, the daily monitoring of deep drainage in relation to the observed rainfall and the fluctuations of piezometric levels according to the soil depths were used together to assess the recharge process.

2.3.3. Water Storage Variation

The water storage content S (mm) in a soil layer at a given time between two depths, Z1 and Z2, can be calculated using Equation (3) [56,57].
S = Z 1 Z 2 θ z . dz
In our study, the water content was measured every 10 cm to a depth of 120 cm. For a total soil profile depth of 1000 mm, the water storage can be determined through Equation (4).
S = 100 . θ 100 + 100 . θ 200 + 100 . θ 300 + + 100 . θ 1000
where S is the water storage content (mm), and θ(z) is the water content at a given depth z (mm).
Daily moisture measurements of the water content in the soil using the TDR moisture sensor at varying depths were used to estimate the daily water storage.

2.3.4. Water Balance and Aquifer Recharge

Equation (1) was used to calculate actual evapotranspiration (Eta) as a residual term in the water balance. These ETa values determined in our study were compared with potential crop evapotranspiration (ETc = Kc.ETo). The crop coefficients (Kc) were taken from Allen et al. [58] and the daily values of potential evapotranspiration (ETo) from the Ouaga-Aero weather station. ETo is given by the following Equation (5) [58]:
ET 0 = 0.408 R n G + γ 900 T + 273 U 2 e s e a + γ 1 + 0.34 u 2
where ET0: reference evapotranspiration (mm day−1); Rn: net radiation at the crop surface (MJm2day−1); G: soil heat flux density (MJm−2day−1), T: mean daily air temperature at 2 m height (°C); u2: wind speed at 2 m height (m s−1), es: saturation vapor pressure (kPa), ea: actual vapor pressure (kPa), es−ea: saturation vapor pressure deficit (kPa), Δ: slope vapor pressure curve (kPa °C−1), and γ: psychrometric constant (kPa °C−1).
In addition, the calculation of recharge using the piezometric fluctuation method according to Equation (6) [59] allowed us to assess the variability of the recharge process as a function of LULC and therefore, to establish a relationship between recharge and deep drainage values. The value of the ratio between recharge and deep drainage (calculated from two physically based formulas) helped in understanding the dynamics of water transfer between the saturated and unsaturated zones.
R e = S y . Δ h
where Re is the groundwater recharge (m), Sy is the drainage porosity (%), and Δh is the aquifer water level fluctuation (m) over time. Sy values were taken from Compaoré [46], Vouillamoz [60], Soro [48], and Koïta et al. [61].

3. Results

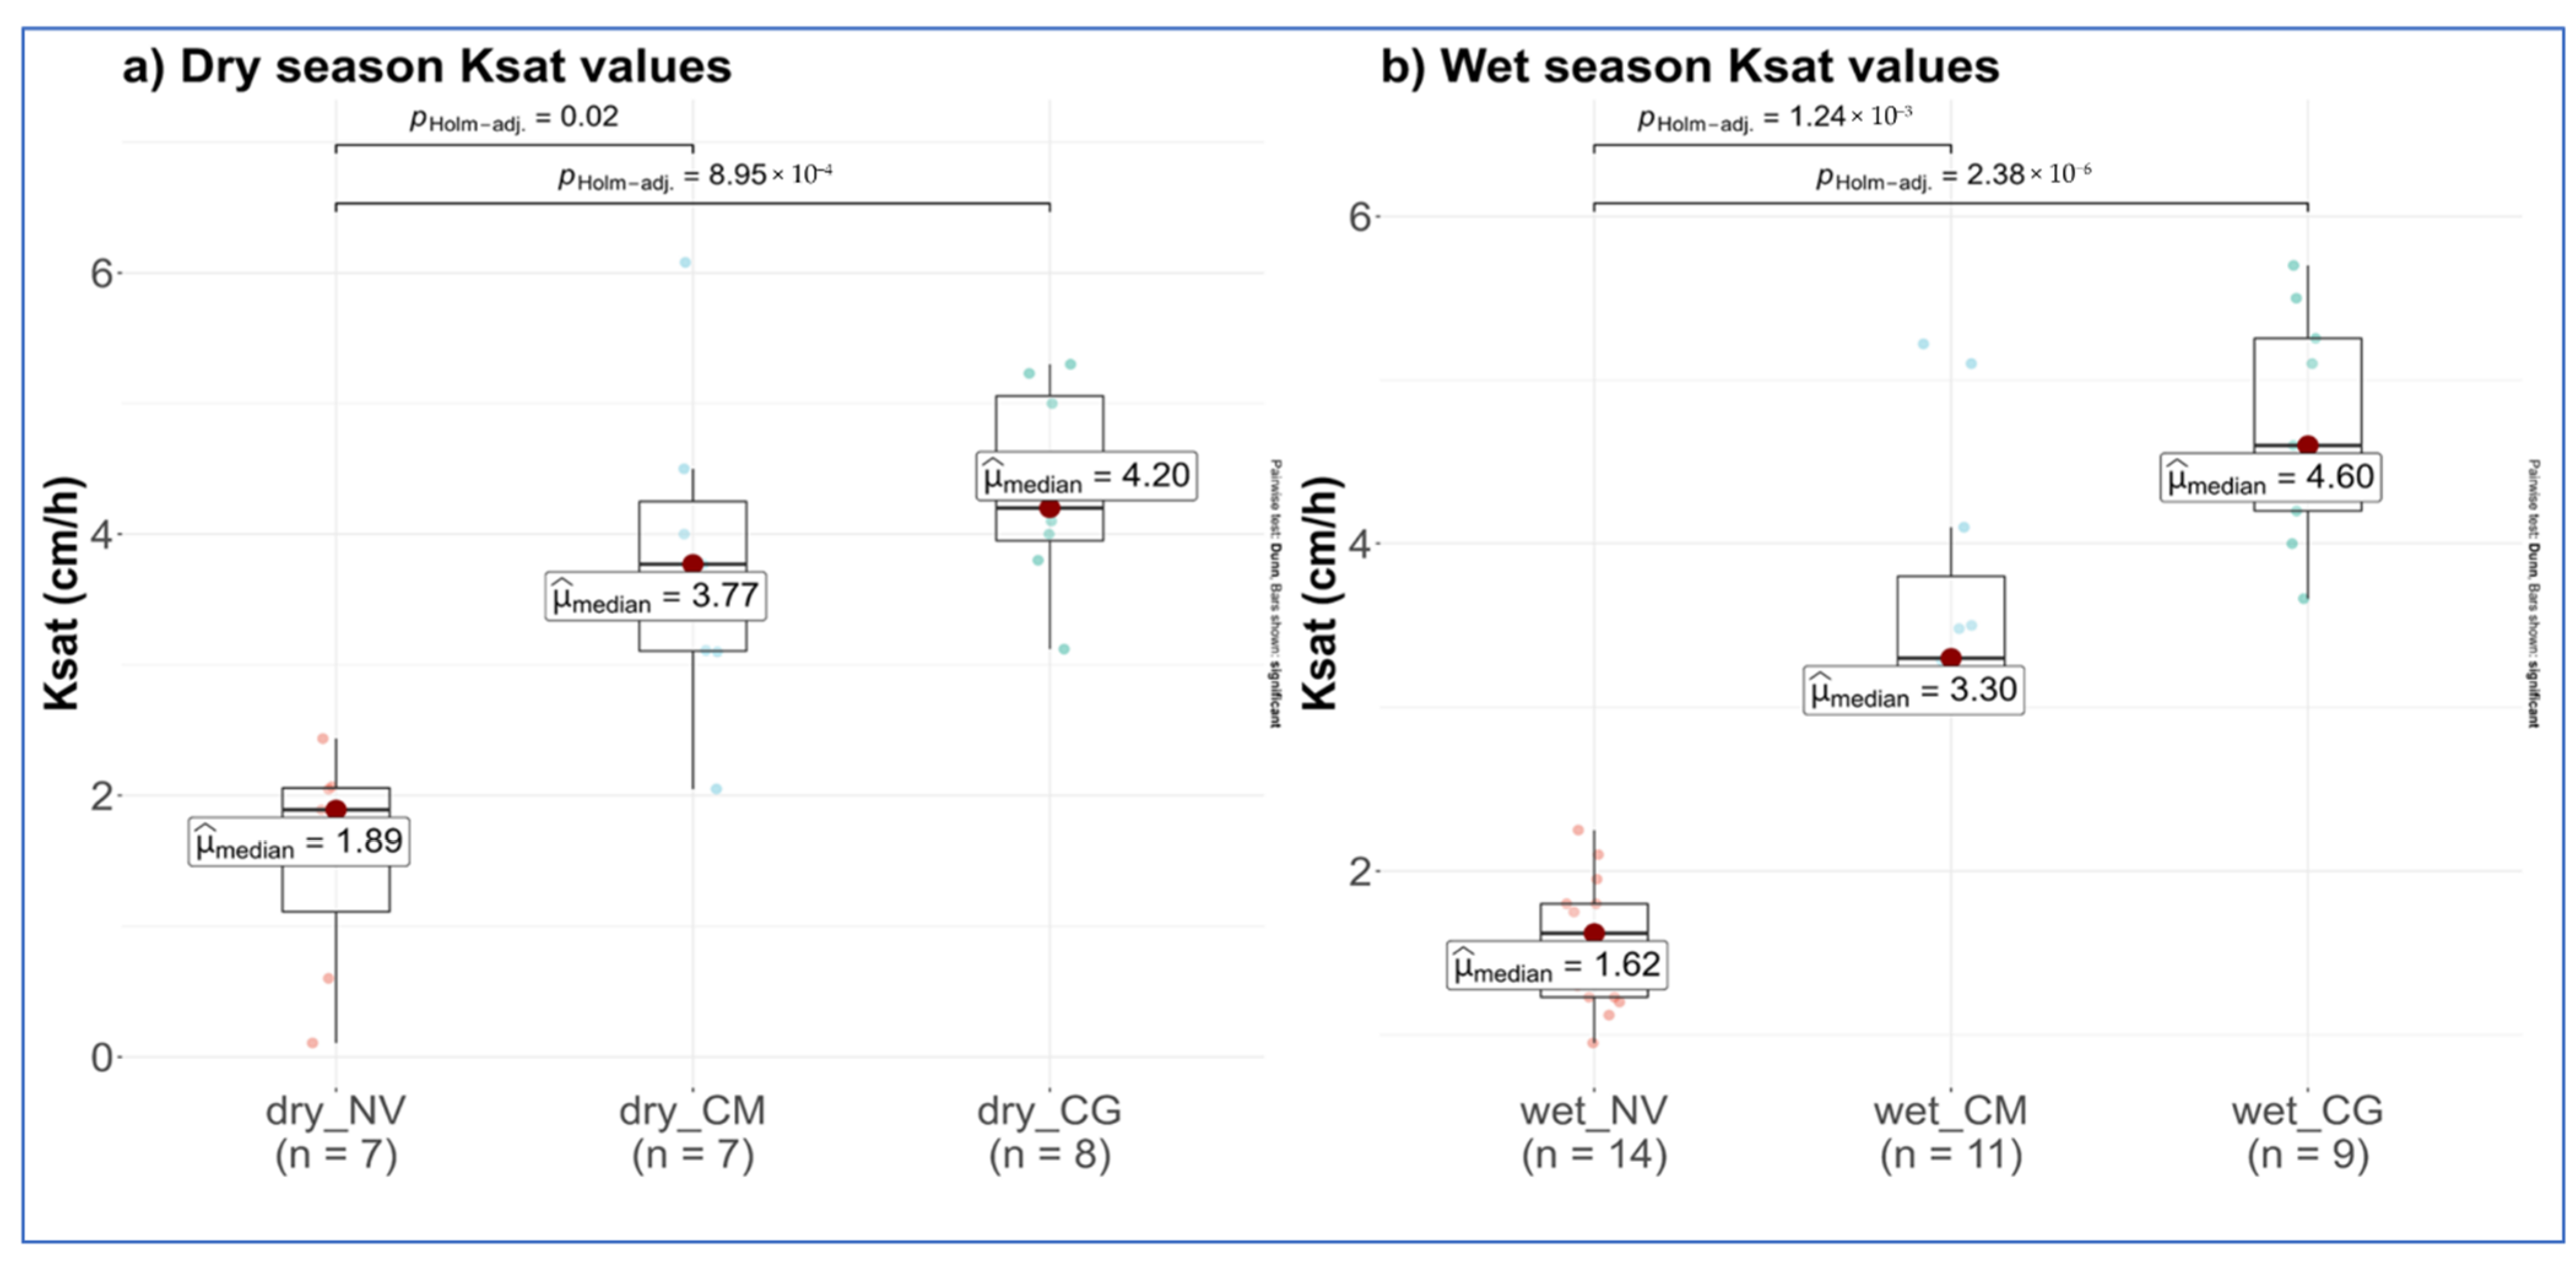
3.1. Physical and Hydraulic Soil Parameters

The analysis of the soil profiles revealed a significant proportion of clay on the experimental plots (Figure 7). The texture of the soil surface was silty–sandy for natural vegetation (NV) and millet (CM) plots and sandy–loamy for the groundnut (CG) plot. At higher depths (about 77 cm), the texture transitioned to sandy–clay for the NV plot and to sandy–loamy–clay for the CM and CG plots. The average bulk density of the soils sample was estimated at 2 g/cm3 for the NV plot, 1.80 g/cm3 for the CM plot and 1.79 g/cm3 for the CG plot. The apparent density values for each LULC condition showed an increasing gradient with the depth and seemed to follow the evolution of clay content (Figure 7). All these soils are classified “heavy soils” according to their average bulk density, which is higher than 1.55 g/cm3 [62]. These values were relatively higher in the degraded zone, reaching 2.08 g/cm3 at 77–120 cm in depth (Figure 8). High bulk density values have been found at other experimental sites in Burkina Faso on leached tropical ferruginous soils similar to the Sanon site: at Saria, in the central-western part of the country, Dembele & Some [63] reported a value of 1.9 g/cm3; at Kamboinsé, in the central part of the country, Nsanzimfura et al. [64] reported a value of 2.26 g/cm3; at Oula, in the northern part of the country, Savadogo et al. [65] reported a value of 1.91 g/cm3 at Tougou, in northern Burkina Faso, Mounirou et al. [61] reported bulk densities of 1.88–1.94 g/cm3. Several authors suggested that bulk density is affected by factors such as sand percentage, organic matter content, and porosity [66,67,68]. This hypothesis does not seem to hold true in the case of the Sanon site, where the values of bulk density according to the soil depth was not proportional to the change in sand content, which decreased with the soil depth. Page-Dumroese et al. [69], Chalhoub et al. [70] and Keller and Håkansson [71] found that the content of coarse elements affects the soil bulk density; therefore, soils with a high percentage of coarse elements would have higher bulk densities. This finding might explain the relationship between soil content in coarse elements and its bulk density in the Sanon watershed. Indeed, coarse element in this study varied from 10% (on groundnut and millet plots) to 60% on the natural vegetation plot, and increased progressively with depth. The high proportion of coarse elements likely explains the higher bulk density values observed in the study area, especially in natural vegetation areas where their content reached 60% of the soil samples.
In addition, the values of apparent densities increasing with the soil depth (at least equal to 1.80 g/cm3) constitutes a limiting factor to the development of vegetation root [72,73]. The examination of the distribution of roots with soil depth in Sanon indicates a limited development of roots between 80–90 cm depth in all soil pits [37].
The hydraulic conductivity values were similar in terms of order of magnitude for the years 2020 and 2021 (Table 1). CG plot was relatively more permeable, followed by the CM plot. The NV plot showed the lowest Ksat value on average. Such distribution of Ksat values might be explained by the corresponding clay content, which was higher in the NV plot, with an average value of 31% compared to 19.2% and 15.2% in CM and CG plots, respectively (Table 1).
Figure 8 compares the boxplot distributions of Ksat values measured on experimental plots during the dry and wet seasons. The analysis revealed that Ksat values on NV were, in general, significantly lower than those in CM and CG plots, independently of the season. Additionally, Ksat values in the CG plot were, in general, slightly higher than those observed in the CM plot, despite not being significantly different. Hydraulic conductivities were higher in the central valley than in the lateritic ridge areas. It was also observed that in both dry and wet seasons the Ksat values in all plots were of the same order of magnitude. The difference was not significant.
The saturated hydraulic conductivities (Ksat) reported in tropical ferruginous soils from other sites in Burkina Faso produced similar values: 2.3–45 mm/h in the Sahelian zone [53], 2–33 mm/h [61,74], and 11–72 mm/h [24] in northern Burkina Faso.

3.2. Water Balance Components

During the monitoring period, the cumulative rainfall in the year 2020 was higher than in the year 2021 (Table 2). The annual rainfall recorded in 2020 and 2021 were 724 mm and 451.6 mm, respectively. In 2020, a total of 38 rainfall events were observed, 10 of which had a rainfall over 30 mm. In 2021, 32 events were recorded, 2 of which showed a rainfall over 30 mm. The longest dry spell reached 7 days in 2020 and 16 days in 2021.
From 2020 to 2021, the surface runoff/rainfall ratio showed a slight decrease in CG (from 25.72% to 23.88%) and CM (from 36.12% to 34.90%) plots. In contrast, a significant drop (from 25.5 to 8 %) in the surface runoff/rainfall ratio was observed in the NV plot. These results do not seem consistent with average measured Ksat values. In fact, considering approximately the same rainfall amount, the highest surface runoff values were likely to be found in the NV plot, where the soils were less permeable (Table 1, and see Sheet S2 in the Supplementary Material).
In this study, the correlation between soil infiltration capacity and plot surface runoff was observed for millet and groundnut plots. The low values of average runoff coefficient obtained in the natural vegetation plot could be explained by the higher vegetation cover (Figure 9), which played a preponderant role in the reduction of infiltration and deep drainage processes and even in the decrease in surface runoff [50,51,63]. The literature has argued that shrub vegetation with high canopy cover decreases runoff [64,65]. Still, at the plot occupied by natural vegetation, the decrease in the average annual runoff coefficient (25.50% to 8.30% of annual rainfall in 2020 and 2021) could be explained by the lower number of significant rainfall events in 2021 (2 and 10 in 2021 and 2020, respectively) and the relatively high value of the minimum rainfall triggering surface runoff (30 mm). This threshold depends on both rainfall characteristics and soil surface conditions (structural, hydric, micro-topographic surface, and soil cover conditions) [50,66,67]. Furthermore, the average surface runoff rates obtained in millet and groundnut plots were approximatively of the same order of magnitude (less than 2% difference). In some previous studies, the reported average runoff rates for groundnut range from 25% to 28% [68,69] and for millet from 10 to 37% in Saria, Burkina Faso [70,71], from 25 to 55%, in Cinzana, Mali [72], from 20 to 45% and even higher for encrusted soils in Shaanxi Province, China [73].
Figure 9 shows the minimum rainfall causing the onset of surface runoff (Rmr) graphically determined for each experimental plot. This threshold was estimated at around 30 mm, 12 mm and 23 mm, respectively in NV, CM and CG plots. The slope of the linear regression lines gives 0.78, 0.54 and 0.68 for NV, CM and CG plots, respectively and the coefficients in the same order are 0.9, 0.81 and 0.74. The runoff threshold values were not the same for the three land use types, thus it is difficult to compare them.
The Rmr value for NV confirms that despite the low average Ksat value in such LULC conditions, the surface runoff production is minor. This finding suggests that in addition to the soil infiltration capacity, other factors are involved in surface runoff production [50,51]. Observations made on vegetation cover development on the three experimental plots revealed a strong growth of the above-ground part of the natural vegetation constituting a higher leaf cover compared to the other experimental plots (Figure 10), hence increasing the initial abstraction amount and delaying the surface runoff onset.
The estimation of the water balance components allowed the assessment of the actual evapotranspiration (ETa) at the experimental plot scale, presented in Table 3. The highest ETa values were found in the NV plot (494 mm in 2020 and 375.55 mm in 2021), followed by the CG plot (422.10 mm in 2020 and 228.5 mm in 2021). The ETa of the CM plot was the lowest (279.6 mm in 2020 and 183.3 mm in 2021).
ETa is the water balance component which values were found to be the highest in all experimental plots (Figure 11). It reached 65.9% and 83.77% of the rainfall in the NV plot in 2020 and 2021, respectively. It was followed by surface runoff, which showed a higher value in the CM plot: 36.10% in 2020 and 34.9% in 2021. in the NV plot, deep drainage amounted to 8.10% and 0.64% of the rainfall in 2020 and 2021 in the, respectively. The deep drainage values reached 21.6% and 21% of rainfall in the CM plot and 24.82% and 23.63% in the CG plot in 2020 and 2021, respectively. CM and CG plots therefore presented similar orders of magnitude in terms of deep drainage, higher in comparison to the NV plot. The variation of water storage in 2020 for the NV, CM and CG plots was 3.6 mm, −5.9 mm and −50.1 mm, respectively. The variation in the water stock followed the variation in the clay content, the retention capacity of clay soils being much higher than that of sandy soils. As the clay content of NV soils was higher, the amount of water retained in these soils was higher than in CM and GC soils. The CG soils were relatively less clayey than the others. However, the higher seasonal variation in 2021 (33.9 mm for NV; 10.3 mm for CM; 13.6 mm for CG) compared to 2020 was due to the fact that the last rainy event in 2021 occurred on 22 October with 21 mm compared to 5 mm of rainfall that occurred on 16 October 2020 (Supplementary Materials Sheet S2). The occurrence of this late rainy event in 2021 contributed to the increase in water stocks at the end of the season, for soils that were mostly dry at the beginning of the season. The lowest term in the water balance was the change in the soil water storage. The value of the water storage change was less in absolute value than 8% of the rainfall for all plots and for the two consecutive years.
Deep drainage values of 22% and 10.21% were reported on millet plots in 1994 and 1995 in Niger by Akponikpe [74]. The difference between these values is related to the high number of rainfall events registered in 1994 (37 events, including 7 rains over 40 mm), which brought the cumulative annual rainfall to 721 mm. In the same study in 1995, the number of rainfall events was estimated at 28, and only 2 important rainfall events were observed, for a cumulative rainfall of 431 mm. The deep drainage rates reported from Niger are similar to those obtained in the millet plot in Sanon. The deep drainage values reported by Klaij & Vachaud [75] using different treatments (with and without organic manure on groundnut plots) were 47.10% and 33.50%, respectively. This result indicates that manure likely increases water withdrawal by the crops, reducing the amount of water drained below the root zone. The similar effect of manure on deep drainage has also been described by Cissé et al. [76], who reported deep drainage values of 37.12% (of rainfall) for groundnut plots with manure treatment. The deep drainage rates found in this study were slightly lower than those of Cissé et al. [76] and Klaij & Vachaud [75]. The difference is likely due to the fact that both organic and mineral fertilization is carried out in the groundnut growing areas in Sanon. The organic and chemical fertilizers improve the development of the vegetative apparatus of the plants, resulting in increased water withdrawal compared to the case without organic or mineral amendments. In addition, the higher deep drainage values found by Klaij & Vachaud [75] might be related to the use of Darcy’s law with the assumption of a permanent flow due to a deep drainage process controlled by the gravity component of the soil water potential during the crop cycle. This assumption leads to an overestimation of deep drainage. However, under natural conditions, the saturation of the soil profile is not permanent but rather mostly follows the patterns of rainfall and potential evapotranspiration parameters. The variability of deep drainage indicates that the process is both affected by climate and pedological characteristics of the study area but also by the crop or vegetation phenological development and cultivation practices.
The daily average values of crop evapotranspiration (ETc) were determined from the potential evapotranspiration estimated by the Pemann–Monteith formula (see Equation (5)) along with Kc crop coefficients [58]. The results, presented in Table 4, show that for the year 2020 a relatively small difference between the daily averages of ETa and ETc were due to the very wet nature of the 2020 wet season. However, the ETa values for all three LULC conditions were well below the ETc in 2021. This difference is due to the water deficit observed in 2021 compared to 2020.

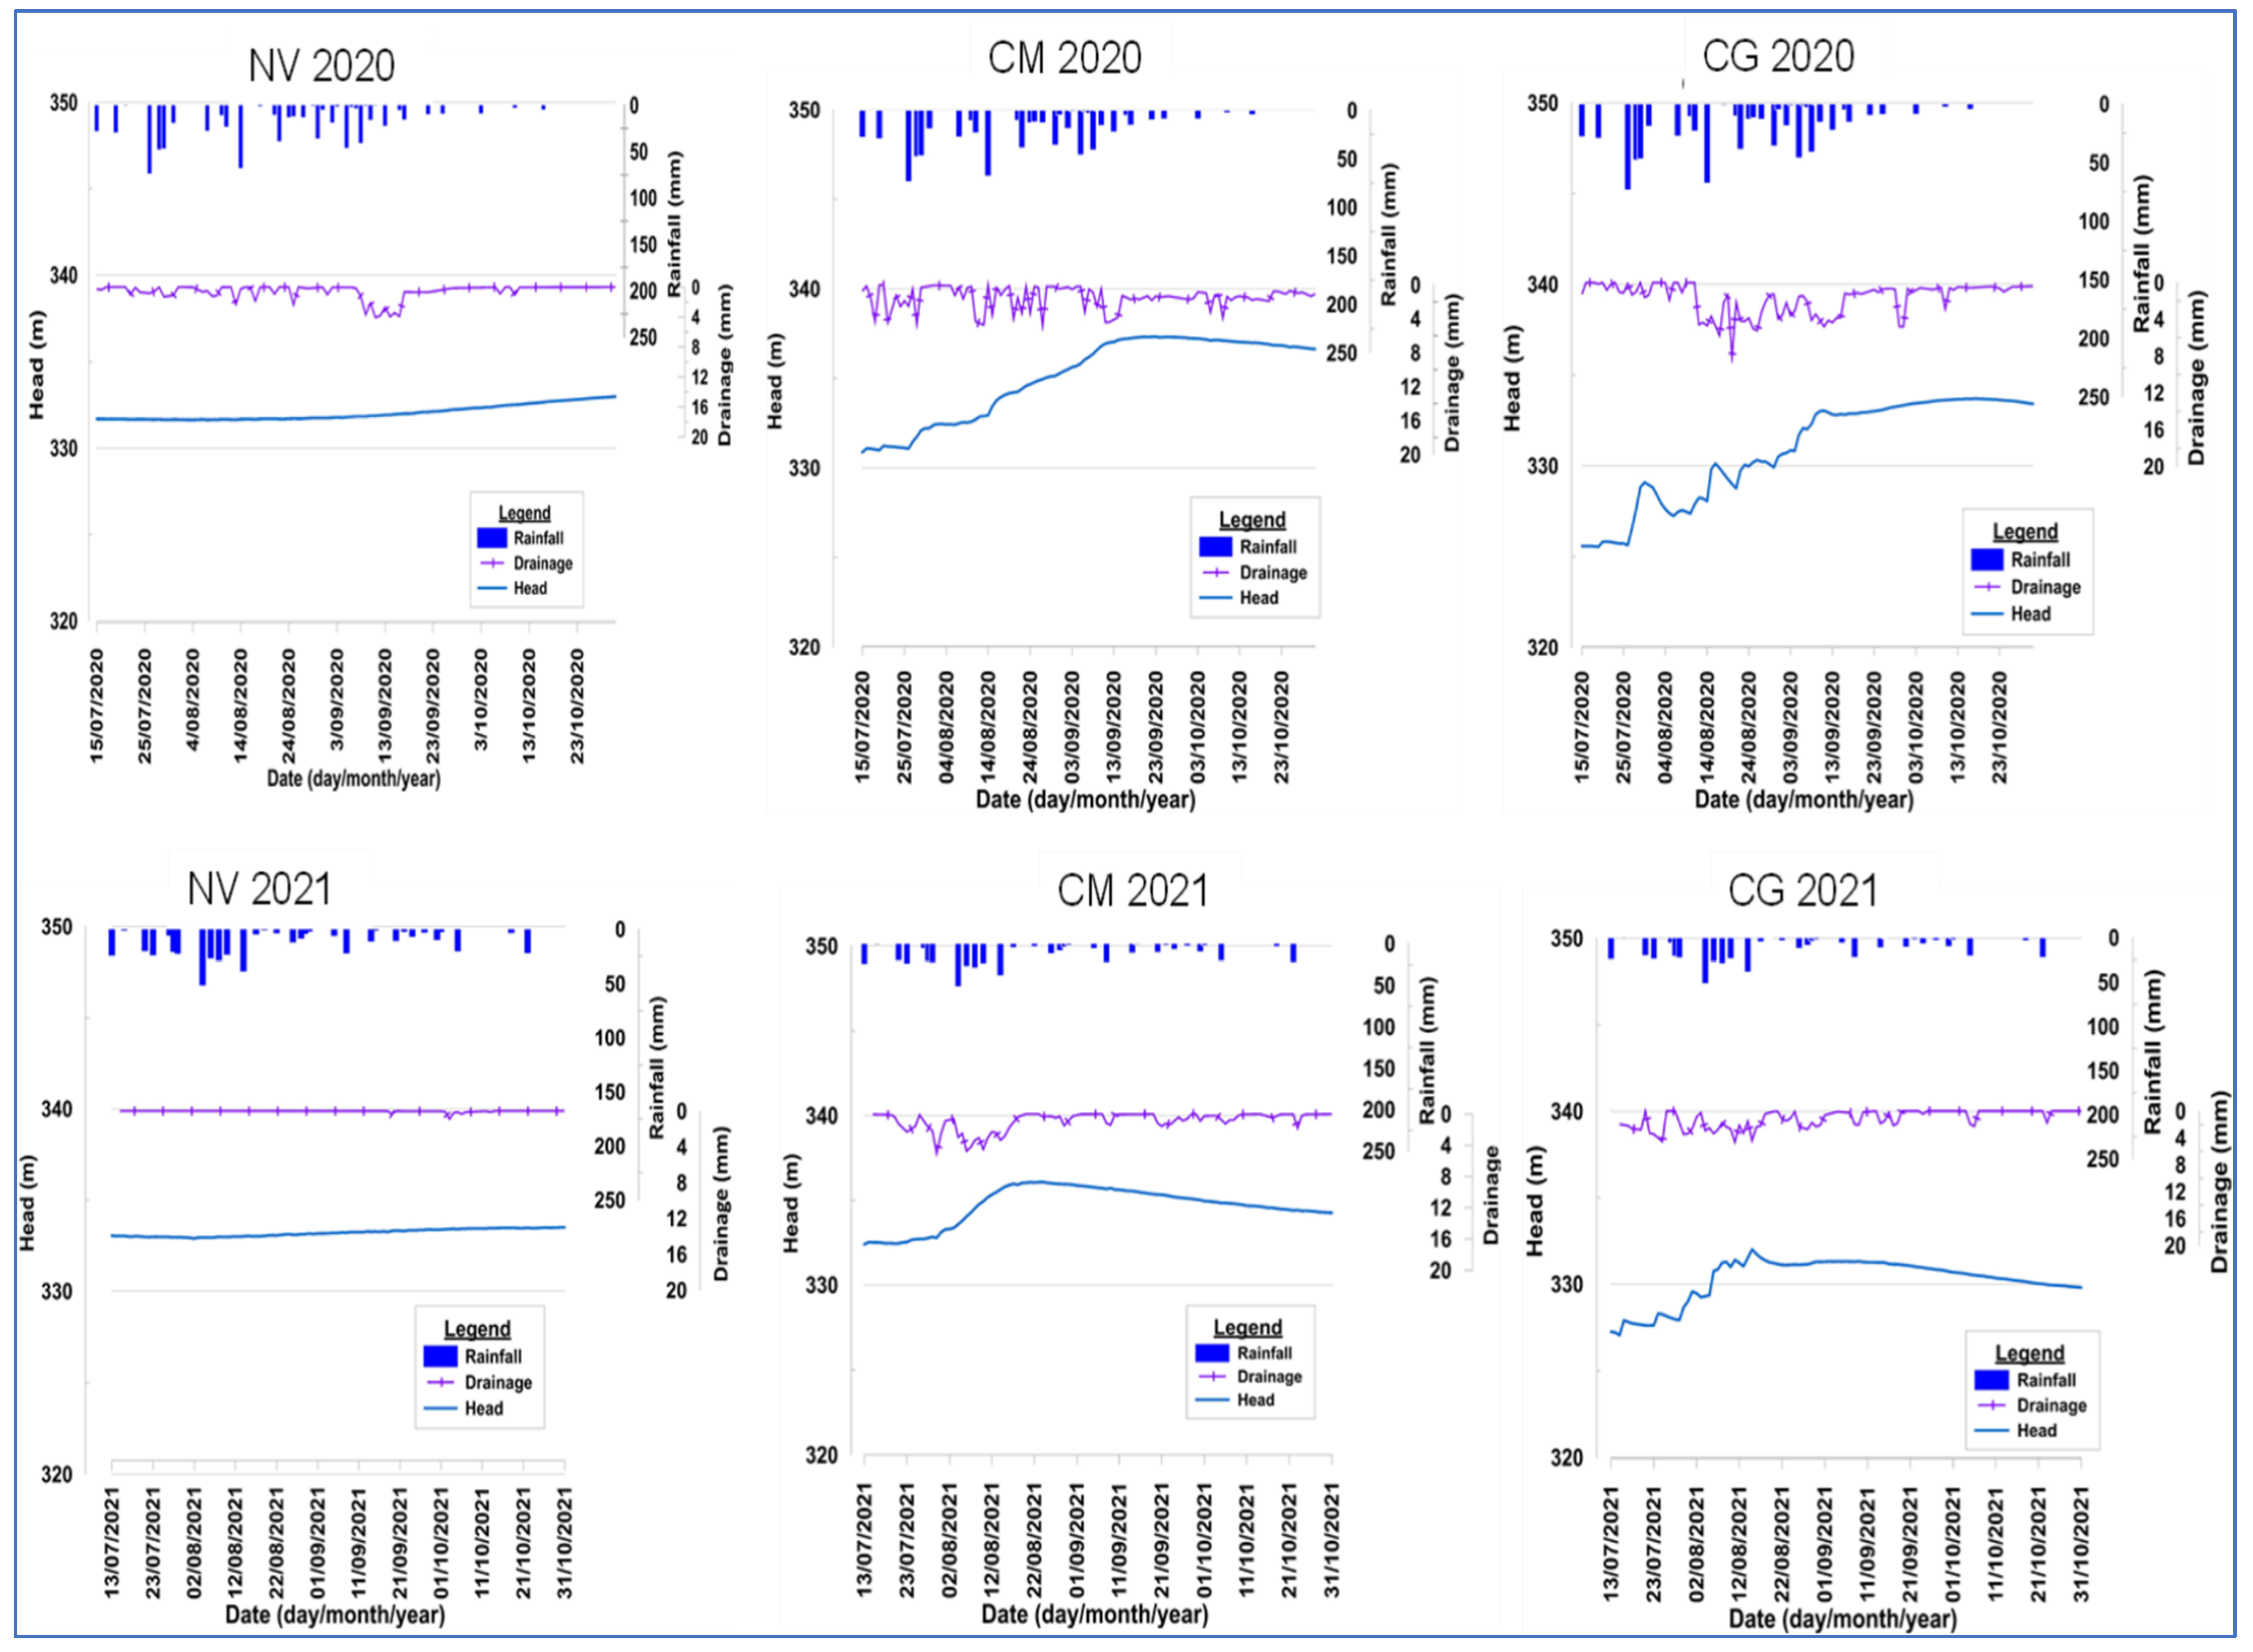
3.3. Recharge and Transfer Mechanism in the Saturated Zone

A comparison of the daily evolution of water level in each observation well installed in the vicinity of each plot and the deep drainage shows a relationship between the piezometric levels of the aquifers and the quantities of water drained under the millet (CM) and groundnut (CG) plots. The increase in piezometric levels in these plots was consecutive to deep drainage episodes and significant antecedent rainfall (Figure 11). In 2020, heavy rainfall events in July 26–31 (187.2 mm), August 10–30 (226 mm) and September 2–17 (171.3 mm) caused a significant increase in piezometric levels. During these periods, the aquifer response under millet (CM) and groundnut (CG) plots to the rainfall events was almost instantaneous. The recharge mechanism of the aquifer under CM and CG plots appeared to be direct recharge through quasi-vertical infiltration. In 2021, the water level rise which occurred mainly at the onset of the rainy season (in early June) until mid-August was attributed to the relatively heavy rainfall. These rainfall events resulted in a significant deep drainage process for millet (CM) and groundnut (CG) plots. After mid-August, the rainfall cessation combined with the recurrent dry spells led to the early recession in water table levels compared to 2020. The impact of significant rainfall on groundwater recharge was more visible in 2020 than in 2021, as shown by the sudden increase in piezometric levels for this year, which were also more contrasted under the CG plots (Figure 12).
In the NV plot, the evolution of deep drainage and piezometric level showed no direct dependence of the aquifer response to the rainfall events. In 2020, the piezometric level remained almost flat from the onset of the wet season until the end of August, despite drainage which that occurred during this period. From August 26th to November 10th, a gradual increase in the piezometric level was observed despite the cessation of deep drainage on October 11th, probably due to the cessation of rainfall events. The piezometric level continued to increase until the end of the wet season. In 2021, an increase in the piezometric level was observed despite deep drainage. Such independence of the evolution of the piezometric level in relation to the deep drainage suggests an absence of vertical hydraulic connection between the subsurface zone and the deep aquifer.
Furthermore, the relationship between the recharge calculated by the water table fluctuation (WTF) method and the drainage values obtained for each type of LULC yielded the results presented in Table 5.
Due to the semi-captive nature of the aquifer at the location where the NV plot was installed [48,77], the recharge could not be assessed by the WTF method. The recharge values under CM plot varied between 154.56 mm (21.94% of rainfall) in 2020 to 88.25 mm (20.13% of rainfall) in 2021. For the CG plot, the recharge was 156.05 mm (20.75% of rainfall) in 2020 and 94 mm (20.48% of rainfall) in 2021. For the CM and CG plots, the recharge to deep drainage ratio tended towards 0.9, which highlighted on one hand the highly rapid water transfer under the CM and CG plots while, on the other hand, the shallowness of the piezometric levels, which was less than 6 m dep during the high water period. Compaoré [46] conducted hydrodynamic parameter tests on saprolite and showed that the central valley area (cropped under millet and groundnut) had high porosity values (around 2.10−2) and average permeability values of 5.10−5 m/s. Pumping tests conducted by Compaoré [46], Vouillamoz [57], Soro (2017), and Koita et al. [62] further confirmed the previous results obtained in the central valley aquifers. Hydraulic conductivity values ranged from 7 × 10⁻⁶ to 9.5 × 10⁻⁶ m/s in the peripheral area of the catchment, whereas in the central valley, this permeability was 10 times larger [48. The findings in these previous studies support the hypothesis of rapid vertical water transfer under groundnut and millet crops. Koïta et al. [58] estimated that recharge reaches 13% of rainfall in the central valley area through the water table fluctuation method. The differences in the values reported in this study (20% of rainfall) in the central valley area might be explained by the difference in the relatively low hydraulic head observed in Koïta et al. [58] and the cumulative rainfall of over 800 mm. The 800 mm rainfall found by Koïta et al. [61] is higher than the rainfall amounts found in 2020 (724 mm) and 2020 (451.6 mm). In contrast, the Re/P ratio found in 2018 (13%) by Koïta et al. [61] in the central valley is lower than the ratios found in 2020 and 2021 (over 20%) for high rainfall. This shows that the relationship between recharge and rainfall is not linear and that other factors such as soil moisture, rainfall intensities, rainfall frequency should be considered to better understand the recharge process.
In addition, the characterization of recharge mechanisms conducted in Kafando et al. [38] through a multi-criteria approach confirmed that the central valley appears to be the preferential recharge pathway due to its sandy texture. They concluded that the recharge mechanism in the central valley is direct recharge through rainfall infiltration. The aquifer in the northern ridge occupied by natural vegetation appears to be fed by lateral transfer, following the process of redistribution of recharge according to the hydraulic gradient. Although the high evapotranspiratory capacity of natural vegetation may help to reduce drainage, the lack of hydraulic continuity between the unsaturated and saturated zones may contribute to the suppression of the recharge process in the ridge areas occupied by natural vegetation. A BRGM-Aquater [45] prospective study and Soro [48] geophysical characterization revealed the presence of a lateritic layer of about 20 m in thickness located in the ridge zone occupied by natural vegetation. The soil pits realized by BUNASOLS [37] further located a crustal roof at 1.20 m in depth in the pit near the natural vegetation plot.
Geological and hydrogeological characterization studies undertaken by Soro et al. [39] showed that in the Sanon experimental watershed, the thickness of the alterites is low near the cuirassed ridges occupied by natural vegetation. The height reaches 30–50 m in the central valley [45]. This configuration has been encountered in the majority of Sudano–Sahelian watersheds. Our study showed that the ridges occupied by natural vegetation are areas of low infiltration where actual evapotranspiration is the most dominant component of the water cycle. In contrast, the relatively flat central valley area occupied by crops tends to concentrate rainfall and runoff water favoring the preferential infiltration of water due to the relatively very high infiltration capacity of the soils. In these areas, our study showed that the transfer rates of water are rapid, hence the almost instantaneous reaction of the aquifer in the central valley to significant rainfall events. In the Sudano–Sahelian environment, the central valley zones are, in general, preferential locations for the implementation of artificial recharge techniques to increase the groundwater stock. However, the relatively quick water flow exchange between the soil and the saturated zone makes these areas prone to a high risk of groundwater pollution. It is, therefore, critical to set up monitoring strategies for such areas.

4. Conclusions

In this study, the analysis of aquifer recharge as a function of the soil surface condition was carried out in the Sanon experimental watershed in the Central region in Burkina Faso (in West Africa). The results of the field investigations indicated that the soil texture was predominantly silty–sandy, except for the groundnut plot, which had a sandy–silty texture. The average clay content of the soils was relatively high under the natural vegetation plot, followed by the millet and groundnut plots. Conversely, the soils of the groundnut and millet plots showed higher infiltration capacities than that of the soils under the natural vegetation plot. The water balance analysis carried out in the experimental plots revealed that the actual evapotranspiration was the dominant component. The amount of water drained to the deep aquifer was low under the natural vegetation plot due to the high actual evapotranspiration and interception capacity of the vegetation cover canopy. Comparison of the evolution of the rainfall and deep drainage in relation to the piezometric level in the natural vegetation zone revealed a hydraulic disconnection between the soil and the aquifer systems. The response of the aquifer to the rainfall events under the groundnut and millet plots was almost instantaneous. The recharge mechanism under these plots was therefore likely to be direct recharge through rainfall infiltration. The recharge to deep drainage ratio of 0.9 highlights the quick water transfer in the central valley, which in turn explains the quasi-instantaneous response of the aquifer to significant rainfall events. However, in the natural vegetation zone the recharge mechanism appeared to be controlled by lateral transfer from other aquifers. The central valley, which seems to be a preferential recharge pathway, under specific condition, provided promising insights for the implementation of artificial recharge infrastructures.

Supplementary Materials

The following supporting information can be downloaded at: https://www.mdpi.com/article/10.3390/su142214687/s1, Sheet S1: Water depth (cm) to surface runoff volume (L) rating curve of the buried barrel (NV plot); Sheet S2: Rainfall and runoff data collected at each plot for the two wet campaigns (years 2020 and 2021).

Author Contributions

Conceptualization, M.B.K., M.K. and C.O.Z.; methodology, M.B.K., M.K. and D.N.; validation, M.K. and C.O.Z.; formal analysis, M.B.K. and M.K.; investigation, M.B.K., M.K.; resources, M.K.; data curation, M.B.K..; writing—original draft preparation, M.B.K.; writing—review and editing M.K., C.O.Z. and R.Y.; visualization M.K., C.O.Z., R.Y.; supervision M.K.; project administration, M.K.; funding acquisition, M.B.K. and M.K. All authors have read and agreed to the published version of the manuscript.

Funding

This research is financed by the project “Programme d’ Approvisionnement En Eau et As-sainissement (PAEA)” funded by the World Bank and the Burkinabe government.

Institutional Review Board Statement

Not applicable.

Informed Consent Statement

Not applicable.

Data Availability Statement

Data sharing is not applicable to this article.

Acknowledgments

This study was carried out within the Water Supply and Sanitation Program (WSSP or PAEA in French) framework, funded by the World Bank and the Government of Burkina Faso. We thank the project management unit for providing us with the necessary resources to conduct this study. The authors would also like to thank the people of Sanon for their warm welcome at the experimental site.

Conflicts of Interest

The authors declare no conflict of interest.

References

  1. UN. The United Nations World Water Development Report 2022: Groundwater: Making the Invisible Visible; UNESCO: Paris, France, 2022. [Google Scholar]
  2. Seiler, K.P.; Gat, J.R. Groundwater Recharge from Run-Off. Infiltration and Percolation; Springer Science & Business Media: Berlin/Heidelberg, Germany, 2007; Volume 55, ISBN 978-1-4020-5305-4. [Google Scholar]
  3. Leader, T.T.; Wijnen, M. Assessment of Groundwater Challenges & Opportunities in Support of Sustainable Development in Sub-Saharan Africa; The World Bank: Washington, DC, USA, 2018. [Google Scholar]
  4. Gaye, C.B.; Tindimugaya, C. Review: Challenges and Opportunities for Sustainable Groundwater Management in Africa. Hydrogeol. J. 2019, 27, 1099–1110. [Google Scholar] [CrossRef]
  5. Simmers, I. Aridity, Groundwater Recharge and Water Resources Management. In Groundwater Recharge: A Guide to Recharge Measurement in Arid and Semiarid Regionsunderstanding and Estimating Natural Recharge; Lerner, D.S., Issar, S.I., Eds.; Verlag Heinz Heise: Hannover, Germany, 1990. [Google Scholar]
  6. Belemtougri, A.P.; Ducharne, A.; Tazen, F.; Oudin, L.; Karambiri, H. Understanding Key Factors Controlling the Duration of River Flow Intermittency: Case of Burkina Faso in West Africa. J. Hydrol. Reg. Stud. 2021, 37, 100908. [Google Scholar] [CrossRef]
  7. Zipper, S.C.; Dallemagne, T.; Gleeson, T.; Boerman, T.C.; Hartmann, A. Groundwater Pumping Impacts on Real Stream Networks: Testing the Performance of Simple Management Tools. Water Resour. Res. 2018, 54, 5471–5486. [Google Scholar] [CrossRef] [Green Version]
  8. Gehrels, H. Impact of Human Activity on Groundwater Dynamics: Proceedings of an International Symposium (Symposium S3) Held during the Sixth Scientific Assembly of the International Association of Hydrological Sciences (IAHS) at Maastricht, The Netherlands, from 18 T; International Assn of Hydrological Sciences: Wallingford, UK, 2001; ISBN 1901502562. [Google Scholar]
  9. Tang, Z.; Engel, B.A.; Pijanowski, B.C.; Lim, K.J. Forecasting Land Use Change and Its Environmental Impact at a Watershed Scale. J. Environ. Manag. 2005, 76, 35–45. [Google Scholar] [CrossRef] [PubMed]
  10. Rusagara, R.; Koïta, M.; Plagnes, V.; Jost, A. Groundwater Recharge Pathways to a Weathered-Rock Aquifer System in a Dryland Catchment in Burkina Faso. Hydrogeol. J. 2022, 30, 1489–1512. [Google Scholar] [CrossRef]
  11. Yonaba, O.R.; Biaou, A.C.; Koïta, M.; Tazen, F.; Mounirou, L.A.; Zouré, C.O.; Queloz, P.; Karambiri, H.; Yacouba, H. A Dynamic Land Use/Land Cover Input Helps in Picturing the Sahelian Paradox: Assessing Variability and Attribution of Changes in Surface Runoff in a Sahelian Watershed. Sci. Total Environ. 2021, 757, 143792. [Google Scholar] [CrossRef] [PubMed]
  12. Kim, J.H.; Jackson, R.B. A Global Analysis of Groundwater Recharge for Vegetation, Climate, and Soils. Vadose Zo. J. 2012, 11, 21ra. [Google Scholar] [CrossRef] [Green Version]
  13. Guo, Y.; Gan, F.; Yan, B.; Bai, J.; Wang, F.; Jiang, R.; Xing, N.; Liu, Q. Evaluation of Groundwater Storage Depletion Using GRACE/GRACE Follow-On Data with Land Surface Models and Its Driving Factors in Haihe River Basin, China. Sustainability 2022, 14, 1108. [Google Scholar] [CrossRef]
  14. Vörösmarty, C.J.; Green, P.; Salisbury, J.; Lammers, R.B. Global Water Resources: Vulnerability from Climate Change and Population Growth. Science 2000, 289, 284–288. [Google Scholar] [CrossRef] [Green Version]
  15. Keese, K.E.; Scanlon, B.R.; Reedy, R.C. Assessing Controls on Diffuse Groundwater Recharge Using Unsaturated Flow Modeling. Water Resour. Res. 2005, 41, 1–12. [Google Scholar] [CrossRef]
  16. Owuor, S.O.; Butterbach-Bahl, K.; Guzha, A.C.; Jacobs, S.; Merbold, L.; Rufino, M.C.; Pelster, D.E.; Díaz-Pinés, E.; Breuer, L. Conversion of Natural Forest Results in a Significant Degradation of Soil Hydraulic Properties in the Highlands of Kenya. Soil Tillage Res. 2018, 176, 36–44. [Google Scholar] [CrossRef] [Green Version]
  17. Pielke, R.A.; Avissar, R.; Raupach, M.; Dolman, A.J.; Zeng, X.; Denning, A.S. Interactions between the Atmosphere and Terrestrial Ecosystems: Influence on Weather and Climate. Glob. Chang. Biol. 1998, 4, 461–475. [Google Scholar] [CrossRef]
  18. Pitman, A.J.; Narisma, G.T.; Pielke, R.A.; Holbrook, N.J. Impact of Land Cover Change on the Climate of Southwest Western Australia. J. Geophys. Res. Atmos. 2004, 109, 1–12. [Google Scholar] [CrossRef] [Green Version]
  19. Scanlon, B.R.; Reedy, R.C.; Stonestrom, D.A.; Prudic, D.E.; Dennehy, K.F. Impact of Land Use and Land Cover Change on Groundwater Recharge and Quality in the Southwestern US. Glob. Chang. Biol. 2005, 11, 1577–1593. [Google Scholar] [CrossRef]
  20. Fayer, M.J.; Gee, G.W.; Rockhold, M.L.; Freshley, M.D.; Walters, T.B. Estimating Recharge Rates for a Groundwater Model Using a GIS. J. Environ. Qual. 1996, 25, 510–518. [Google Scholar] [CrossRef]
  21. Rockhold, M.L.; Fayer, M.J.; Kincaid, C.T.; Gee, G.W. Estimation of Natural Ground Water Recharge for the Performance Assessment of a Low-Level Waste Disposal Facility at the Hanford Site; U.S. Department of Energy Office of Scientific and Technical Information: Oak Ridge, TN, USA, 1995; p. 93. [Google Scholar] [CrossRef] [Green Version]
  22. Scanlon, B.R.; Reedy, R.C.; Bronson, K.F. Impacts of Land Use Change on Nitrogen Cycling Archived in Semiarid Unsaturated Zone Nitrate Profiles, Southern High Plains, Texas. Environ. Sci. Technol. 2008, 42, 7566–7572. [Google Scholar] [CrossRef]
  23. Huang, T.; Pang, Z.; Edmunds, W.M. Soil Profile Evolution Following Land-Use Change: Implications for Groundwater Quantity and Quality. Hydrol. Process. 2013, 27, 1238–1252. [Google Scholar] [CrossRef]
  24. Zouré, C.O.; Queloz, P.; Koïta, M.; Niang, D.; Fowé, T.; Yonaba, O.R.; Consuegra, D.; Yacouba, H.; Karambiri, H. Modelling the Water Balance on Farming Practices at Plot Scale: Case Study of Tougou Watershed in Northern Burkina Faso. Catena 2019, 173, 59–70. [Google Scholar] [CrossRef] [Green Version]
  25. Dams, J.; Woldeamlak, S.T.; Batelaan, O. Predicting Land-Use Change and Its Impact on the Groundwater System of the Kleine Nete Catchment, Belgium. Hydrol. Earth Syst. Sci. 2008, 12, 1369–1385. [Google Scholar] [CrossRef]
  26. Ibrahim, M.; Favreau, G.; Scanlon, B.R.; Seidel, J.L.; Le Coz, M.; Demarty, J.; Cappelaere, B. Long-Term Increase in Diffuse Groundwater Recharge Following Expansion of Rainfed Cultivation in the Sahel, West Africa. Hydrogeol. J. 2014, 22, 1293–1305. [Google Scholar] [CrossRef]
  27. Prabhakar, A.; Tiwari, H. Land Use and Land Cover Effect on Groundwater Storage. Model. Earth Syst. Environ. 2015, 1, 45. [Google Scholar] [CrossRef] [Green Version]
  28. Ashaolu, E.; Ifabiyi, I. Effect of Land Use/Land Cover Change on Groundwater Recharge in Osun Drainage Basin, Nigeria. J. Geol. Geogr. Geoecology 2019, 28, 381–394. [Google Scholar] [CrossRef]
  29. Mengistu, T.D.; Chung, I.-M.; Kim, M.-G.; Chang, S.W.; Lee, J.E. Impacts and Implications of Land Use Land Cover Dynamics on Groundwater Recharge and Surface Runoff in East African Watershed. Water 2022, 14, 2068. [Google Scholar] [CrossRef]
  30. Abdelaziz, K.K.; Nicaise, Y.; Séguis, L.; Ouattara, I.; Moussa, O.; Auguste, K.; Kamagaté, B.; Diakaria, K. Influence of Land Use Land Cover Change on Groundwater Recharge in the Continental Terminal Area of Abidjan, Ivory Coast. J. Water Resour. Prot. 2020, 12, 431–453. [Google Scholar] [CrossRef]
  31. Hall, B.; Currell, M.; Webb, J. Using Multiple Lines of Evidence to Map Groundwater Recharge in a Rapidly Urbanising Catchment: Implications for Future Land and Water Management. J. Hydrol. 2020, 580, 124265. [Google Scholar] [CrossRef]
  32. Warku, F.; Korme, T.; Wedajo, G.K.; Nedow, D. Impacts of Land Use/Cover Change and Climate Variability on Groundwater Recharge for Upper Gibe Watershed, Ethiopia. Sustain. Water Resour. Manag. 2021, 8, 2. [Google Scholar] [CrossRef]
  33. Beekman, H.E.; Gieske, A.S.M.; Selaolo, E.T. GRES: Groundwater Recharge Studies in Botswana 1987–1996. Botswana J. Earth Sci. 1996, III, 1–17. [Google Scholar]
  34. Healy, R.W. Estimating Groundwater Recharge; Cambridge University Press: Cambridge, UK, 2010; ISBN 1139491393. [Google Scholar]
  35. Wang, L.; O Dochartaigh, B.; Macdonald, D. A Literature Review of Recharge Estimation and Groundwater Resource Assessment in Africa; British Geological Survey: London, UK, 2010. [Google Scholar]
  36. Gbohoui, Y.P.; Paturel, J.-E.; Fowe Tazen; Mounirou, L.A.; Yonaba, R.; Karambiri, H.; Yacouba, H. Impacts of Climate and Environmental Changes on Water Resources: A Multi-Scale Study Based on Nakanbé Nested Watersheds in West African Sahel. J. Hydrol. Reg. Stud. 2021, 35, 100828. [Google Scholar] [CrossRef]
  37. BUNASOLS. Rapport D’inspection Morphopédologique et Résultats d’analyses Granulométriques Des Prélèvements Des Sols Du Site Expérimental de Sanon; BUNASOLS: Ouagadougou, Burkina Faso, 2020. [Google Scholar]
  38. Kafando, M.B.; Koïta, M.; Le Coz, M.; Yonaba, O.R.; Fowe, T.; Zouré, C.O.; Faye, M.D.; Leye, B. Use of Multidisciplinary Approaches for Groundwater Recharge Mechanism Characterization in Basement Aquifers: Case of Sanon Experimental Catchment in Burkina Faso. Water 2021, 13, 3216. [Google Scholar] [CrossRef]
  39. Soro, D.D.; Koïta, M.; Biaou, C.A.; Outoumbe, E.; Vouillamoz, J.M.; Yacouba, H.; Guérin, R. Geophysical Demonstration of the Absence of Correlation between Lineaments and Hydrogeologically Usefull Fractures: Case Study of the Sanon Hard Rock Aquifer (Central Northern Burkina Faso). J. African Earth Sci. 2017, 129, 842–852. [Google Scholar] [CrossRef]
  40. IGB. Base de Données d’Occupation Des Terres (BDOT) 2012; IGB: Ouagadougou, Burkina Faso, 2012. [Google Scholar]
  41. UNEP. World Atlas of Desertification, 2nd ed.; UNEP: Nairobi, Kenya, 1997. [Google Scholar]
  42. ANAM. Bases de Données Météorologiques Du Burkina Faso; ANAM-BF: Ouagadougou, Burkina Faso, 2022. [Google Scholar]
  43. Feybesse, J.-L.; Billa, M.; Guerrot, C.; Duguey, E.; Lescuyer, J.-L.; Milesi, J.-P.; Bouchot, V. The Paleoproterozoic Ghanaian Province: Geodynamic Model and Ore Controls, Including Regional Stress Modeling. Precambrian Res. 2006, 149, 149–196. [Google Scholar] [CrossRef]
  44. Castaing, C.; Chevremont, P.; Donzeau, M.; Egal, E.; Le Mentour, J.; Thiéblemont, D.; Tegyey, M.; Guerrot, C.; Billa, M.; Itard, Y.; et al. Notice Explicative de La Carte Géologique et Minière Du Burkina Faso à 1/1 000 000; British Geological Survey: London, UK, 2003. [Google Scholar]
  45. BRGM-Aquater. Exploitation Des Eaux Souterraines En Socle Cristallin et Valorisation Agricole: Pilote Expérimental En Milieu Rural Pour Les Zones Soudano-Sahéliennes et Sahéliennes; Rapport 33576 ; BRGM (Bureau de Recherches Géologiques et Minières): Orléans, France, 1991. [Google Scholar]
  46. Compaore, G. Évaluation de La Fonction Capacitive Des Altérites, Site Expérimental de Sanon: Socle Granito-Gneissique Sous Climat de Type Soudano-Sahélien. Ph.D. Thesis, Université d’Avignon, Avignon, France, 1997. [Google Scholar]
  47. De Gramont, H.M. Amelioration de La Connaissance et de La Gestion Des Eaux Au Burkina Faso. P162723. Annexes 1: Diagnostic Sur Les Eaux Souterraines; World Bank: Washington, DC, USA, 2017. [Google Scholar]
  48. Soro, D.D. Caractérisation et Modélisation Hydrogéologique d’un Aquifère En Milieu de Socle Fracturé: Cas Du Site Expérimental de Sanon (Région Du Plateau Central Au Burkina Faso). Ph.D. Thesis, Université Pierre et Marie Curie, Paris, France, 2017. [Google Scholar]
  49. Mounirou, L.A. Etude Du Ruissellement et de L_érosion à Différentes Échelles Spatiales Sur Le Bassin Versant de Tougou En Zone Sahélienne Du Burkina Faso: Quantification et Transposition Des Données. Ph.D. Thesis, Universite de Montpellier, Montpellier, France, 2012. [Google Scholar]
  50. Mounirou, L.A.; Zouré, C.O.; Yonaba, O.R.; Paturel, J.-E.; Mahé, G.; Niang, D.; Yacouba, H.; Karambiri, H. Multi-Scale Analysis of Runoff from a Statistical Perspective in a Small Sahelian Catchment under Semi-Arid Climate. Arab. J. Geosci. 2020, 13, 154. [Google Scholar] [CrossRef]
  51. Mounirou, L.A.; Yonaba, O.R.; Koïta, M.; Paturel, J.-E.; Mahé, G.; Yacouba, H.; Karambiri, H. Hydrologic Similarity: Dimensionless Runoff Indices across Scales in a Semi-Arid Catchment. J. Arid Environ. 2021, 193, 104590. [Google Scholar] [CrossRef]
  52. Schaap, M.G.; Leij, F.J.; Van Genuchten, M.T. Rosetta: A Computer Program for Estimating Soil Hydraulic Parameters with Hierarchical Pedotransfer Functions. J. Hydrol. 2001, 251, 163–176. [Google Scholar] [CrossRef]
  53. Peugeot, C. Influence de l’encroutement Superficiel Du Sol Sur Le Fonctionnement Hydrologique d’un Versant Sahelien (Niger). Experimentations in Situ et Modelisation. Ph.D. Thesis, Université Joseph Fourier, Grenoble, France, 1995. [Google Scholar]
  54. Darcy, H. Les Fontaines Publiques de La Ville de Dijon: Exposition et Application; Victor Dalmont: Paris, France, 1856. [Google Scholar]
  55. Simunek, J.; Sejna, M.; Van Genuchten, M.T.; Šimůnek, J.; Šejna, M.; Jacques, D.; Sakai, M. The HYDRUS-1D Software Package for Simulating the One-Dimensional Movement of Water, Heat, and Multiple Solutes in Variably-Saturated Media; University of California: Riverside, CA, USA, 1998. [Google Scholar]
  56. Niang, D. Fonctionnement Hydrique Des Différents Types de Placages Sableux Dans Le Sahel Burkinabé. Ph.D. Thesis, École Polytechnique Fédérale de Lausanne, Lausanne, Switzerland, 2006. [Google Scholar]
  57. Klaus, R.; Dourado-Neto, D.; Schwantes, A.P.; Timm, L.C. Soil Water Storage as Related to Water Balance; International Centre for Theoretical Physics: Trieste, Italy, 2013; pp. 1–12. [Google Scholar]
  58. Allen, R.G.; Pereira, L.S.; Raes, D.; Smith, M. FAO Irrigation and Drainage Paper No. 56; Food and Agriculture Organization of the United Nations: Rome, Italy, 1998. [Google Scholar]
  59. Scanlon, B.R.; Healy, R.W.; Cook, P.G. Choosing Appropriate Techniques for Quantifying Groundwater Recharge. Hydrogeol. J. 2002, 10, 18–39. [Google Scholar] [CrossRef]
  60. Vouillamoz, J.-M. La Caractérisation Des Aquifères Par Une Méthode Non Invasive: Les Sondages Par Résonance Magnétique Protonique. Ph.D. Thesis, Université Paris, Paris, France, 2003. [Google Scholar]
  61. Koïta, M.; Yonli, H.F.; Soro, D.D.; Dara, A.E.; Vouillamoz, J.M. Groundwater Storage Change Estimation Using Combination of Hydrogeophysical and Groundwater Table Fluctuation Methods in Hard Rock Aquifers. Resources 2018, 7, 5. [Google Scholar] [CrossRef] [Green Version]
  62. Mukhopadhyay, S.; Masto, R.E.; Tripathi, R.C.; Srivastava, N.K. Application of Soil Quality Indicators for the Phytorestoration of Mine Spoil Dumps; Elsevier Inc.: Amsterdam, The Netherlands, 2019; ISBN 9780128139134. [Google Scholar]
  63. Casenave, A.; Valentin, C. Les États de Surface de La Zone Sahélienne: Influence Sur l’infiltration; Orstom: Paris, France, 1989. [Google Scholar]
  64. Zhang, X.; Yu, X.; Wu, S.; Wei, T.; Zhang, X. Effect of Forest Vegetation on Runoff and Sediment Production in Sloping Lands of Loess Area. Front. For. China 2006, 1, 336–342. [Google Scholar] [CrossRef]
  65. Chen, H.; Zhang, X.; Abla, M.; Lü, D.; Yan, R.; Ren, Q.; Ren, Z.; Yang, Y.; Zhao, W.; Lin, P.; et al. Effects of Vegetation and Rainfall Types on Surface Runoff and Soil Erosion on Steep Slopes on the Loess Plateau, China. Catena 2018, 170, 141–149. [Google Scholar] [CrossRef]
  66. Armand, R. Étude Des États de Surface Du Sol et de Leur Dynamique Pour Différentes Pratiques de Travail Du Sol. Mise Au Point d’un Indicateur de Ruissellement. Ph.D. Thesis, Université de Strasbourg, Strasbourg, France, 2009. [Google Scholar]
  67. Yonaba, O.R. Dynamique Spatio-Temporelle Des États de Surface et Influence Sur Le Ruissellement Sur Un Bassin de Type Sahélien: Cas Du Bassin de Tougou (Nord Burkina Faso); HAL: Lyon, France, 2020. [Google Scholar]
  68. Roose, E.J. Ruissellement et Érosion Avant et Après Défrichement En Fonction Du Type de Culture En Afrique Occidentale. Cah. ORSTOM Série Pédologie 1983, 20, 327–339. [Google Scholar]
  69. Igbadun, H.E. Estimation of Crop Water Use of Rain-Fed Maize and Groundnut Using Mini-Lysimeters. Pacific J. Sci. Technol. 2012, 13, 527–535. [Google Scholar]
  70. Roose, E.J. Dynamique Actuelle de Deux Sols Ferrugineux Tropicaux Indurés Sous Sorgho et Sous Savane Soudano-Sahélienne: SARIA, Haute Volta: Synthèse Des Campagnes 1971–1974; ORSTOM: Paris, France, 1979. [Google Scholar]
  71. Roose, E.J. Etats de Surface Du Sol et Risques de Ruissellement et D’érosion; Centre ORS: Bankstown, Australia, 1996. [Google Scholar]
  72. Traore, K.; Sidibe, D.K.; Coulibaly, H.; Bayala, J. Optimizing Yield of Improved Varieties of Millet and Sorghum under Highly Variable Rainfall Conditions Using Contour Ridges in Cinzana, Mali. Agric. Food Secur. 2017, 6, 1–13. [Google Scholar] [CrossRef] [Green Version]
  73. Ma, B.; Ma, F.; Li, Z.; Wu, F. Effects of Soil Crust and Crop on Runoff and Erosion in Loess Plateau. Acta Agric. Scand. Sect. B Soil Plant Sci. 2014, 64, 645–656. [Google Scholar] [CrossRef]
  74. Akponikpe, P. Millet Response to Water and Soil Fertility Management in the Sahelian Niger: Experiments and Modeling. 2008. Available online: https://dial.uclouvain.be/pr/boreal/object/boreal:19624 (accessed on 22 September 2022).
  75. Klaij, M.C.; Vachaud, G. Seasonal Water Balance of a Sandy Soil in Niger Cropped with Pearl Millet, Based on Profile Moisture Measurements. Agric. Water Manag. 1992, 21, 313–330. [Google Scholar] [CrossRef] [Green Version]
  76. Cissé, L.; Imbernon, J.; Dancette, C. Bilan Hydrique et Minéral Sous Culture d’arachide et de Mil à l’échelle de l’hectare. In Document de Travail No 1985-5; I.S.R.A., Département Systèmes et Transfert: Dakar, Senegal, 1985. [Google Scholar]
  77. Koïta, M.; Yonli, H.F.; Soro, D.D.; Dara, A.E.; Vouillamoz, J.M. Taking into Account the Role of the Weathering Profile in Determining Hydrodynamic Properties of Hard Rock Aquifers. Geosciences 2017, 7, 89. [Google Scholar] [CrossRef]
Figure 1. (a) Location of Burkina Faso in West Africa. (b) Geologic map of Burkina Faso. (c) LULC map of Sanon watershed. (d) Relief, hydrography and monitoring equipment. Such equipment include piezometers, rain gauges (P1 to P4) and 2D cross sections of the PSaG and PS1 weathering profile [39,40]. The Figure is adapted with permission from [39].
Sustainability 14 14687 g001
Figure 2. Monthly rainfall and potential evapotranspiration in Sanon watershed. The monthly summaries were calculated over the period 1961–2021 using data acquired from the National Meteorology Agency [42]. PET is the potential evapotranspiration.
Sustainability 14 14687 g002
Figure 3. The 2D geologic model of Sanon watershed with associated resistivity values (modified from Soro [48] and Soro et al. [39]). S1CN, S1CNP, S1, S2, S11, and SaG are observation wells. The Figure is adapted with permission from [39].
Sustainability 14 14687 g003
Figure 4. LULC map of Sanon watershed along with the location of the toposequence observation transects. SD1, S2, SM3, S4, and SA5 refers to soil pits.
Sustainability 14 14687 g004
Figure 5. Experimental plots and devices for measuring water balance components.
Sustainability 14 14687 g005
Figure 6. Field photographs of runoff collection and monitoring equipments: (a) at the outlet of the natural vegetation (NV) plot and (b) at the outlet of the millet (CM) and groundnut (CG) plots.
Sustainability 14 14687 g006
Figure 7. (a) Proportion of fine elements versus soil depth, (b) Evolution of bulk densities with soil depths on the experimental plots.
Sustainability 14 14687 g007
Figure 8. Comparison of Ksat values during the dry and wet season in measurements plots. (a) Dry season; (b) Wet season.
Sustainability 14 14687 g008
Figure 9. Determination of the minimum rainfall amount triggering surface (Rmr) runoff in the experimental plots.
Sustainability 14 14687 g009
Figure 10. Field photographs showing the development of the vegetation cover in each experimental plots: (a) Natural vegetation (NV) plot, (b) Millet (CM) plot, and (c) Groundnut (CG) plot (photograph taken in September 2020).
Sustainability 14 14687 g010
Figure 11. Relative percentage of water balance terms relative to rainfall in natural vegetation (NV), millet (CM) and groundnut (CG) plots in 2020 and 2021. P represents the total rainfall; ETa is the actual evapotranspiration; D is the deep drainage and ΔS is the seasonal change in water storage.
Sustainability 14 14687 g011
Figure 12. Evolution of the piezometric levels as a function of deep drainage and rainfall in experimental plots: 2020 and 2021 campaigns.
Sustainability 14 14687 g012
Table 1. Average values and standard deviation of hydraulic conductivity at saturation (Ksat) and clay content at each experimental plot for two successive campaigns.
PlotKsat (cm/h)Average Clay
Content (%)
Dry SeasonWet Season
NV1.89 (±0.86)1.62 (±0.40)31.0 (±12.7)
CM3.77 (±1.28)3.30 (±0.79)19.2 (±11.6)
CG4.20 (±0.77)4.60 (±0.72)15.3 (±9.4)
Table 2. Rainfall and runoff characteristics from 2020 to 2021.
Parameters 20202021
Number of rainfall events 3832
Cumulative rainfall (mm) 724451.6
Number of events >30 mm 102
Longest dry spell (in days)716
Cumulative runoff (mm)NV159.136
CM254.4153
CG193.4110.1
Surface rainfall/Runoff (R/P) (%)NV25.58.3
CM36.1234.90
CG25.7223.88
Table 3. Water balance components of the experimental plots for the 2020 and 2021 wet seasons. P represents total rainfall, ETa is the actual evapotranspiration; Etad is the daily average of actual evapotranspiration; R is the surface runoff, D is the deep drainage and ΔS is the seasonal change in water storage.
Parameters20202021
NVCMCGNVCMCG
P (mm)715.3704.5752.1448.3438.3461.2
R(mm)159.1254.4193.436153110.1
D (mm)57.9176.3186.72.8592109
ΔS (mm)3.6−5.9−50.133.910.313.6
ETa (mm)494.7279.7422.1375.55183.3228.5
Etad (mm/d)4.02.43.73.41.702.1
Table 4. Comparison of the daily mean value of actual evapotranspiration (ETa) and the daily mean value of crop evapotranspiration (ETc).
Plot20202021
ETad (mm/d)ETc (mm/d)ETad (mm/d)ETc (mm/d)
NV3.804.463.44.2
CM2.33.371.703.1
CG3.43.92.23.3
Table 5. Recharge and recharge to deep drainage ratios. Re refers to recharge; D is the deep drainage; P is the rainfall; ΔH is the hydraulic head loss and Sy is the specific yield.
Plot2020
Sy (%)ΔH (m)Re (mm)P (mm)D (mm)Re/P (%)D/P (%)R = /D
NV-1.87 715.357 7.97
CM2.46.44154.56704.5165.621.9423.510.93
CG1.918.17156.05752.1186.720.7524.820.84
Plot2021
Sy (%)ΔH (m)R(mm)P (mm)D (mm)R/P (%)D/P (%)R/D
NV-0.6 448.32.85 0.64
CM2.43.6888.25438.395.0020.1321.670.93
CG1.94.9594.45461.210920.4823.630.87
Publisher’s Note: MDPI stays neutral with regard to jurisdictional claims in published maps and institutional affiliations.

