


Measuring the Level of the Youth Informal Economy in Lithuania in 2004–2020

Faculty of Economics and Business Administration, Vilnius University, 01513 Vilnius, Lithuania
Economies 2022, 10(11), 275; https://doi.org/10.3390/economies10110275
Submission received: 7 October 2022
/
Revised: 1 November 2022
/
Accepted: 2 November 2022
/
Published: 6 November 2022
(This article belongs to the Special Issue Nexus between Politics and Economics in the Emerging Countries)
Abstract
:This paper investigates the development of the youth informal economy in Lithuania in 2004–2020. Specific youth-tailored multiple indicators multiple causes (MIMIC) model has been derived in order to estimate the level of the youth informal economy. In total, 173 direct phone interviews with company managers were conducted in order to acquire information for the MIMIC model calibration. It was revealed that during the investigated period, the youth informal economy fluctuated between 38.7% and 46.1% and was significantly higher compared with the overall informal economy in Lithuania. Although showing a strong correlation level (0.742) the overall informal economy within the country and the youth informal economy show slightly different developmental paths, the latter being more prone to higher increases during a crisis period.
1. Introduction
Scientific focus on informal economies spans more than three decades (Hart 1985; Sassen 1993). The importance of the informal economy research is acknowledged by scholars aiming for a more accurate assessment of the economic performance of the country (Elbahnasawy et al. 2016), investigating possibilities for a more thorough taxation regime (Meagher 2018), combating corruption (Choi and Thum 2005; Hoinaru et al. 2020) or even focused on tackling terrorist activities (Schneider 2019). The answer to these scientific problems mainly presumes a more accurate estimation of the level of the informal economy within the state, not paying significant attention to its particular constituent sectors. Even though there is another significant scientific stream, which considers informal economies as an effect of governments’ inadequate social policy measures, rather than a deliberate intention of a person to break existing legislation (McKeever 1998; Eijdenberg and Borner 2017). In this case, informal economic activities are treated as transient measures undertaken by individuals in order to satisfy their basic needs before the same aim can be achieved through the official economic means. This perspective utilizes a more detailed approach aimed at identifying the level of the informal economy in various sectors of the state’s economy (Schneider et al. 2022), not only in order to identify the sectors where informal economic activities are more intense, but also to recognize the most socially vulnerable parts of society. Such an approach enabled estimates of the levels of the informal economy among the immigrant (Camacho et al. 2017), refugee (Oka 2011) and depraved women (Kabeer 2014) communities, although there are additional socially vulnerable groups within society which may display informal economy levels significantly above the country average. One of them is youth, which is characterized by the highest unemployment levels among European Union (EU) employees (Maguire et al. 2013; Liotti 2020), high social insecurity (Melrose 2012; Banks 2016), perceived social injustice (Carlo et al. 2022), etc. Keeping in mind the aforementioned scientific evidence, we presume that the level of the youth informal economy may differ from the level of the overall informal economy in the country, and could display a different nature or causal factors compared to the overall informal economy within the state. This paper aims to reveal the real extent of the youth informal economy, and compare its development with the development of the overall informal economy within the country.
In our investigation the definition of the informal economy proposed by Putniņš and Sauka (2015): informal economy consists of the labour and income which are legal by nature, although were not officially declared for various reasons. Thus, it excludes the activities which are illegal in general, such as drug dealing, smuggling, etc. We have selected Lithuania as a basis for our research due to the possibility to acquire primary data required for the calibration procedure of the MIMIC model. Another reason for a such selection is that youth socioeconomic problems in Central and Eastern Europe (CEE) remained in a relative scientific shadow until now (Bugajski 2020), and additional research on the development of the youth informal economy in one of the CEE countries may help to fulfill this scientific vacuum.
The paper is structured as follows. A theoretical section provides a brief literature review on possible causes and indicators of the youth informal economy. The methodological section introduces the two distinct approaches used for the measurement of the youth informal economy. The results and discussion section presents the main results and juxtaposes them with existing theoretical streams. The conclusions section generalizes the research, acknowledges limitations of the study, and introduces possible future research directions.
2. Literature Review and Hypothesis Setting
There is an extensive debate about the pros (Dube et al. 2007; Lemos 2009; Belman and Wolfson 2014; Bossler and Schenck 2022) and cons (Neumark et al. 2004; Whiting et al. 2019; Manning 2021) of the Government set minimum wage. Lemos (2008) reveals that benefits of the increases in minimum wage experienced by low income workers significantly overcome the small drawbacks (in particular, only marginal increases in retail prices) it produces. Boeri (2012) argues that the minimum wage set by governments will always be lower compared to the minimum wage set by an agreement among labour unions. Harasztosi and Lindner (2019) argue that costs of increased minimum wage are largely bared by the consumers. Meer and West (2016) prove that an increase in wage floors negatively mirrors in an employment situation, although this effect manifests not immediately, but after a significant time lag. Caliendo et al. (2019) report that after the introduction of a minimum wage, employers started to declare less hours worked. This finding allows one to presume that some underreported work hours were conducted in the informal economy. Neumark and Shirley (2022) found that an increase in the minimum wage negatively affects youth and low-skilled workers’ employment situation the most. Keeping in mind the aforementioned scientific evidence, we formulated our first hypothesis (cause 1):
Hypothesis 1 (H1).
Increases in minimum monthly salary within the country increases youth informal economy.
The impact of the increased average salary on the informal economic activities is ambiguous. One of the prevailing scientific streams argues that an increase in the average salary/income of a person decreases the shadow/informal economy (Williams and Schneider 2013; Galdino et al. 2018; Charmes 2020). This happens due to the fact that the more person earns, the less motivation he/she has to engage into informal economic activities, although contradicting evidence also persists (Neef 2018; Webb et al. 2020). It is assumed that not all companies are able to retain their competitive advantage after an increase in labour price (Liu et al. 2021). Striving to remain in the market, these companies engage into some informal economy activities, such as underreported working hours (Franic 2020), envelope wages (Di Nola et al. 2019; Franic and Cichocki 2021), unaccounted income (Putniņš and Sauka 2015), etc. Sometimes employees are forced to accept informal contracts/partially declared working hours in order to preserve their jobs (Horodnic and Williams 2021). Low-skilled/inexperienced employees are among the first to experience pressure from the employer to accept disadvantageous contract terms due to weak bargaining power (Moon 2018). As young employees are typically less qualified compared to their older counterparts, we presume, that aforementioned factors may also affect the youth informal economy. This leads to our second hypothesis (cause 2):
Hypothesis 2 (H2).
Increases in average wage in the country increases youth informal economy.
The tax burden is widely seen as one of the main drivers of the informal economy around the world (Schneider and Enste 2013; Williams 2017; Němec et al. 2021; Remeikienė et al. 2022). It manifests its influence both to the overall economy (Medina et al. 2017) and to the particular economic sectors investigated (Chancellor and Abbott 2015; Kelmanson et al. 2019; Schneider et al. 2022). Due to such a focal position of the tax burden in the formation of the informal economy (Altındağ et al. 2020), we presume it will also affect the development of the youth informal economy. Thus, we formulate our third hypothesis (cause 3):
Hypothesis 3 (H3).
Increase in tax burden within the country increases youth informal economy.
There is extensive literature about the relationship between trust in the government and citizens’ economic behavior (Tonkiss 2009; Nunkoo and Smith 2013; Morkūnas 2022). Trust in the government/public institutions also affects undeclared economic activities (D’Hernoncourt and Méon 2012; Teobaldelli and Schneider 2013; Arsić et al. 2015; Popescu et al. 2018; Ginevicius et al. 2020). Although the scientific evidence for the youth socio-economic behavior suggests that the aforementioned trust in the government—informal economy relationship might not be impregnable. Kitanova (2020) reports, that while increasing, youth political participation in the EU is still significantly lower compared to the older persons’ political activism. Esau et al. (2019) show that youth display significantly lower trust in government compared to their parents. Youth economic behavior is determined more by intrinsic motivation than by social norms (Browman et al. 2019). These scientific findings motivated us to test our fourth hypothesis (cause 4):
Hypothesis 4 (H4).
The increase in trust in Government within the country decreases youth informal.
Common Agricultural Policy (CAP) has constantly consumed the biggest part of the EU budget since its creation (Matthews 2018). Although highly criticized for the ambiguity of its objectives (Heinemann and Weiss 2018; Bachtler and Mendez 2020), CAP is also acknowledged for maintaining rural sustainability (Volkov et al. 2019; Balezentis et al. 2020). One of the main functions of the CAP in the assurance of rural sustainability is the provision of decent jobs in the EU periphery (Žičkienė et al. 2022). Karamessini et al. (2019) show that the highest job insecurity among youth in the EU is observed in its rural regions. This forces internal migration of youth (Salamońska and Czeranowska 2019) and encourages informal economy activities (Ilieva-Trichkova and Boyadjieva 2020). Synthesizing the aforeementioned scientific evidence, we presume that more intensive financial support for the development of rural regions should positively affect the youth informal economy. This allowed us to formulate our fifth hypothesis (cause 5):
Hypothesis 5 (H5).
Increases in funding for the regional development decreases youth informal economy.
The relationship between corruption and informal (Smith and Thomas 2015; Ouédraogo 2017; Baklouti and Boujelbene 2020; Elbahnasawy 2021) as well as shadow (Dreher and Schneider 2010; Borlea et al. 2017; Dell’Anno and Teobaldelli 2015; Chen et al. 2018) economies is very well discussed. Although these studies were made using aggregate country/county level data, and did not take into account the age factor as a possible moderating variable of the development of the informal economy. It might be considered as an overlooked but important determinant of the youth informal economy, as it is prove that youth and older adults differ significantly r in their economic behavior (Kautonen et al. 2015; Loichinger et al. 2017). In order to test if the level of corruption influences the level of youth informal economy, we formulated our sixth hypothesis (cause 6):
Hypothesis 6 (H6).
The higher is the level of corruption within the country, the higher is the level of the youth informal economy.
Dell’Anno and Davidescu (2019) suggest that one of the most reliable indicators in measuring informal economy is labour participation rate. The higher the undeclared economic activities, the lower the labour participation rate. This can be explained by the simple fact that all labour force consists of formal and informal employment. It is obvious that if some of the formal labour force migrates to the informal sector, the level of the official labour force decreases (Chen et al. 2020). Williams (2015) support these arguments for developed nations, and offer to use this indicator in a quantitative research (Williams et al. 2015). Based on the above-mentioned, we formulated our seventh hypothesis (indicator 1):
Hypothesis 7 (H7).
An increase in the level of youth informal economy decreases the youth labour participation rate.
Berdiev and Saunoris (2019) report that the informal economy is one of the main drivers of income inequality. It can be easily explained: it is an obvious fact that persons involved in informal economic activities are not officially declaring at least a part of their income. The more person is engaged in informal economic activities, the higher is discrepancy between his/her official and real income (Huynh and Nguyen 2020b). If the informal economy involves a significant share of a population, it starts to be reflected in an increasing official income inequality within the country (Chen et al. 2020). We believe this is also true with the youth, so we formulated our last hypothesis (Indicator 2):
Hypothesis 8 (H8).
An increase in youth informal economy level increases income inequality.
The relationship between researched hypotheses and its predicted theoretical signs are presented in a Figure 1 below:
3. Materials and Data
In our research, we combined two of the most frequently used techniques for the estimation of the informal economy: MIMIC and a direct survey method.
3.1. MIMIC
We employed a MIMIC (Multiple indicators, multiple causes) approach as a main research tool. It is a widely accepted research technique for the estimation of the informal economy (Dell’Anno and Adu 2020; Fredström et al. 2021; Schneider et al. 2022).
MIMIC models are of the type of structural equation models developed for confirmation of the impact of a set of exogenous causal variables on the latent variable, and the effect of the latent variable on observed indicator variables as well. Basically, the MIMIC technique investigates the interface between the latent variable and observable variables. For the sake of the simplicity, it could be stated that MIMIC model employs latent variable, determinants (causes), and indicators. Typically, the MIMIC approach consists of two general equations:
where the youth informal economy (YIE) is the unobservable latent variable, y′ = (y1, …, yp) is a vector of indicators reflecting the size of the informal economy, x′ = (x1, …, xq) is a vector of causes of the informal economy, λ and γ are the (p × 1) and (q × 1) vectors of parameters, and ε and υ are the (p × 1) and scalar errors.
y = λYIE + ε;
YIE = γ′x + υ,
Generally, the first equation relates the researched youth informal economy to its observable indicators, while the second one associates the informal economy with observable causes. For the data and errors, normally distributed and showing significant correlation with var(υ) = συ2 and cov(ε) = Θε, the general equations can be rewritten to create the following equation:
where π = λγ′, μ = λυ + ε and cov(μ) = λλ′σ2υ + Θε.
y = πx + μ
Since y and x are scalar vectors, the obtained equation can be solved by a maximum likelihood approach using the restrictions implied in both the coefficient matrix π and the covariance matrix of the errors μ.
A JASP (University of Amsterdam, Amsterdam, The Netherlands) software was used for the MIMIC estimations.
Regarding the model proposed in the current paper, the latent variable is Informal Economy, which is affected by the set of observed causes and has an impact on observed indicators as presented in a Figure 1.
For the minimum monthly salary, we used a Government set minimum net wage for full time (40 h per week) monthly work. For average salary, we took a mean net salary for each calendar year calculated on the 31 December of each year. For total tax burden, we took a sum of all direct taxes, indirect taxes, and social security contributions within the country for a given year. Trust in government was represented by the trust in government index, which is an approved measure for measuring citizens’ trust in their respective governments (Lee 2021). As it is available only from 2010, values for 2004–2009 were back extrapolated. Funding for regional development covers all direct payments and financial mechanisms for rural development under all three pillars of the CAP. Youth labour participation rate is a percentage of active employees under 30 years old. Such a limit was set because the Ministry for Labour and Social Security of Lithuania (2021) determines youth as persons between 16 and 29 years old. Corruption refers to a Transparency International Corruption perception index. In order to represent income inequality within the country, we referred to a Gini index.
3.2. Direct Survey
As MIMIC estimations provide only relative values in order to calculate the level of informal economy among the youth, so a calibration procedure is required (Schneider et al. 2022). As we could not obtain retrospective data about the level of the youth informal economy which could be used as a starting value for the calibration procedure, a direct survey of company managers was chosen as an alternative. The start year is 2020, as the survey was conducted in October—December 2021, and the managers were asked to think about the previous year when answering questions. This approach of acquiring primary data about the extent of informal economy was proposed by Putniņš and Sauka (2015) and is verified in the Baltic States. Its main strength compared to the traditional surveys lies in the fact that during this survey, respondents are asked not to report the amount of informal economy in their enterprise (avoiding the bias of self-reporting), but to think about the level of youth informal economy in the economic sector their company belongs to. We applied the same questionnaire form as Putniņš and Sauka (2015), so it can be said that our questionnaire is validated, thus suitable for this research. In total, we conducted 173 direct phone surveys with company managers who employ young employees. Surveys were conducted in 7 (Alytus, Panevėžys, Utena, Tauragė, Šiauliai, Marijampolė, Vilnius) out of 10 counties in Lithuania. Therefore, it can be said that our survey represents the whole picture of the country, as it covers not only the capital region (Vilnius) and major cities (Šiauliai and Panevėžys), but also rural counties such as Tauragė or Utena.
After the collection of a primary data, a three step procedure was undertaken to calculate the level of the youth informal economy in Lithuania in 2020 (Putniņš and Sauka 2015):
where: URer—underreported young employee remuneration comprised of underreported part or whole salary (URs) and underreported number of young employees (URemp).
URer = 1 − (1 − URs)(1 − URemp);
Later, the informal proportion (IP) of company’s income, consisting of underreported employee remuneration (URer) and underreported operating income (URoi), which was acquired during the interview.
where: PS—predicted salary of a young (≤29 y.o.) employee in 2020 in Lithuania.
IP = PS ∗ URer + (1 − PS)URoi;
As Statistics Lithuania does not provide information about the average salary of persons between 16 and 29 years old, we took a mean of the officially set minimum wage in Lithuania in 2020 (607 EUR) and an average salary for the quarter IV 2020 in Lithuania (1524.2 EUR). This is based on an assumption that young person entering the labour market typically earn significantly less than an average salary; (Peiró et al. 2010; Wu et al. 2021) found that before their thirties, employees increase their remuneration due to increased qualification and experience, and their salaries come closer to the country’s mean (Zaharee et al. 2018). So, in our case, PS is calculated as follows:
PS = (1524.2 + 607)/2
During the third step the relative share (IEy) of the informal economy among the youth is calculated:
The weights, wi, are the relative contribution of each firm to the youth informal economy, which is approximated by the relative amount of wages paid by the respective firm (Putniņš and Sauka 2015).
4. Results and Discussion
All our hypotheses were confirmed, and indicators and causal variables show the expected theoretical signs (Table 1).
Our estimations provided two models (6-1-2 and 5-1-2) of sufficient statistical reliability (p > 0.05; root mean square error of approximation (RMSEA) < 0.08; comparative fit index (CFI) > 0.9; standardized root mean squared error (SRMR) < 0.05). We decided to use both models in calculating the level of youth informal economy in Lithuania in 2004–2020. The levels obtained using each of the models were considered of an equal importance thus the final level of youth IE in Lithuanian is an arithmetic mean of the figures obtained by the model 6-1-2 and 5-1-2. The level of the youth informal economy during the researched period is provided in a Table 2 below:
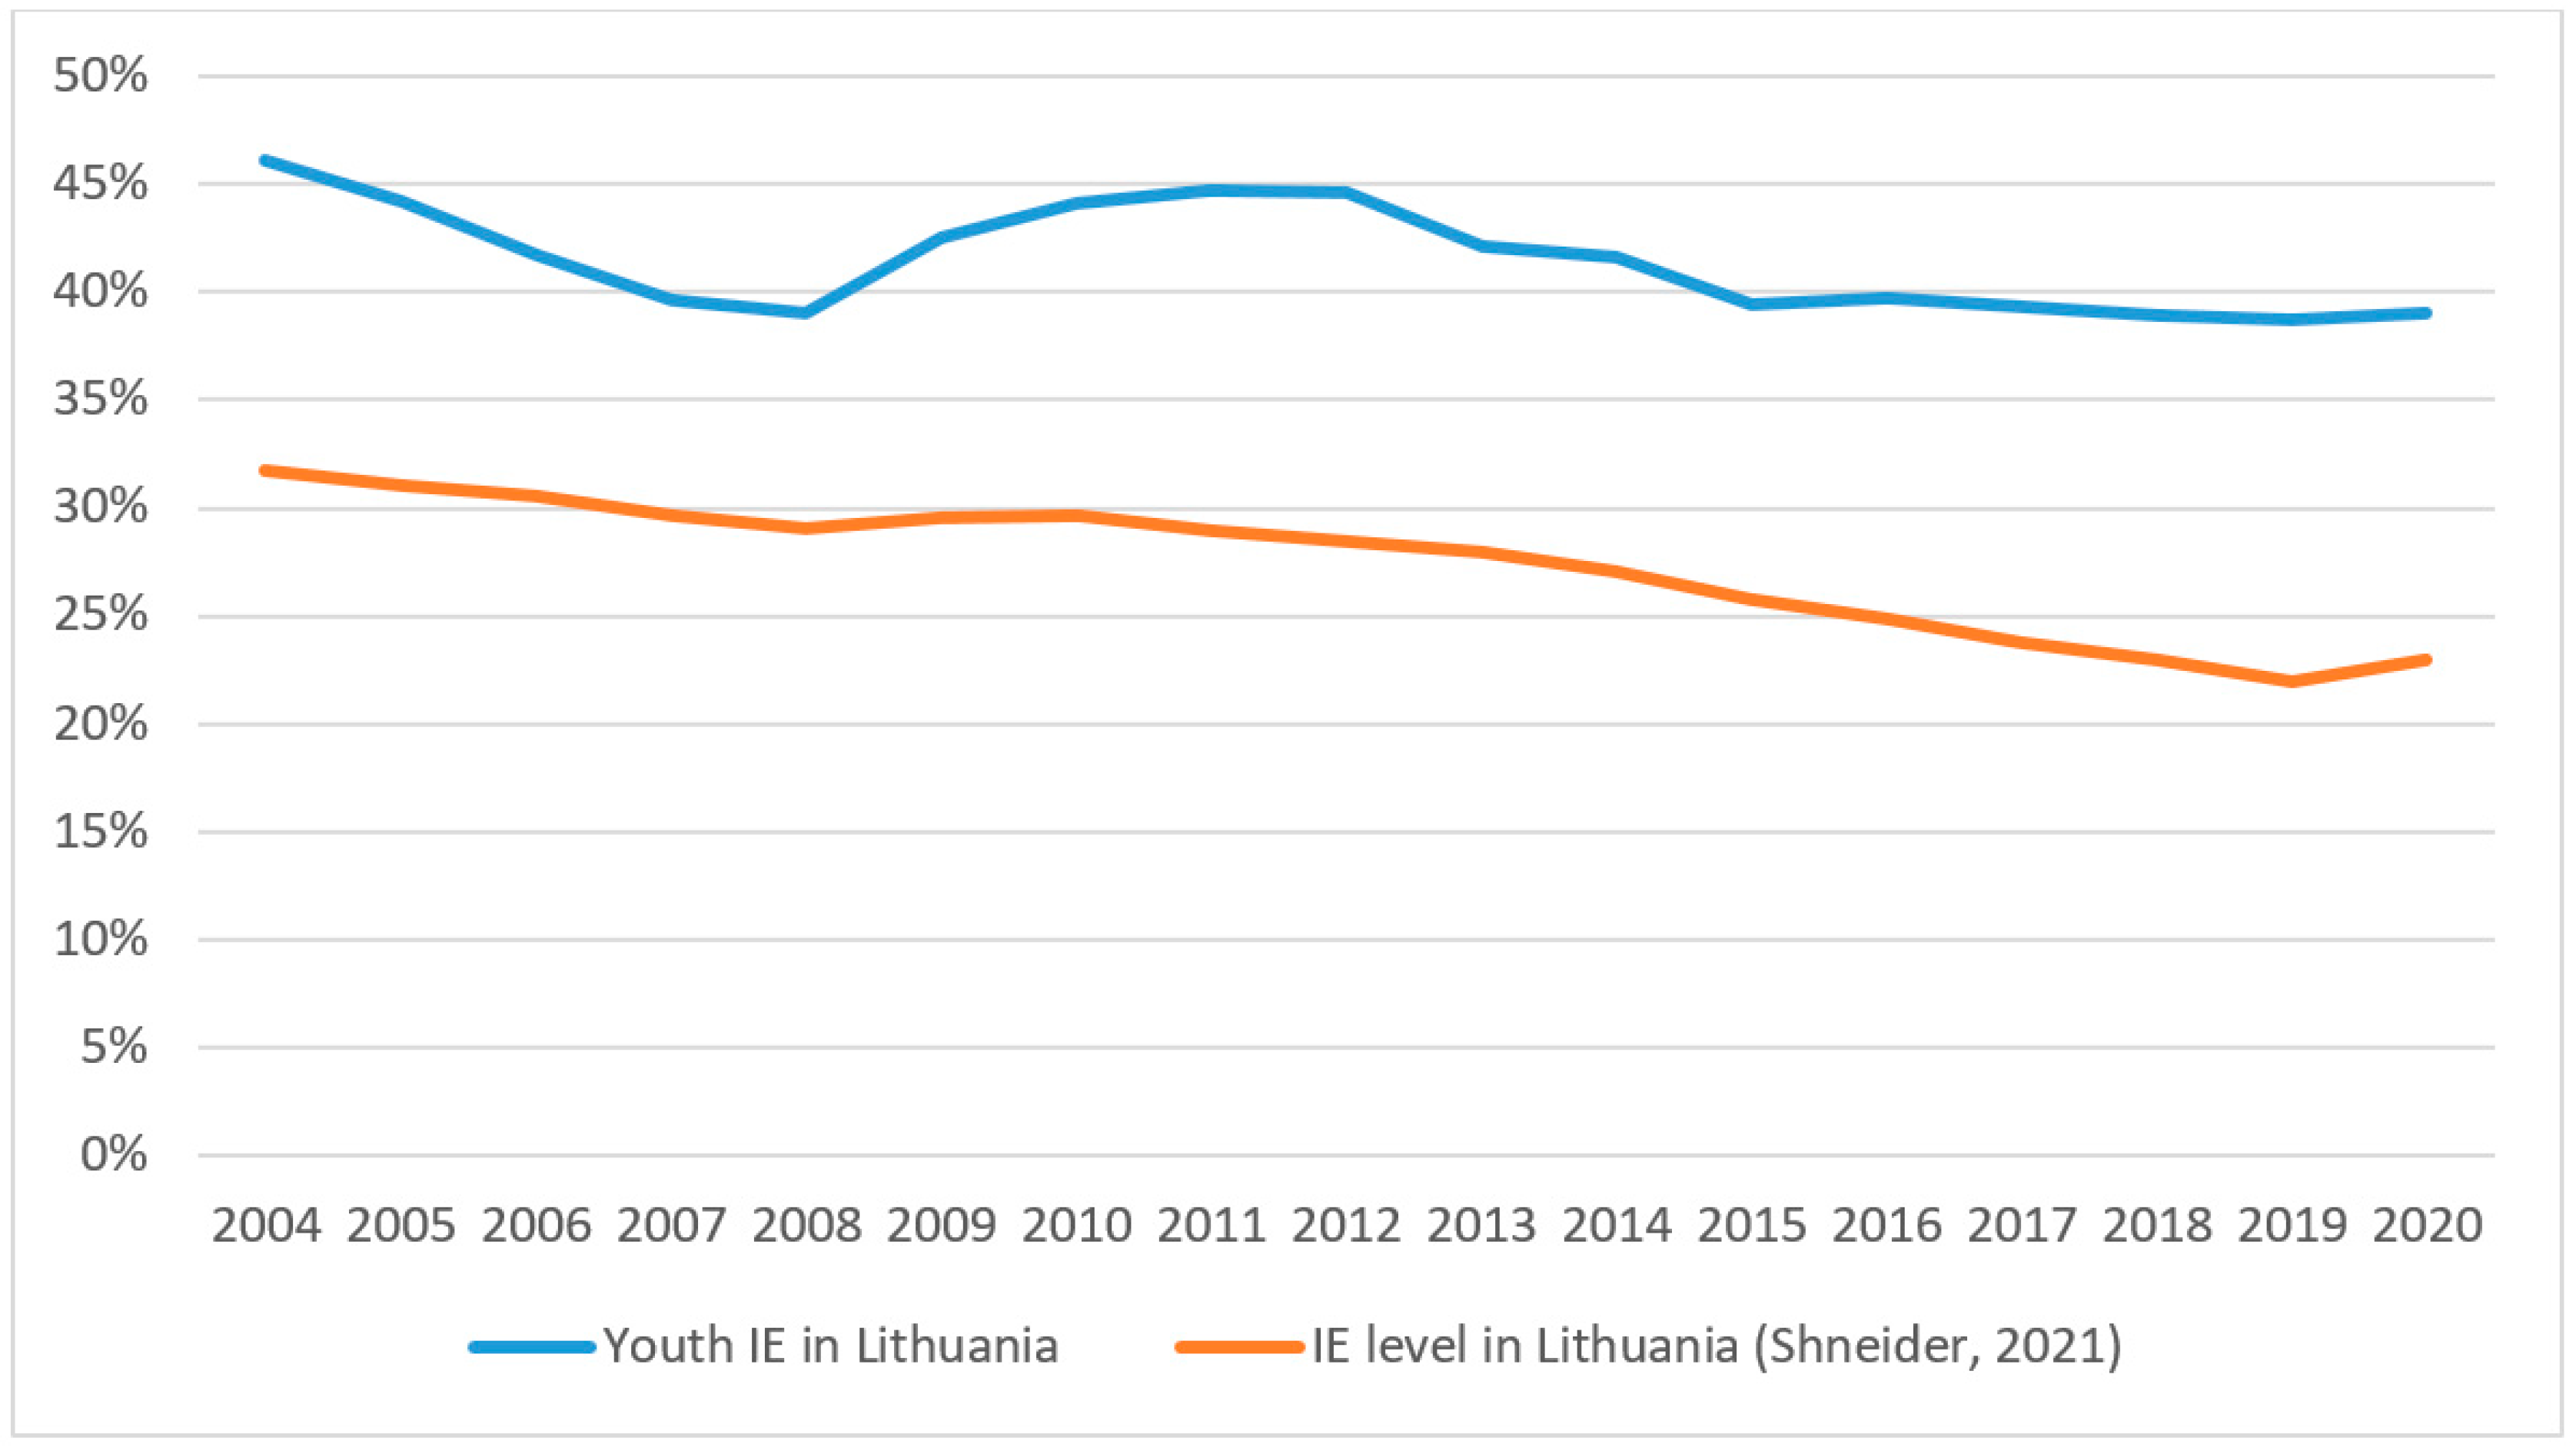
Our calculations show that during the research period, the level of the youth informal economy in Lithuania fluctuated between 38.7% and 46.1%, and shows a clear decreasing trend. This could be attributed to the followings: after the accession to the EU, Lithuania became eligible for the EU funding aimed at regional development and cohesion within the EU (Di Cataldo 2017). As our research shows, the funding for the regional development has a strong positive effect on the decreasing trend of the youth informal economy. Secondly, the tax morale in the New EU Member States has sufficiently improved after the accession to the EU (Horodnic 2018). Another significant factor is the increased trust in government which, in turn, is the direct result of the more efficient and transparent public institutions (Šiugždinienė et al. 2019), and decreased perception of the corruption within the country (Toleikienė et al. 2020). Broadly speaking, it can be said that as a youth informal economy is a part of the overall informal economy within the country, it should follow the same path as the overall informal economy in the country. To test if this is really true, we have checked if there is a correlation between the development of the youth informal economy in Lithuania in 2004–2020 and the development of the whole informal economy in Lithuania during the same period. The research revealed a strong, although not a very strong, positive convergence between the two. Such a result may be caused by the fact that bys being a part of the overall informal economy, the youth informal economy is being determined by slightly different factors than the overall informal economy within the country. These findings suggest that in order to tackle the youth informal economy, government measures must be tailored to better reflect the nature and uniqueness of the youth informal economy.
Analyzing Figure 2 shows that the youth informal economy is prone to higher fluctuations compared to the overall informal economy within the country. This trend manifested itself during the financial crisis (2008–2010) even more. It may be explained by the fact that younger persons have less bargaining power, as well as lower qualifications compared to their older counterparts in the labour market. Hence, if there is a competitive pressure for the employer and he/she chooses to get involved ininformal activities in order to remain in the market, the youth become the first to be pushed behind the informality threshold. It not only compromises their career path and social security benefits (pensions, sick leave payments, etc.), but also leave them in a significantly less secure position, as the informal contracts are honored remarkably more rarely compared to official ones. Since 2016, the development paths of the youth informal economy and the overall informal economy within the country started to diverge. The gap between the youth informal economy and the overall informal economy within the country reached 16.8 percent points in 2019. The average difference during the researched period is 14 percent points. The overall informal economy within the country continued to decrease since 2016, although the youth informal economy remained relatively stable, displaying only a minor tendency to decrease. This is an interesting finding, as from the 2016, the Lithuanian government is undertaking intensified actions towards tackling the informal economy within the country. This once again confirms a slightly different nature of the factors causing the informal economy within the whole country and among the youth. This example confirms that actions which are relatively successful in combating the informal economy within the whole country may not be suitable in some particular sectors of the economy. It echoes Pasovic and Efendic’s (2018) arguments about the impossibility to derive universal measures for tackling the informal economy in all sectors of the country’s economy.
5. Conclusions
We found that the youth informal economy in Lithuania have steadily decreased during the 2004–2020 period. The highest youth informal economy in Lithuania was in 2004, while the lowest was in 2019. The slight increase in 2020 can be attributed to the COVID-19 pandemic, which contributed to the increase in the informal economy in various countries (Elgin et al. 2022). Our research confirmed that informal economy among the youth is significantly higher compared to the overall economy, and it also increases remarkably more during various economic crises. This reflects the relatively insecure position of young employees in the labour market compared to their older counterparts. Such a situation may compromise government efforts aimed at achieving social cohesion, which is one of the main preconditions for the creation of a welfare state (Andreotti et al. 2012; Koehler 2021). The youth informal economy appeared to be more immune to government initiatives directed at tackling the overall informal economy within the state. This not only substantiates arguments about the differences in factors causing youth informal economy and the overall informal economy, but also echoes the opinion about the necessity to tailor measures created for combating informal economy to the characteristics of various sectors of the economy.
Although our MIMIC estimations derived statistically reliable and robust results, our newly created models for the investigation of the youth informal economy should be treated with some caution, as they were validated only in one country—Lithuania. To be considered universal, our 6-1-2 or 5-1-2 models should be verified by studying additional countries. Another limitation to our study lies in the approach to acquiring the starting values for the model calibration procedure. Even though scientifically validated (Putniņš and Sauka 2015), the method of measuring the informal economy using a survey technique sometimes receive critique (Wyżnikiewicz 2019; Lichard et al. 2021). Thus, our findings should be considered as a first step in studying the youth informal economy phenomenon, but in order to investigate it in detail and more exactly, a lot of work must be done.
Our findings benefit quite a broad range of various groups of interest. First of all, it is the state tax inspectorate. As we proved that the youth informal economy is significantly higher compared to the overall informal economy within the country, additional attention should be paid to the companies employing a high share of young persons or operating in an economic sector focused on the youth. It would help to better assure tax compliance within the country. The less secure position of the youth in the labour market and their susceptibility to possible unfair manifestations of employers’ bargaining power suggests the necessity of additional improvements in Lithuanian labour regulation and legislation aimed at improving the job security of the young employees. Although requiring additional verification, our findings about the importance of the funding for regional development on decreasing the youth informal economy within the country (presumably—in its rural regions) may also have a far reaching implications. It would not only strengthen arguments about the CAP role in ensuring social development of the EU rural regions (Volkov et al. 2019), but could also help to dispel doubts about CAP of being over-financed (Buckwell et al. 2019), as additional arguments about the CAP’s part in assuring social cohesion may be raised (Mikuš et al. 2019).
One of the prospective research directions in the youth informal economy could be associated with obtaining more accurate and indisputable starting values required for the calibration of the estimations obtained by the MIMIC structural equation modeling. Another promising research avenue could be the comprehensive and multifaceted investigation of the real antecedents of the differences in development paths of the youth informal economy and the overall informal economy within the state. These findings would be very helpful in deriving effective measures for tackling the youth informal economy, which appeared more resilient to the existing government actions aimed at the decreasing of the informal economy in Lithuania The age of a young person’s involvement in informal economy activities, place of residence, whether she/he unemployed for some period of time or not, and the duration of unemployment period may also contribute to a young person’s willingness to engage in informal economic activities. A more thorough investigation of these factors would also help to increase the knowledge of the youth informal economy phenomenon.
Funding
This research received no external funding.
Informed Consent Statement
Not applicable.
Conflicts of Interest
The authors declare no conflict of interest.
References
- Altındağ, Onur, Ozan Bakış, and Sandra Rozo. 2020. Blessing or burden? Impacts of refugees on businesses and the informal economy. Journal of Development Economics 146: 102490. [Google Scholar] [CrossRef]
- Andreotti, Alberta, Enzo Mingione, and Emanuele Polizzi. 2012. Local welfare systems: A challenge for social cohesion. Urban Studies 49: 1925–40. [Google Scholar] [CrossRef]
- Arsić, Milojko, Mihail Arandarenko, Branko Radulović, Sasa Ranđelović, and Irena Janković. 2015. Causes of the shadow economy. In Formalizing the Shadow Economy in Serbia. Cham: Springer, pp. 21–46. [Google Scholar]
- Bachtler, John, and Carlos Mendez. 2020. Cohesion and the EU budget: Is conditionality undermining solidarity. In Governance and Politics in the Post-Crisis European Union. Cambridge: CUP, pp. 121–40. [Google Scholar]
- Baklouti, Nedra, and Younes Boujelbene. 2020. Shadow economy, corruption, and economic growth: An empirical analysis. The Review of Black Political Economy 47: 276–94. [Google Scholar] [CrossRef]
- Balezentis, Tomas, Erika Ribasauskiene, Mangirdas Morkunas, Artiom Volkov, Dalia Streimikiene, and Pierluigi Toma. 2020. Young farmers’ support under the Common Agricultural Policy and sustainability of rural regions: Evidence from Lithuania. Land Use Policy 94: 104542. [Google Scholar] [CrossRef]
- Banks, Nicola. 2016. Youth poverty, employment and livelihoods: Social and economic implications of living with insecurity in Arusha, Tanzania. Environment and Urbanization 28: 437–54. [Google Scholar] [CrossRef] [Green Version]
- Belman, Dale, and Paul Wolfson. 2014. What Does the Minimum Wage Do? Kalamazoo: WE Upjohn Institute. [Google Scholar]
- Berdiev, Aziz, and James Saunoris. 2019. On the relationship between income inequality and the shadow economy. Eastern Economic Journal 45: 224–49. [Google Scholar] [CrossRef]
- Boeri, Tito. 2012. Setting the minimum wage. Labour Economics 19: 281–90. [Google Scholar] [CrossRef]
- Borlea, Sorin Nicolae, Monica Violeta Achim, and Monica Gabriela Miron. 2017. Corruption, shadow economy and economic growth: An empirical survey across the European Union countries. Studia Universitatis Vasile Goldiș Arad, Seria Științe Economice 27: 19–32. [Google Scholar] [CrossRef] [Green Version]
- Bossler, Mario, and Thorsten Schenck. 2022. Wage Inequality in Germany after the Minimum Wage Introduction. Journal of Labor Economics. [Google Scholar] [CrossRef]
- Browman, Alexander, Mesmin Destin, Melissa Kearney, and Phillip Levine. 2019. How economic inequality shapes mobility expectations and behaviour in disadvantaged youth. Nature Human Behaviour 3: 214–20. [Google Scholar] [CrossRef]
- Buckwell, Allan, David Harvey, Kenneth Thomson, and Kevin Parton. 2019. The Costs of the Common Agricultural Policy. New York: Routledge, vol. 7. [Google Scholar]
- Bugajski, Janusz. 2020. Political Parties of Eastern Europe: A Guide to Politics in the Post-Communist Era. New York: Routledge. [Google Scholar]
- Caliendo, Marco, Linda Wittbrodt, and Carsten Schröder. 2019. The causal effects of the minimum wage introduction in Germany—An overview. German Economic Review 20: 257–92. [Google Scholar] [CrossRef] [Green Version]
- Camacho, Carmen, Fabio Mariani, and Luca Pensieroso. 2017. Illegal immigration and the shadow economy. International Tax and Public Finance 24: 1050–80. [Google Scholar] [CrossRef] [Green Version]
- Carlo, Gustavo, Alexandra Davis, and Laura Taylor. 2022. Reducing Youth In-Group Favoritism to Address Social Injustice. Policy Insights from the Behavioral and Brain Sciences 9: 90–95. [Google Scholar] [CrossRef]
- Chancellor, Will, and Malcolm Abbott. 2015. The Australian construction industry: Is the shadow economy distorting productivity? Construction Management and Economics 33: 176–86. [Google Scholar] [CrossRef]
- Charmes, Jaques. 2020. The success story of a loose but useful concept: Origins, development, magnitude and trends of the informal economy. In Research Handbook on Development and the Informal Economy. Cheltenham: Edward Elgar Publishing. [Google Scholar]
- Chen, Hailin, Friedrich Schneider, and Quinly Sun. 2020. Measuring the size of the shadow economy in 30 provinces of China over 1995–2016: The MIMIC approach. Pacific Economic Review 25: 427–53. [Google Scholar] [CrossRef]
- Chen, Heyin, Yu Hao, Jingwei Li, and Xiaojie Song. 2018. The impact of environmental regulation, shadow economy, and corruption on environmental quality: Theory and empirical evidence from China. Journal of Cleaner production 195: 200–14. [Google Scholar] [CrossRef]
- Choi, Jay Pil, and Marcel Thum. 2005. Corruption and the shadow economy. International Economic Review 46: 817–36. [Google Scholar] [CrossRef] [Green Version]
- D’Hernoncourt, Johanna, and Pierre-Guillaume Méon. 2012. The not so dark side of trust: Does trust increase the size of the shadow economy? Journal of Economic Behavior & Organization 81: 97–121. [Google Scholar]
- Dell’Anno, Roberto, and Adriana Ana Maria Davidescu. 2019. Estimating shadow economy and tax evasion in Romania. A comparison by different estimation approaches. Economic Analysis and Policy 63: 130–49. [Google Scholar] [CrossRef]
- Dell’Anno, Roberto, and Desiree Teobaldelli. 2015. Keeping both corruption and the shadow economy in check: The role of decentralization. International Tax and Public Finance 22: 1–40. [Google Scholar] [CrossRef] [Green Version]
- Dell’Anno, Roberto, and Omobola Adu. 2020. The size of the informal economy in Nigeria: A structural equation approach. International Journal of Social Economics 47: 1063–78. [Google Scholar] [CrossRef]
- Di Cataldo, Marco. 2017. The impact of EU Objective 1 funds on regional development: Evidence from the UK and the prospect of Brexit. Journal of Regional Science 57: 814–39. [Google Scholar] [CrossRef]
- Di Nola, Alessandro, Georgi Kocharkov, and Aleksandar Vasilev. 2019. Envelope wages, hidden production and labor productivity. The BE Journal of Macroeconomics 19. [Google Scholar] [CrossRef]
- Dreher, Axel, and Friedrich Schneider. 2010. Corruption and the shadow economy: An empirical analysis. Public Choice 144: 215–38. [Google Scholar] [CrossRef] [Green Version]
- Dube, Arindraijit, Suresh Naidu, and Michael Reich. 2007. The economic effects of a citywide minimum wage. ILR Review 60: 522–43. [Google Scholar] [CrossRef] [Green Version]
- Eijdenberg, Emiel, and Kathreen Borner. 2017. The performance of subsistence entrepreneurs in Tanzania’s informal economy. Journal of Developmental Entrepreneurship 22: 1750007. [Google Scholar] [CrossRef]
- Elbahnasawy, Nasr. 2021. Can e-government limit the scope of the informal economy? World Development 139: 105341. [Google Scholar] [CrossRef]
- Elbahnasawy, Nasr, Michael Ellis, and Assande Desiree Adom. 2016. Political instability and the informal economy. World Development 85: 31–42. [Google Scholar] [CrossRef]
- Elgin, Ceyhun, Collin Williams, Gamze Oz-Yalaman, and Abdullan Yalaman. 2022. Fiscal stimulus packages to COVID-19: The role of informality. Journal of International Development 34: 861–79. [Google Scholar] [CrossRef]
- Esau, Michelle Vera, Carol Hilary Rondganger, and Nicolette Vanessa Roman. 2019. Family political socialisation and its effect on youth trust in government: A South African perspective. Politikon 46: 122–37. [Google Scholar] [CrossRef]
- Franic, Josip. 2020. Dissecting the illicit practice of wage underreporting: Some evidence from Croatia. Economic Research-Ekonomska Istraživanja 33: 957–73. [Google Scholar] [CrossRef]
- Franic, Josip, and Stanislaw Cichocki. 2021. Envelope wages as a new normal? An insight into a pool of prospective quasi-formal workers in the European Union (EU). Employee Relations: The International Journal. [Google Scholar] [CrossRef]
- Fredström, Ashkarn, Juhana Peltonen, and Joakim Wincent. 2021. A country-level institutional perspective on entrepreneurship productivity: The effects of informal economy and regulation. Journal of Business Venturing 36: 106002. [Google Scholar] [CrossRef]
- Galdino, Katia, Moses Kiggundu, Carla Jones, and Sangbun Ro. 2018. The informal economy in pan-Africa: Review of the literature, themes, questions, and directions for management research. Africa Journal of Management 4: 225–58. [Google Scholar] [CrossRef]
- Ginevicius, Romualdas, Tomas Kliestik, Andrius Stasiukynas, and Karel Suhajda. 2020. The impact of national economic development on the shadow economy. Journal of Competitiveness 12: 39. [Google Scholar] [CrossRef]
- Harasztosi, Peter, and Atilla Lindner. 2019. Who Pays for the minimum Wage? American Economic Review 109: 2693–727. [Google Scholar] [CrossRef] [Green Version]
- Hart, Keith. 1985. The Informal Economy. Cambridge: Cambridge Anthropology, pp. 54–58. [Google Scholar]
- Heinemann, Friedrich, and Stefani Weiss. 2018. The EU Budget and Common Agricultural Policy beyond 2020: Seven More Years of Money for Nothing? (No. 17). EconPol Working Paper. Munich: IFO Institute—Leibniz Institute for Economic Research at the University of Munich. [Google Scholar]
- Hoinaru, Razvan, Daniel Buda, Sorin Nicolae Borlea, Viorela Ligia Văidean, and Monica Violeta Achim. 2020. The impact of corruption and shadow economy on the economic and sustainable development. Do they “sand the wheels” or “grease the wheels”? Sustainability 12: 481. [Google Scholar] [CrossRef] [Green Version]
- Horodnic, Ioanna Alexandra, and Collin Williams. 2021. Cash Wage Payments in Transition Economies: Consequences of Envelope Wages. Bonn: IZA World of Labor. [Google Scholar]
- Horodnic, Ioanna Alexandra. 2018. Tax morale and institutional theory: A systematic review. International Journal of Sociology and Social Policy 38: 868–86. [Google Scholar] [CrossRef] [Green Version]
- Huynh, Cong Mingh, and Tan Loi Nguyen. 2020b. Shadow economy and income inequality: New empirical evidence from Asian developing countries. Journal of the Asia Pacific Economy 25: 175–92. [Google Scholar] [CrossRef]
- Ilieva-Trichkova, Petya, and Pepeka Boyadjieva. 2020. Young people’s agency over continuing education in situations of early job insecurity: From enabling to stumbling. Studies in Continuing Education 42: 279–97. [Google Scholar] [CrossRef]
- Kabeer, Naila. 2014. Gender and Social Protection Strategies in the Informal Economy. New York: Routledge India. [Google Scholar]
- Karamessini, Maria, Maria Symeonaki, Glykeria Stamatopoulou, and Dimitris Parsanoglou. 2019. Factors explaining youth unemployment and early job insecurity in Europe. In Youth Unemployment and Job Insecurity in Europe. Cheltenham: Edward Elgar Publishing. [Google Scholar]
- Kautonen, Teemu, Isabella Hatak, Ewald Kibler, and Thomas Wainwright. 2015. Emergence of entrepreneurial behaviour: The role of age-based self-image. Journal of Economic Psychology 50: 41–51. [Google Scholar] [CrossRef]
- Kelmanson, Ben, Koralai Kirabaeva, Leandro Medina Borislava Mircheva, and Jason Weiss. 2019. Explaining the Shadow Economy in Europe: Size, Causes and Policy Options. Washington, DC: International Monetary Fund. [Google Scholar]
- Kitanova, Magdelina. 2020. Youth political participation in the EU: Evidence from a cross-national analysis. Journal of Youth Studies 23: 819–36. [Google Scholar] [CrossRef] [Green Version]
- Koehler, Gabriele. 2021. Effects of social protection on social inclusion, social cohesion and nation building. In Handbook on Social Protection Systems. Cheltenham: Edward Elgar Publishing, pp. 636–46. [Google Scholar]
- Lee, Yunsoo. 2021. Government for Leaving No One Behind: Social Equity in Public Administration and Trust in Government. Sage Open 11: 21582440211029227. [Google Scholar] [CrossRef]
- Lemos, Sara. 2008. A Survey of the Effects of the Minimum Wage on Prices. Journal of Economic Surveys 22: 187–212. [Google Scholar] [CrossRef] [Green Version]
- Lemos, Sara. 2009. Minimum wage effects in a developing country. Labour Economics 16: 224–37. [Google Scholar] [CrossRef] [Green Version]
- Lichard, Tomaš, Jan Hanousek, and Randall Filer. 2021. Hidden in plain sight: Using household data to measure the shadow economy. Empirical Economics 60: 1449–76. [Google Scholar] [CrossRef]
- Liotti, Giorgio. 2020. Labour market flexibility, economic crisis and youth unemployment in Italy. Structural Change and Economic Dynamics 54: 150–62. [Google Scholar] [CrossRef]
- Liu, Feng, Dev Dutta, and Kwangtae Park. 2021. From external knowledge to competitive advantage: Absorptive capacity, firm performance, and the mediating role of labour productivity. Technology Analysis & Strategic Management 33: 18–30. [Google Scholar]
- Loichinger, Elke, Bernhard Hammer, Alexia Prskawetz, Michael Freiberger, and Joze Sambt. 2017. Quantifying economic dependency. European Journal of Population 33: 351–80. [Google Scholar] [CrossRef]
- Maguire, Sue, Bart Cockx, Juan Dolado, Florentino Felgueroso, Marcel Jansen, Izabela Styczyńska, Elish Kelly, Seamus McGuinness, Werner Eichhorst, Holger Hinte, and et al. 2013. Youth unemployment. Intereconomics 48: 196–235. [Google Scholar] [CrossRef] [Green Version]
- Manning, Alan. 2021. The elusive employment effect of the minimum wage. Journal of Economic Perspectives 35: 3–26. [Google Scholar] [CrossRef]
- Matthews, Alan. 2018. The CAP in the 2021–27 MFF Negotiations. Intereconomics 53: 306–11. [Google Scholar] [CrossRef]
- McKeever, Mattew. 1998. Reproduced inequality: Participation and success in the South African informal economy. Social Forces 76: 1209–41. [Google Scholar] [CrossRef]
- Meagher, Kate. 2018. Taxing times: Taxation, divided societies and the informal economy in Northern Nigeria. The Journal of Development Studies 54: 1–17. [Google Scholar] [CrossRef] [Green Version]
- Medina, Leandro, Andrew Jonelis, and Mehmet Cangul. 2017. The Informal Economy in Sub-Saharan Africa: Size and Determinants. Washington, DC: International Monetary Fund. [Google Scholar]
- Meer, Jonathan, and Jeremy West. 2016. Effects of the minimum wage on employment dynamics. Journal of Human Resources 51: 500–22. [Google Scholar] [CrossRef]
- Melrose, Margaret. 2012. Young people, welfare reform and social insecurity. Youth and Policy 108: 1–19. [Google Scholar]
- Mikuš, Ornella, Marin Kukoč, and Mateja Jež Rogelj. 2019. The coherence of common policies of the EU in territorial cohesion: A never-ending discourse? A review. Agricultural Economics 65: 143–49. [Google Scholar] [CrossRef] [Green Version]
- Moon, Seongwuk. 2018. Skill development, bargaining power, and a theory of job design. Journal of Economics & Management Strategy 27: 270–96. [Google Scholar]
- Morkūnas, Mangirdas. 2022. Russian Disinformation in the Baltics: Does it Really Work? Public Integrity 2022: 1–15. [Google Scholar] [CrossRef]
- Neef, Rainer. 2018. Observations on the concept and forms of the informal economy in Eastern Europe. In The Social Impact of Informal Economies in Eastern Europe. New York: Routledge, pp. 1–27. [Google Scholar]
- Němec, Daniel, Eva Kotlánová, Igor Kotlán, and Zuzana Machová. 2021. Corruption, taxation and the impact on the shadow economy. Economies 9: 18. [Google Scholar] [CrossRef]
- Neumark, David, and Peter Shirley. 2022. Myth or measurement: What does the new minimum wage research say about minimum wages and job loss in the United States? Industrial Relations: A Journal of Economy and Society 61: 384–417. [Google Scholar] [CrossRef]
- Neumark, David, Mark Schweitzer, and William Wascher. 2004. Minimum wage effects throughout the wage distribution. Journal of Human Resources 39: 425–50. [Google Scholar] [CrossRef]
- Nunkoo, Robin, and Stephen Smith. 2013. Political economy of tourism: Trust in government actors, political support, and their determinants. Tourism management 36: 120–32. [Google Scholar] [CrossRef]
- Oka, Rahul. 2011. Unlikely cities in the desert: The informal economy as causal agent for permanent” Urban” sustainability in Kakuma Refugee Camp, Kenya. Urban Anthropology and Studies of Cultural Systems and World Economic Development 2011: 223–62. [Google Scholar]
- Ouédraogo, Idrissa. 2017. Governance, corruption, and the informal economy. Modern Economy 8: 256. [Google Scholar] [CrossRef]
- Pasovic, Edin, and Adnan Efendic. 2018. Informal economy in Bosnia and Herzegovina-an empirical investigation. The South East European Journal of Economics and Business 13: 112–25. [Google Scholar] [CrossRef] [Green Version]
- Peiró, Jose, Sonia Agut, and Rosa Grau. 2010. The relationship between overeducation and job satisfaction among young Spanish workers: The role of salary, contract of employment, and work experience. Journal of Applied Social Psychology 40: 666–89. [Google Scholar] [CrossRef]
- Popescu, Gheorghe, Adriana Ana Maria Davidescu, and Catalin Huidumac. 2018. Researching the main causes of the Romanian shadow economy at the micro and macro levels: Implications for sustainable development. Sustainability 10: 3518. [Google Scholar] [CrossRef] [Green Version]
- Putniņš, Talis, and Arnis Sauka. 2015. Measuring the shadow economy using company managers. Journal of Comparative Economics 43: 471–90. [Google Scholar] [CrossRef]
- Remeikienė, Rita, Ligita Gasparėnienė, Yilmaz Bayar, Romualdas Ginevičius, and Ieva Marija Ragaišytė. 2022. ICT development and shadow economy: Empirical evidence from the EU transition economies. Economic Research-Ekonomska Istraživanja 35: 762–77. [Google Scholar] [CrossRef]
- Salamońska, Justyna, and Olga Czeranowska. 2019. Janus-faced mobilities: Motivations for migration among European youth in times of crisis. Journal of Youth Studies 22: 1167–83. [Google Scholar] [CrossRef]
- Sassen, Saskia. 1993. The informal economy: Between new developments and old regulations. Yale LJ 103: 2289. [Google Scholar] [CrossRef]
- Schneider, Friedrich. 2019. Restricting or abolishing cash: An effective instrument for eliminating the shadow economy, corruption and terrorism? SUERF Policy Note 90: 1–7. [Google Scholar]
- Schneider, Friedrich. 2021. Development of the Shadow Economy of 36 OECD Countries over 2003–21: Due to the Corona Pandemic a Strong Increase in 2020 and a Modest Decline in 2021. African Journal of Political Science 15: 005. [Google Scholar]
- Schneider, Friedrich, and Dominik Enste. 2013. The Shadow Economy: An International Survey. Cambridge: Cambridge University Press. [Google Scholar]
- Schneider, Friedrich, Mangirdas Morkunas, and Erika Quendler. 2022. An estimation of the informal economy in the agricultural sector in the EU-15 from 1996 to 2019. Agribusiness: An International Journal. [Google Scholar] [CrossRef]
- Šiugždinienė, Jurgita, Eglė Gaulė, and Rimantas Rauleckas. 2019. In search of smart public governance: The case of Lithuania. International Review of Administrative Sciences 85: 587–606. [Google Scholar] [CrossRef]
- Smith, Natalya, and Ekaterina Thomas. 2015. Determinants of Russia’s informal economy: The impact of corruption and multinational firms. Journal of East-West Business 21: 102–28. [Google Scholar] [CrossRef]
- Teobaldelli, Desiree, and Friedrich Schneider. 2013. The influence of direct democracy on the shadow economy. Public Choice 157: 543–67. [Google Scholar] [CrossRef] [Green Version]
- Toleikienė, Rita, Sigitas Balčiūnas, and Vita Juknevičienė. 2020. Youth Attitudes Towards Intolerance to Corruption in Lithuania. Scientific Papers of the University of Pardubice, Series D, Faculty of Economics & Administration 28: 109. [Google Scholar] [CrossRef]
- Tonkiss, Fran. 2009. Trust, confidence and economic crisis. Intereconomics 44: 196–202. [Google Scholar] [CrossRef] [Green Version]
- Volkov, Artiom, Tomas Balezentis, Mangirdas Morkunas, and Dalia Streimikiene. 2019. Who benefits from CAP? The way the direct payments system impacts socioeconomic sustainability of small farms. Sustainability 11: 2112. [Google Scholar] [CrossRef] [Green Version]
- Webb, Aleksandra, Ronald McQuaid, and Sigrid Rand. 2020. Employment in the informal economy: Implications of the COVID-19 pandemic. International Journal of Sociology and Social Policy 40: 1005–19. [Google Scholar] [CrossRef]
- Whiting, Mark, Grant Hugh, and Michael Bernstein. 2019. Fair work: Crowd work minimum wage with one line of code. Paper presented at the AAAI Conference on Human Computation and Crowdsourcing, Washington, DC, USA, October 28–30; vol. 7, pp. 197–206. [Google Scholar]
- Williams, Collin. 2015. Explaining the informal economy: An exploratory evaluation of competing perspectives. Relations Industrielles/Industrial Relations 70: 741–65. [Google Scholar] [CrossRef] [Green Version]
- Williams, Collin. 2017. Tackling employment in the informal economy: A critical evaluation of the neoliberal policy approach. Economic and Industrial Democracy 38: 145–69. [Google Scholar] [CrossRef]
- Williams, Collin, and Friedrich Schneider. 2013. The Shadow Economy. London: Institute of Economic Affairs. [Google Scholar]
- Williams, Collin, Ioanna Alexandra Horodnic, and Jan Windebank. 2015. Explaining participation in the informal economy: An institutional incongruence perspective. International Sociology 30: 294–313. [Google Scholar] [CrossRef] [Green Version]
- Wu, Xiaoyi, Lan Lin, and Jie Wang. 2021. When does breach not lead to violation? A dual perspective of psychological contract in hotels in times of crisis. International Journal of Hospitality Management 95: 102887. [Google Scholar] [CrossRef]
- Wyżnikiewicz, Bohdan. 2019. Do we measure shadow economy correctly? Wiadomości Statystyczne. The Polish Statistician 64: 63–73. [Google Scholar]
- Zaharee, Marcie, Tristan Lipkie, Stewart Mehlman, and Susan Neylon. 2018. Recruitment and Retention of Early-Career Technical Talent: What Young Employees Want from Employers A study of the workplace attributes that attract early-career workers suggests that Millennials may not be so different from earlier generations. Research-Technology Management 61: 51–61. [Google Scholar] [CrossRef]
- Žičkienė, Agnė, Rasa Melnikienė, Mangirdas Morkūnas, and Artiom Volkov. 2022. CAP Direct Payments and Economic Resilience of Agriculture: Impact Assessment. Sustainability 14: 10546. [Google Scholar] [CrossRef]
Figure 1.
The relationship among the researched hypotheses and youth informal economy.
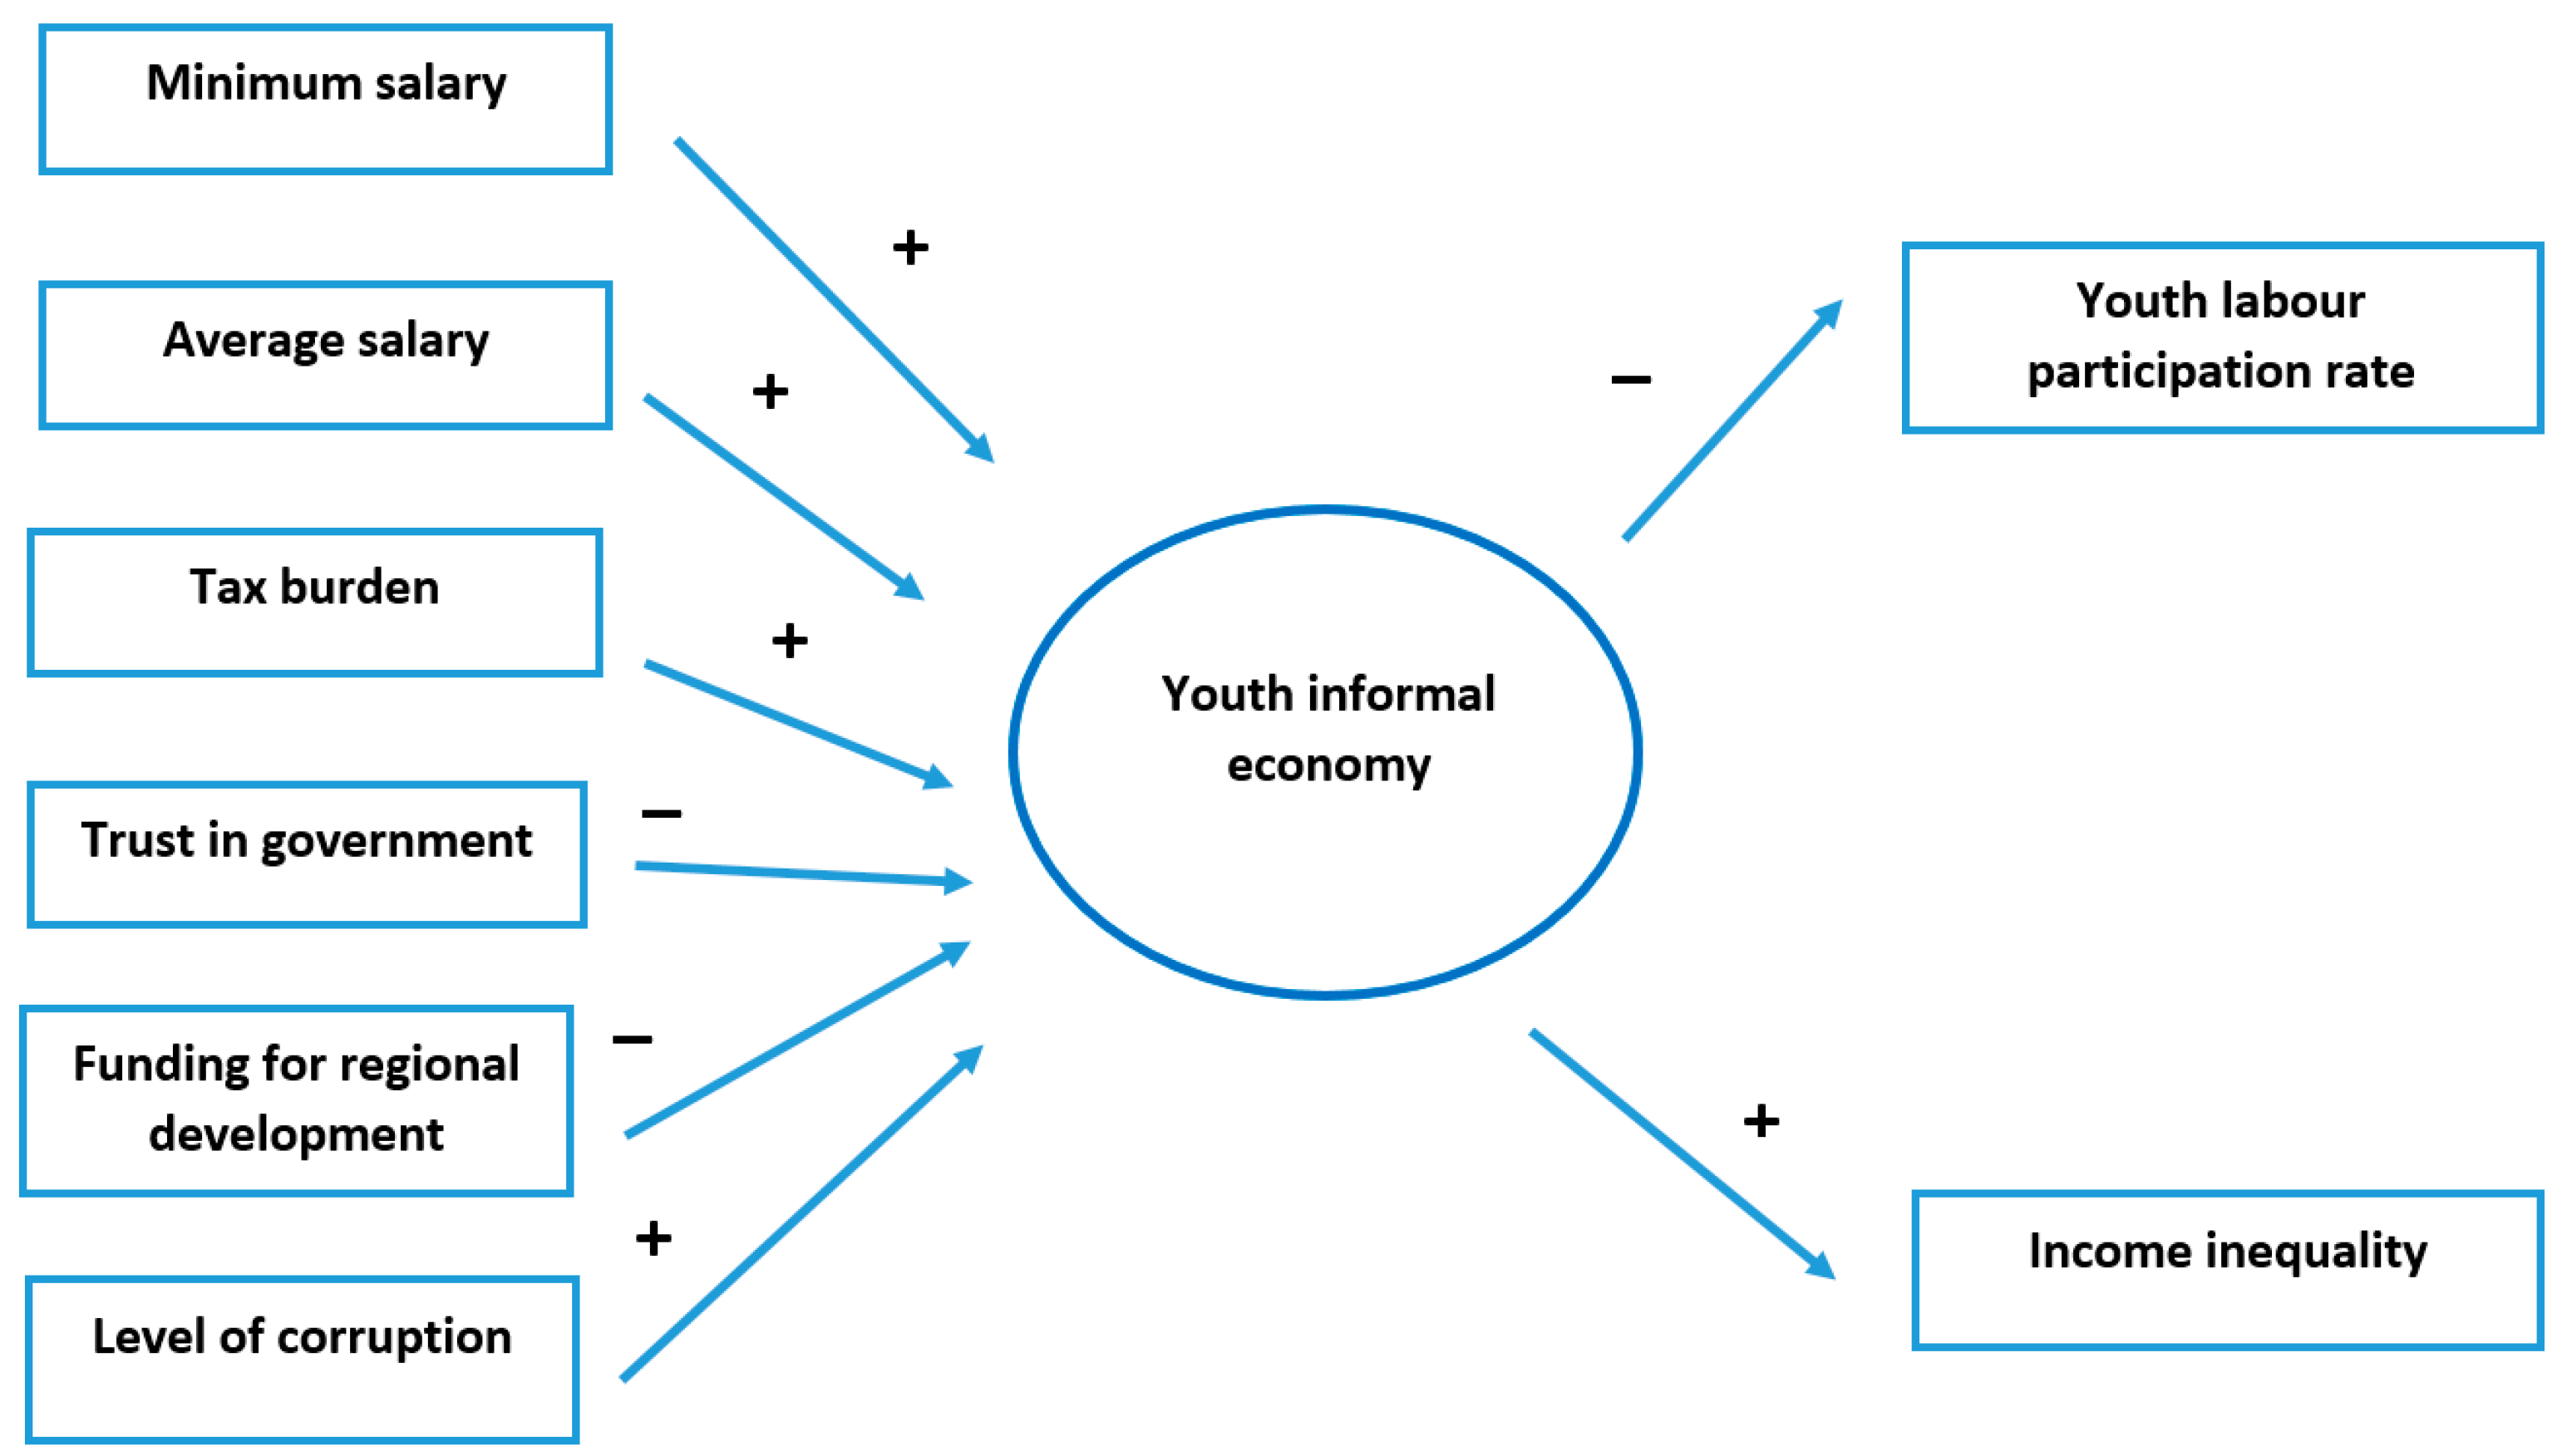
Figure 2.
The development of the informal economy in Lithuania in 2004–2020.

Table 1.
Results of MIMIC estimations.
| Model; Latent Variable—Youth Informal Economy | 6-1-2 | 5-1-2 |
|---|---|---|
| Causal variables | ||
| Minimum monthly salary in the country | 0.5024 *** | 0.5469 *** |
| Average wage in the country | 0.2589 *** | 0.2711 *** |
| Total tax burden in the country | 0.3012 *** | 0.2887 *** |
| Trust in Government | −0.0106 * | −0.012 ** |
| Funding for regional development | −0.0178 ** | −0.0211 ** |
| Level of Corruption | 0.4187 ** | |
| Indicator variables | ||
| Youth labour participation rate | −0.4338 *** | −0.4981 *** |
| Income inequality | 0.0573 ** | 0.0711 ** |
| Statistical tests | ||
| RMSEA | 0.059 | 0.037 |
| CFI | 0.914 | 0.963 |
| SRMR | 0.041 | 0.024 |
Significant at: *—0.05; **—0.01; ***—0.001.
Table 2.
The level of the youth informal economy in Lithuania in 2004–2020.
| Year | Average | Minimum Value | Maximum Value | 2004 | 2005 | 2006 | 2007 | 2008 | 2009 | 2010 | 2011 |
|---|---|---|---|---|---|---|---|---|---|---|---|
| Youth IE in Lithuania | 41.5% | 38.7% | 46.1% | 46.1% | 44.2% | 41.7% | 39.6% | 39.0% | 42.5% | 44.1% | 44.7% |
| IE level in Lithuania (Schneider 2021) | 27.4% | 21.9% | 31.7% | 31.7% | 31.1% | 30.6% | 29.7% | 29.1% | 29.6% | 29.7% | 29.0% |
| Year | 2012 | 2013 | 2014 | 2015 | 2016 | 2017 | 2018 | 2019 | 2020 | Correlation | |
| Youth IE in Lithuania | 44.6% | 42.1% | 41.6% | 39.4% | 39.7% | 39.3% | 38.9% | 38.7% | 39.0% | 0.742 | |
| IE level in Lithuania (Schneider 2021) | 28.5% | 28.0% | 27.1% | 25.8% | 24.9% | 23.8% | 23.0% | 21.9% | 23.0% | ||
Publisher’s Note: MDPI stays neutral with regard to jurisdictional claims in published maps and institutional affiliations. |
© 2022 by the author. Licensee MDPI, Basel, Switzerland. This article is an open access article distributed under the terms and conditions of the Creative Commons Attribution (CC BY) license (https://creativecommons.org/licenses/by/4.0/).
Share and Cite
MDPI and ACS Style
Morkunas, M. Measuring the Level of the Youth Informal Economy in Lithuania in 2004–2020. Economies 2022, 10, 275. https://doi.org/10.3390/economies10110275
AMA Style
Morkunas M. Measuring the Level of the Youth Informal Economy in Lithuania in 2004–2020. Economies. 2022; 10(11):275. https://doi.org/10.3390/economies10110275
Chicago/Turabian StyleMorkunas, Mangirdas. 2022. "Measuring the Level of the Youth Informal Economy in Lithuania in 2004–2020" Economies 10, no. 11: 275. https://doi.org/10.3390/economies10110275
Note that from the first issue of 2016, this journal uses article numbers instead of page numbers. See further details here.