Article

Development of Quality Digital Innovation by Optimally Utilizing Company Resources to Increase Competitive Advantage and Business Performance

Management Department, Faculty of Economic and Business, Brawijaya University, Malang 65145, Indonesia
*
Author to whom correspondence should be addressed.
Adm. Sci. 2022, 12(4), 157; https://doi.org/10.3390/admsci12040157
Submission received: 26 September 2022 / Revised: 20 October 2022 / Accepted: 1 November 2022 / Published: 5 November 2022

Abstract

:
Purpose: This study aims to find out how to increase the competitive advantage of a company through the development of digital innovation that utilizes company resources optimally to improve business performance. Namely, the aim is to examine the effect of company resources on digital innovation and business performance, and the effect of company resources on business performance through digital innovation. Methods: This study uses a quantitative research approach. Observations were made in a cross-section/one shot in 2022. The population of this study was the ISP industry in Indonesia, which amounted to 474 companies, and the unit of observation was the management. Samples were taken from 240 respondents. This study used structural equation modeling (SEM) to test the causality correlational relationship between constructs. Results: The hypothesis testing shows that company resources have a significant direct effect on business performance, and company resources have a significant indirect effect on business performance through digital innovation. The indirect effect of company resources on business performance through digital innovation is more dominant than the direct effect of company resources on business performance. Conclusions: Improving business performance and competitive advantage will be better achieved by optimizing the utilization of the company’s existing resources to develop digital innovation, compared to directly increasing the company’s resources to improve business performance.

1. Introduction

Based on research conducted by the Indonesian Internet Providers Association (APJII), Indonesia’s internet growth is nine times greater than the population growth, and this is inseparable from the main role of ISPs (internet service providers) in Indonesia, based on 474 APJII data providers. ISP in Indonesia. This hyper-competition situation, exacerbated by the COVID-19 pandemic, has caused a further decline in ISP income, especially ISPs who rely on the B2B business model, due to a decline in purchasing power. This is an interesting research problem to study because the business performance of ISP companies in Indonesia is not optimal when compared to the high growth of internet users.
This indicates problems in the business performance of ISP in Indonesia. According to Krause (2005) at Ghalem et al. (2016), performance refers to the level of achievement of goals or possible achievements that may be related to important characteristics of the organization for the relevant stakeholders.
The majority of ISPs in Indonesia are only able to provide basic internet connection services with relatively lagging technology and infrastructure compared to Global ISPs, only operate in one or two cities, and have difficulty developing their service coverage areas, and difficulty developing new products/services to meet customer demands and technological trends such as the IoT, network security, video, big data analytics, etc. This happens because of the limited resources owned in the form of human resources, financial resources, technological resources, and other resources. Companies are required to be able to utilize their resources as a comparative advantage to improve performance. RBV theory (Barney 1991) said companies must understand the relationship between resources, capabilities, competitive advantage, and profitability to maintain long-term competitiveness. According to Thompson et al. (2020), company resources consist of tangible resources and intangible resources.
Previous studies that examined the direct influence of company resources on business performance showed inconsistent results. Some studies showed significant results (Hafeez et al. 2012; Bagheri et al. 2013; Karami et al. 2015; Yen 2013), while other studies showed insignificant results (Hussain and Waheed 2019), as shown in Table 1. The inconsistency of the results of previous studies showing the influence of company resources on business performance is a research gap that is aimed to be filled in by this research.
This research was conducted to close the research gap by including digital innovation variables mediating the indirect relationship of company resources with business performance. This digital innovation mediation variable is obtained from empirical results and previous studies. The APJII has noted that, besides the problem of declining ISP revenues during the COVID-19 pandemic, they are also faced with the challenge of being able to meet customer demands for various products and services other than basic internet connectivity, such as the IoT, big data analytics, video, games, and others, the rapid change in digital technology. In this digital era and with limited company resources owned by ISPs, ISPs are required to be able to make appropriate digital innovations by utilizing existing resources to answer these challenges. Therefore, digital innovation is suspected as a mediation between company resources and business performance, which is expected to improve business performance. This assumption is strengthened by previous studies that show the mediating role of digital innovation on the relationship between company resources and business performance, namely, studies from: (Hafeez et al. 2012; Gurlek and Cemberci 2019; Yasa et al. 2019; Khin and Ho 2018).

2. Theoretical Framework, Hypothesis, and Research Model Framework

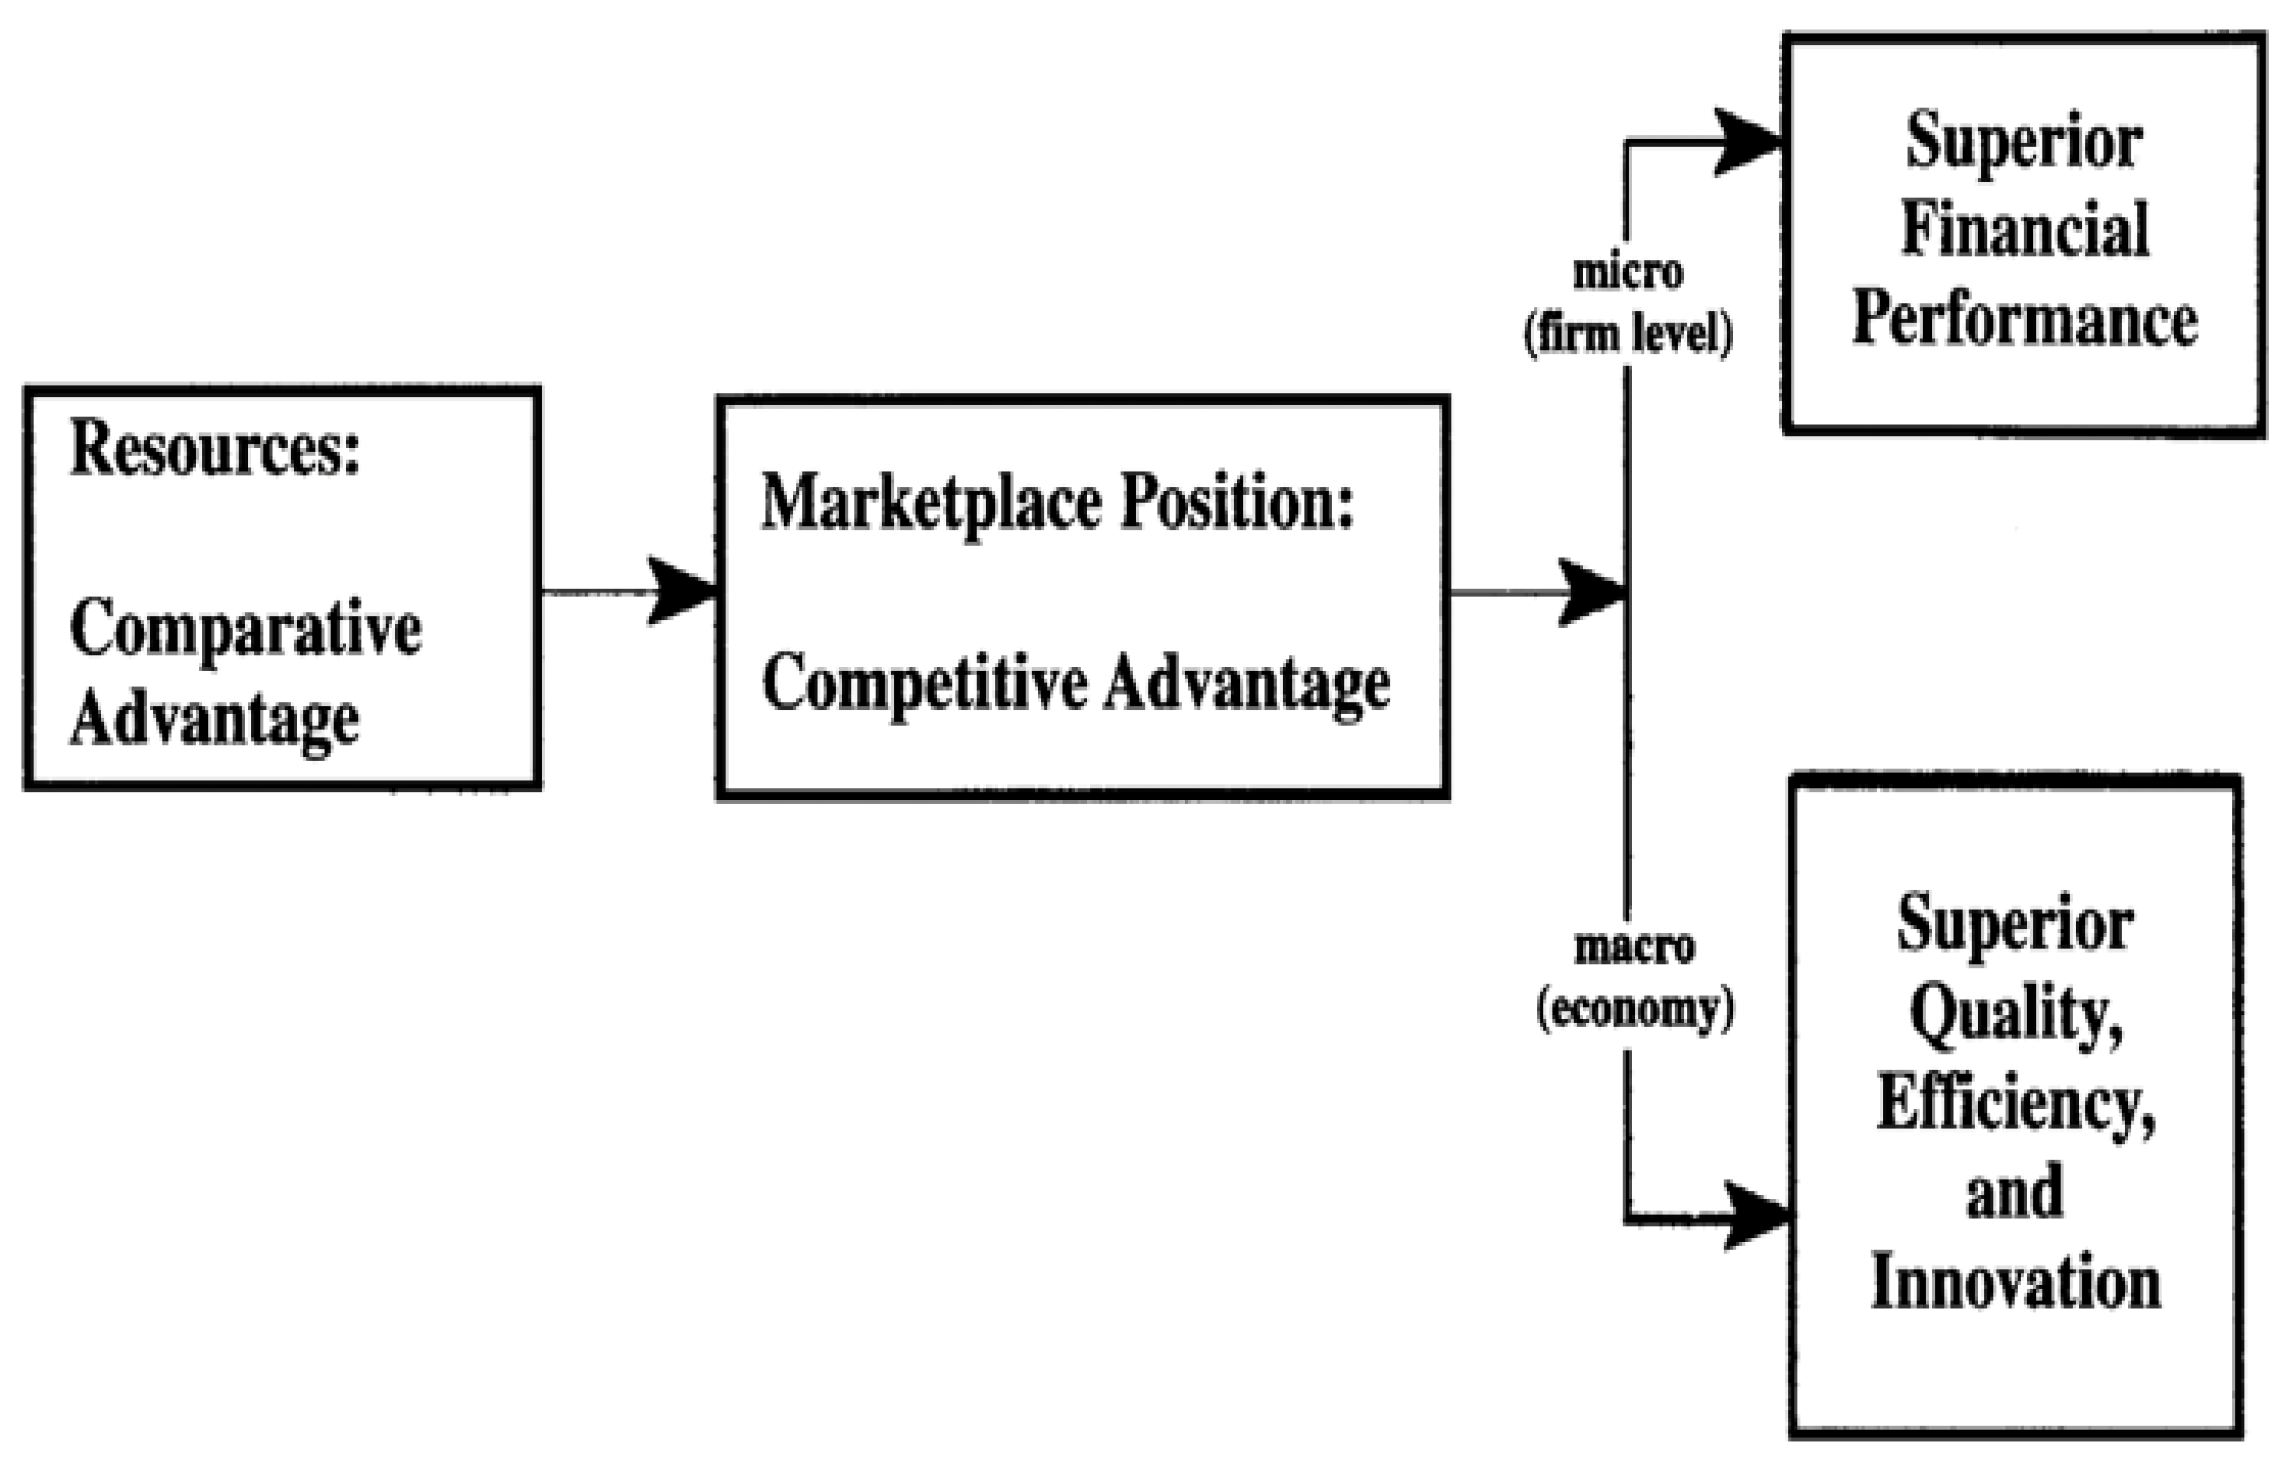
2.1. Theoretical Framework
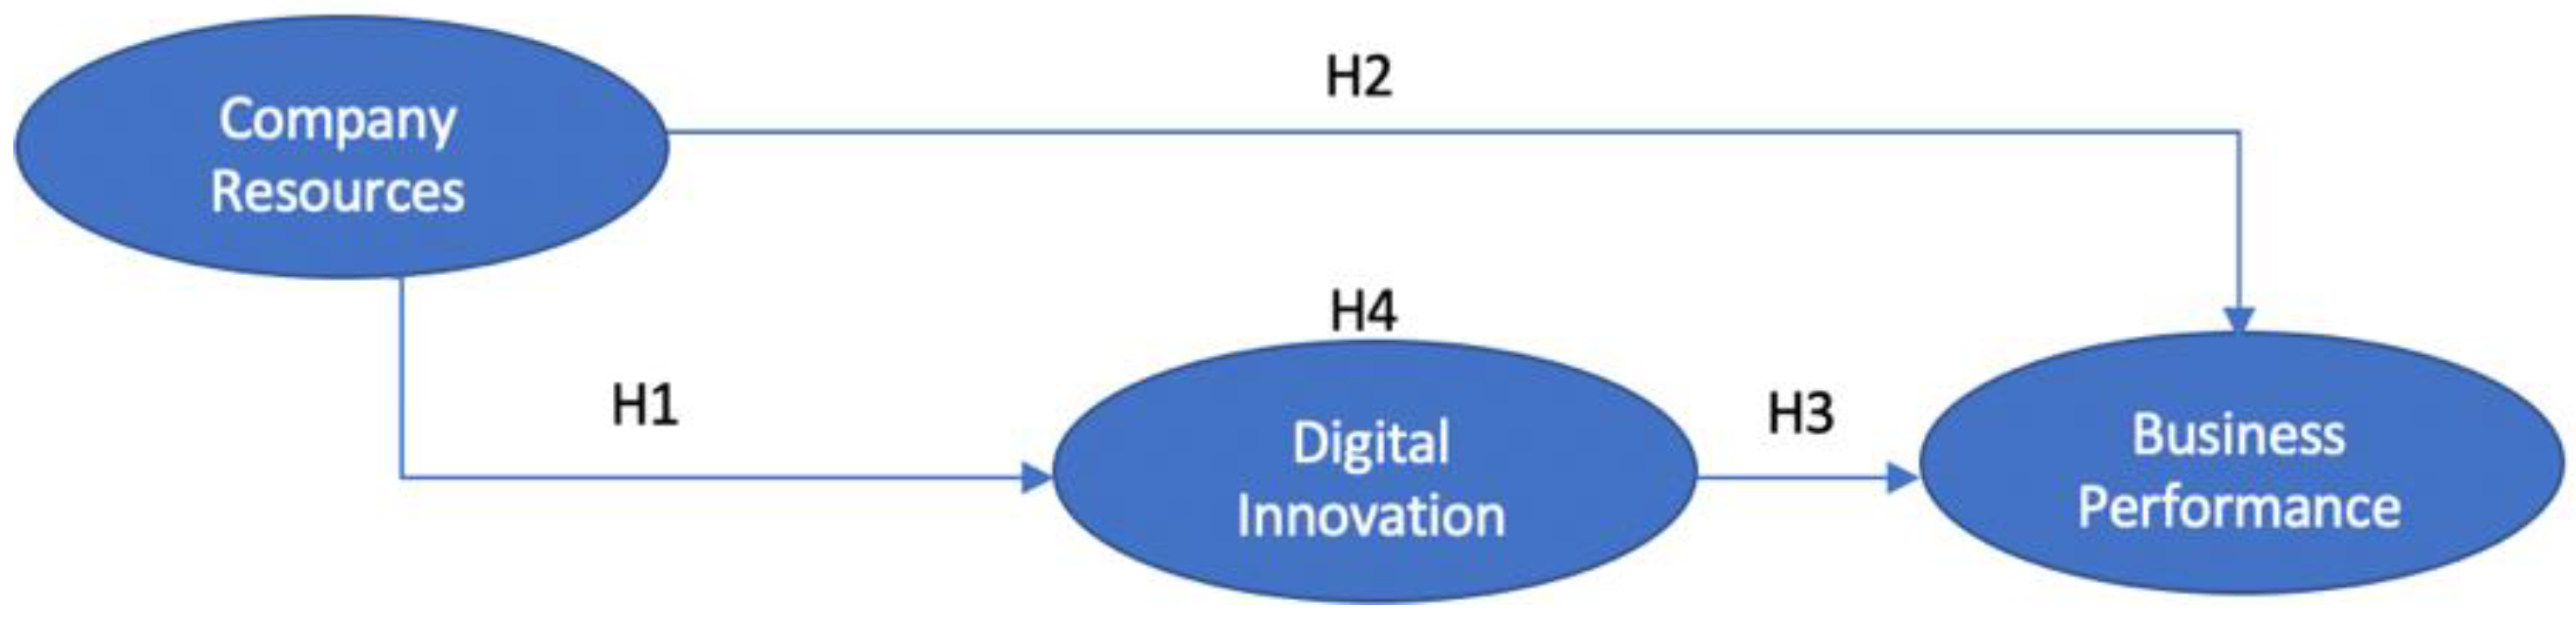
The logic used in this study is that the more resources that are owned, the more the company has a comparative advantage, which will increase the company’s performance and competitive advantage, and the competitive advantage of a company will increase if the company can develop innovations that optimally use its resources to improve business performance. Based on this logic, the theoretical framework of this study is to use the resource-based-view theory (RBV Theory) as a grand theory that states that companies that have “Strategic Resources” will have a long-term competitive advantage over other companies that do not have them. RBV implementation emphasizes the company’s ability to understand the relationship between resources, capabilities, competitive advantage, and profitability to maintain long-term competitive advantage (Barney 1991). The Comparative Advantage Theory of Competition (Hunt and Morgan 1995), is a continuation of the RBV theory, used as a middle-range theory. The Comparative Advantage Theory of Competition states that resources are a source of comparative advantage to gain a competitive advantage in the marketplace and to achieve good financial performance, superiority at the micro-level (company level), and superior quality, efficiency, and innovation at the macro-level. An illustration of the Comparative Advantage Theory of Competition is shown in Figure 1. The next middle-range theory used in this study is the performance statement of Krause (2005) at Ghalem et al. (2016), which states that performance is the level of achievement of goals or possible achievements that may be related to important characteristics of the organization for relevant stakeholders, and the source of performance is the actions of players in business processes.
Based on the grand theory and middle-range theory used in this study, the following is the applied theory which is also the definition of the variables of this study, namely: Business performance is the end-product or outcome of all business-related operations, and organizational performance indicators include asset growth, ROA, ROIC, equity margin, and sales growth (Wheelen et al. 2018; David 2017; Best 2014). Return on equity (ROE), return on assets (ROA), earnings per share (EPS), and Tobin’s Q ratio are used (Tifow and Sayilir 2015) as indicators of firm success. Indicators of ROA are also used (Hahn and Powers 2013) to evaluate business success, similar to Al-Tamimi (2010), who gauge business success using ROA and ROE. In their study on digital technology, digital capabilities, and organizational performance, Khin and Ho (2018) use two dimensions to quantify organizational performance variables: subjective performance and objective performance. Sales, net income, and cash flow measurements are examples of subjective performance. Measures of market share, staff attrition, and customer happiness are used to assess objective performance. The business performance variable in this study is measured by five indicators: ROA, EBITDA margin, ROIC, asset growth, and market share growth (Wheelen et al. 2018; David 2017; Best 2014; Tifow and Sayilir 2015).
The Digital Innovation framework (Nylen and Holmstrom 2015) is a framework that can be used to regulate and measure digital innovation activities carried out. The measurements are carried out in five key areas, namely, user experience, value proposition, digital evolution scanning, skills, and improvisation. Company resources are the basic building of the company’s competitive strategy. Resources are productive inputs or competitive assets owned and controlled by the company. Resources are divided into two main categories: tangible and intangible resources (Thompson et al. 2020).

2.2. Hypothesis

The hypothesis of this study was developed from an analysis of various previous studies, namely:
Studies that had shown that company resources have a significant effect on digital innovation, namely: human resources is a crucial component in achieving innovation for the company (Kohansal et al. 2013): a synergistic innovation management model is created when three capabilities—market, technology, and capability management—are combined to form a special configuration known as the source of the company’s core competencies (Tchuta and Xie 2017); entrepreneurship, marketing skills, relational capital, and empowerment had a favorable and significant impact on innovation performance (Sulistyo and Siyamtinah 2016). The following hypothesis is proposed:
Hypothesis 1 (H1).
Company resources have a significant effect on digital innovation.
Studies that had shown that company resources have a significant effect on business performance, namely: entrepreneurial orientation, corporate resources, and SME branding are related to business performance (Hafeez et al. 2012); HR practices have a positive effect on business performance (Karami et al. 2015); the main elements of human capital include knowledge, skills, and abilities, as well as open-mindedness, execution, imitation, and functional diversity; innovation capability is very important to improve performance (Yen 2013); manager competence has an effect on business performance, and indicators of manager competence have a significant relationship with business performance (Bagheri et al. 2013). The following hypothesis is proposed:
Hypothesis 2 (H2).
Company resources have a significant effect on business performance.
Studies that had shown that digital innovation has a significant effect on business performance, namely: technical innovation (product and process innovation) had a substantial beneficial impact on performance (Atalay et al. 2013); innovation capacity adds directly to product quality and operational performance (Kafetzopoulos and Psomas 2015); business linkages impact firm success through product innovation (Sami et al. 2019). The following hypothesis is proposed:
Hypothesis 3 (H3).
Digital innovation has a significant effect on business performance.
Studies that had shown that company resources have a significant effect on business performance through digital innovation, namely: knowledge management ability and innovation performance influence the impact of knowledge-oriented leadership on organizational performance (Gurlek and Cemberci 2019); entrepreneurial approach, firm resources, and SME branding are associated with company success through innovation, because innovation may catalyze SMBs to grow their services and products, as well as gain market attention, so increasing their value (Hafeez et al. 2012); digital capabilities have a significant influence on business performance, digital innovation has a positive and significant impact on business performance, and digital innovation can mediate the influence of innovation capability on business performance (Yasa et al. 2019). The following hypothesis is proposed:
Hypothesis 4 (H4).
Digital innovation mediates the influence of company resources on business performance.

2.3. Research Model Framework

This study aims to examine the effect of company resources on digital innovation and business performance, and the effect of company resources on business performance through digital innovation, based on the empirical situations as explained in the introduction, theoretical framework, and hypothesis. The research model framework is shown in Figure 2.

3. Methods

This study uses a quantitative research approach. Observations were carried out in a cross-section/one shot in 2022. The population of this study was the ISP company industry, and the unit of observation was the management. Sampling used stratified random sampling, in which population elements were grouped at certain levels to take samples evenly throughout the group so that the sample represented the character of all heterogeneous population elements. The survey was conducted by selecting a sample of the population, namely, licensed ISP companies operating in Indonesia and being members of the APJII (Indonesian Internet Service Providers Association), totaling around 474. ISPs were grouped based on the size of each company based on the number of customers and branch cities, namely, divided into 3 groups: small, medium, and large. Samples were taken from 240 respondents. Sampling from each classification was conducted randomly based on a list of population members, as shown in Table 2. The survey questions in this study are shown in Appendix A, with survey questions for the company resource variable shown in Appendix A.1, for the digital innovation variable in Appendix A.2, and for the business performance variable in Appendix A.3. The measurement scale in this study uses an ordinal scale using the Likert method, which produces ordinal data. The ordinal measurement scale is a scale where the data show a certain order (Ferdinand 2014). Testing the causality correlational relationship between constructs in this study used structural equation modeling (SEM).

4. Research Findings

4.1. Goodness-of-Fit Analysis

Structural equation modeling is an ideal data analytical tool for testing complex relationships among many analytical variables. To test the extent to which a hypothesized model provides an appropriate characterization of the collective relationships among its variables, researchers must assess the “fit” between the model and the sample’s data. There are guidelines for assessing if a theory-based model fits empirical data or if the resulting model describes actual conditions. The structural equation model (SEM) as a statistical test can explain the strength of a model with several index criteria to assess the suitability of the model. Table 3 shows the results of the goodness-of-fit of this study. Chi-Square = 290.64, and the Chi-Square p-value = 0.99872 > 0.05. Therefore, according to the Chi-Square index, the suitability of this research model is fit (Hair 2006). The RMSEA is less than 0.05. Furthermore, the Goodness-of-Fit Index (GFI) = 0.86 > 0.80, likewise AGFI. Therefore, it can be concluded that the research model is in an empirical condition.

4.2. Validity and Reliability Test

After the model is declared fit, the next process is to see the indicators in a construct. This process is called the construct validity test, which is carried out through the convergent validity test, which is an indicator that observes whether data constructs have a high loading factor with construct internal reliability, commonly used to evaluate construct reliability. Convergent validity was achieved through the Average Variance Extracted and a loading factor with an expected value >0.50.
In Figure 3 and Table 4, it is shown that the loading factors >0.50, the t-value of the loading factor is higher than the t-table (1.98) at a significance of 5%, according to Chin (2000) dimensions, and indicators are valid in measuring latent variables. Composite reliability and AVE are used to see the level of reliability of indicators and dimensions in measuring research variables (Nunnally and Bernstein 1994). Composite reliability is >0.7 and AVE is >0.5, so it can be stated that the dimensions and indicators used in this study are reliable.

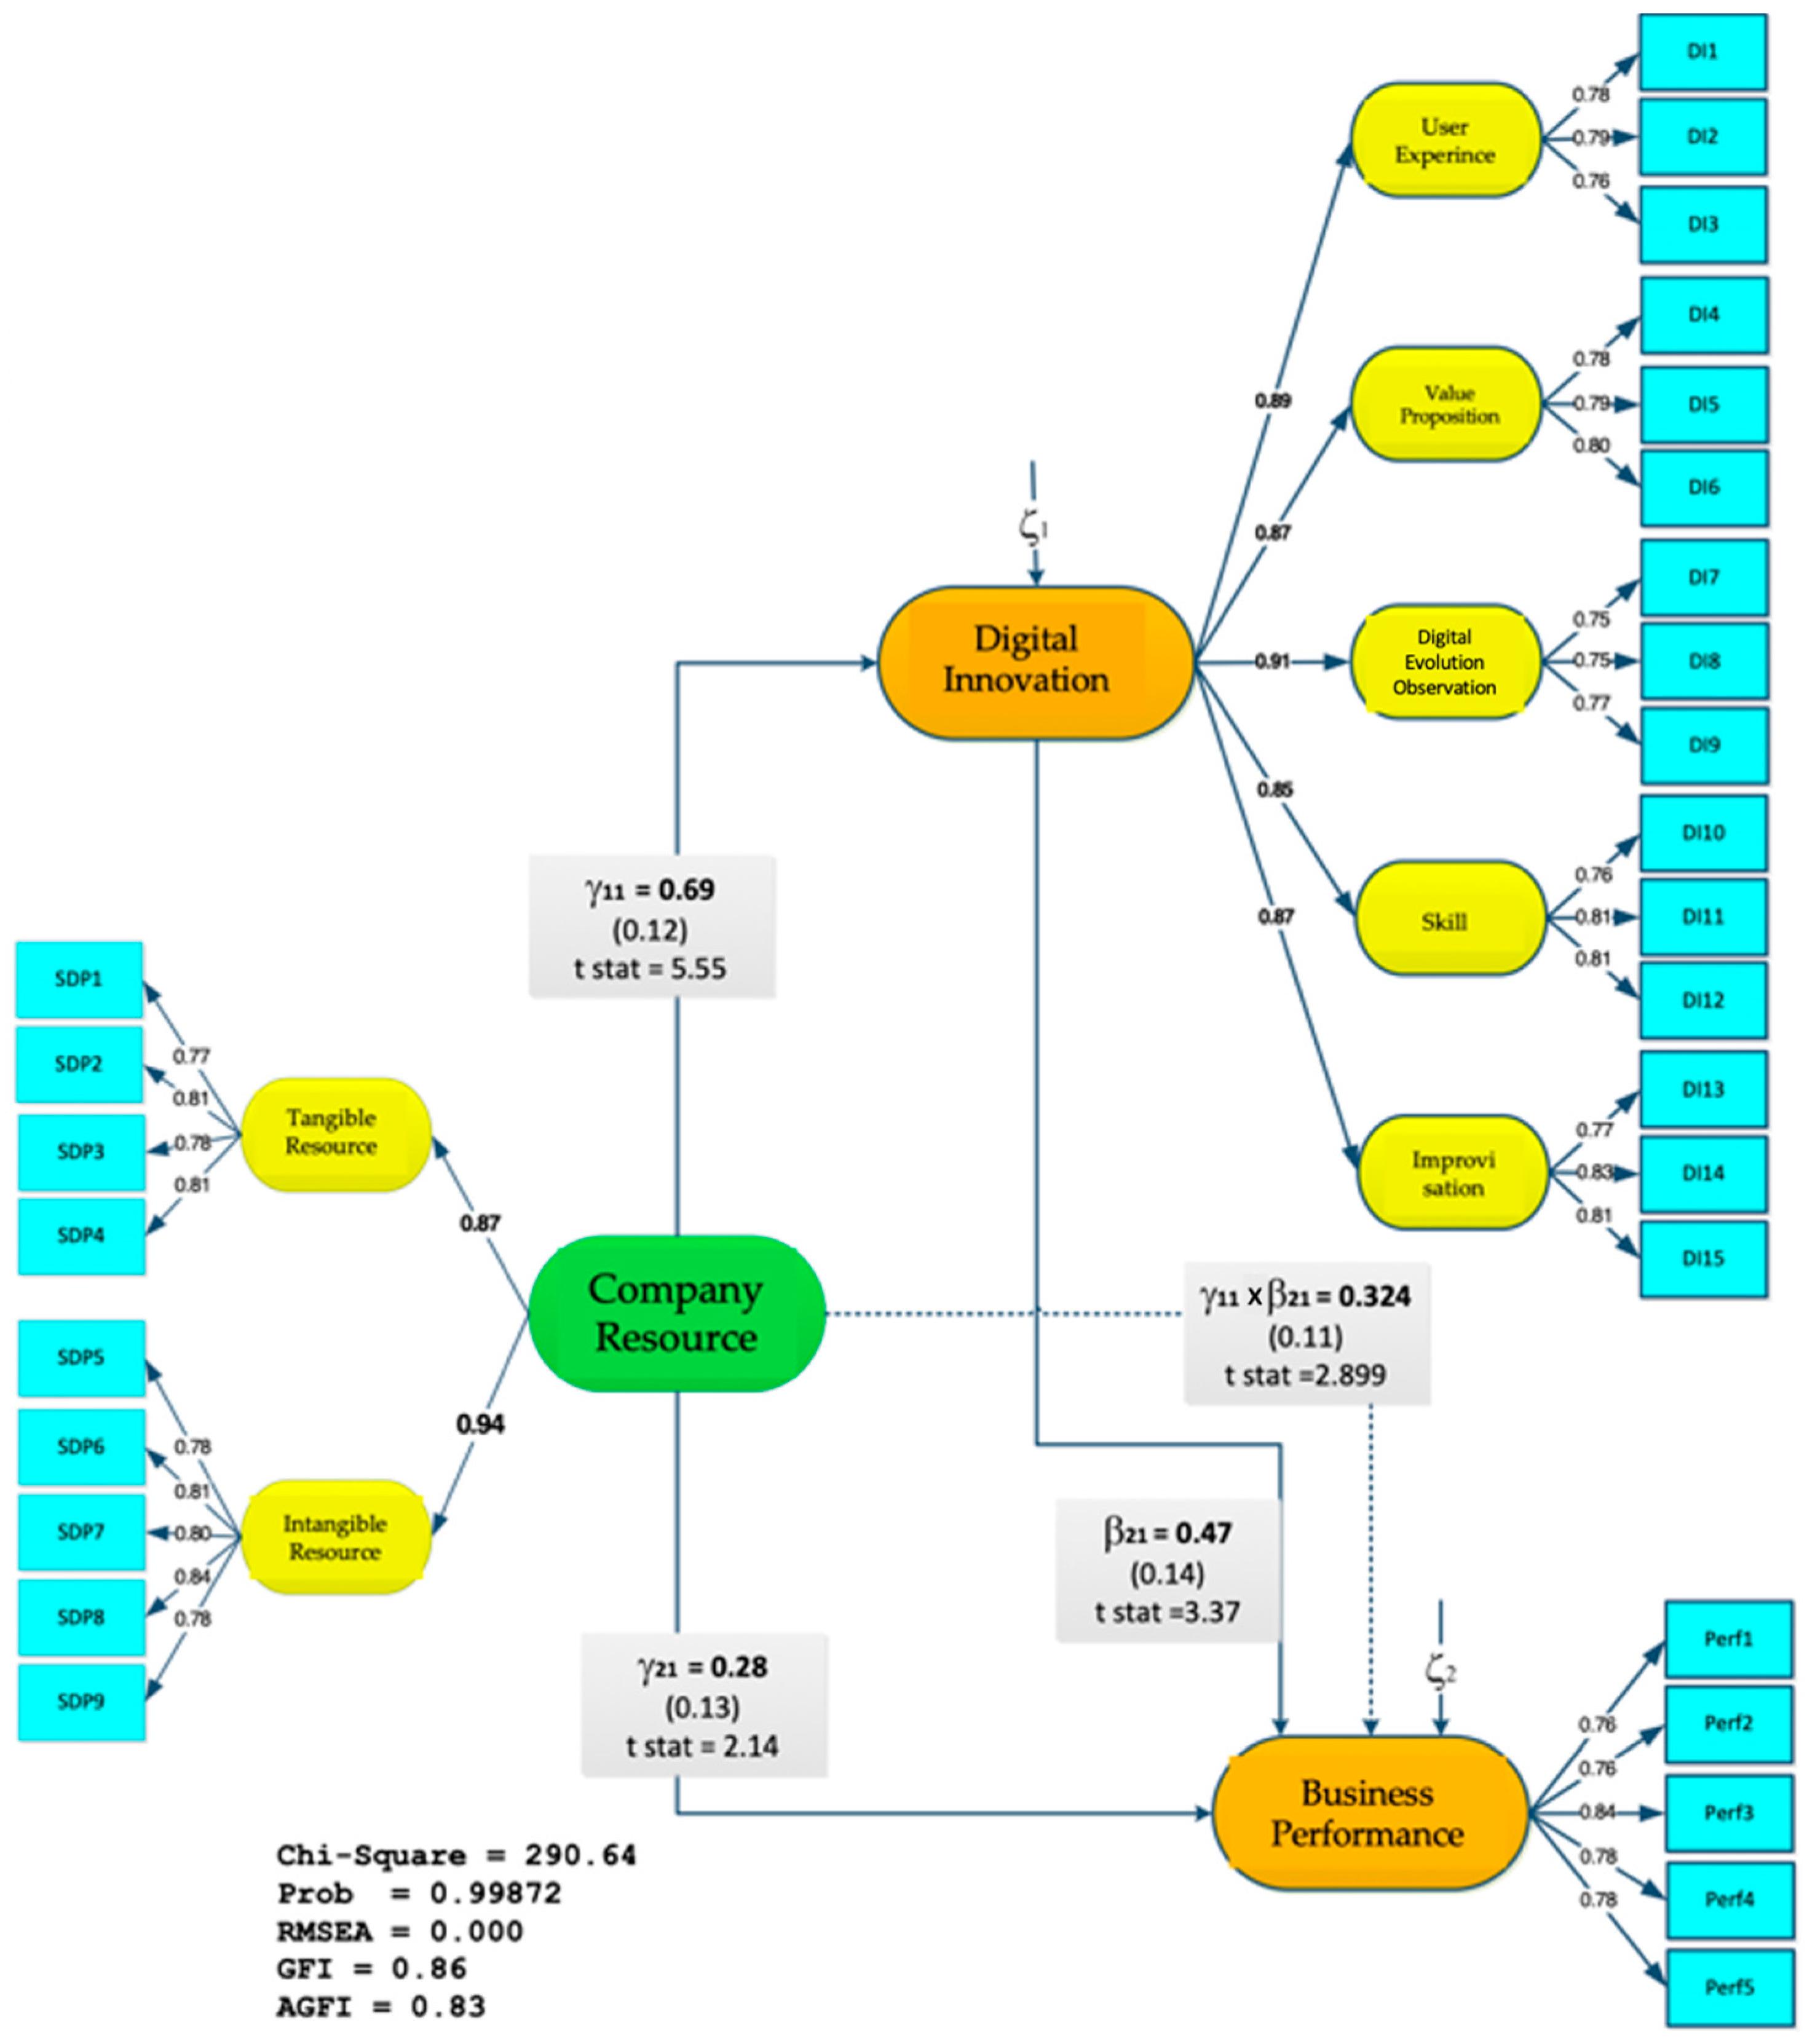
4.3. Hypothesis Testing

The results of hypothesis testing can be seen in Table 5.
From the hypothesis testing results, it is found that:
  • Company resources have a significant direct effect on business performance and digital information, with a t-value > 1.98 and a p-value <0.05.
  • Digital innovation has a significant direct effect on business performance, with a t-value >1.98 and a p-value <0.05.
  • Company resources significantly indirectly affect business performance through digital innovation, with a t-value >1.98 and a p-value <0.05.
  • The indirect effect of company resources on business performance through digital innovation (R2 = 0.166) is more dominant compared to the direct effect of company performance on business performance (R2 = 0.078).
In terms of the relationship between company resources and digital innovation, this study supports previous studies (Kohansal et al. 2013; Tchuta and Xie 2017; Sulistyo and Siyamtinah 2016), which describe the significant role of company resources in digital innovation. For the relationship between company resources and business performance, the result of this study supports previous studies (Hafeez et al. 2012; Bagheri et al. 2013; Karami et al. 2015; Yen 2013) which said there is a significant role of company resources in business performance but does not support research (Hussain and Waheed 2019) that said that company resources do not have a significant role in business performance. Meanwhile, regarding the relationship between company resources and digital innovation, the findings of this study also support previous research that stated there is a significant role of company resources in digital innovation (Kohansal et al. 2013; Tchuta and Xie 2017; Sulistyo and Siyamtinah 2016), and on the relation between company resources and business performance through digital innovation, findings from this study support previous research (Hafeez et al. 2012; Gurlek and Cemberci 2019; Yasa et al. 2019).

5. Discussion and Conclusions

The findings of this study are novel and very interesting for application because the study provides theoretical and managerial implications that can be directly applied to improve a company’s business performance. Theoretical implications of this study include a model for improving business performance through the development of quality digital innovation by optimally utilizing the company’s resources. This model also increases the company’s competitive advantage compared to the competitors. The results of this study show that company resources have an influence on business performance and will have a greater impact on business performance if the company’s resources are used optimally to develop digital innovation first, rather than directly improving the existing company’s resources and/or developing new company’s resources to improve business performance. The result of this study provides empirical evidence of the Comparative Advantage Theory of Competition (Hunt and Morgan 1995), which states that resources are a source of comparative advantage to gain a competitive advantage in the marketplace to achieve superior financial performance at the micro-level (company level) and obtain a superior quality, efficiency, and innovation at the macro-level.
By first using the company’s existing resources to develop digital innovations to improve business performance, the company will produce innovations, skills, capabilities, and other new resources that will complement the company’s resources previously owned, and can also be used to choose the right digital technology to develop new products/services that appeal to the customer and answer the increasing demand for new products/services from customers.
The managerial implication of this research is a recommendation for ISP companies to prioritize the use of company resources optimally to develop digital innovations to increase competitive advantage and improve business performance, then directly improve the company’s resources previously owned and/or develop other company resources beyond those already generated from digital innovation for further improvement of business performance. By prioritizing the optimal use of company resources to develop quality digital innovations that generate new company capabilities and resources to improve business performance, then equipped with the direct development of company resources to improve business performance, and complementing existing capabilities and resources resulting from digital innovation, the company will be able to reduce the costs needed to develop company resources to improve business performance. This cost reduction will certainly increase the profits that will be obtained by ISP companies.
Based on the results of this study, to improve business performance through the development and implementation of quality digital innovation by optimally utilizing company resources, ISP companies are recommended to take the following operational steps:
  • Prioritize the achievement of performance indicators by first ensuring that the ROIC (return on invested capital) target is achieved because the ISP industry is a capital-intensive industry in deploying its service infrastructure. This capital is generally obtained from bank loans, so ISPs must ensure they can repay the loan. Furthermore, ensuring that the target market share is achieved through asset growth while ensuring the level of ROA (return on assets) and EBITDA of the company.
  • The development and implementation of quality digital innovation begin with prioritizing observation of digital evolution to know user behavior and the right digital equipment and marketing channel that will be used, then focus on improving customer experience through developing products/services that have aesthetics and usefulness with customer engagement, and continuing to deliver value proposition through implementing correct commissions, product bundling, and implementing customer segmentation, improving improvisation with the right scheduling, coordination, and opportunities to innovate, and lastly improving skills by team building, role fulfillment, and learning.
  • In utilizing company resources optimally, the ISP company needs to utilize intangible resources in the form of a supportive organizational culture, superior customer service, mastery of IT technology, company reputation, and internal business processes.
It is interesting to continue this study by adding a collaboration variable as a second mediating variable. This is based on the empirical condition that ISPs are businesses that depend on government regulations and are capital-intensive, so they need banking support, businesses where the demand for products/services from customers is increasing rapidly, and businesses that are strongly influenced by changes in digital technology that are currently taking place very quickly, so the ISP industry needs collaboration with the government, banking, customers, and the world of education. In addition, the trend of coopetition (collaboration and competition: see Mariani and Belitski 2022; Ritala 2012; Ritala and Hurmelinna-Laukkanen 2013; Estrada et al. 2016; Quintana-Garcia and Benavides-Velasco 2004) positively influence innovation to improve performance because it can give birth to innovations, new knowledge, new skills, new capabilities, and technological diversity by mutually accessing the resources and capabilities possessed by collaborative activities. Coopetition in essence is the occurrence of cooperation and competition between industry players, which can be carried out in various configurations that support business activities together (Sammut-Bonnici 2015).

Author Contributions

S.H. is the main author of this article and also played a role in analyzing the statistical data generated in this study. M.S. is an expert in the field of economics and research management. She is also an expert in the field of economics, and she was very instrumental in providing input on the use of theories in this research to produce quality research. F.R. is an expert in the field of research management. He was very helpful in providing input in this research to produce quality research. A.S.H. is an expert in strategic marketing. He played a role in providing input in this research to produce quality research. All authors have read and agreed to the published version of the manuscript.

Funding

This research received no external funding.

Institutional Review Board Statement

Not applicable.

Informed Consent Statement

Not applicable.

Conflicts of Interest

The authors declare no conflict of interest.

Appendix A. Survey Questions

Appendix A.1. Company Resources

The following are questions regarding the company’s ability to develop company resources in your company:
(Please put an “X” in the column of available answer choices)
NumberQuestionsAnswers
Tangible Resources54321
1The company provides a representative office buildingStrongly AgreeAgreeNeutralDisagreeStrongly Disagree
2The company provides complete office facilitiesStrongly AgreeAgreeNeutralDisagreeStrongly Disagree
3The company has sufficient capitalStrongly AgreeAgreeNeutralDisagreeStrongly Disagree
4The company has adequate human resourcesStrongly AgreeAgreeNeutralDisagreeStrongly Disagree
Intangibe Resources54321
5The company builds and maintains a good company reputationStrongly AgreeAgreeNeutralDisagreeStrongly Disagree
6The company provides superior customer serviceStrongly AgreeAgreeNeutralDisagreeStrongly Disagree
7The company has mastery of IT technologyStrongly AgreeAgreeNeutralDisagreeStrongly Disagree
8The company has a supportive organizational cultureStrongly AgreeAgreeNeutralDisagreeStrongly Disagree
9The company always develops internal business processesStrongly AgreeAgreeNeutralDisagreeStrongly Disagree
Please state what obstacles are encountered in developing the company’s resources.
Limited ability to innovate digitally to anticipate changes in the business environment
The company has difficulty cooperating with the Government and/or other companies
Lack of sufficient capital/investment allocation
The limitations of the experts
Inadequate human resource capacity development
Lack of good collaboration both internal and external to the company
Mastery of technology, especially digital technology
Others ....................................................................................

Appendix A.2. Digital Innovation

Below are questions regarding the company’s ability to develop digital innovation in your company:
(Please put an “X” in the column of available answer choices)
NumberQuestionsAnswers
A. 
User Experience
54321
1The company always prepares products/services that are easy to useStrongly AgreeAgreeNeutralDisagreeStrongly Disagree
2The company always articulates an aesthetic trait that evokes a positive emotional response to the products/services providedStrongly AgreeAgreeNeutralDisagreeStrongly Disagree
3The company always creates products/services by involving customers to create a meaningful user experienceStrongly AgreeAgreeNeutralDisagreeStrongly Disagree
B. 
Value Proposition
54321
4The company always performs the right customer segmentationStrongly AgreeAgreeNeutralDisagreeStrongly Disagree
5The company always performs the right product/service bundlingStrongly AgreeAgreeNeutralDisagreeStrongly Disagree
6The company always evaluates/negotiates the commission given to the marketing channel ownerStrongly AgreeAgreeNeutralDisagreeStrongly Disagree
C. 
Observation of Digital Evolution
54321
7The company always follows the development of the necessary digital equipment technologyStrongly AgreeAgreeNeutralDisagreeStrongly Disagree
8The company always manages effective digital marketing channelsStrongly AgreeAgreeNeutralDisagreeStrongly Disagree
9The company always pays attention to user behavior that appears in the marketStrongly AgreeAgreeNeutralDisagreeStrongly Disagree
D. 
Skill
54321
10The company always encourages learning on the development of digital technologyStrongly AgreeAgreeNeutralDisagreeStrongly Disagree
11The company always maintains a balance of roles between those with general and specific digital skillsStrongly AgreeAgreeNeutralDisagreeStrongly Disagree
12The company can always put together a team with the right combination of skills for any digital projectStrongly AgreeAgreeNeutralDisagreeStrongly Disagree
E. 
Improvisation
54321
13The company always supports the development of flexible space for innovationStrongly AgreeAgreeNeutralDisagreeStrongly Disagree
14The company always dedicates time to improvisation efforts in every product/service providedStrongly AgreeAgreeNeutralDisagreeStrongly Disagree
15The company always has a mechanism to coordinate efforts to improvise with related partiesStrongly AgreeAgreeNeutralDisagreeStrongly Disagree
Please state what obstacles are faced in developing digital innovation.
Lack of sufficient budget allocation/investment in the development of digital innovation
Mastery over digital technology, for example, big data, artificial intelligence, mobile application, robotic processing automation
Company policies and culture do not support the development of digital innovation
Limitations of creativity and capability of human resources
The existence of related external policies (government or stakeholders) that do not support the achievement of digital innovation development
Others ....................................................................................

Appendix A.3. Business Performance

Below are questions regarding the management’s ability to achieve company performance in your company:
(Please put an “X” in the column of answer choices provided)
Pilihan Jawaban
A. 
Profitabilitas
54321
1Achievement of the last year’s ROA growth target in accordance with the targetStrongly AgreeAgreeNeutralDisagreeStrongly Disagree
-
Please explain why this condition occurs.
Good collaboration with external partners
The company’s internal collaboration is going well
Company resources have qualified capabilities
The company carries out digital innovations to improve products and services
The company has the ability to adapt in a good business environment
Other ..............................................................................
-
Please convey the range of achievement of the ROA growth target for the last year (in IDR/%)
<5%
5–9%
10–14%
15–19%
>20%
Other..............................................................................
2Achievement of the EBITDA growth target: The last year’s margin was in line with the targetStrongly AgreeAgreeNeutralDisagreeStrongly Disagree
-
Please explain why this condition occurs.
Good collaboration with external partners
The company’s internal collaboration is going well
Company resources have qualified capabilities
The company carries out digital innovations to improve products and services
The company operates efficiently
Companies can anticipate customer preferences
The company has the ability to adapt to the business environment well
Other ...........................................................................
-
Please convey the range of achievement of the EBITDA Margin growth target for the last year (in IDR/%)
<5%
5–19%
20–34%
35–49%
>50%
Other ...........................................................................
3Achievement of the last year’s ROIC growth target in line with the targetStrongly AgreeAgreeNeutralDisagreeStrongly Disagree
-
Please explain why this condition occurs?
There is good collaboration with investors/investors
The company’s internal collaboration is going well
Company resources have qualified capabilities
The company carries out digital innovations to improve products and services
The company operates efficiently
The company has the ability to adapt to the business environment well
Other ..............................................................................
-
Please convey the range of achievement of the ROIC growth target for the last year (in %)
<5%
5–9%
10–14%
15–19%
>20%
Other ...........................................................................
B. 
Asset Growth
54321
4.Achievement of the last year’s asset growth target in accordance with the targetStrongly AgreeAgreeNeutralDisagreeStrongly Disagree
-
Please explain why this condition occurs.
Good collaboration with external partners
The company’s internal collaboration is going well
The company carries out development planning well
Company resources have qualified capabilities in asset management
The company carries out digital innovations to improve products and services
The company has the ability to adapt to the business environment well
Other ...........................................................................
-
Please convey the range of achievement of the last year’s asset growth target (in IDR/ %)
<5%
5–9%
10–14%
15–19%
>20%
Other ...........................................................................
C. 
Market Share
54321
5.Achievement of the market share target for the last year in accordance with the targetStrongly AgreeAgreeNeutralDisagreeStrongly Disagree
-
Please explain why this condition occurs.
The company has strong capabilities in anticipating the dynamics of customer/market demands
Good collaboration with external partners
The company’s internal collaboration is going well
The company carries out digital innovations to improve products and services
The company has the ability to adapt to the business environment well
Other ...........................................................................
-
Please kindly convey the range of achievement of the target market share in the last year (in %)
<10%
10–29%
30–49%
50–69%
>70%
Other ...........................................................................
Please state what obstacles are encountered in achieving company performance.
Lack of good collaboration with external partners (government, financiers, competitors, suppliers, customers, etc.)
The company’s internal collaboration is going poorly
Human resources do not have sufficient capabilities
Companies are lacking in digital innovation to improve products and services
Limited capital owned
Limited mastery of digital technology
Companies are not able to adapt to environmental changes
Others ....................................................................................

References

  1. Al-Tamimi, Hussein A. Hassan. 2010. Factors Influencing Performance of the UAE Islamic and Conventional National Banks. Sharjah: Department of Accounting, Finance, and Economics, College of Business Administration, University of Sharjah. [Google Scholar]
  2. Atalay, Murat, Nilgün Anafarta, and Fulya Sarvan. 2013. The relationship between innovation and firm performance: Empirical evidence from Turkish automotive supplier industry. Procedia—Social Behavioral Science 75: 226–35. [Google Scholar] [CrossRef] [Green Version]
  3. Bagheri, Sodeif, Habib Ebrahimpour, and Mohammad Bashokoh Ajirloo. 2013. Surveying The Impact of Managers Competencies on Business Performance of Agricultural Bank Managers In Ardabil Province. International Journal of Management Research and Reviews 3: 3424–33. [Google Scholar]
  4. Barney, Jay. 1991. Firm Resources and Sustained Competitive Advantage. Journal of Management 17: 99–120. [Google Scholar] [CrossRef]
  5. Best, Roger. 2014. Market-Based Management: Strategies for Growing Customer Value and Profitability, 6th ed. Upper Saddle River: Prentice Hall. [Google Scholar]
  6. Chin, Wynne. 2000. Partial Least Squares for Researchers: An Overview and Presentation of Recent Advances Using the PLS Approach. Available online: http://disc-nt.cba.uh.edu/chin/indx.html (accessed on 1 October 2022).
  7. David, Fred. 2017. Strategic Management, Concepts & Cases, 16th ed. London: Pearson Education Limited. [Google Scholar]
  8. Estrada, Isabel, Dries Faems, and Pedro de Faria. 2016. Coopetition and product innovation performance: The role of internal knowledge sharing mechanisms and formal knowledge protection mechanisms. Industrial Marketing Management 53: 56–65. [Google Scholar] [CrossRef]
  9. Ferdinand, Augusty. 2014. Metode Penelitian Manajemen Pedoman Penelitian untuk Penulisan Skripsi Tesis dan Disertasi Ilmu Manajemen, 5th ed. Semarang: BP Undip. ISBN 979-704-254-5. [Google Scholar]
  10. Ghalem, Âta, Chafik Okar, Razane Chroqui, and Sema Elalami. 2016. Performance: A Concept to Define. Available online: https://www.researchgate.net/publication/316630175_Performance_A_concept_to_define (accessed on 1 October 2022). [CrossRef]
  11. Gurlek, Mert, and Murat Cemberci. 2019. Understanding the relationships among knowledge-oriented leadership, knowledge management capacity, innovation performance, and organizational performance. Kybernetes 49: 2819–46. [Google Scholar]
  12. Hafeez, Muhammad Haroon, Mohd Noor Mohd Shariff, and Halim Bin Mad Lazim. 2012. Relationship between Entrepreneurial Orientation, Firm Resources, SME Branding and Firm’s Performance: Is Innovation the Missing Link? American Journal of Industrial and Business Management 2: 153–59. [Google Scholar] [CrossRef] [Green Version]
  13. Hahn, William, and Thomas Powers. 2013. Strategic plan quality, implementation capability, and firm performance. Academy of Strategic Management Journal 9: 63–81. [Google Scholar]
  14. Hair, Joseph. 2006. Multivariate Data Analysis, 5th ed. Hoboken: Pearson Prentice Hall. [Google Scholar]
  15. Hunt, Shelby, and Robert Morgan. 1995. The Comparative Advantage Theory of Competition. Journal of Marketing 59: 1–15. [Google Scholar] [CrossRef]
  16. Hussain, Rana Tanveer, and Abdul Waheed. 2019. Strategic Resources and Firm Performance: An Application of the Resource-Based View. The Lahore Journal of Business 7: 59–94. [Google Scholar] [CrossRef]
  17. Kafetzopoulos, Dimitrios, and Evangelos Psomas. 2015. The impact of innovation capability on the performance of manufacturing companies. Journal of Manufacturing Technology Management 26: 104–30. [Google Scholar] [CrossRef]
  18. Karami, Azdar, Samira Sahebalzamani, and Babak Sarabi. 2015. The Influence of HR Practices on Business Strategy and Firm Performance: The Case of Banking Industry in Iran. The IUP Journal of Management Research 14: 30–53. [Google Scholar]
  19. Khin, Sabai, and Theresa Char Fey Ho. 2018. Digital technology, digital capability and organizational performance: A mediating role of digital innovation. International Journal of Innovation Science 11: 177–95. [Google Scholar] [CrossRef]
  20. Kohansal, Mohammad Reza, Mohsen Rahimi, and Saeed Vazifehshenas. 2013. Environmental Efficiency, Innovation and Corporate Performance in Management Human Resources. International Journal of Agriculture and Crop Sciences 5: 2906–10. [Google Scholar]
  21. Krause, Oliver. 2005. Performance Measurement—Eine Stakeholder-Nutzenorientierte und Geschäft sprozess-basierte Methode. Ph.D. dissertation, Technische Universität Berlin, Berlin, Germany. [Google Scholar]
  22. Mariani, Marcelo, and Maksin Belitski. 2022. The effect of competition intensity on first mover advantage and imitation in innovation-related coopetition: Empirical evidence from UK firms. European Management Journal. Available online: https://www.sciencedirect.com/science/article/pii/S0263237322000640?via%3Dihub (accessed on 1 October 2022). [CrossRef]
  23. Nunnally, Jum C., and Ira H. Bernstein. 1994. The Assessment of Reliability. Psychometric Theory 3: 248–92. [Google Scholar]
  24. Nylen, Daniel, and Joony Holmstrom. 2015. Digital innovation strategy: A framework for diagnosing and improving digital product and service innovation. Business Horizons 58: 57–67. [Google Scholar] [CrossRef] [Green Version]
  25. Quintana-Garcia, Cristina, and Carlos A. Benavides-Velasco. 2004. Cooperation, competition, and innovative capability: A panel data of European dedicated biotechnology firms. Technovation 24: 927–38. [Google Scholar] [CrossRef]
  26. Ritala, Paavo. 2012. Coopetition Strategy—When is it Successful? Empirical Evidence on Innovation and Market Performance. British Journal of Management 23: 307–24. [Google Scholar] [CrossRef]
  27. Ritala, Paavo, and Pia Hurmelinna-Laukkanen. 2013. Incremental and Radical Innovation in Coopetition—The Role of Absorptive Capacity and Appropriability. Journal of Product Innovation Management 30: 154–69. [Google Scholar] [CrossRef]
  28. Sami, Parinaz, Farrajollah Rahnavard, and Alireza Alavi Tabar. 2019. The effect of political and business ties on firm performance. Management Research Review 42: 778–96. [Google Scholar] [CrossRef]
  29. Sammut-Bonnici, Tanya. 2015. Coopetition. Wiley Encyclopedia of Management. Hoboken: John Wiley & Sons, Ltd. [Google Scholar]
  30. Sulistyo, Heru, and Siyamtinah. 2016. The innovation capability of SMEs through entrepreneurship, marketing capability, relational capital, and empowerment. Asia Pacific Management Review 21: 196–233. [Google Scholar] [CrossRef]
  31. Thompson, Arthur, Margaret Peteraf, and Jhon Gamble. 2020. Crafting and Executing Strategy, The Quest for Competitive Advantage, Concepts, and Cases, 19th ed. New York: McGraw Hill Education. [Google Scholar]
  32. Tchuta, Leonard, and Fuji Xie. 2017. Towards A Synergic Innovation Management Model: The Interplay of Market, Technology, and Management Innovations. International Journal of Business and Economic Development 5: 60–70. [Google Scholar]
  33. Tifow, Abdulkadir Ali, and Ozlem Sayilir. 2015. Capital Structure and Firm Performance: An Analysis of Manufacturing Firms In Turkey. Eurasian Journal of Business and Management 3: 13–22. [Google Scholar] [CrossRef]
  34. Wheelen, Thomas. L., David J. Hunger, Alan N. Hoffman, and Charles E. Bamford. 2018. Strategic Management and Business Policy: Globalization, Innovation, and Sustainability, 15th ed. London: Pearson Education Limited. [Google Scholar]
  35. Yasa, Ni Nyoman Kerti, Ni Wayan Ekawati, and Putu Laksmita Dewi Rahmayanti. 2019. The role of digital innovation in mediating digital capability on business performance. European Journal of Management and Marketing Studies 4: 111–28. [Google Scholar]
  36. Yen, Yu-Fang. 2013. The impact of bank’s human capital on organizational performance: How innovation influences performance. Innovation: Management, Policy & Practice 15: 112–27. [Google Scholar]
Figure 1. The Comparative Advantage Theory of Competition (Source: Hunt and Morgan 1995).
Admsci 12 00157 g001
Figure 2. The Research Model Framework. Source: Researcher.
Admsci 12 00157 g002
Figure 3. The Model Result. Source: Researcher.
Admsci 12 00157 g003
Table 1. The results from previous studies that studied the relationship between company resources and business performance were inconsistent.
AuthorResult
Hafeez et al. (2012), Bagheri et al. (2013), Karami et al. (2015), Yen (2013)Significant
Hussain and Waheed (2019)Not Significant
Table 2. Population and sample numbers. Source: APJII and stratified random sampling output.
ClassificationPopulationSamples
Large147
Medium6533
Small395200
Total474240
Table 3. Goodness-of-Fit Analysis, Source: Lisrel 8.7 output.
No.Size Degree of FitValueAcceptable Match RateNote
1Absolute Fit Test
Chi-Square290.64p-value > 0.05Close fit
Normed Chi-Square (χ2/df)p-value = 0.99872
Goodness-of-Fit Index (GFI)0.86>0.80Close fit
Root Mean Square Error of Approximation (RMSEA) 0.000RMSEA ≤ 0.08 (good fit)
RMSEA < 0.05 (close-fit)
Close fit
2Incremental Fit Measures
Adjusted Goodness-of-Fit Index (AGFI)0.83AGFI > 0.8Close fit
Normed Fit Index (NFI)0.94NFI > 0.90Close fit
Comparative Fit Index (CFI)0.99CFI > 0.90Close fit
3Parsimonius Fit Measures
Parsimonious Normed Fit Index (PNFI)0.95PNFI > 0.90Close fit
Parsimonious GFI (PGFI)0.92PGFI > 0.90Fit
Table 4. Measurement Model Source: Lisrel 8.7 output.
VariablesDimension-IndicatorCodeLoading Factort-Valuep-ValueAverage Variance Extracted (AVE)Composite Reliability
Company ResourcesTangible Resources 0.877.440.0000.6280.871
Representative office buildingSDP10.77--
FacilitiesSDP20.817.950.000
Sufficient capitalSDP30.787.720.000
Adequate human resourcesSDP40.817.980.000
Intangible Resources 0.948.060.0000.6440.900
Company’s reputationSDP50.78--
Customer serviceSDP60.818.340.000
Mastery of IT technologySDP70.808.250.000
Organizational cultureSDP80.848.640.000
Internal business processesSDP90.787.950.000
Tangible Resources
Digital InnovationUser Experience 0.897.200.0000.6030.820
Product/service usefulnessDI10.787.68
Product/service aestheticsDI20.797.680.000
Customer engagementDI30.767.410.000
Value Proposition 0.877.100.0000.6240.833
Customer segmentDI40.78-
BundlingDI50.797.650.000
Commission DI60.807.790.000
Digital Evolution Observation 0.917.070.0000.5730.884
Digital equipmentDI70.75-
Marketing channelDI80.757.070.000
User behaviorDI90.777.170.000
Skill 0.856.760.0000.6300.836
LearningDI100.76-
Role fulfillmentDI110.817.550.000
Team buildingDI120.817.510.000
Improvisation 0.877.010.0000.6460.845
Innovation space developmentDI130.77-
TimingDI140.837.950.000
Coordination with related partiesDI150.817.830.000
Business PerformanceROAPerf10.76--0.6250.869
EBITDA MarginPerf20.767.400.000
ROICPerf30.848.180.000
Asset GrowthPerf40.787.660.000
Market SharePerf50.787.650.000
Table 5. Hypothesis testing results, Source: Researcher.
NoHyphotesisCoefficient Estimatedt-ValueR2p-ValueConclusion
1Company resources → Digital Innovation0.695.550.4760.000Significant
2Company Resources → Business Performance0.282.140.0780.033Significant
3Digital Innovation → Company Resources0.693.370.4760.001Significant
4Company Resoources → Digital Innovation → Business performance0.342.8990.1160.004Significant
Publisher’s Note: MDPI stays neutral with regard to jurisdictional claims in published maps and institutional affiliations.

