

Social Media Marketing for Small and Medium Enterprise Performance in Uganda: A Structural Equation Model

 , , and
Abstract
1. Introduction
- What are the factors that influence social media marketing in SMEs in Uganda?
- How does social media marketing impact these SMEs’ performance when moderated by age and gender?
2. Theoretical Background and Hypotheses Development
2.1. Theoretical Background
2.2. The Moderating Effect of Demographics
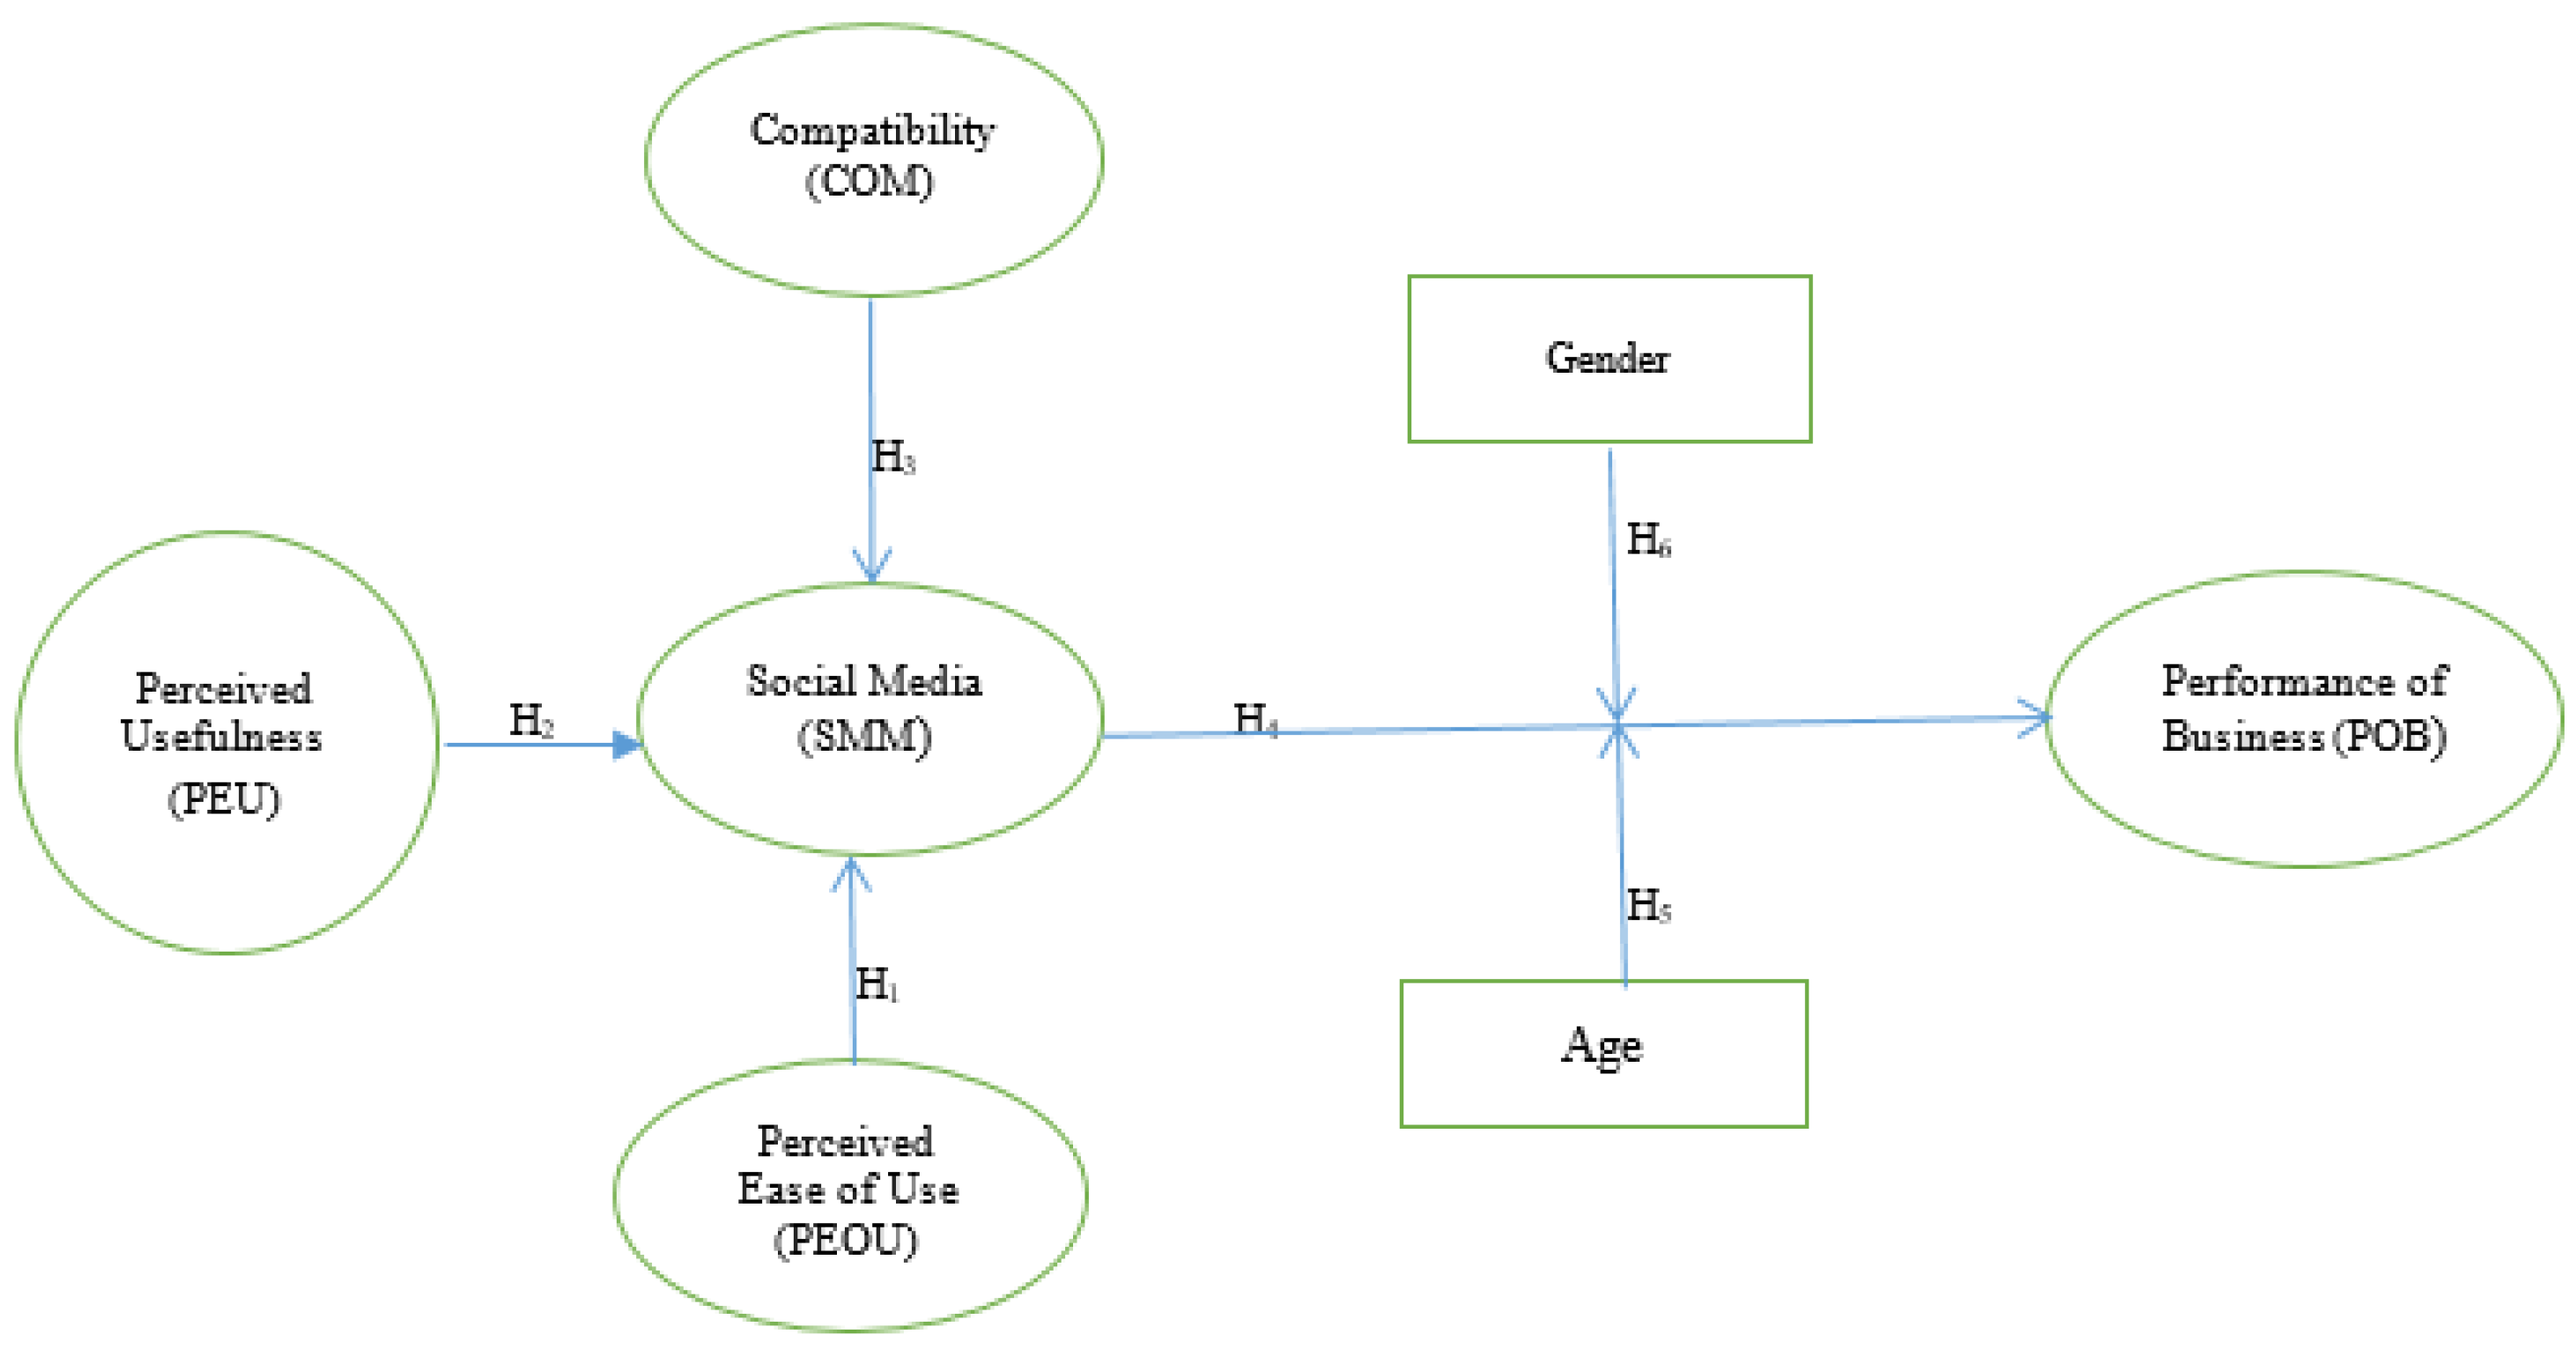
2.3. Development of Hypotheses and Conceptual Model
2.3.1. Perceived Ease of Use (PEOU)
2.3.2. Perceived Usefulness (PEU)
2.3.3. Compatibility (COM)
2.3.4. Social Media Marketing (SMM)
2.4. Hypotheses Development for the Moderating Variables
2.4.1. The Moderating Effect of Age
2.4.2. The Moderating Effect of Gender
3. Research Methodology
3.1. Instrumentation
3.2. Data Collection Strategy
3.3. Test for the Moderation Effect of the Variables
4. Data Analysis and Results
4.1. Descriptive Statistics
Exploratory Factor Analysis (EFA)
4.2. Analysis of the Measurement Model
4.3. Discriminant Validity
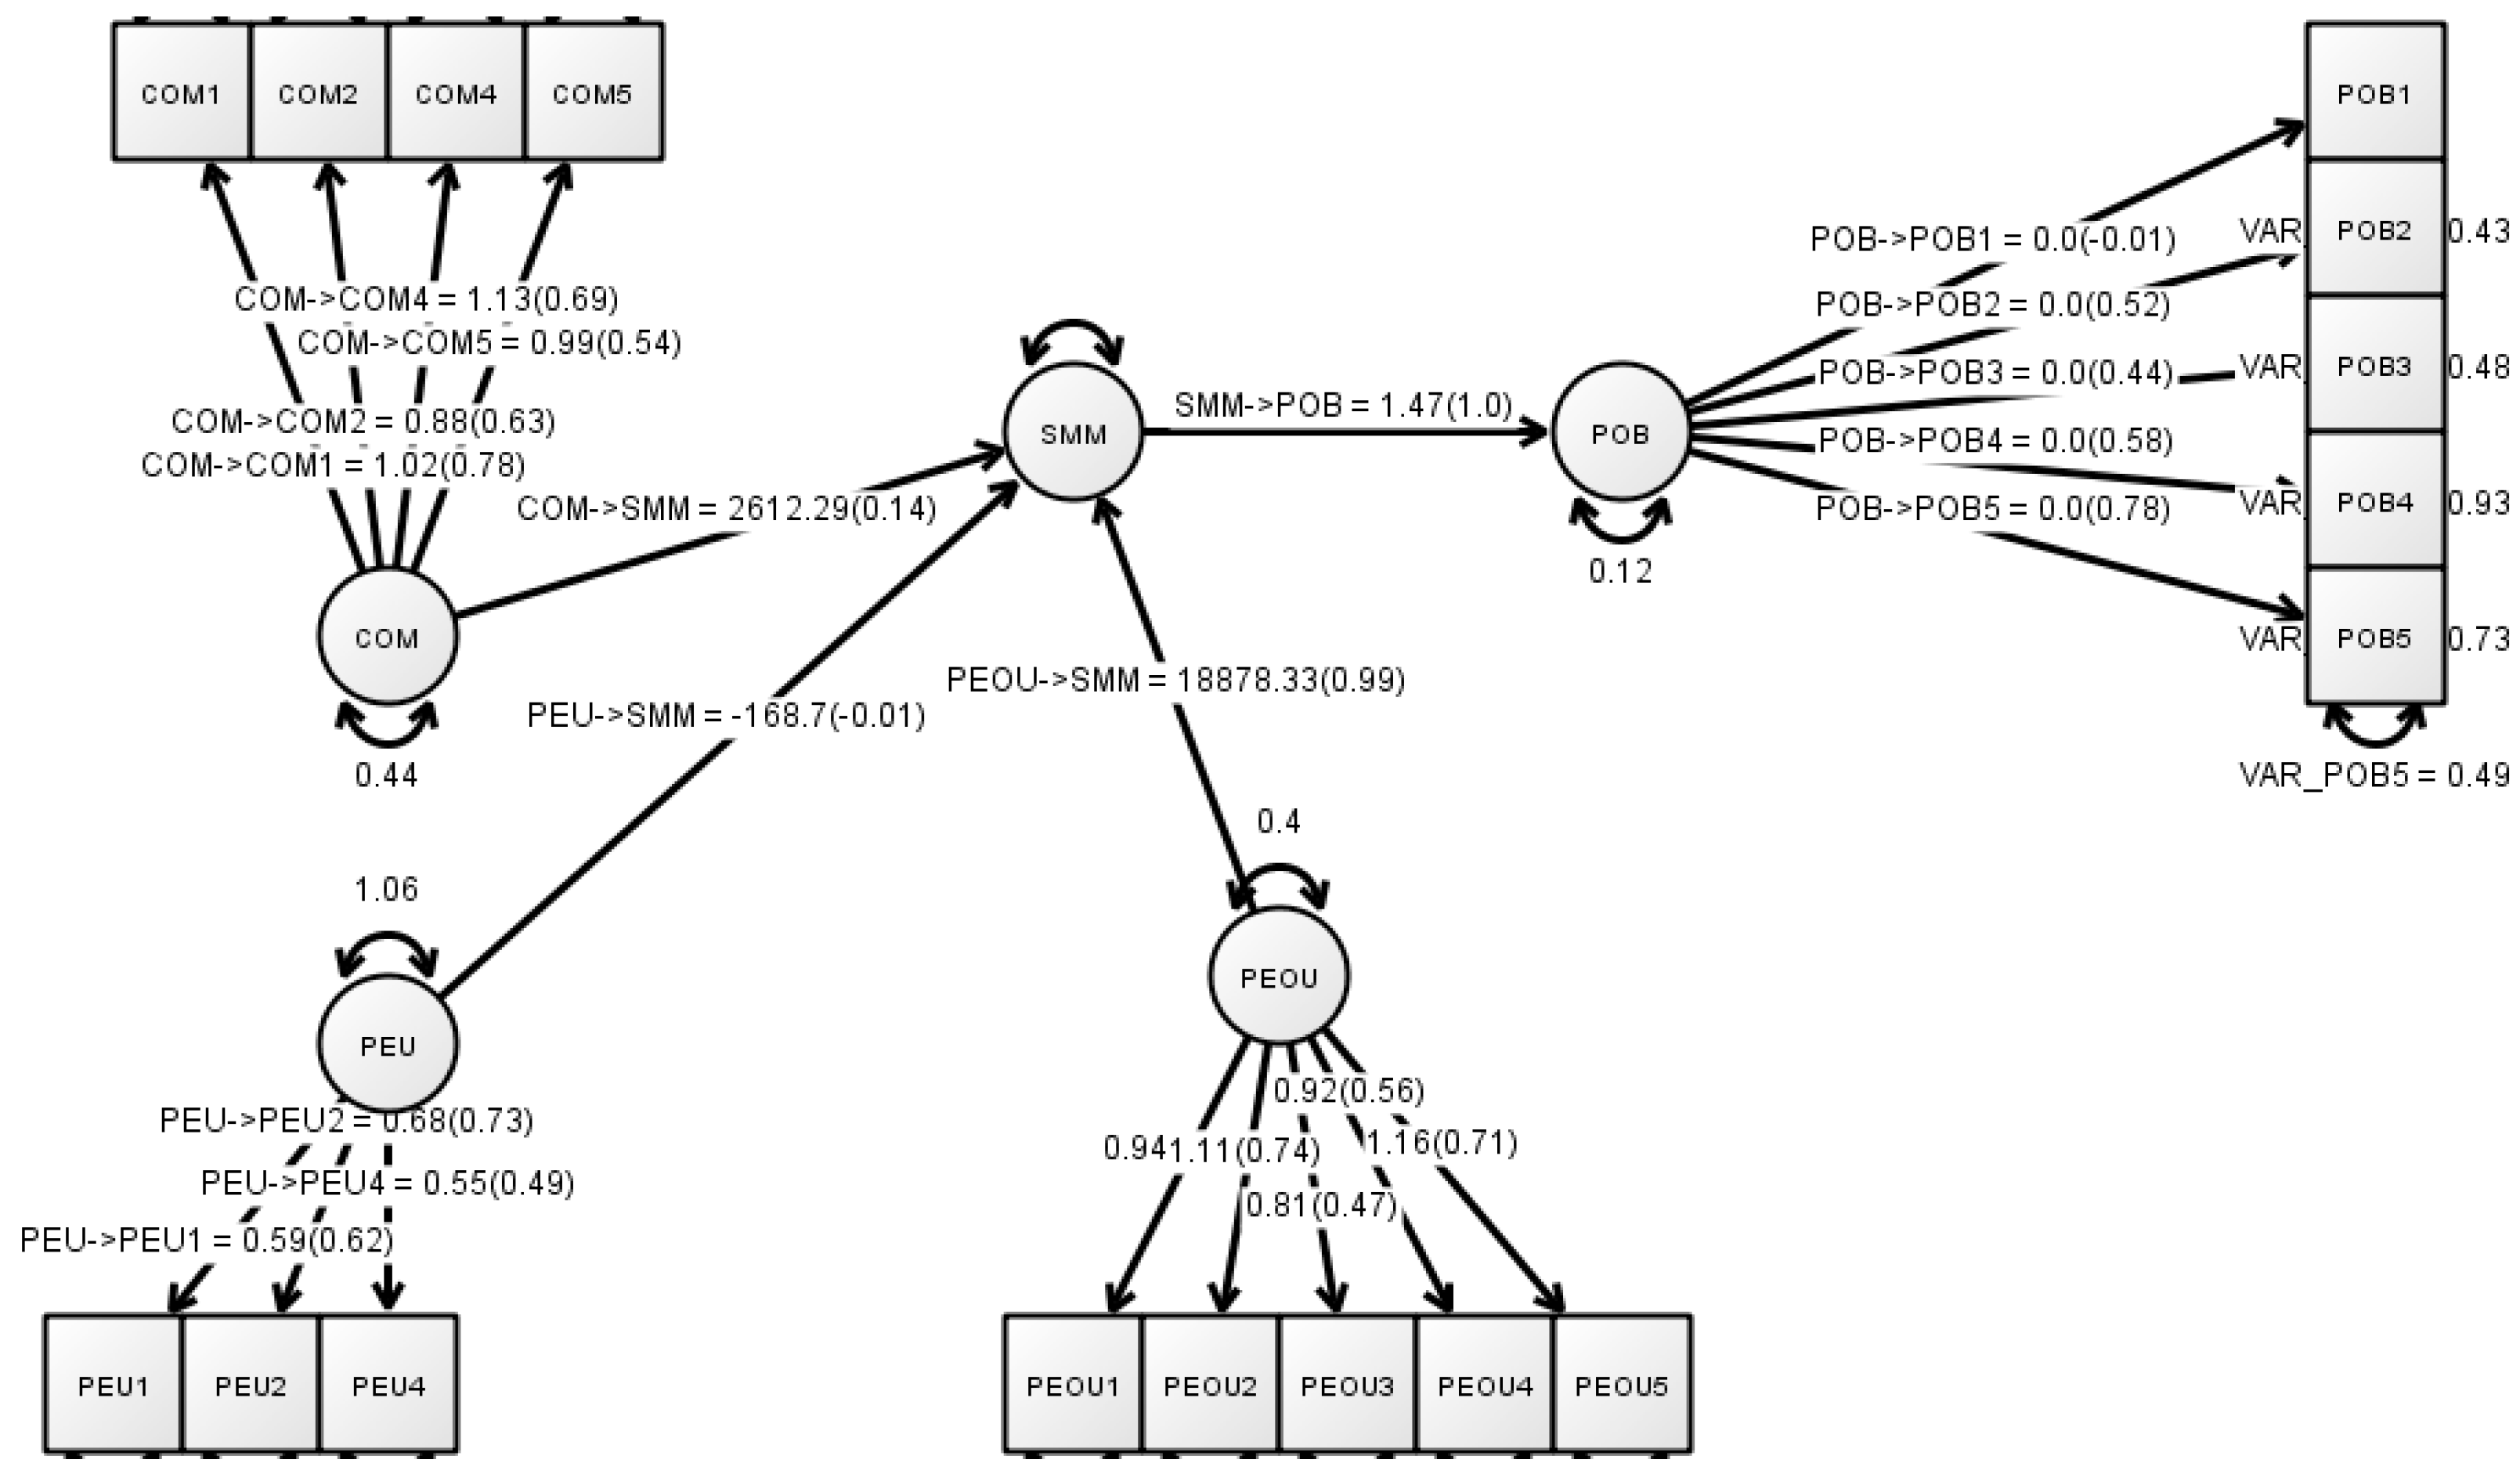
4.4. PLS-SEM Analysis
4.5. Moderation Analysis: SPSS
5. Summary of Results
6. Discussions of Results
6.1. Theoretical Contributions
6.2. Practical Implications
7. Limitations and Directions for Future Research
8. Conclusions
Author Contributions
Funding
Institutional Review Board Statement
Informed Consent Statement
Data Availability Statement
Conflicts of Interest
References
- Bajdor, P.; Pawełoszek, I.; Fidlerova, H. Analysis and assessment of sustainable entrepreneurship practices in Polish small and medium enterprises. Sustainability 2021, 13, 3595. [Google Scholar] [CrossRef]
- Uganda, F. National Small Business Survey of Uganda. Kampala. 2015. Available online: https://www.nathaninc.com/wp-content/uploads/2017/10/National-Small-Business-Survey-report.pdf (accessed on 12 July 2022).
- Sejjaaka, S.; Mindra, R.; Nsereko, I. Leadership traits and business sustainability in Ugandan SMEs: A qualitative analysis. Int. J. Manag. Sci. Bus. Adm. 2015, 1, 42–57. [Google Scholar] [CrossRef]
- Wilfred, N.; Ajanga, M.; Omeke, M.; Tumwine, N.; Nasinyama, M. The impact of microfinance service delivery on the growth of SMEs in Uganda. Int. J. Econ. Commer. Manag. 2013, 3, 229–237. [Google Scholar]
- Ziółkowska, M.J. Digital transformation and marketing activities in small and medium-sized enterprises. Sustainability 2021, 13, 2512. [Google Scholar] [CrossRef]
- Al-Sharafi, M.A.; Arshah, R.A.; Abu-Shanab, E.A. Factors influencing the continuous use of cloud computing services in organization level. In Proceedings of the 2017 International Conference on Advances in Image Processing ICAIP 2017, Bangkok, Thailand, 25–27 August 2017; pp. 189–194. [Google Scholar] [CrossRef]
- Camilleri, M.A.; Kozak, M. Interactive engagement through travel and tourism social media groups: A social facilitation theory perspective. Technol. Soc. 2022, 71, 102098. [Google Scholar] [CrossRef]
- Khan, I. Do brands’ social media marketing activities matter? A moderation analysis. J. Retail. Consum. Serv. 2022, 64, 102794. [Google Scholar] [CrossRef]
- Ssewanyana, J. ICT usage in microfinance institutions in Uganda. Afr. J. Inf. Syst. 2009, 1, 3. [Google Scholar]
- Kyakulumbye, S.; Pather, S. Understanding ICT adoption amongst SMEs in Uganda: Towards a participatory design model to enhance technology diffusion. Afr. J. Sci. Technol. Innov. Dev. 2021, 14, 49–61. [Google Scholar] [CrossRef]
- Rupeika-Apoga, R.; Bule, L.; Petrovska, K. Digital transformation of small and medium enterprises: Aspects of public support. J. Risk Financ. Manag. 2022, 15, 45. [Google Scholar] [CrossRef]
- Chatterjee, S.; Kar, A.; Gupta, M. Success of IoT in smart cities of India: An empirical analysis. Gov. Inf. Q. 2018, 35, 349–361. [Google Scholar] [CrossRef]
- Chatterjee, S.; Kar, A.K. Why do small and medium enterprises use social media marketing and what is the impact: Empirical insights from India. Int. J. Inf. Manag. 2020, 53, 102103. [Google Scholar] [CrossRef]
- Dwivedi, Y.K.; Hughes, D.L.; Carlson, J.; Filieri, R.; Jacobson, J.; Wang, Y. Setting the future of digital and social media marketing research: Perspectives and research propositions. Int. J. Inf. Manag. 2021, 59, 102168. [Google Scholar] [CrossRef]
- Appel, G.; Grewal, L.; Hadi, R.; Stephen, A.T. The future of social media in marketing. J. Acad. Mark. Sci. 2020, 48, 79–95. [Google Scholar] [CrossRef] [PubMed]
- Wang, Z.; Kim, H.G. Can social media marketing improve customer relationship capabilities and firm performance? Dynamic capability perspective. J. Interact. Mark. 2017, 39, 15–26. [Google Scholar] [CrossRef]
- Al-Sharafi, M.A.; Mufadhal, M.E.; Arshah, R.A.; Sahabudin, N.A. Acceptance of online social networks as technology-based education tools among higher institution students: Structural equation modeling approach. Sci. Iran. 2019, 26, 136–144. [Google Scholar] [CrossRef]
- Davis, F.D. Perceived usefulness, perceived ease of use, and user acceptance of information technology. MIS Q. 1989, 13, 319–340. [Google Scholar] [CrossRef]
- Al-Qaysi, N.; Mohamad-Nordin, N.; Al-Emran, M. Employing the technology acceptance model in social media: A systematic review. Educ. Inf. Technol. 2020, 25, 4961–5002. [Google Scholar] [CrossRef]
- Granić, A.; Marangunić, N. Technology acceptance model in educational context: A systematic literature review. Br. J. Educ. Technol. 2019, 50, 2572–2593. [Google Scholar] [CrossRef]
- Venkatesh, V. Adoption and use of AI tools: A research agenda grounded in UTAUT. Ann. Oper. Res. 2022, 308, 641–652. [Google Scholar] [CrossRef]
- Venkatesh, V.; Davis, F.D. A theoretical extension of the technology acceptance model: Four longitudinal field studies. Manag. Sci. 2000, 46, 186–204. [Google Scholar] [CrossRef]
- Verma, S.; Bhattacharyya, S.S.; Kumar, S. An extension of the technology acceptance model in the big data analytics system implementation environment. Inf. Process. Manag. 2018, 54, 791–806. [Google Scholar] [CrossRef]
- Babaee, N. Investigating Effective Factors and Presenting a Practical Guideline to Adoption of Mobile Ticketing. Master’s Thesis, Luleå University of Technology, Luleå, Sweden, 2020. urn:nbn:se:ltu:diva-43549. [Google Scholar]
- Lam, T.; Cho, V.; Qu, H. A study of hotel employee behavioral intentions towards adoption of information technology. Int. J. Hosp. Manag. 2007, 26, 49–65. [Google Scholar] [CrossRef]
- Gangwar, H.; Date, H.; Ramaswamy, R. Understanding determinants of cloud computing adoption using an integrated TAM-TOE model. J. Enterp. Inf. Manag. 2015, 28, 107–130. [Google Scholar] [CrossRef]
- Rogers, E.M. Diffusion of Innovations; Free Press: New York, NY, USA, 1983. [Google Scholar]
- Wonglimpiyarat, J.; Yuberk, N. In support of innovation management and Roger's Innovation Diffusion theory. Gov. Inf. Q. 2005, 22, 411–422. [Google Scholar] [CrossRef]
- Zhang, N.; Guo, X.; Chen, G. IDT-TAM integrated model for IT adoption. Tsinghua Sci. Technol. 2008, 13, 306–311. [Google Scholar] [CrossRef]
- Miller, R.L. Rogers’ innovation diffusion theory (1962, 1995). In Information Seeking Behavior and Technology Adoption: Theories and Trends; IGI Global: Hershey, PA, USA, 2015; pp. 261–274. [Google Scholar]
- Rezaei, R.; Safa, L.; Ganjkhanloo, M.M. Understanding farmers’ ecological conservation behavior regarding the use of integrated pest management-an application of the technology acceptance model. Glob. Ecol. Conserv. 2020, 22, e00941. [Google Scholar] [CrossRef]
- Karlan, D.; Morduch, J. Access to finance. In Handbook of Development Economics; Elsevier: Amsterdam, The Netherlands, 2010; Volume 5, pp. 4703–4784. [Google Scholar] [CrossRef]
- McGoey, L. No Such Thing as a Free Gift: The Gates Foundation and the Price of Philanthropy; Verso Books: Brooklyn, NY, USA, 2015. [Google Scholar]
- Chatterjee, S.; Chaudhuri, R.; Sakka, G.; Grandhi, B.; Galati, A.; Siachou, E.; Vrontis, D. Adoption of Social Media Marketing for Sustainable Business Growth of SMEs in Emerging Economies: The Moderating Role of Leadership Support. Sustainability 2021, 13, 12134. [Google Scholar] [CrossRef]
- Malesev, S.; Cherry, M. Digital and social media marketing-growing market share for construction SMEs. Construct. Econ. Build. 2021, 21, 65–82. [Google Scholar] [CrossRef]
- Kraus, S.; Gast, J.; Schleich, M.; Jones, P.; Ritter, M. Content is king: How SMEs create content for social media marketing under limited resources. J. Macromark. 2019, 39, 415–430. [Google Scholar] [CrossRef]
- Tarsakoo, P.; Charoensukmongkol, P. Dimensions of social media marketing capabilities and their contribution to business performance of firms in Thailand. J. Asia Bus. Stud. 2019, 14, 441–461. [Google Scholar] [CrossRef]
- Thomas, A.; Morris, W.; Haven-Tang, C.; Francis, M.; Byard, P. Smart systems and collaborative innovation networks for productivity improvement in SMEs. J. Open Innov. Technol. Mark. Compl. 2021, 7, 3. [Google Scholar] [CrossRef]
- Wang, W.Y.; Pauleen, D.J.; Zhang, T. How social media applications affect B2B communication and improve business performance in SMEs. Ind. Mark. Manag. 2016, 54, 4–14. [Google Scholar] [CrossRef]
- Chawla, D.; Joshi, H. The moderating effect of demographic variables on mobile banking adoption: An empirical investigation. Glob. Bus. Rev. 2018, 19, S90–S113. [Google Scholar] [CrossRef]
- Dahnil, M.I.; Marzuki, K.M.; Langgat, J.; Fabeil, N.F. Factors influencing SMEs adoption of social media marketing. Procedia Soc. Behav. Sci. 2014, 148, 119–126. [Google Scholar] [CrossRef]
- Pal, D.; Vanijja, V. Perceived usability evaluation of Microsoft Teams as an online learning platform during COVID-19 using system usability scale and technology acceptance model in India. Child. Youth Serv. Rev. 2020, 119, 105535. [Google Scholar] [CrossRef] [PubMed]
- Davis, F.; Bagozzi, R.; Warshaw, P. User acceptance of computer technology: A comparison of two theoretical models. Manag. Sci. 1989, 35, 982–1003. [Google Scholar] [CrossRef]
- Gefen, D.; Straub, D.W. Gender differences in the perception and use of e-mail: An extension to the technology acceptance model. MIS Q. 1997, 21, 389–400. [Google Scholar] [CrossRef]
- Martins, C.; Oliveira, T.; Popovič, A. Understanding the Internet banking adoption: A unified theory of acceptance and use of technology and perceived risk application. Int. J. Inf. Manag. 2014, 34, 1–13. [Google Scholar] [CrossRef]
- Natarajan, T.; Balasubramanian, S.A.; Kasilingam, D.L. The moderating role of device type and age of users on the intention to use mobile shopping applications. Technol. Soc. 2018, 53, 79–90. [Google Scholar] [CrossRef]
- Chatterjee, S.; Chaudhuri, R.; Vrontis, D.; Basile, G. Digital transformation and entrepreneurship process in SMEs of India: A moderating role of adoption of AI-CRM capability and strategic planning. J. Strategy Manag. 2021, 15, 416–433. [Google Scholar] [CrossRef]
- Syaifullah, J.; Syaifudin, M.; Sukendar, M.U.; Junaedi, J. Social media marketing and business performance of MSMEs during the COVID-19 pandemic. J. Asian Financ. Econ. Bus. 2021, 8, 523–531. [Google Scholar] [CrossRef]
- Oliveira, T.; Thomas, M.; Baptista, G.; Campos, F. Mobile payment: Understanding the determinants of customer adoption and intention to recommend the technology. Comput. Hum. Behav. 2016, 61, 404–414. [Google Scholar] [CrossRef]
- Sánchez-Mena, A.; Martí-Parreño, J.; Aldás-Manzano, J. The Effect of Age on Teachers’ Intention to Use Educational Video Games: A TAM Approach. Electron. J. E Learn. 2017, 15, 355–366. [Google Scholar]
- Oztemel, E.; Gursev, S. Literature review of Industry 4.0 and related technologies. J. Intell. Manuf. 2020, 31, 127–182. [Google Scholar] [CrossRef]
- Ma, Q.; Chan, A.H.; Chen, K. Personal and other factors affecting acceptance of smartphone technology by older Chinese adults. Appl. Ergon. 2016, 54, 62–71. [Google Scholar] [CrossRef]
- Narwane, V.S.; Raut, R.D.; Mangla, S.K.; Gardas, B.B.; Narkhede, B.E.; Awasthi, A.; Priyadarshinee, P. Mediating role of cloud of things in improving performance of small and medium enterprises in the Indian context. Ann. Oper. Res. 2020, 1–30. [Google Scholar] [CrossRef]
- Rugova, B.; Prenaj, B. Social Media as Marketing Tool for SMEs: Opportunities and Challenges. Acad. J. Bus. 2016, 2, 85–97. Available online: https://www.iipccl.org (accessed on 9 July 2022).
- Lu, Y.; Yang, S.; Chau, P.Y.; Cao, Y. Dynamics between the trust transfer process and intention to use mobile payment services: A cross-environment perspective. Inf. Manag. 2011, 48, 393–403. [Google Scholar] [CrossRef]
- Chakraborty, D. Elements impacting the adoption of m-app among the travel companies in India. Int. J. Bus. Excell. 2021, 24, 68–83. [Google Scholar] [CrossRef]
- Qalati, S.A.; Yuan, L.W.; Khan, M.A.S.; Anwar, F. A mediated model on the adoption of social media and SMEs’ performance in developing countries. Technol. Soc. 2021, 64, 101513. [Google Scholar] [CrossRef]
- Gretzel, U.; Yuan, Y.L.; Fesenmaier, D.R. Preparing for the new economy: Advertising strategies and change in destination marketing organizations. J. Travel Res. 2000, 39, 146–156. [Google Scholar] [CrossRef]
- Wu, F.; Yeniyurt, S.; Kim, D.; Cavusgil, S.T. The impact of information technology on supply chain capabilities and firm performance: A resource-based view. Ind. Mark. Manag. 2006, 35, 493–504. [Google Scholar] [CrossRef]
- Paris, C.; Lee, W.; Seery, P. The role of social media in promoting special events: Acceptance of facebook’ Events’. Inf. Commun. Technol. Tour. 2010, 14, 531–541. [Google Scholar] [CrossRef]
- Elbanna, A.; Bunker, D.; Levine, L.; Sleigh, A. Emergency management in the changing world of social media: Framing the research agenda with the stakeholders through engaged scholarship. Int. J. Inf. Manag. 2019, 47, 112–120. [Google Scholar] [CrossRef]
- Rana, N.P.; Barnard, B.J.; Baabdullah, A.M.A.; Rees, D.; Roderick, S. Exploring barriers of m-commerce adoption in SMEs in the UK: Developing a framework using ISM. Int. J. Inf. Manag. 2019, 44, 141–153. [Google Scholar] [CrossRef]
- Allen, M. The Sage Encyclopedia of Communication Research Methods; SAGE: Thousand Oaks, CA, USA, 2017; Volume 1–4. [Google Scholar] [CrossRef]
- Im, S.; Bayus, B.L.; Mason, C.H. An empirical study of innate consumer innovativeness, personal characteristics, and new-product adoption behavior. J. Acad. Mark. Sci. 2003, 31, 61–73. [Google Scholar] [CrossRef]
- Yi, Y.D.; Wu, Z.; Tung, L.L. How individual differences influence technology usage behaviour? Toward an integrated framework. J. Comput. Inf. Syst. 2005, 46, 52–63. [Google Scholar]
- Putu, I.; Rasmini, N.; Budiartha, I.; Widanaputra, A.A.G.P. The mediating effect of auditor dysfunctional behavior on Machiavellian character and time budget pressure of audit quality. Accounting 2020, 6, 1093–1102. [Google Scholar] [CrossRef]
- Hoque, A.S.M.M.; Siddiqui, B.A.; Awang, Z.; Baharu, S.M.A.T. Exploratory Factor Analysis of Entrepreneurial Orientation in the Context of Bangladeshi Small and Medium Enterprises (SMEs). Eur. J. Manag. Mark. Stud. 2018, 3, 81–94. [Google Scholar]
- Latif, K.F.; Sajjad, A. Measuring corporate social responsibility: A critical review of survey instruments. Corp. Soc. Responsib. Environ. Manag. 2018, 25, 1174–1197. [Google Scholar] [CrossRef]
- Vasileiou, K.; Barnett, J.; Thorpe, S.; Young, T. Characterising and justifying sample size sufficiency in interview-based studies: Systematic analysis of qualitative health research over a 15-year period. BMC Med. Res. Methodol. 2018, 18, 1–18. [Google Scholar] [CrossRef] [PubMed]
- Kyriazos, T.A. Applied psychometrics: Sample size and sample power considerations in factor analysis (EFA, CFA) and SEM in general. Psychology 2018, 9, 2207. [Google Scholar] [CrossRef]
- Bürkner, P.C. Bayesian item response modeling in R with brms and Stan. arXiv 2019, arXiv:1905.09501. [Google Scholar]
- Rosen, B. On sampling with probability proportional to size. J. Stat. Plan. Inference 1997, 62, 159–191. [Google Scholar] [CrossRef]
- Sarstedt, M.; Bengart, P.; Shaltoni, A.M.; Lehmann, S. The use of sampling methods in advertising research: A gap between theory and practice. Int. J. Advert. 2018, 37, 650–663. [Google Scholar] [CrossRef]
- Mundfrom, D.J.; Shaw, D.G.; Ke, T.L. Minimum sample size recommendations for conducting factor analyses. Int. J. Test. 2005, 5, 159–168. [Google Scholar] [CrossRef]
- Chen, I.J.; Paulraj, A. Towards a theory of supply chain management: The constructs and measurements. J. Oper. Manag. 2004, 22, 119–150. [Google Scholar] [CrossRef]
- Saidi, S.S.; Siew, N.M. Reliability and Validity Analysis of Statistical Reasoning Test Survey Instrument Using the Rasch Measurement Model. Int. Electron. J. Math. Educ. 2019, 14, 535–546. [Google Scholar]
- Hair, J.; Black, W.C., Jr.; Babin, B.J.; Anderson, R.E. Multivariate Data Analysis, 7th ed.; Prentice Hall: Upper Saddle River, NJ, USA, 2010. [Google Scholar]
- Netemeyer, R.G.; Bearden, W.O.; Sharma, S. Scaling Procedures: ISSUES and Applications; Wise Publications: Sulphur, LA, USA, 2003. [Google Scholar]
- Brunner, M.; SÜβ, H.M. Analyzing the reliability of multidimensional measures: An example from intelligence research. Educ. Psychol. Meas. 2005, 65, 227–240. [Google Scholar] [CrossRef]
- Tyndall, I.; Waldeck, D.; Pancani, L.; Whelan, R.; Roche, B.; Dawson, D.L. The Acceptance and Action Questionnaire-II (AAQ-II) as a measure of experiential avoidance: Concerns over discriminant validity. J. Context. Behav. Sci. 2019, 12, 278–284. [Google Scholar] [CrossRef]
- Castanho Silva, B.; Jungkunz, S.; Helbling, M.; Littvay, L. An empirical comparison of seven populist attitudes scales. Political Res. Q. 2020, 73, 409–424. [Google Scholar] [CrossRef]
- McNeish, D.; Wolf, M.G. Thinking twice about sum scores. Behav. Res. Methods 2020, 52, 2287–2305. [Google Scholar] [CrossRef] [PubMed]
- Rhemtulla, M.; van Bork, R.; Borsboom, D. Worse than measurement error: Consequences of inappropriate latent variable measurement models. Psychol. Methods 2020, 25, 30–45. [Google Scholar] [CrossRef] [PubMed]
- Hilkenmeier, F.; Bohndick, C.; Bohndick, T.; Hilkenmeier, J. Assessing distinctiveness in multidimensional instruments without access to raw data–a manifest Fornell-Larcker criterion. Front. Psychol. 2020, 11, 223. [Google Scholar] [CrossRef]
- Henseler, J.; Ringle, C.M.; Sarstedt, M. A new criterion for assessing discriminant validity in variance-based structural equation modeling. J. Acad. Mark. Sci. 2015, 43, 115–135. [Google Scholar] [CrossRef]
- Hair, J.F.; Hult, G.T.M.; Ringle, C.M.; Sarstedt, M. A Primer on Partial Least Squares Structural Equation Modeling (PLS-SEM), 3rd ed.; Sage: Thousand Oakes, CA, USA, 2022. [Google Scholar]
- Sarstedt, M.; Ringle, C.M.; Smith, D.; Reams, R.; Hair, J.F., Jr. Partial least squares structural equation modeling (PLS-SEM): A useful tool for family business researchers. J. Fam. Bus. Strategy 2014, 5, 105–115. [Google Scholar] [CrossRef]
- Ringle, C.M.; Wende, S.; Becker, J.-M. SmartPLS 4; Boenningstedt: SmartPLS; SmartPLS GmbH: Oststeinbek, Germany, 2020; Available online: https://www.smartpls.com (accessed on 9 July 2022).
- Kline, R.B. Principles and Practice of Structural Equation Modeling; Guilford Publications: New York, NY, USA, 2015. [Google Scholar]
- Arnold, H.J. Moderator variables: A clarification of conceptual, analytic, and psychometric issues. Org. Behav. Hum. Perform. 1982, 29, 143–174. [Google Scholar] [CrossRef]
- Little, T.D.; Card, N.A.; Bovaird, J.A.; Preacher, K.J.; Crandall, C.S. Structural equation modeling of mediation and moderation with contextual factors. Model. Context. Eff. Longitud. Stud. 2007, 1, 207–230. [Google Scholar]
- Aguinis, H. Regression Analysis for Categorical Moderators; Guilford Press: New York, NY, USA, 2004. [Google Scholar]


| Gender. | Categories | #(%) | Years # (%) | |
|---|---|---|---|---|
| Female | ||||
| 18–23 | 6(9.8) |
| 1–3 22(35.0) |
| 24–29 | 18(29.5) | 4–6 19(30.6) | ||
| 30–35 | 22(36.1) | 7–10 13(21.0) | ||
| 36–41 | 15(24.6) | >11 8(12.9) | ||
| O_level | 8(1.9) | ||
| A_level | 10(16.1) | |||
| Diploma | 20(32.3) | |||
| Degree | 23(37.1) | |||
| Others | 1(1.6) | |||
| Male | ||||
| 18–23 | 6(6.6) |
| 1–3 23(25.3) |
| 24–29 | 31(34.1) | 4–6 28(30.8) | ||
| 30–35 | 39(42.9) | 7–10 24(26.4) | ||
| 36–41 | 15(16.5) | >11 16(17.6) | ||
| O_level | 9(9.9) | ||
| A_level | 14(15.4) | |||
| Diploma | 20(22.0) | |||
| Degree | 46(50.5) | |||
| Others | 2(2.2) |
| Construct/Item | Loading | Cronbach’s Alpha | Composite Reliability (CR) > 0.6 | Average Variance Extracted (AVE) > 0.5 |
|---|---|---|---|---|
| Compatibility (COM) | 0.754 | 0.625 | 0.692 | |
| COM1 | 0.658 | |||
| COM2 | 0.556 | |||
| COM3 | 0.663 | |||
| COM4 | 0.596 | |||
| COM5 | 0.629 | |||
| Perceived usefulness (PEU) | 0.654 | 0.619 | 0.722 | |
| PEU1 | 0.590 | |||
| PEU2 | 0.579 | |||
| PEU3 | 0.463 | |||
| PEU4 | 0.445 | |||
| Perceived ease of use (PEOU) | 0.750 | 0.781 | 0.678 | |
| PEOU1 | 0.559 | |||
| PEOU2 | 0.858 | |||
| PEOU3 | 0.919 | |||
| PEOU4 | 0.956 | |||
| PEOU5 | 0.935 | |||
| Performance of business (POB) | 0.682 | 0.845 | 0.775 | |
| POB1 | 0.322 | |||
| POB2 | 0.858 | |||
| POB3 | 0.944 | |||
| POB4 | 0.901 | |||
| POB5 | 0.967 | |||
| Social media marketing (SMM) | 0.723 | 0.802 | 0.765 | |
| SMM1 | 0.78 | |||
| SMM2 | 0.75 | |||
| SMM3 | 0.77 |
| Latent Variable | COM_AV | PEU_AV | PEOU_AV | POB_AV | AVE |
|---|---|---|---|---|---|
| COM_AV | 0.882 | 0.692 | |||
| PEU_AV | 0.624 ** | 0.850 | 0.722 | ||
| PEOU_AV | 0.636 ** | 0.742 ** | 0.823 | 0.678 | |
| POB_AV | 0.596 ** | 0.668 ** | 0.929 ** | 0.880 | 0.775 |
| Latent Variable | COM | PEU | PEOU | POB |
|---|---|---|---|---|
| COM | - | |||
| PEU | 0.94 | - | ||
| PEOU | 0.70 | 0.92 | - | |
| POB | 0.78 | 0.91 | 0.82 |
| Fit Indices | Threshold Values | Model Values Obtained |
|---|---|---|
| Chi-square ( | Its p-value should be >0.05 | 0.064 |
| Root mean square error of approximation (RMSEA) | ≤0.05 | 0.002 |
| Comparative fit index (CFI) | >0.90 (Fan et al., 1999) | 0.936 |
| Root mean square residual (RMSR) | <0.06 or 0.08 | 0.027 |
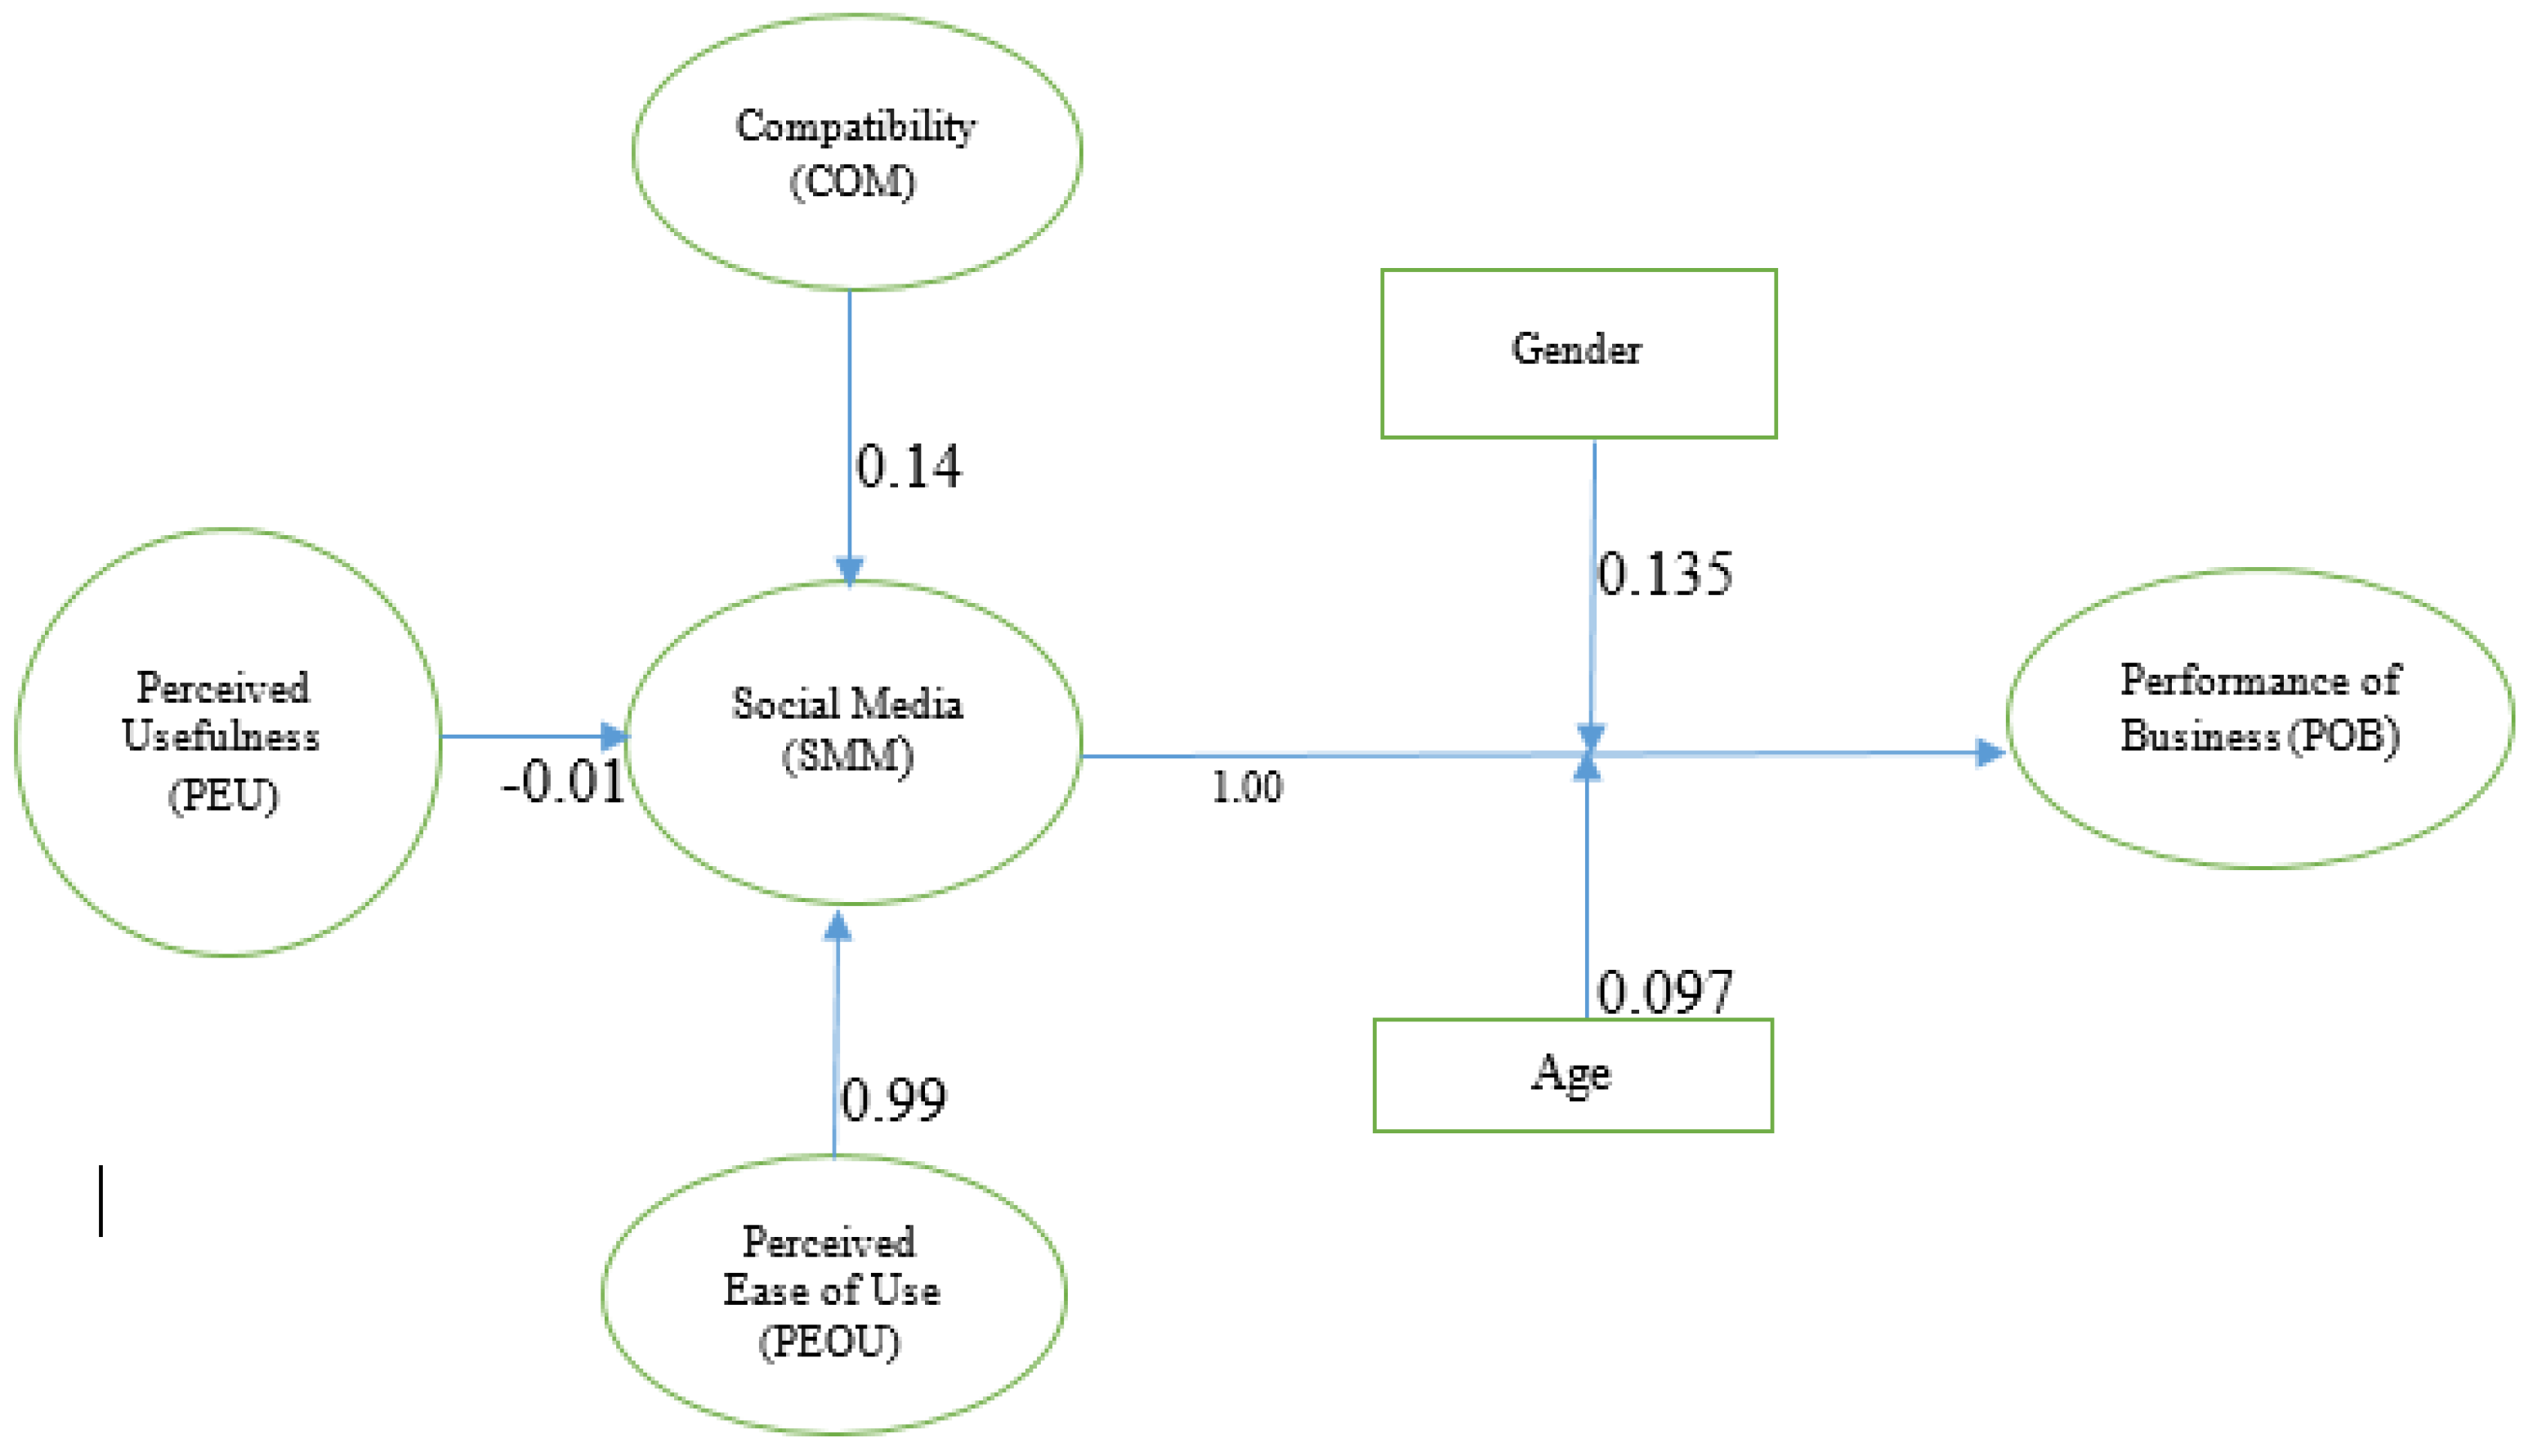
| Path | Hypothesis | Path Coefficient | p-Value | Remark |
|---|---|---|---|---|
| PEOU → SMM | H1 | 0.99 | * (p < 0.05) | supported |
| PEU → SMM | H2 | −0.01 | ** (p < 0.01) | supported |
| COM → SMM | H3 | 0.14 | ** (p < 0.01) | supported |
| SMM → POB | H4 | 1.00 | ** (p < 0.01) | supported |
| Model | Sum of Squares | df | Mean Square | F | Sig. | |
|---|---|---|---|---|---|---|
| 1 | Regression | 45.210 | 3 | 15.070 | 256.639 | 0.000 b |
| Residual | 8.749 | 149 | 0.059 | |||
| Total | 53.960 | 152 | ||||
| Model | Unstandardized Coefficients | Standardized Coefficients | t | Sig. | Collinearity Statistics | |||
|---|---|---|---|---|---|---|---|---|
| B | Std. Error | Beta | Tolerance | VIF | ||||
| 1 | (Constant) | 0.276 | 0.096 | 2.884 | 0.005 | |||
| PEOU_AV | 0.774 | 0.042 | 0.951 | 18.303 | 0.000 | 0.392 | 2.553 | |
| GENDER | 0.068 | 0.050 | 0.056 | 1.364 | 0.175 | 0.620 | 1.614 | |
| COM_AV | 0.053 | 0.038 | 0.064 | 1.403 | 0.163 | 0.504 | 1.984 | |
| PEU_AV | −0.001 | 0.043 | −0.001 | −0.015 | 0.988 | 0.382 | 2.620 | |
| Interaction_gender | −0.007 | 0.003 | −0.135 | −2.484 | 0.014 | 0.357 | 2.799 | |
| Model | Unstandardized Coefficients | Standardized Coefficients | t | Sig. | Collinearity Statistics | |||
|---|---|---|---|---|---|---|---|---|
| B | Std. Error | Beta | Tolerance | VIF | ||||
| 1 | (Constant) | 0.438 | 0.069 | 6.357 | 0.000 | |||
| COM_AV | 0.030 | 0.037 | 0.036 | 0.798 | 0.426 | 0.537 | 1.863 | |
| PEU_AV | −0.046 | 0.042 | −0.055 | −1.080 | 0.282 | 0.407 | 2.455 | |
| PEOU_AV | 0.758 | 0.042 | 0.932 | 18.259 | 0.000 | 0.410 | 2.439 | |
| AGECAT1 | −0.074 | 0.121 | −0.033 | −0.610 | 0.543 | 0.354 | 2.825 | |
| Interaction_Agecat1 | 0.027 | 0.015 | 0.097 | 1.768 | 0.079 | 0.358 | 2.795 | |
| Model | Unstandardized Coefficients | Standardized Coefficients | t | Sig. | Collinearity Statistics | |||
|---|---|---|---|---|---|---|---|---|
| B | Std. Error | Beta | Tolerance | VIF | ||||
| 1 | (Constant) | 0.472 | 0.078 | 6.018 | 0.000 | |||
| COM_AV | 0.023 | 0.038 | 0.028 | 0.623 | 0.534 | 0.533 | 1.875 | |
| PEU_AV | −0.039 | 0.043 | −0.047 | −0.914 | 0.362 | 0.406 | 2.462 | |
| PEOU_AV | 0.747 | 0.042 | 0.917 | 17.694 | 0.000 | 0.408 | 2.453 | |
| AGECAT2 | −0.060 | 0.068 | −0.047 | −0.894 | 0.373 | 0.389 | 2.573 | |
| Interaction_Agecat2 | 0.006 | 0.006 | 0.052 | 0.989 | 0.324 | 0.395 | 2.534 | |
| Model | Unstandardized Coefficients | Standardized Coefficients | t | Sig. | Collinearity Statistics | |||
|---|---|---|---|---|---|---|---|---|
| B | Std. Error | Beta | Tolerance | VIF | ||||
| 1 | (Constant) | 0.411 | 0.086 | 4.786 | 0.000 | |||
| COM_AV | 0.031 | 0.038 | 0.037 | 0.807 | 0.421 | 0.529 | 1.889 | |
| PEU_AV | −0.030 | 0.043 | −0.036 | −0.687 | 0.493 | 0.402 | 2.487 | |
| PEOU_AV | 0.762 | 0.044 | 0.936 | 17.167 | 0.000 | 0.369 | 2.708 | |
| AGECAT3 | −0.002 | 0.051 | −0.002 | −0.041 | 0.967 | 0.618 | 1.619 | |
| Interaction_Agecat3 | −0.002 | 0.003 | −0.032 | −0.617 | 0.538 | 0.419 | 2.389 | |
Publisher’s Note: MDPI stays neutral with regard to jurisdictional claims in published maps and institutional affiliations. |
© 2022 by the authors. Licensee MDPI, Basel, Switzerland. This article is an open access article distributed under the terms and conditions of the Creative Commons Attribution (CC BY) license (https://creativecommons.org/licenses/by/4.0/).
Share and Cite
Kikawa, C.R.; Kiconco, C.; Agaba, M.; Ntirampeba, D.; Ssematimba, A.; Kalema, B.M. Social Media Marketing for Small and Medium Enterprise Performance in Uganda: A Structural Equation Model. Sustainability 2022, 14, 14391. https://doi.org/10.3390/su142114391
Kikawa CR, Kiconco C, Agaba M, Ntirampeba D, Ssematimba A, Kalema BM. Social Media Marketing for Small and Medium Enterprise Performance in Uganda: A Structural Equation Model. Sustainability. 2022; 14(21):14391. https://doi.org/10.3390/su142114391
Chicago/Turabian StyleKikawa, Cliff R., Charity Kiconco, Moses Agaba, Dimas Ntirampeba, Amos Ssematimba, and Billy M. Kalema. 2022. "Social Media Marketing for Small and Medium Enterprise Performance in Uganda: A Structural Equation Model" Sustainability 14, no. 21: 14391. https://doi.org/10.3390/su142114391
APA StyleKikawa, C. R., Kiconco, C., Agaba, M., Ntirampeba, D., Ssematimba, A., & Kalema, B. M. (2022). Social Media Marketing for Small and Medium Enterprise Performance in Uganda: A Structural Equation Model. Sustainability, 14(21), 14391. https://doi.org/10.3390/su142114391