Abstract
The growing number of security threats has prompted the use of a variety of security techniques. The most common security tools for identifying and tracking intruders across diverse network domains are intrusion detection systems. Machine Learning classifiers have begun to be used in the detection of threats, thus increasing the intrusion detection systems’ performance. In this paper, the investigation model for an intrusion detection systems model based on the Principal Component Analysis feature selection technique and a different Support Vector Machine kernels classifier is present. The impact of various kernel functions used in Support Vector Machines, namely linear, polynomial, Gaussian radial basis function, and Sigmoid, is investigated. The performance of the investigation model is measured in terms of detection accuracy, True Positive, True Negative, Precision, Sensitivity, and F-measure to choose an appropriate kernel function for the Support Vector Machine. The investigation model was examined and evaluated using the KDD Cup’99 and UNSW-NB15 datasets. The obtained results prove that the Gaussian radial basis function kernel is superior to the linear, polynomial, and sigmoid kernels in both used datasets. Obtained accuracy, Sensitivity, and, F-measure of the Gaussian radial basis function kernel for KDD CUP’99 were 99.11%, 98.97%, and 99.03%. for UNSW-NB15 datasets were 93.94%, 93.23%, and 94.44%.
1. Introduction
Computer attacks are growing not only in number, but also in variety as the Internet continues to expand data exchange [1,2]. Antiviruses and firewalls can no longer guarantee the security of a wire and wireless network [3,4,5], which should be protected using multiple layers of security. An Intrusion Detection System (IDS) is the most prevalent critical layer, designed to protect its target from any possible attack by continuously monitoring computer applications. Signature-based detection (also known as “misuse detection”), anomaly detection, and hybrid IDS are the three main types of IDS [6,7]. In signature-based detection, the IDS [8,9] compares the data it collects to known attack patterns. This technique is very successful and accurate, but can only detect known attacks that have been previously recorded in a database. Anomaly detection creates a model of the system’s normal behavior before looking for anomalies in the monitored data. As a result, this method can detect unknown attacks, but it frequently produces a large number of false alarms. Hybrid IDS schemes attempt to effectively combine anomaly detection and misuse detection approaches, taking into account the relevance and difficulty of the IDS operations. Several Machine Learning (ML) techniques for IDS signature-based, IDS anomaly-based and IDS hybrid-based detection have been proposed to provide realistic IDS approaches with high detection accuracy rate [6,10,11]. Supervised, unsupervised, and semi-supervised learning are the three main types of Machine Learning techniques focused on the use of labeled data. There are numerous ML algorithms, but Support Vector Machine (SVM) [12,13] is the most common. SVM classifies data by defining a collection of support vectors, which are members of the named training data samples, which are based on statistical learning theory. An SVM’s primary goal is to find the best hyperplane for classifying new data points. For the classification of non-linear data samples, SVM classifiers may use a variety of kernel functions such as Linear, polynomial, Gaussian radial basis function (RBF), and sigmoid [14].
Feature selection. One of the main issues in IDS, which enhances classification efficiency by locating the subset of features that best classify the data. Some of the features may be redundant or unnecessary, so removing them is critical; otherwise, the classifier output may not be accurate. One of the most frequently used techniques for selecting features is Principal Component Analysis (PCA). PCA is an unsupervised ML algorithm, a non-parametric statistical technique that is mostly utilized in ML to reduce dimensionality [15]. It is widely used to reduce a large collection of variables into a smaller set that preserves the majority of the bigger set’s features. PCA offers many benefits, such as [16] eliminating feature duplication, delivering the highest possible resolution, and boosting computing efficiency while reducing complexity.
IDS is a crucial component of the active security defense against intrusion in the cloud computing system. Cloud IDS aims to capture and process data traffic from a virtual environment. Figure 1 shows the cloud platform for IDS. To create Cloud IDS, it is imperative to use an efficient classification approach and a feature selection algorithm.
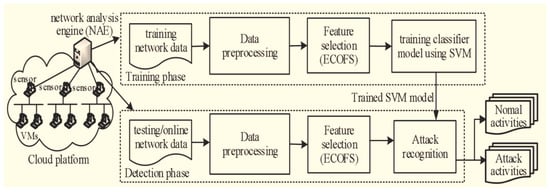
Figure 1.
Cloud platform for IDS [17].
Internet of Things (IoT) technology is still in its infancy and has not reached its full security control maturity [18,19,20]. IoT systems face several security risks [21]. The IoT community has not adopted any standards-based cybersecurity strategy. As IoT use grows, the number of attacks will also increase. Among the most typical attacks launched against IoT systems are Denial of Service (DoS) [22], Distributed Denial of Service (DDoS) [23,24,25], Jamming [13,26], and Man in the Middle. IDS is a technique used to identify various IoT threats and address privacy and security concerns. IDS keeps track of internet activity across connected IoT devices. It provides a line of defense, assessing the risks and defending the network from unauthorized users and malicious activities.
The following points provide a summary of the research’s contributions:
- The study provides a model for IDS using PCA that decreases the number of selected features and enhances IDS performance based on the KDD Cup ‘99 and UNSW-NB15 datasets.
- The study evaluates the reduced dataset of the model using the linear, polynomial, Gaussian radial basis, and sigmoid kernel functions employed on SVM. results prove that the Gaussian radial basis outperformed other functions.
The remainder of the paper is organized as follows: The background and related works are discussed in Section 2. Section 3 goes into detail about the investigation model. The datasets, performance evaluation matrices, and results interpretation are all explained in Section 4. Finally, in Section 5, we explain our work’s conclusion and future works.
The most frequently used abbreviations in this paper are shown in Table 1.

Table 1.
List of abbreviations.
2. Background and Related Works
This section covers the fundamental concepts of the IDS, SVM classifiers, PCA, and related works.
2.1. Intrusion Detection Systems
Compromising the confidentiality, integrity, or availability of any network component, an intrusion is a harmful act that aims to violate the security policy of the network. [27]. IDS is a defense system that automatically monitors the activities on a computer system or network to identify breaches and then notify the user. The components of a general IDS are shown in Figure 2.
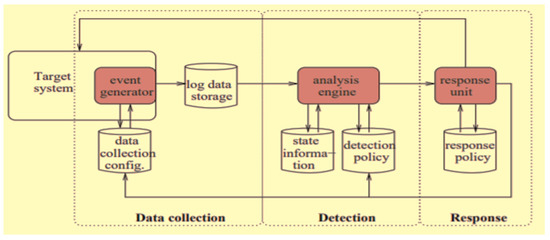
Figure 2.
Components of a general IDS [28].
IDS operates in three stages [29]: data collection, detection, and response stages. In the data collection stage, log data are used to create events. The data obtained by the target system are used to create these log data. Network traffic, operating system logs, and device logs are all examples of data sources. In the detection stage, the detection algorithm is implemented by the analysis engine. A variety of scripts are used to match text strings that are specific to different intrusions. The detection stage aims to help the detection system tell the difference between normal and abnormal activity in the target system. Finally, the response stage receives information about events identified as normal or abnormal by the detection stage, and decides whether to alert the administrator, automatically reconfigure the target system to keep out the intruder, or provide response mechanisms to enable manual response.
IDS are classified into three types, [6] namely: IDS-signature-based detection (also known as “misuse detection”), IDS anomaly detection, and hybrid IDS. In the IDS-signature-based detection, the signatures of malicious activities are maintained in the IDS knowledge base. These activities hurt the system’s performance. The signatures of an event are examined and sent across the database when it occurs. If the signatures match, it is considered an intrusion; otherwise, it is considered a normal event. IDS-signature-based detection is only as good as the signatures in the database. As a result, to improve performance, more signatures should be saved in the IDS knowledge base, which is considered a disadvantage of this detection methodology. In IDS-anomaly-based detection, any deviation is taken into account while detecting an intrusion. Deviation from normal behavior is analyzed and investigated. If the deviation from normal behavior is significant, the occurrence is referred to as an intrusion. This type is extremely useful in the event of unknown malicious activity, as it is easy to set up and it has a good level of accuracy. The main disadvantage of this type it generates a higher number of false alarms. Finally, the Hybrid IDS type attempts to effectively combine anomaly detection and misuse detection types.
2.2. Support Vector Machine (SVM)
SVM is a binary classifier, and it is an ML approach based on the supervised ML model used for classification and regression [30]. In the SVM method, many quadratic equations, fixed rules, and statistical techniques have been used to divide the data. In addition, to address this issue, another method is used depending on the binary classification of the data, which focuses on separating hyperplanes to increase the space of the margin in the kernel functions and then storing the resulting data in the vector. Previous studies confirmed that the SVM method is one of the best techniques due to its use of the structural risk minimization feature and its powerful generalization capability. An SVM’s primary goal is to determine the best hyperplane for classifying new data points. Figure 3 shows the basic idea of the SVM classifier.
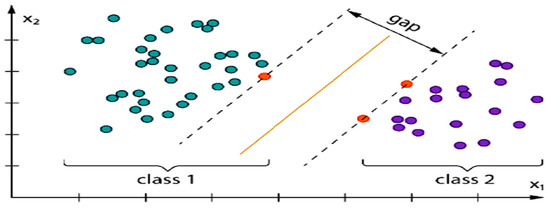
Figure 3.
Idea of SVM classifier.
The kernel is a set of mathematical functions used by SVM [14]. The kernel’s job is to take data and convert them into the desired format. Different types of kernel functions are used by SVM. Several kernel functions are employed with the SVM are linear, polynomial, RBF, and sigmoid. Table 2 shows Kernel’s mathematical function.
Table 2.
Kernel Mathematical function.
2.3. Principal Component Analysis
PCA is one of the most widely used dimensionality reduction approaches in the field of data mining, and it seeks to find data points with the maximum potential variance using statistical approaches [15]. Using PCA, redundancy and unnecessary features will be removed, and features will be more visible and organized in a new space called the principal space. The PCA is applied using the following six steps.
- Determine the normalized d-dimensional dataset’s covariance matrix.
- Determine the covariance matrix’s eigenvectors and eigenvalues.
- Sort the eigenvalues from highest to lowest.
- Choose the k eigenvectors that correspond to the k biggest eigenvalues, where k is the new feature subspace’s number of dimensions.
- Construct the projection matrix from the k eigenvectors that were chosen.
- Create a new k-dimensional feature space by transforming the original data.
The pseudocode for computing PCA is illustrated as follows.
| Pseudocode For Computing PCA | |
| 1 | Procedure PCA |
| 2 | Compute dot product matrix: XT X = |
| 3 | Eigen analysis:XT X = VɅVT |
| 4 | Compute Eigen vectors:U = XVɅT |
| 5 | Save a Specific number of First components: Ud = |
| 6 | Compute d features:Y = Ud TX |
2.4. Related Works
Several papers have been released in the previous decade to improve IDS performance. This section reviews previous papers that have aimed to improve IDS performance, utilizing SVM classification and PCA dimensionality reduction technologies.
A study by I. Sumaiya Thaseen and Ch. Aswani Kumar [31] proposed a novel model for IDS by combining PCA and SVM, then used a parameter selection method to improve the RBF kernel functions. The proposed IDS model has reduced the required time for training and testing and increased accuracy for IDS. KDDCup datasets were used to test the proposed model. The results of the proposed model outperformed other classification strategies that use SVM as the classifier, as well as other dimensionality reduction.
In a study by NSKH et al. [32], The SVM classifier was used with a variety of kernels, including linear, RBF, and polynomial. Furthermore, the performance of this method is assessed using the KDDCup dataset, and measures such as detection accuracy and detection time are compared using the PCA method and without it. They claimed that the PCA might minimize detection time and that the RBF kernel produces superior results with a higher detection rate, as well as faster detection speed in polynomial kernel-based SVM.
To discover and classify smart grid intrusions and attacks, a study by Raja, M Chithik Rabbani, and M Munir Ahmed [33], suggested an IDS based on SVM and PCA. The model is evaluated using KDD CUP’99 data, and numerical simulations for an intrusion detection system employing SVM and PCA are performed simultaneously on five different kernels. In addition, a comparison analysis of the proposed IDS is conducted in terms of time to response, rate of increased network efficiency and increased system error, and variations in the use or lack of use of PCA. When PCA is employed and the core of the method is radial type, the results show that the correct detection rate and the rate of attack error detection are at their best.
In a study by Ikram, Sumaiya Thaseen Cherukuri, and Aswani Kumar [34], the authors developed a hybrid IDS model by combining PCA and SVM. The developed model uses an automatic parameter selection strategy to maximize the kernel parameters of the SVM classifier. This technique optimizes the punishment factor and kernel parameter gamma, resulting in improved classifier accuracy and reduced training and testing time.
Another study was conducted by Mishra, Anukriti et al. [35]. To detect network intrusion, they proposed a supervised Machine Learning model. The proposed model uses PCA to reduce dimensionality and SVM to increase attack detection and reduce computation time. The UNSW-NB15 dataset is used to evaluate the model. The proposed model improved training and testing time by 33.75% for binary classification and 33.91% for multi-class classification, with overall accuracy of 99.99% and 99.97%, respectively.
In another study by Bhattacharya et.al [36], they proposed a model to classify IDS by developing a PCA-Firefly approach. The transformation is achieved using one-hot encoding, and the dimensionality reduction is achieved using the PCA-Firefly approach. XGBoost classifier is then used to classify the reduced dataset. The proposed model’s superiority is demonstrated by experimental data. Table 3 displays a summary of previous works.
Table 3.
Summary of the previous works.
3. Proposed Investigation Model
The investigation model intends to improve the performance of the IDS using PCA and SVM with different kernels. This model has applied SVM with different kernels to increase the efficiency of IDS and reduce the number of features using PCA to select the best kernels. The architecture of the model is presented in Figure 4. The model for IDS is divided into four stages. The IDS model in this research primarily concentrates on the available attacks list on KDD Cup ‘99 and UNSW-NB15, ignoring real attacks that do not target specific attacks.
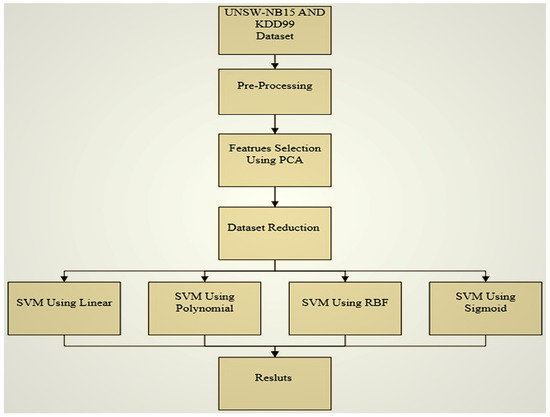
Figure 4.
Architecture of investigation model for IDS using PCA and SVM kernels.
Stage 1: Datasets:
The model is evaluated using datasets to see if it can accurately predict attacks or not. The quality of the dataset has an impact on the outcome of any IDS. In this study, we look at the KDD Cup’99 the most well-known dataset to detect intrusion in network traffic, and UNSW-NB15 datasets which include modern attacks. The KDD’99 dataset was produced by DARPA in 1999. It has 42 features. There are four categories for the features in the KDD’99 dataset:
Category 1: Basic features.
Category 2: Content features.
Category 3: Time features.
Category 4: Host features.
The UNSW-NB15 dataset has been developed by Moustafa et al. in 2015 [37]. Modern attacks are included compared to the KDD’99 dataset. It has 49 features. It is significant to note that the following features are missing in the UNSW-NB15 Training and Testing dataset: ltime, sport, scrip, stime, and dstip. The remaining 45 features in the UNSW-NB15 dataset are separated into six categories:
Category 1: Basic features.
Category 2: Flow features.
Category 3: Time features.
Category 4: Content features.
Category 5: Additional generated features.
Category 6: Labeled features.
Stage 2: Preprocessing:
Because of their disparate origins, the majority of the IDS datasets are prone to missing, inconsistent, and noisy data. Machine Learning algorithms will fail to discover patterns successfully when applied to these IDS datasets, resulting in poor outcomes. As a result, data processing is critical for improving overall data quality. Therefore, the following steps have been taken to prepare the UNSW-NB15 and KDD CUP’99 datasets to come out with valid results.
- A.
- Clean Data: The UNSW-NB15 and KDD CUP’99 datasets are cleaned by filling missing values, smoothing noisy data, resolving inconsistencies, and removing outliers.
- B.
- Data Transformation: The UNSW-NB15 and KDD CUP’99 datasets are transformed by employing the normalization technique to change the value, and structure, of data to fit our model requirements.
Stage 3: Features Selection
Feature selection is a key concept in ML that has a significant impact on model performance. It is defined as the process of selecting those features that contribute the most to the prediction variable, either automatically or manually. Using feature selection can offer many benefits, such as reducing overfitting, improving accuracy, and reducing training time. Serval methods have been used for feature selection in ML, such as filter methods, wrapper methods, embedded methods, and metaheuristic methods [38]. In this paper, we used PCA as a feature selection method.
Stage 4: Classification:
The process of predicting the class of a group of data points is known as classification. Classes are sometimes known as targets, labels, or categories. There are numerous classification techniques available today, such as decision trees, Logistic Regression, Naive Bayes, K-Nearest Neighbors, and SVM [6]. SVM is a popular Supervised ML technique for Classification and Regression issues. In practice, a kernel is used to implement the SVM algorithm. A kernel converts the data in an input area into the desired format. The kernel trick is a technique that SVM uses. The kernel trick aids in the development of a more efficient classifier. Therefore, in this paper, we classified data using an SVM classifier with linear, polynomial, RBF, and Sigmoid kernel. Table 4 shows the used SVM parameters used in the investigation model.
Table 4.
SVM Parameters.
4. Experimental Results and Analysis
4.1. Performance Evaluation Matrices
The metrics used to evaluate the model’s efficiency level are (TP), (TN), (FP), and (FN). Calculate TP, TN, FP, and FN using the confusion matrix in Table 5. Based on these measurements, other metrics such as sensitivity, precision, accuracy, and F-Measure [39] could be considered.
Table 5.
Matrix of confusion.
where:
TP is calculated as listed below:
TN is calculated as listed below:
FP is calculated as listed below:
FN is calculated as listed below:
Accuracy is calculated as listed below:
Precision is calculated as listed below:
Sensitivity is calculated as listed below:
The F-Measure is calculated as listed below:
4.2. Experimental Design, Analysis, and Findings
The model testing was conducted on a 3.40 GHz i7 CPU with 6.0 GB RAM using Windows 7 as the operating system. The experiments were carried out using the Anaconda Python open source for KDD CUP’99 and UNSW-NB15 datasets. The model was implemented using python scikit-learn (sklearn) tools, An estimator for classification in Sklearn is a Python object that implements the fit( ) and predict (T) functions. The estimator used in this model is SVM with different kernels, which is an import from class sklearn.svm.SVC. The input parameters used to classify attacks were chosen based on PCA using the following function.
from sklearn.decomposition import PCA
pca=PCA(n_components=2)
X_train=pca.fit_transform(X_train)
X_test=pca.transform(X_test)
A model needs to be trained before predictions can be made. Using the train/test splits method, we have trained the models. The data were split using the following function.
from sklearn.model_selection import train_test_split
X_train, X_test, y_train, y_test=train_test_split(X,y,test_size=0.2,random_state=0)
Using our finalized classification model in sklearn and the predict() function, the attack can predict the class for new data samples. The attack was predicated using the following function.
Y_pred = classifier.predict(X_first)
Figure 5 shows the obtained confusion matrix of prediction for the KDD CUP’99 dataset for different SVM kernel functions.
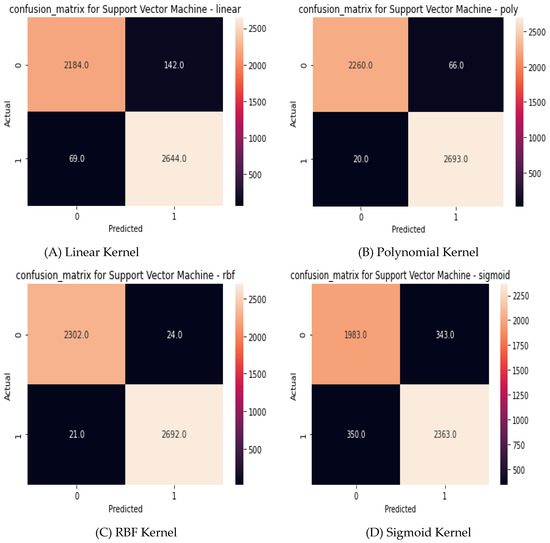
Figure 5.
Obtained confusion matrix of KDD CUP’99.
Figure 6 shows the obtained confusion matrix of prediction for the UNSW-NB15 dataset for different SVM kernel functions.
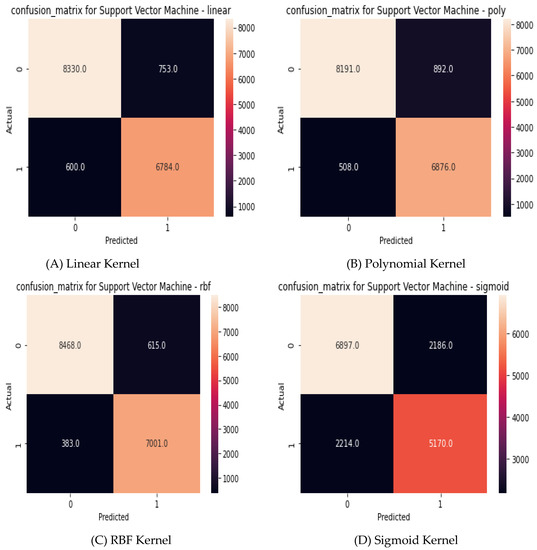
Figure 6.
Obtained confusion matrix of UNSW-NB15.
Based on obtained confusion matrix for KDD CUP’99 and UNSW-NB15 datasets as shown in Figure 5 and Figure 6, respectively, the performance evaluation metrics have been calculated to assist the investigation model. Table 6 shows the results of the performance metrics of the investigation model.
Table 6.
The obtained results.
4.3. Experimental Results and Discussion
This section discusses the experiment’s results. Figure 7 shows the accuracy of the different SVM kernels function with PCA features reduction based on KDD CUP’99 and UNSW-NB15 datasets. Accuracy is defined as the percentage of correct predictions made by a classifier compared to the actual value of the label. The obtained accuracy for KDD CUP’99 based on SVM-linear, SVM-ploy, SVM-RBF, and SVM-sigmoid is 95.81%, 98.29%, 99.11%, and 86.25%, respectively. The obtained accuracy for UNSW-NB15 is based on SVM-linear, SVM-ploy, SVM-RBF, and SVM-sigmoid is 91.78%, 91.50%, 93.94%, and 73.28%, respectively. Based on the obtained data, the SVM-RBF kernel function outperformed the other kernel functions for both datasets in terms of accuracy.
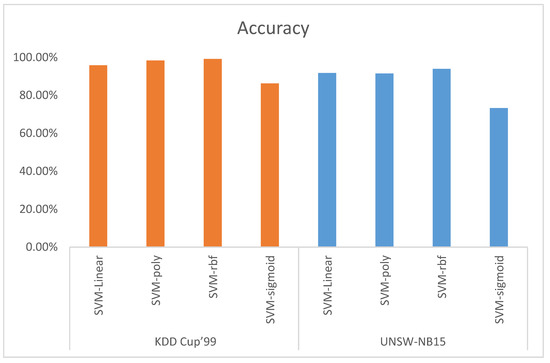
Figure 7.
Accuracy.
Precision is defined as the percentage that indicates how many of the items detected are true predictions by the classifier. Figure 8 shows the precision of the different SVM kernels function with PCA features reduction based on KDD CUP’99 and UNSW-NB15 datasets. The precision for SVM-linear, SVM-ploy, SVM-RBF, and SVM-sigmoid using the KDD CUP’99 dataset is 96.94%, 99.12%, 99.10%, and 85.00%, respectively. Meanwhile, the precision for SVM-linear, SVM-ploy, SVM-RBF, and SVM-sigmoid using the UNSW-NB15 dataset is 93.28%, 94.16%, 95.67%, and 75.70%, respectively. The obtained data show that the SVM-ploy kernel function outperformed other kernel functions for KDD CUP’99 datasets in terms of precision with a very simple superiority of the SVM-RBF function. Concerning the UNSW-NB15 dataset, the SVM-RBF kernel function outperformed other kernel functions.
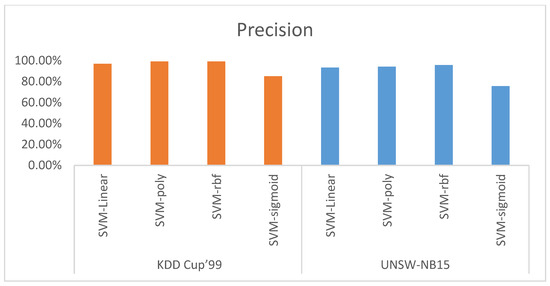
Figure 8.
Precision.
Sensitivity is defined as the percentage of true positives accurately identified by the classifier. Figure 9 shows the sensitivity of the proposed model. The sensitivity of SVM-linear, SVM-ploy, SVM-RBF, and SVM-sigmoid using KDD CUP’99 dataset is 93.90%, 97.16%, 98.97%, and 85.25%, respectively. Meanwhile, the sensitivity of SVM-linear, SVM-ploy, SVM-RBF, and SVM-sigmoid using the UNSW-NB15 dataset is 91.71%, 90.18%, 93.23%, and 75.93%, respectively. The obtained data show that the SVM-RBF kernel function outperformed other kernel functions in both datasets in terms of sensitivity.
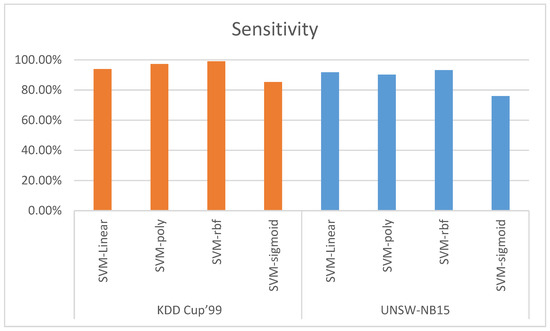
Figure 9.
Sensitivity.
The F-Measure or F-score is defined as the harmonic average of the precision and sensitivity. Figure 10 shows the F-Measure of the different SVM kernels function with PCA features reduction based on KDD CUP’99 and UNSW-NB15 datasets. The F-Measure using KDD CUP’99 dataset for SVM-linear, SVM-ploy, SVM-RBF, and SVM-sigmoid is 95.39%, 98.13%, 99.03%, and 85.13%, respectively. Meanwhile, the F-Measure using the UNSW-NB15 dataset for SVM-linear, SVM-ploy, SVM-RBF, and SVM-sigmoid is 92.49%, 92.13%, 94.44%, and 75.82%, respectively. The obtained data show that the SVM-RBF kernel function outperformed other kernel functions for both datasets in terms of the F-Measure.
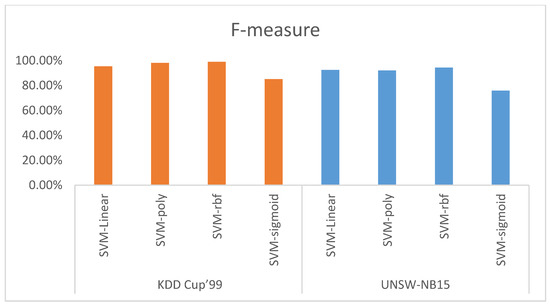
Figure 10.
F-Measure.
The following findings can be drawn from the above investigations:
- (a)
- The RBF kernel function is the best compared to linear, polynomial, and Sigmoid.
- (b)
- The Sigmoid kernel function is the worst.
5. Conclusions and Future Works
This paper introduced a model to investigate the IDS using PCA features reduction techniques and SVM classifiers with various kernel functions (linear, polynomial, RBF, and Sigmoid). On the KDD CUP’99 and UNSW-NB15 datasets, several SVM kernel functions were utilized, and Anaconda Python open source was used for simulations. The confusion matrix was used to examine the results. The efficiency of an investigation model was assessed using accuracy, precision, sensitivity, and F-Measure. The results of the analysis reveal that the RBF kernel function has superiority compared to linear, polynomial, and Sigmoid kernel functions in terms of accuracy, precision, sensitivity, and F-Measure for IDS. In future research, the modern dataset for IDS can be used to analyze this model, and a new kernel function for SVM will be developed to outperform the RBF kernel function. Additionally, other feature reduction techniques will be used instead of PCA. A limitation of the paper is that it only focuses on reducing the features using PCA and classifying the attacks that only exist on KDD CUP’99 and UNSW-NB15 using SVM with different kernel functions, and does not consider modern attacks such as DDoS, Phishing, or Brute force.
Author Contributions
Conceptualization, M.A.A. and O.A.; methodology, O.A., A.A. and T.H.H.A.; software, A.A.-Z.; validation, A.L. and A.B.A.; formal analysis, M.A.A. investigation, O.A. and S.A.-O.; resources, A.K.A.H.; writing original draft preparation, M.A.A. writing—review and editing, N.B.-H.; visualization, O.A., M.A.A. and A.A.; supervision, M.A.A. and O.A.; project administration, M.A.A.; funding acquisition, M.A.A. All authors have read and agreed to the published version of the manuscript.
Funding
This work was funded by King Faisal University and Princess Nourah bint Abdulrahman University. This work was supported through the Annual Funding track by the Deanship of Scientific Research, Vice Presidency for Graduate Studies and Scientific Research, King Faisal University, Saudi Arabia (Project No. Grant No. 1674) and Princess Nourah bint Abdulrahman University Researchers Supporting Project number (PNURSP2022R136), Princess Nourah bint Abdulrahman University, Riyadh, Saudi Arabia.
Institutional Review Board Statement
Not applicable.
Informed Consent Statement
Not applicable.
Data Availability Statement
Not applicable.
Conflicts of Interest
All authors declare no conflict of interest.
References
- Almaiah, M.A.; Al-Zahrani, A.; Almomani, O.; Alhwaitat, A.K. Classification of cyber security threats on mobile devices and applications. In Artificial Intelligence and Blockchain for Future Cybersecurity Applications; Springer: Berlin/Heidelberg, Germany, 2021; pp. 107–123. [Google Scholar]
- Almaiah, A.; Almomani, O. An investigation of digital forensics for shamoon attack behaviour in fog computing and threat intelligence for incident response. J. Theor. Appl. Inf. Technol. 2020, 15, 98. [Google Scholar]
- Zhang, M.; Sun, K. Computer Network Security Protection Strategy Based on Big Data. In Innovative Computing; Springer: Berlin/Heidelberg, Germany, 2022; pp. 1343–1350. [Google Scholar]
- Al-Momani, O.M.D. Dynamic Redundancy Forward Error Correction Mechanism for the Enhancement of Internet-Based Video Streaming. Ph.D. Thesis, Universiti Utara Malaysia, Kedah, Malaysia, 2010. [Google Scholar]
- Gupta, M.; Almomani, O.; Khasawneh, A.M.; Darabkh, K.A. Smart remote sensing network for early warning of disaster risks. In Nanotechnology-Based Smart Remote Sensing Networks for Disaster Prevention; Elsevier: Amsterdam, The Netherlands, 2022; pp. 303–324. [Google Scholar]
- Almomani, O.; Almaiah, M.A.; Alsaaidah, A.; Smadi, S.; Mohammad, A.H.; Althunibat, A. Machine Learning Classifiers for Network Intrusion Detection System: Comparative Study. In Proceedings of the 2021 International Conference on Information Technology (ICIT), Amman, Jordan, 14–15 July 2021; pp. 440–445. [Google Scholar]
- Almomani, O. A Feature Selection Model for Network Intrusion Detection System Based on PSO, GWO, FFA and GA Algorithms. Symmetry 2020, 12, 1046. [Google Scholar] [CrossRef]
- Almomani, O. A Hybrid Model Using Bio-Inspired Metaheuristic Algorithms for Network Intrusion Detection System. Comput. Mater. Contin 2021, 68, 409–429. [Google Scholar] [CrossRef]
- Mohammad, A.H.; Alwada’n, T.; Almomani, O.; Smadi, S.; ElOmari, N. Bio-inspired Hybrid Feature Selection Model for Intrusion Detection. Comput. Mater. Contin 2022, 73, 133–150. [Google Scholar] [CrossRef]
- Ahmad, Z.; Khan, A.S.; Shiang, C.W.; Abdullah, J.; Ahmad, F. Network intrusion detection system: A systematic study of machine learning and deep learning approaches. Trans. Emerg. Telecommun. Technol. 2021, 32, e4150. [Google Scholar] [CrossRef]
- Sajja, G.S.; Mustafa, M.; Ponnusamy, R.; Abdufattokhov, S. Machine Learning Algorithms in Intrusion Detection and Classification. Ann. Rom. Soc. Cell Biol. 2021, 25, 12211–12219. [Google Scholar]
- Madi, M.; Jarghon, F.; Fazea, Y.; Almomani, O.; Saaidah, A. Comparative analysis of classification techniques for network fault management. Turk. J. Electr. Eng. Comput. Sci. 2020, 28, 1442–1457. [Google Scholar] [CrossRef]
- Al Hwaitat, A.K.; Almaiah, M.A.; Almomani, O.; Al-Sayed, M.A.R.M.; Asaifi, R.M.; Adhim, K.K.; Althunibat, A.; Alsaaidah, A. Improved Security Particle Swarm Optimization (PSO) Algorithm to Detect Radio Jamming Attacks in Mobile Networks. Int. J. Adv. Comput. Sci. Appl. 2020, 11, 614–625. [Google Scholar] [CrossRef]
- Mohammadi, M.; Rashid, T.A.; Karim, S.H.T.; Aldalwie, A.H.M.; Tho, Q.T.; Bidaki, M.; Rahmani, A.M.; Hosseinzadeh, M. A comprehensive survey and taxonomy of the SVM-based intrusion detection systems. J. Netw. Comput. Appl. 2021, 178, 102983. [Google Scholar] [CrossRef]
- Karamizadeh, S.; Abdullah, S.M.; Manaf, A.A.; Zamani, M.; Hooman, A. An overview of principal component analysis. J. Signal Inf. Process. 2020, 4, 173–175. [Google Scholar] [CrossRef]
- Kherif, F.; Latypova, A. Principal component analysis. In Machine Learning; Elsevier: Amsterdam, The Netherlands, 2020; pp. 209–225. [Google Scholar]
- Wang, W.; Du, X.; Wang, N. Building a cloud IDS using an efficient feature selection method and SVM. IEEE Access 2018, 7, 1345–1354. [Google Scholar] [CrossRef]
- Masadeh, R.; AlSaaidah, B.; Masadeh, E.; Al-Hadidi, M.R.; Almomani, O. Elastic Hop Count Trickle Timer Algorithm in Internet of Things. Sustainability 2022, 14, 12417. [Google Scholar] [CrossRef]
- Almaiah, M.A.; Hajjej, F.; Ali, A.; Pasha, M.F.; Almomani, O. A Novel Hybrid Trustworthy Decentralized Authentication and Data Preservation Model for Digital Healthcare IoT Based CPS. Sensors 2022, 22, 1448. [Google Scholar] [CrossRef]
- Saaidah, A.; Almomani, O.; Al-Qaisi, L.; Madi, M.K. An efficient design of RPL objective function for routing in internet of things using fuzzy logic. Int. J. Adv. Comput. Sci. Appl. 2019, 10, 184–190. [Google Scholar] [CrossRef]
- Albalas, F.; Al-Soud, M.; Almomani, O.; Almomani, A. Security-aware CoAP application layer protocol for the internet of things using elliptic-curve cryptography. Int. Arab J. Inf. Technol. 2018, 15, 25–37. [Google Scholar]
- Smadi, S.; Alauthman, M.; Almomani, O.; Saaidah, A.; Alzobi, F. Application Layer Denial of Services Attack Detection Based on StackNet. Int. J. 2020, 3929, 2278–3091. [Google Scholar] [CrossRef]
- Huraj, L.; Horak, T.; Strelec, P.; Tanuska, P. Mitigation against DDoS Attacks on an IoT-Based Production Line Using Machine Learning. Appl. Sci. 2021, 11, 1847. [Google Scholar] [CrossRef]
- Šimon, M.; Huraj, L.; Horák, T. DDoS reflection attack based on IoT: A case study. In Computer Science Online Conference; Springer: Berlin/Heidelberg, Germany, 2018; pp. 44–52. [Google Scholar]
- Horak, T.; Strelec, P.; Huraj, L.; Tanuska, P.; Vaclavova, A.; Kebisek, M. The vulnerability of the production line using industrial IoT systems under ddos attack. Electronics 2021, 10, 381. [Google Scholar] [CrossRef]
- Adil, M.; Almaiah, M.A.; Alsayed, A.O.; Almomani, O. An Anonymous Channel Categorization Scheme of Edge Nodes to Detect Jamming Attacks in Wireless Sensor Networks. Sensors 2020, 20, 2311. [Google Scholar] [CrossRef]
- Kaur, T.; Malhotra, V.; Singh, D. Comparison of network security tools-firewall intrusion detection system and Honeypot. Int. J. Enhanc. Res. Sci. Technol. Eng. 2014, 3, 201–202. [Google Scholar]
- Lundin, E.; Jonsson, E. Survey of Intrusion Detection Research; Chalmers University of Technology: Goteborg, Sweden, 2002. [Google Scholar]
- Bridges, R.A.; Glass-Vanderlan, T.R.; Iannacone, M.D.; Vincent, M.S.; Chen, Q. A survey of intrusion detection systems leveraging host data. ACM Comput. Surv. 2019, 52, 1–35. [Google Scholar] [CrossRef]
- Pisner, D.A.; Schnyer, D.M. Support vector machine. In Machine Learning; Elsevier: Amsterdam, The Netherlands, 2020; pp. 101–121. [Google Scholar]
- Thaseen, I.S.; Kumar, C.A. Intrusion detection model using fusion of PCA and optimized SVM. In Proceedings of the 2014 International Conference on Contemporary Computing and Informatics (IC3I), Mysuru, India, 27–29 November 2014; pp. 879–884. [Google Scholar]
- Nskh, P.; Varma, M.N.; Naik, R.R. Principle component analysis based intrusion detection system using support vector machine. In Proceedings of the 2016 IEEE International Conference on Recent Trends in Electronics, Information & Communication Technology (RTEICT), Bengaluru, India, 20–21 May 2016; pp. 1344–1350. [Google Scholar]
- Raja, M.C.; Rabbani, M.M.A. Combined analysis of support vector machine and principle component analysis for IDS. In Proceedings of the 2016 International Conference on Communication and Electronics Systems (ICCES), Coimbatore, India, 21–22 October 2016; pp. 1–5. [Google Scholar]
- Ikram, S.T.; Cherukuri, A.K. Improving accuracy of intrusion detection model using PCA and optimized SVM. J. Comput. Inf. Technol. 2016, 24, 133–148. [Google Scholar] [CrossRef]
- Mishra, A.; Cheng, A.M.K.; Zhang, Y. Intrusion detection using principal component analysis and support vector machines. In Proceedings of the 2020 IEEE 16th International Conference on Control & Automation (ICCA), Hokkaido, Japan, 6–9 July 2020; pp. 907–912. [Google Scholar]
- Bhattacharya, S.; Maddikunta, P.K.R.; Kaluri, R.; Singh, S.; Gadekallu, T.R.; Alazab, M.; Tariq, U. A novel PCA-firefly based XGBoost classification model for intrusion detection in networks using GPU. Electronics 2020, 9, 219. [Google Scholar] [CrossRef]
- Moustafa, N.; Slay, J. UNSW-NB15: A comprehensive data set for network intrusion detection systems (UNSW-NB15 network data set). In Proceedings of the 2015 Military Communications and Information Systems Conference (MilCIS), Canberra, Australia, 10–12 November 2015; pp. 1–6. [Google Scholar]
- Liu, W.; Wang, J. A brief survey on nature-inspired metaheuristics for feature selection in classification in this decade. In Proceedings of the 2019 IEEE 16th International Conference on Networking, Sensing and Control (ICNSC), Banff, AB, Canada, 9–11 May 2019; pp. 424–429. [Google Scholar]
- Smadi, S.; Aslam, N.; Zhang, L. Detection of online phishing email using dynamic evolving neural network based on reinforcement learning. Decis. Support Syst. 2018, 107, 88–102. [Google Scholar] [CrossRef]
Publisher’s Note: MDPI stays neutral with regard to jurisdictional claims in published maps and institutional affiliations. |
© 2022 by the authors. Licensee MDPI, Basel, Switzerland. This article is an open access article distributed under the terms and conditions of the Creative Commons Attribution (CC BY) license (https://creativecommons.org/licenses/by/4.0/).