Article

Effects of MgO and Fe2O3 Addition for Upgrading the Refractory Characteristics of Magnesite Ore Mining Waste/By-Products

by
Evangelia Pagona
1,
Kyriaki Kalaitzidou
1,
Vasileios Zaspalis
1,
Anastasios Zouboulis
2,* and
Manassis Mitrakas
1
1
Department of Chemical Engineering, School of Engineering, Aristotle University of Thessaloniki, 541 24 Thessaloniki, Greece
2
Department of Chemistry, School of Sciences, Aristotle University of Thessaloniki, 541 24 Thessaloniki, Greece
*
Author to whom correspondence should be addressed.
Clean Technol. 2022, 4(4), 1103-1126; https://doi.org/10.3390/cleantechnol4040067
Submission received: 29 July 2022 / Revised: 10 September 2022 / Accepted: 12 October 2022 / Published: 31 October 2022

Abstract

:
In the context of a circular economy/zero-waste, the conversion of extractive wastes into new products is of particular importance. At the Grecian Magnesite SA mine (Chalkidiki, N. Greece), millions of tons of waste accumulate in the operation field. To achieve these goals, the effect of caustic calcined magnesia (MgO) at 10, 15, and 20 wt.% was investigated in combination with 0.5, 1, 2.5, and 5 wt.% Fe2O3 at 1300 °C and 1600 °C for 120 min. The main refractory properties were determined along with the mineralogical content. The morphological examination has been performed by SEM-EDS analysis. The addition of MgO increases the desired olivine and eliminates the unwanted pyroxenes, causing the formation of magnesium-ferrite and periclase. MgO wt.% addition resulted in the decrease of firing shrinkage at 1300 °C but increased with Fe2O3. At 1600 °C, firing shrinkage had a minimum value at the optimum MgO dose. Mechanical strength at 1600 °C achieved a maximum value at the optimum MgO dose plus 5 wt.% MgO and 2.5 wt.% Fe2O3 due to sintering process/magnesioferrite formation. These results indicate that MgO and Fe2O3 upgrade the refractoriness of magnesite mining wastes due to the diffusion of Fe2O3 in MgO excess.

1. Introduction

The simple disposal of millions of tons of solid wastes for years within the operation of industries in the mining sector and/or various other industries constitutes an important factor regarding environmental/soil pollution and financial ramifications. It is estimated that the global production of solid wastes from the primary production of minerals and metals is over 100 billion tons annually [1]. Various examples of industries are the coal mining industry [2,3], the phosphate mining industry [4], or a large deposit of mining wastes of an albite deposit in south Spain that could be of interest for the valorization of wastes as ceramic and raw materials [5]. Concerning mining waste management, the research into mining waste has increased, with studies focusing on waste management accounting for almost 40% of the total [6].
This fact gains increased attention concerning the newly imposed target of zero waste. To address this increasing issue, the developed countries set a target of decreasing high quantities of the produced waste. For that purpose, within the framework of circular economy and resource sustainability, the old waste deposits may be reintroduced as raw materials or new products. At the same time, land space can be emptied, which will have a positive environmental impact. Applying this scenario to the mineral of enriched coarse fraction (containing mainly waste rock), as well as of the fine fraction (i.e., tailings which still may present a profitable content), mining wastes (by-products) may be considered suitable for the application of appropriate treatments to produce raw materials or new products [7]. The valorization of these mining wastes and their up-grading as a raw material further used as a primary natural resource can present numerous benefits, such as reduction of the mining extraction process, minimizing the exploitation of natural resources, energy efficiency along with economic benefits, and environmental impact by producing lower volumes of waste (improving societal health and safety) [8]. Cleaner technologies toward green technical developments that prevent the overexploitation of natural resources set the basis of sustainability [9].
Hence, the development of cleaner technologies applying methods that exploit waste as raw material is considered crucial for the minimization of waste with potential economic benefits from the application of a circular economy policy. In this frame, ceramic researchers also investigate the recycling of industrial by-products to fabricate ceramics, while the field of ceramics from waste ingredients produced on an industrial scale has not yet been widely maturated. Therefore, a deeper investigation is required to commercialize waste-derived ceramics, while some wastes can eventually prevent the overexploitation of natural resources for the industrial production of ceramics [8]. The current environmental performance should be assessed, and the life cycle analysis of wastes derived from the mining industry should be incorporated into their operation [10].
The manufacturing by applying an appropriate thermal treatment that aims to transform on an industrial scale the high volume of the mining wastes/by-products stockpiled in the magnesite mine (Grecian Magnesite SA company, located at Gerakini, Chalkidiki, N. Greece) into upgraded refractory products is of particular importance. Millions of tons of mining wastes/by-products are stockpiled in the mining area of the Grecian Magnesite SA company, which are generated in the application of magnesite ore enrichment processes. These mining wastes are ultramafic rocks (mainly dunite) that are transformed (partially or completely) into serpentinites (e.g., lizardite, enstatite, etc.) [11]. The serpentinization process deteriorates their technologically desired properties as refractory materials, limiting the possible economic and commercial exploitation of serpentinized rocks that currently don’t show any further utilization possibilities.
Consequently, the proper treatment method, with the selection of the appropriate final temperature (in this study 1300 °C and 1600 °C) along with the presence of specific additives (in this study MgO and Fe2O3), has the potential to result in the manufacturing of products with upgraded refractoriness by converting these mining wastes into firebricks or magnesium-olivine refractory metallurgical masses. This development presents new economic opportunities and an effective solution to environmental disposal problems for magnesite-producing mining companies.
The combination of serpentine mining waste, with the use of additives, e.g., Mg-based compounds [12,13], magnesia and/or alumina [1], magnesia, alumina or perlite [14,15], kaolin [16], a combination of waste serpentine mining tailings (WST), waste kaolin mining tailings (WKT) and calcium fluoride sludge (CFS) [17], magnesia and bauxite [18], and a combination of serpentine asbestos extraction dust waste with clay-sand mix and glass waste [19]. Attempts to produce the desired synthetic forsterite is the crystalline phase. Also, serpentine waste was used for synthesizing cordierite-mullite ceramics along with spent FCC catalyst and kiln rollers waste [20] or the production of a thermally insulating material, with the synthesis of forsterite at 600 °C [21]. Furthermore, for the production of forsterite or the improvement of forsterite refractoriness, additives like Fe2O3, ZrO2, and Al2TiO5 [22,23,24] have been used, while nanoparticles are also considered important for the production of specific refractories [25]. The use of serpentine was also studied by examining various parameters for the thermal treatment application of serpentines [26,27] to suggest a proper thermal treatment method. Finally, the reutilization of serpentine waste to produce high-value Si [28], the intake of MgO to produce MgKPO4 × 6H2O [29], and the dissolution of magnesium in acid have been reported [22].
The aim of this research is the systematic evaluation of MgO addition, in combination with Fe2O3, at various temperatures for improving the refractory properties of the examined mining waste/by-products, which commonly host the magnesite ore deposits. In our previous research, the optimum MgO wt.% dose addition for olivine formation was estimated, with the results showing the upgrading of refractoriness of magnesite mine by-products wastes [30], while the results of the Fe2O3 addition showed significant improvement of the mechanical strength [31]. The high melting point (2800 °C) and the physical and chemical stability at high temperatures with a wide range of applications set magnesia (MgO) as the most appropriate choice for the manufacturing of refractory materials [32]. On the other hand, Fe2O3 in lower concentrations favors the increase of bulk density, which enhances the strength of the produced refractories due to the diffusion of Fe2O3 in MgO particles [33]. For that purpose, caustic calcined MgO was added/mixed in varying quantities (10, 15, and 20 wt.%) in combination with Fe2O3 (0.5, 1, 2.5, and 5 wt.%) into representative mining waste samples. The examined two thermal treatments were at 1300 °C and 1600 °C for 120 min for the mixed samples. The respected products of the aforementioned thermal treatments were evaluated accordingly to result in a treatment method that combines the advantage of MgO along with Fe2O3 refractory properties and eventually exploits the raw mining wastes with zero value as a new refractory product with added value (e.g., firebricks, refractory masses) with possible industrial metallurgical applications, offering financial benefits in the magnesite mine.
The novelty of this research is the study of MgO wt.% excess addition, regarding the optimum wt% MgO dose for olivine formation, in combination with Fe2O3. Iron oxide (Fe2O3) diffuses in MgO particles and favors magnesioferrite formation, influencing refractory properties and mostly mechanical strength. This process takes advantage of MgO addition (high melting point) and the advantage of Fe2O3 (high density), improving the refractoriness and mechanical strength of this type of mining waste, which has lower physical properties due to the serpentinization process.
Conclusively, with this process, the mining wastes-by products (estimated at 35 × 106 tons for the area of Grecian Magnesite S.A.) that currently have no value are converted into new products with added value in the refractory industry, offering financial benefits to the magnesite mine, while at the same time expanding the lifespan of the magnesite mine. The possible application of the improved produced materials obtained is as refractories in industrial kilns and industrial metallurgical applications for temperatures ≤ 1600 °C, such as firebricks or magnesium-olivine refractory masses.

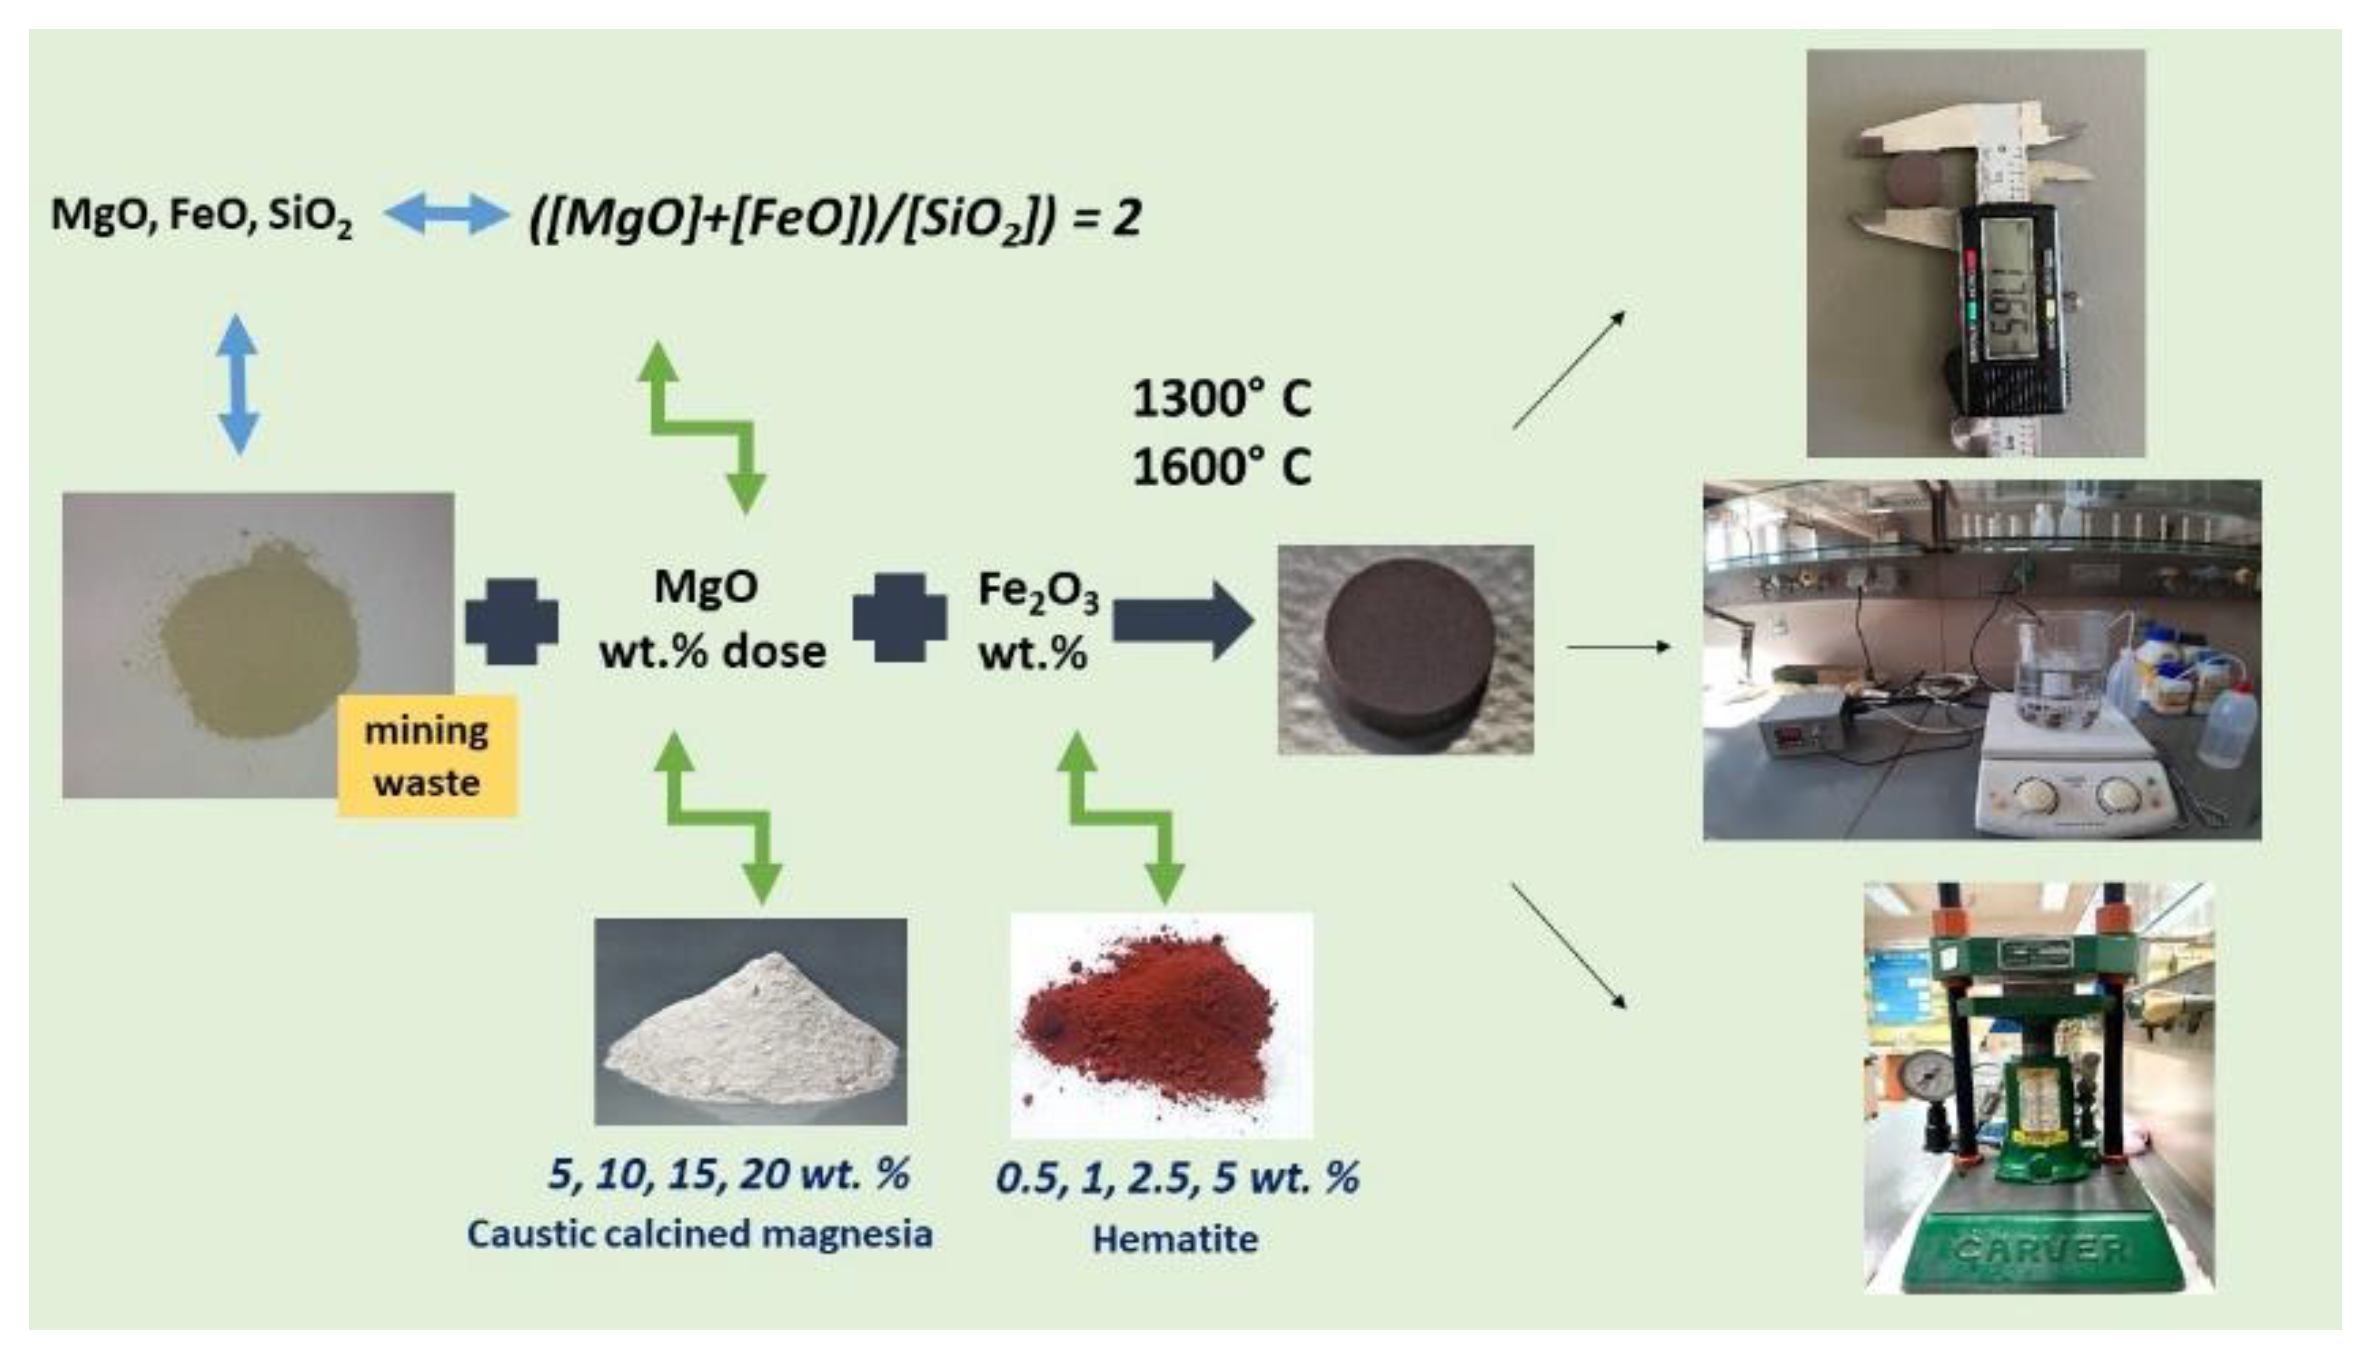
2. Materials and Methods

To properly characterize the collected wastes/samples W12 and W13 from the examined mining area of the stockpiles of the magnesite mine qualitatively and quantitatively, respective measurements were performed. Moreover, the estimation and the addition of the optimum MgO wt.% dose for olivine formation was performed, along with the mineral composition after thermal treatment of the original samples [30]. Table 1 and Table 2 show the chemical composition and main mineralogical content (wt.%) of the examined waste samples.
The chemical composition of the samples W12 and W13 must reflect the presence of 100 wt.% olivine to achieve its desirable formation, a fact related to the following molar ratio ([MgO] + [FeO])/[SiO2] = 2 [30,34]. Consequently, based on the initial content of MgO, FeO, and SiO2 in the examined waste samples, as shown in the results presented in Table 3, it can be seen that the samples lack the required MgO content to result in the aforementioned transformation. Samples W12 and W13 were selected among a total of thirteen mining waste samples examined for their lack of the required MgO dose (theoretical wt.% MgO addition 7–16%), as two outlier samples regarding MgO wt.% dose (W12 and W13 is 9.4 wt.% and 15.6 wt.%, respectively) (Table 3) [30,34].
Samples W12 and W13 were blended/mixed with the additives (MgO and Fe2O3) for 5 min to homogenize the prepared sample. The total weight was 5 g for each blend. Therefore, the amount of MgO for the ratios of 5, 10, 15, and 20 wt.% was 0.25, 0.5, 0.75, and 1 g respectively and of Fe2O3 for the ratios 0.5, 1, 2.5 and 5 wt.% were 0.025, 0.050, 0.125, and 0.250 g respectively. The remaining mixture quantity was the mining waste sample examined. The chemical composition of the added MgO, which is caustic calcined magnesia (CCM), is 84.5 wt.% MgO, 0.2 wt.% FeO, 0.5 wt.% Al2O3, 1.85 wt.% CaO, 0.65 wt.% Na2O, 7.9 wt.% SiO2, and LOI 4.2%, and Fe2O3 is hematite with 0.16 wt.% MgO, 87.2 wt.% Fe2O3, 0.17 wt.% CaO, 0.18 wt.% Na2O, 10.47 wt.% SiO2, and LOI 1.5%. Homogenized samples were pressed into cylindrical pellets of 2 cm diameter and then thermally treated with a programmable electric control using the SNOL 6.7/1300 LSC01 furnace at temperatures up to 1300 °C, applying a heating rate of 10 °C/min. These further examined samples were also subjected to thermal treatment at 1600 °C by using the programmable electric control of the Thermowatt TGH30L 380V 10 KW furnace and applying a heating rate of 6.5 °C/min. The final temperature remained at the respected temperature for 120 min. Following the thermal treatment, the products were allowed to cool at room temperature (25 °C). The final temperature of 1300 °C was applied based on the preliminary experiments as the proper temperature that results in the formation of the desired forsterite and in more stable and well-crystallized mineral phases, which were quantified by XRD analysis. The aforementioned temperature also improves the refractory properties of the respective products [32]. The temperature of 1600 °C was applied because the pyroxenes (enstatite) phases melt at 1557 °C [26]. Therefore, both are significant temperatures for studying the combination of the additives (MgO and Fe2O3) to the raw mining waste samples.
For the evaluation of the refractoriness of the products, the following relevant refractory parameters were evaluated: the Firing Shrinkage (FS%) parameter was evaluated by the measurement of the dimensions of the sample before and after the application of the thermal treatment with calibrated caliper along the diameter and the ratio (D0−D1)/D0) was calculated (0 and 1 refer to the dimensions of the sample before and after the application of the thermal treatment), the Apparent Porosity AP (%), the Bulk Density (BD), and the Water Absorption, (WA%), using the boiling water method (ASTM C20) [35]; also, the Mechanical Strength (MS) tests were performed with a Carver laboratory press post with the respected thermal treatment applied (Figure 1). More specifically, a digital caliper (0–150 mm), a heating plate (JENWAY 1000 model, UK), a high accuracy weight scale (OHAUS CORP, Morris, NJ, USA), and finally, a laboratory press (FRED S. CARVER Inc., Wabash, IN, USA), were utilized to obtain these measurements.
The microstructure chemical analysis, along with the study of the main mineral phases on the surface of the thermally treated products, were conducted using the point analysis SEM-EDS (Field Emission) JEOL (JSM-7610F Plus) and the microanalysis system AZTEC ENERGY ADVANCED X-act (OXFORD INSTRUMENTS) with INCA data analysis software.
Finally, the X-ray Diffraction (XRD) measurements using a Brücker D8 Advance diffractometer (powder XRD) for the products that were pulverized to determine the mineralogical phases, and the respective data were collected at 2θ from 5° to 70° with a scan time of 0.2 s and an increase of 0.02. The X-ray filament tube of Cu with a wavelength of 1.5418 Å and the LYNXEYE detector (1 D mode) was used. JADE XRD data analysis software was used for the qualitative and quantitative analysis of XRD patterns.

3. Results and Discussion

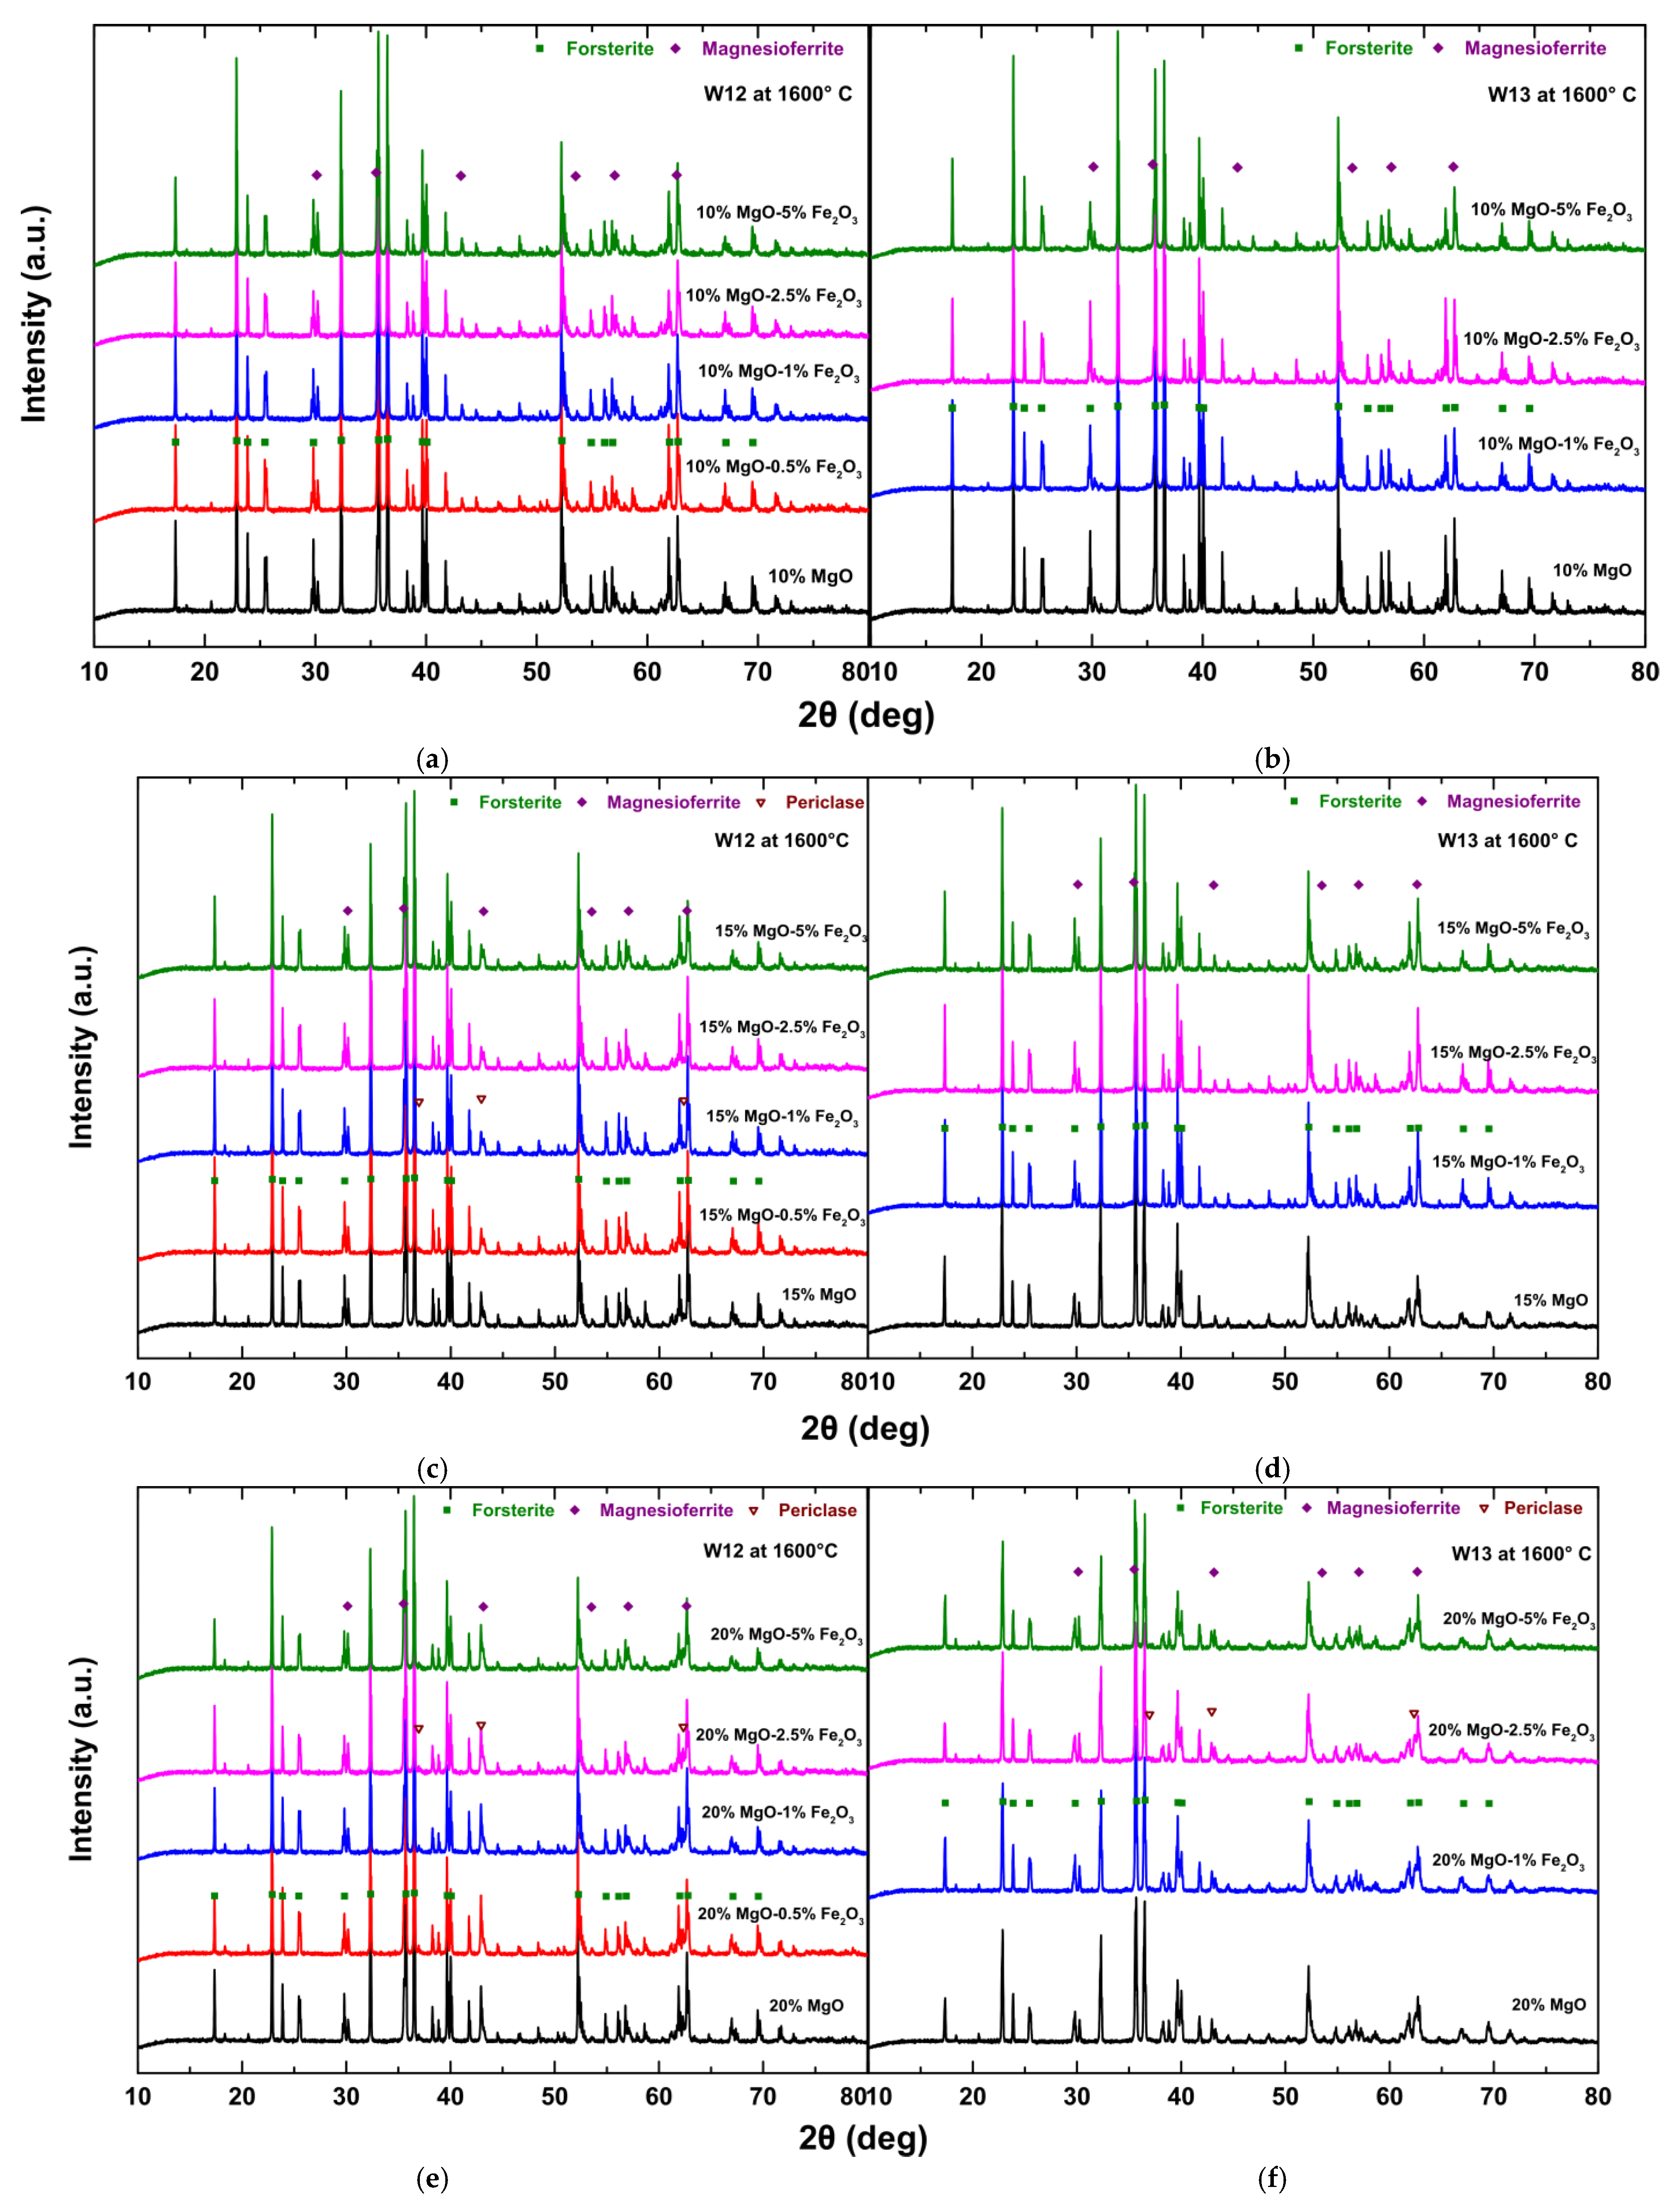
3.1. XRD Analysis of Crystal Phases of the Samples after Application of Thermal Treatment at 1300 °C and 1600 °C

From the XRD patterns of the examined samples (W12 and W13) combined with the additives of MgO and Fe2O3 after the thermal treatment at 1300 °C for 120 min, the following are observed (Figure 2 and Tables S1 and S2, Supplementary Material):
  • The raw mining waste samples (i.e., without additives) after the thermal treatment at 1300 °C for 120 min consist mainly of the desired crystal phase of olivine (forsterite) and pyroxene (enstatite) mineral phases.
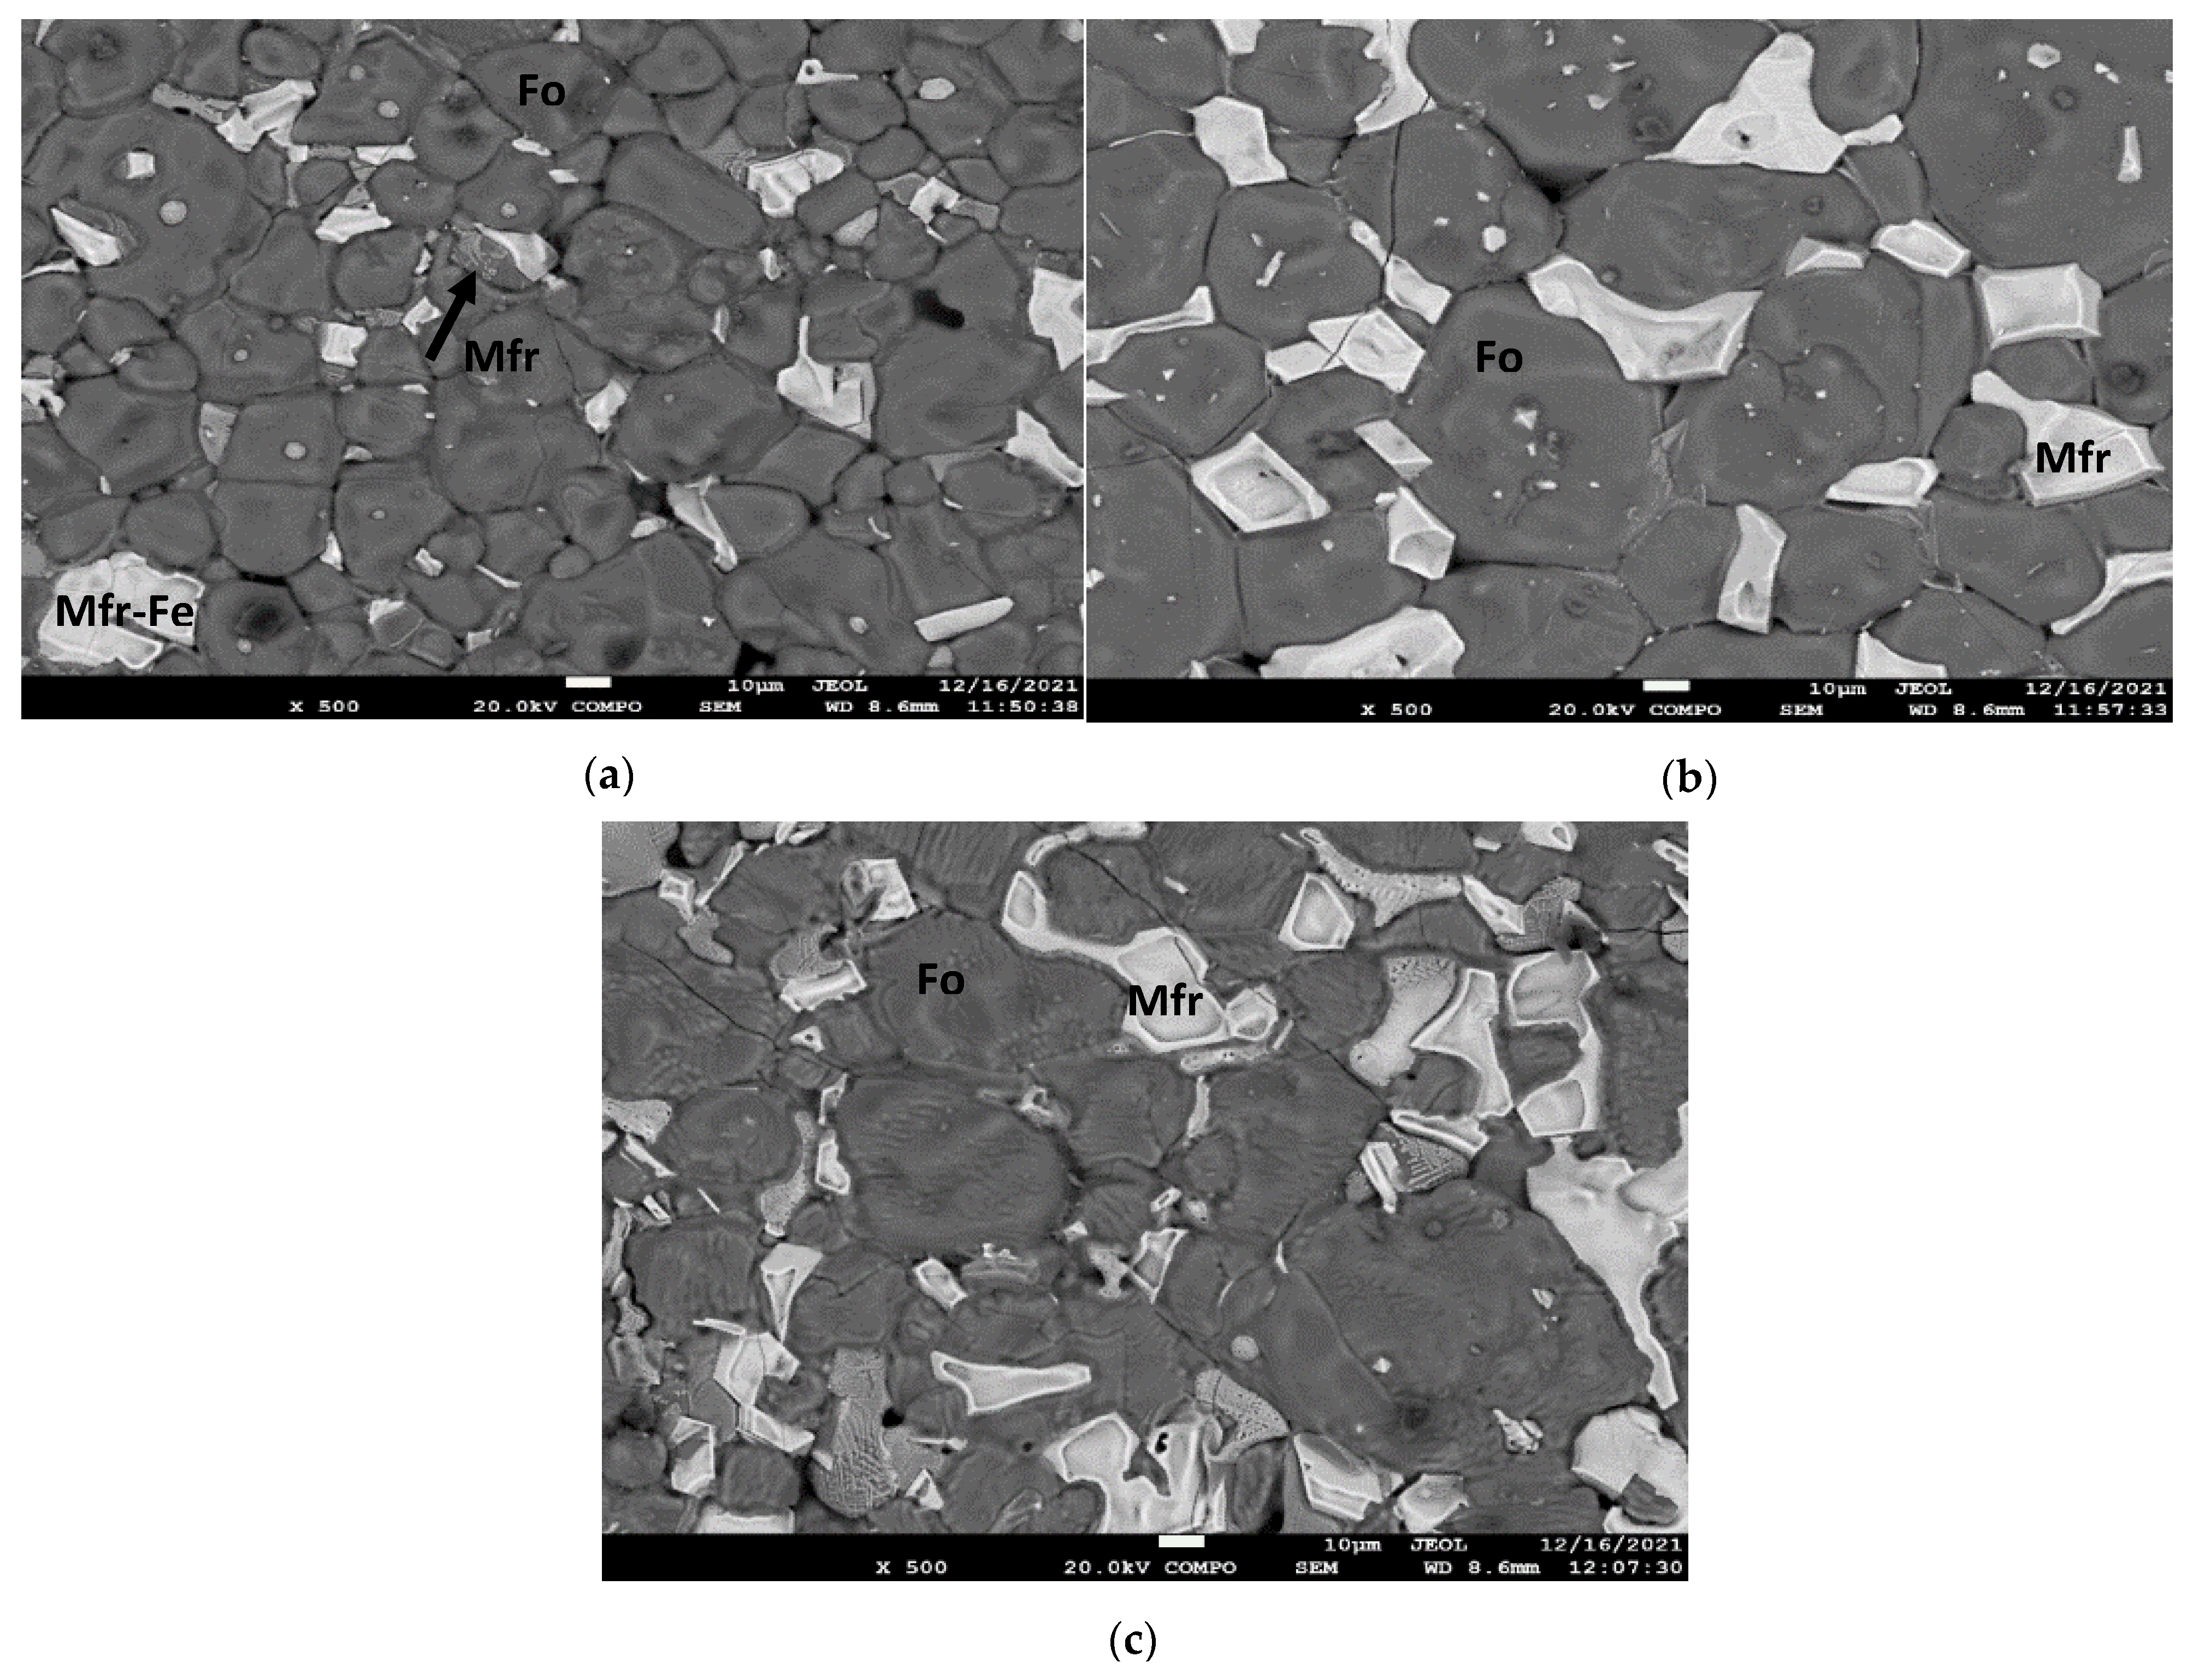
  • The formation of magnesioferrite in the products produced by the addition of MgO is associated with the oxidative atmosphere, where olivine (forsterite) particles decompose to form magnesioferrite crystals and vitreous silica. The oxidation of olivine (Mg, Fe)2SiO4 results in the formation of a major oxide phase, i.e., ferriolivine, magnesioferrite, and a minor oxide phase, i.e., magnetite [36]. Magnesioferrite mineral phase formation is higher with the combination of the additives MgO and Fe2O3 and increases by increasing the percentage of Fe2O3.
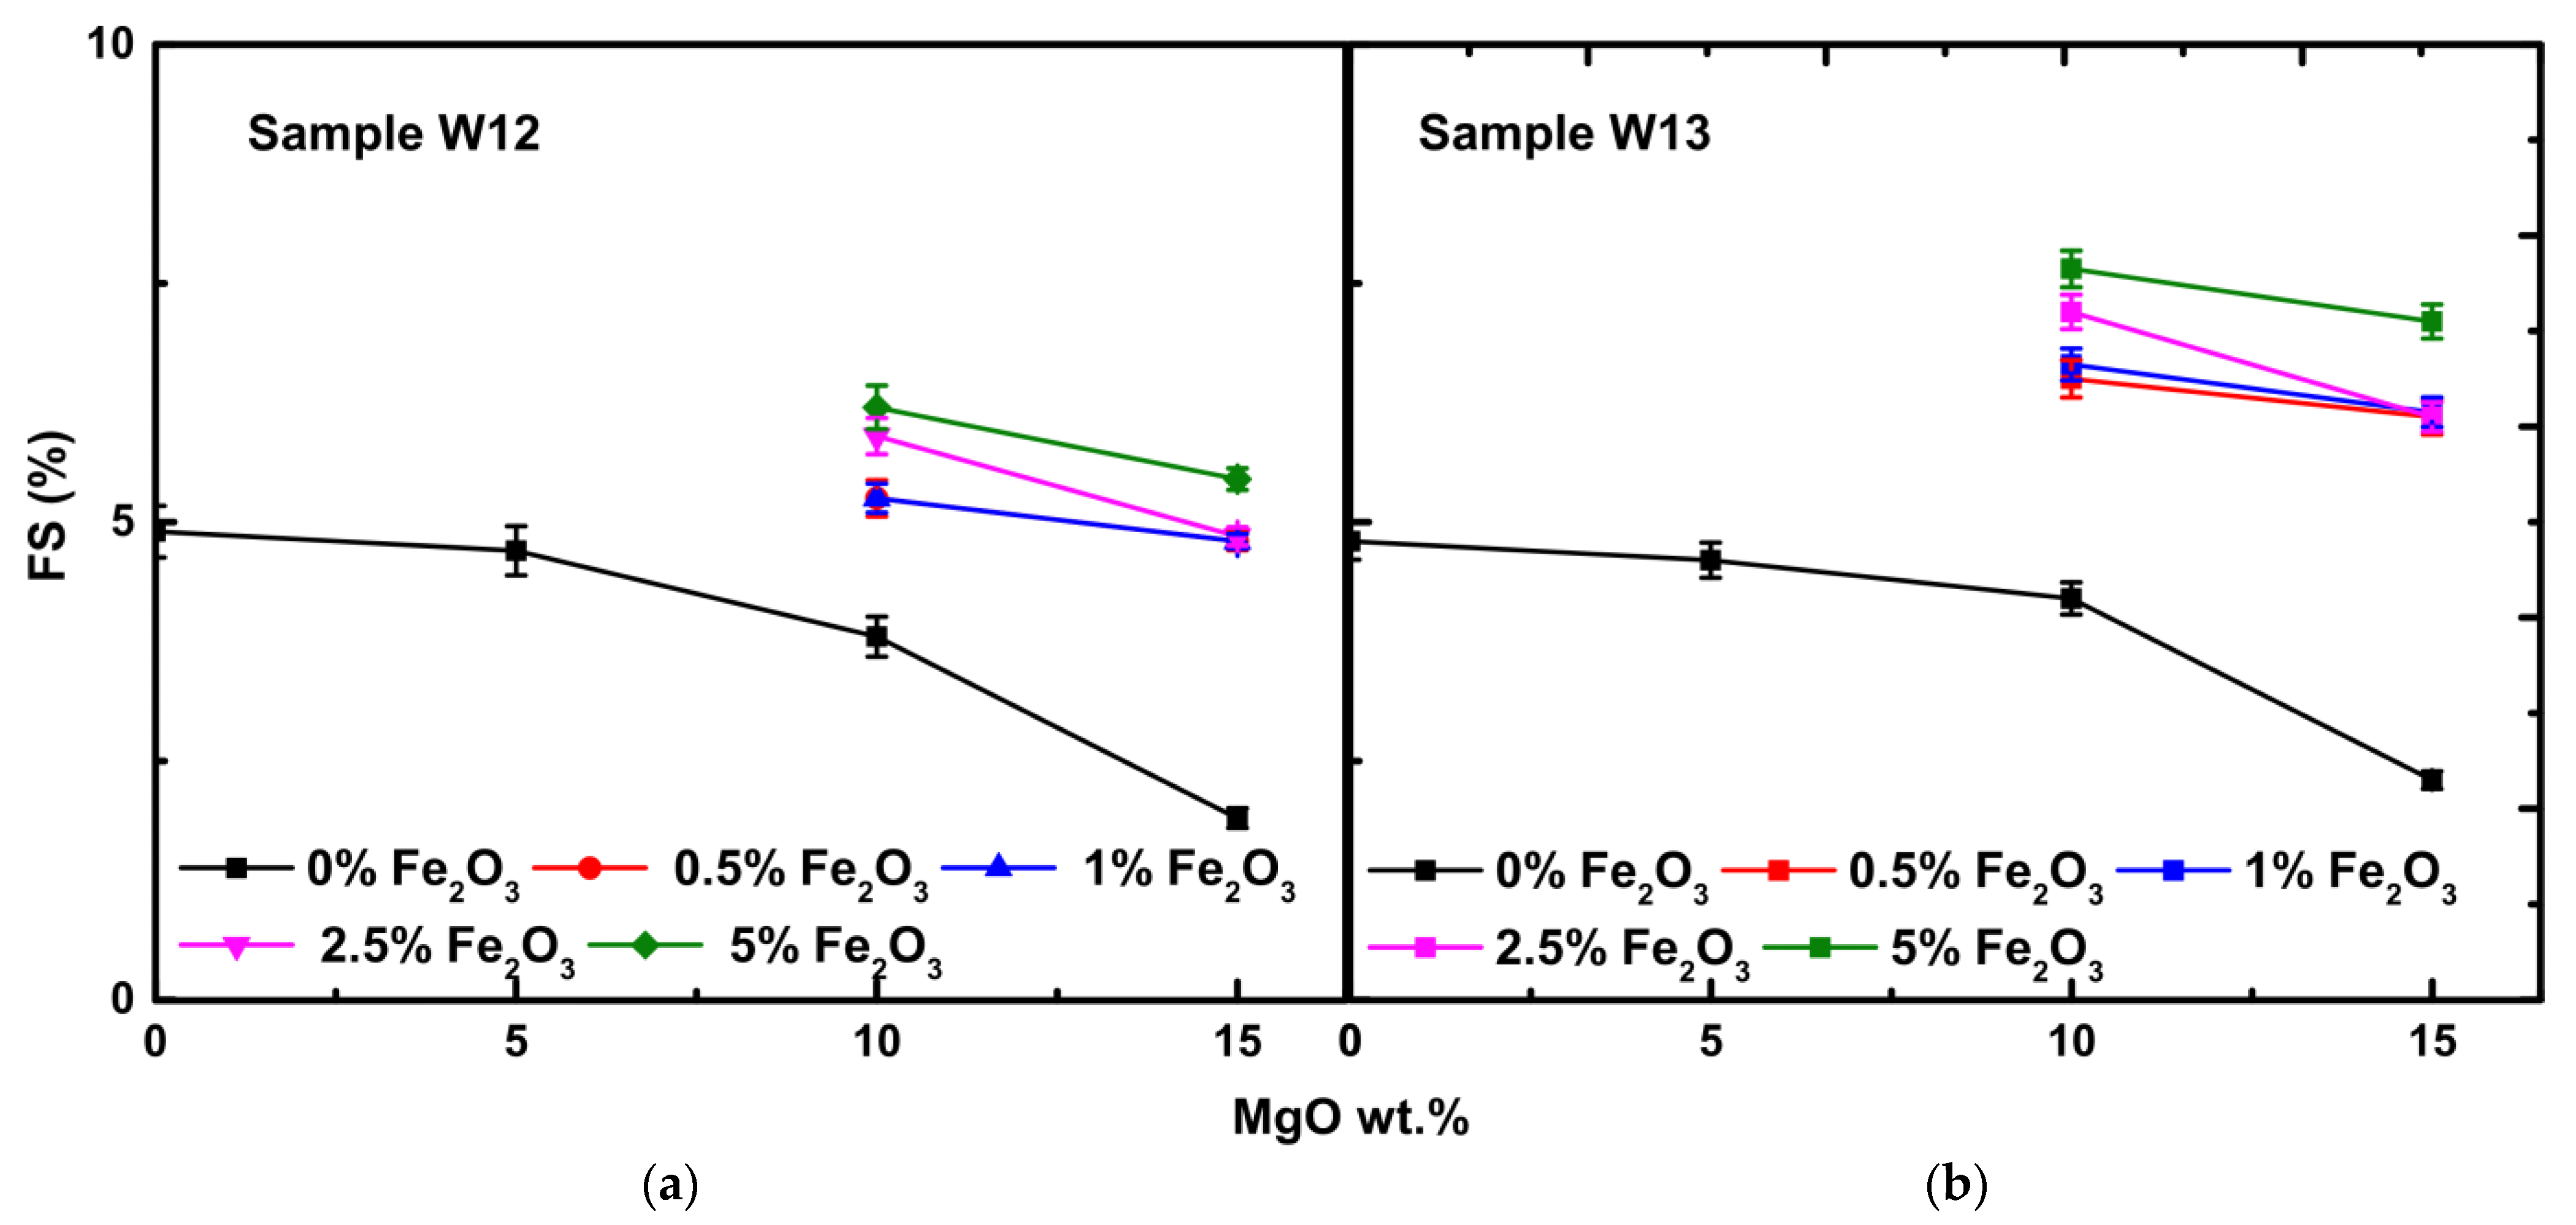
  • The increasing addition of MgO resulted in a decrease in the percentage of unwanted pyroxenes (mainly enstatite), while an increase in the percentage of the desirable forsterite is observed, especially for sample W13, which presents the highest percentage of forsterite with 15 wt.% addition, as the optimum dose for olivine formation for sample W13 is 15.6 wt.%. Maximization of the formation of olivine in the product is reported with the increase of MgO addition after applying the thermal treatment at 1300 °C. On the other hand, sample W12 (optimum dose for sample W12 is 9.4 wt.%) has a maximum percentage of forsterite of 10 wt.% MgO addition and this percentage decreased (~2 wt.%) with increasing magnesioferrite formation.
  • Periclase phase formation in the product is attributed to the higher quantities of MgO (wt.%) added, compared to the respective optimum dose calculated (see Table 3), especially for the sample W12, where the optimum wt.% MgO dose was determined as 9.4%.
The XRD patterns obtained for the examined samples (W12 and W13) combined with the additives of MgO and Fe2O3 after their thermal treatment at 1600 °C for 120 min conclude the following remarks (Figure 3 and Tables S3 and S4, Supplementary Material):
  • The main mineral phases for the products of the raw mining waste samples, i.e., without additives, after the application of thermal treatments, are olivine (forsterite), pyroxenes (clinoenstatite), and magnesioferrite. The oxidative atmosphere, inducing the olivine (forsterite) particles to decompose and form magnesioferrite, is the main reason for the formation of magnesioferrite in the products [37]. The percentage of magnesioferrite increased by increasing Fe2O3 addition.
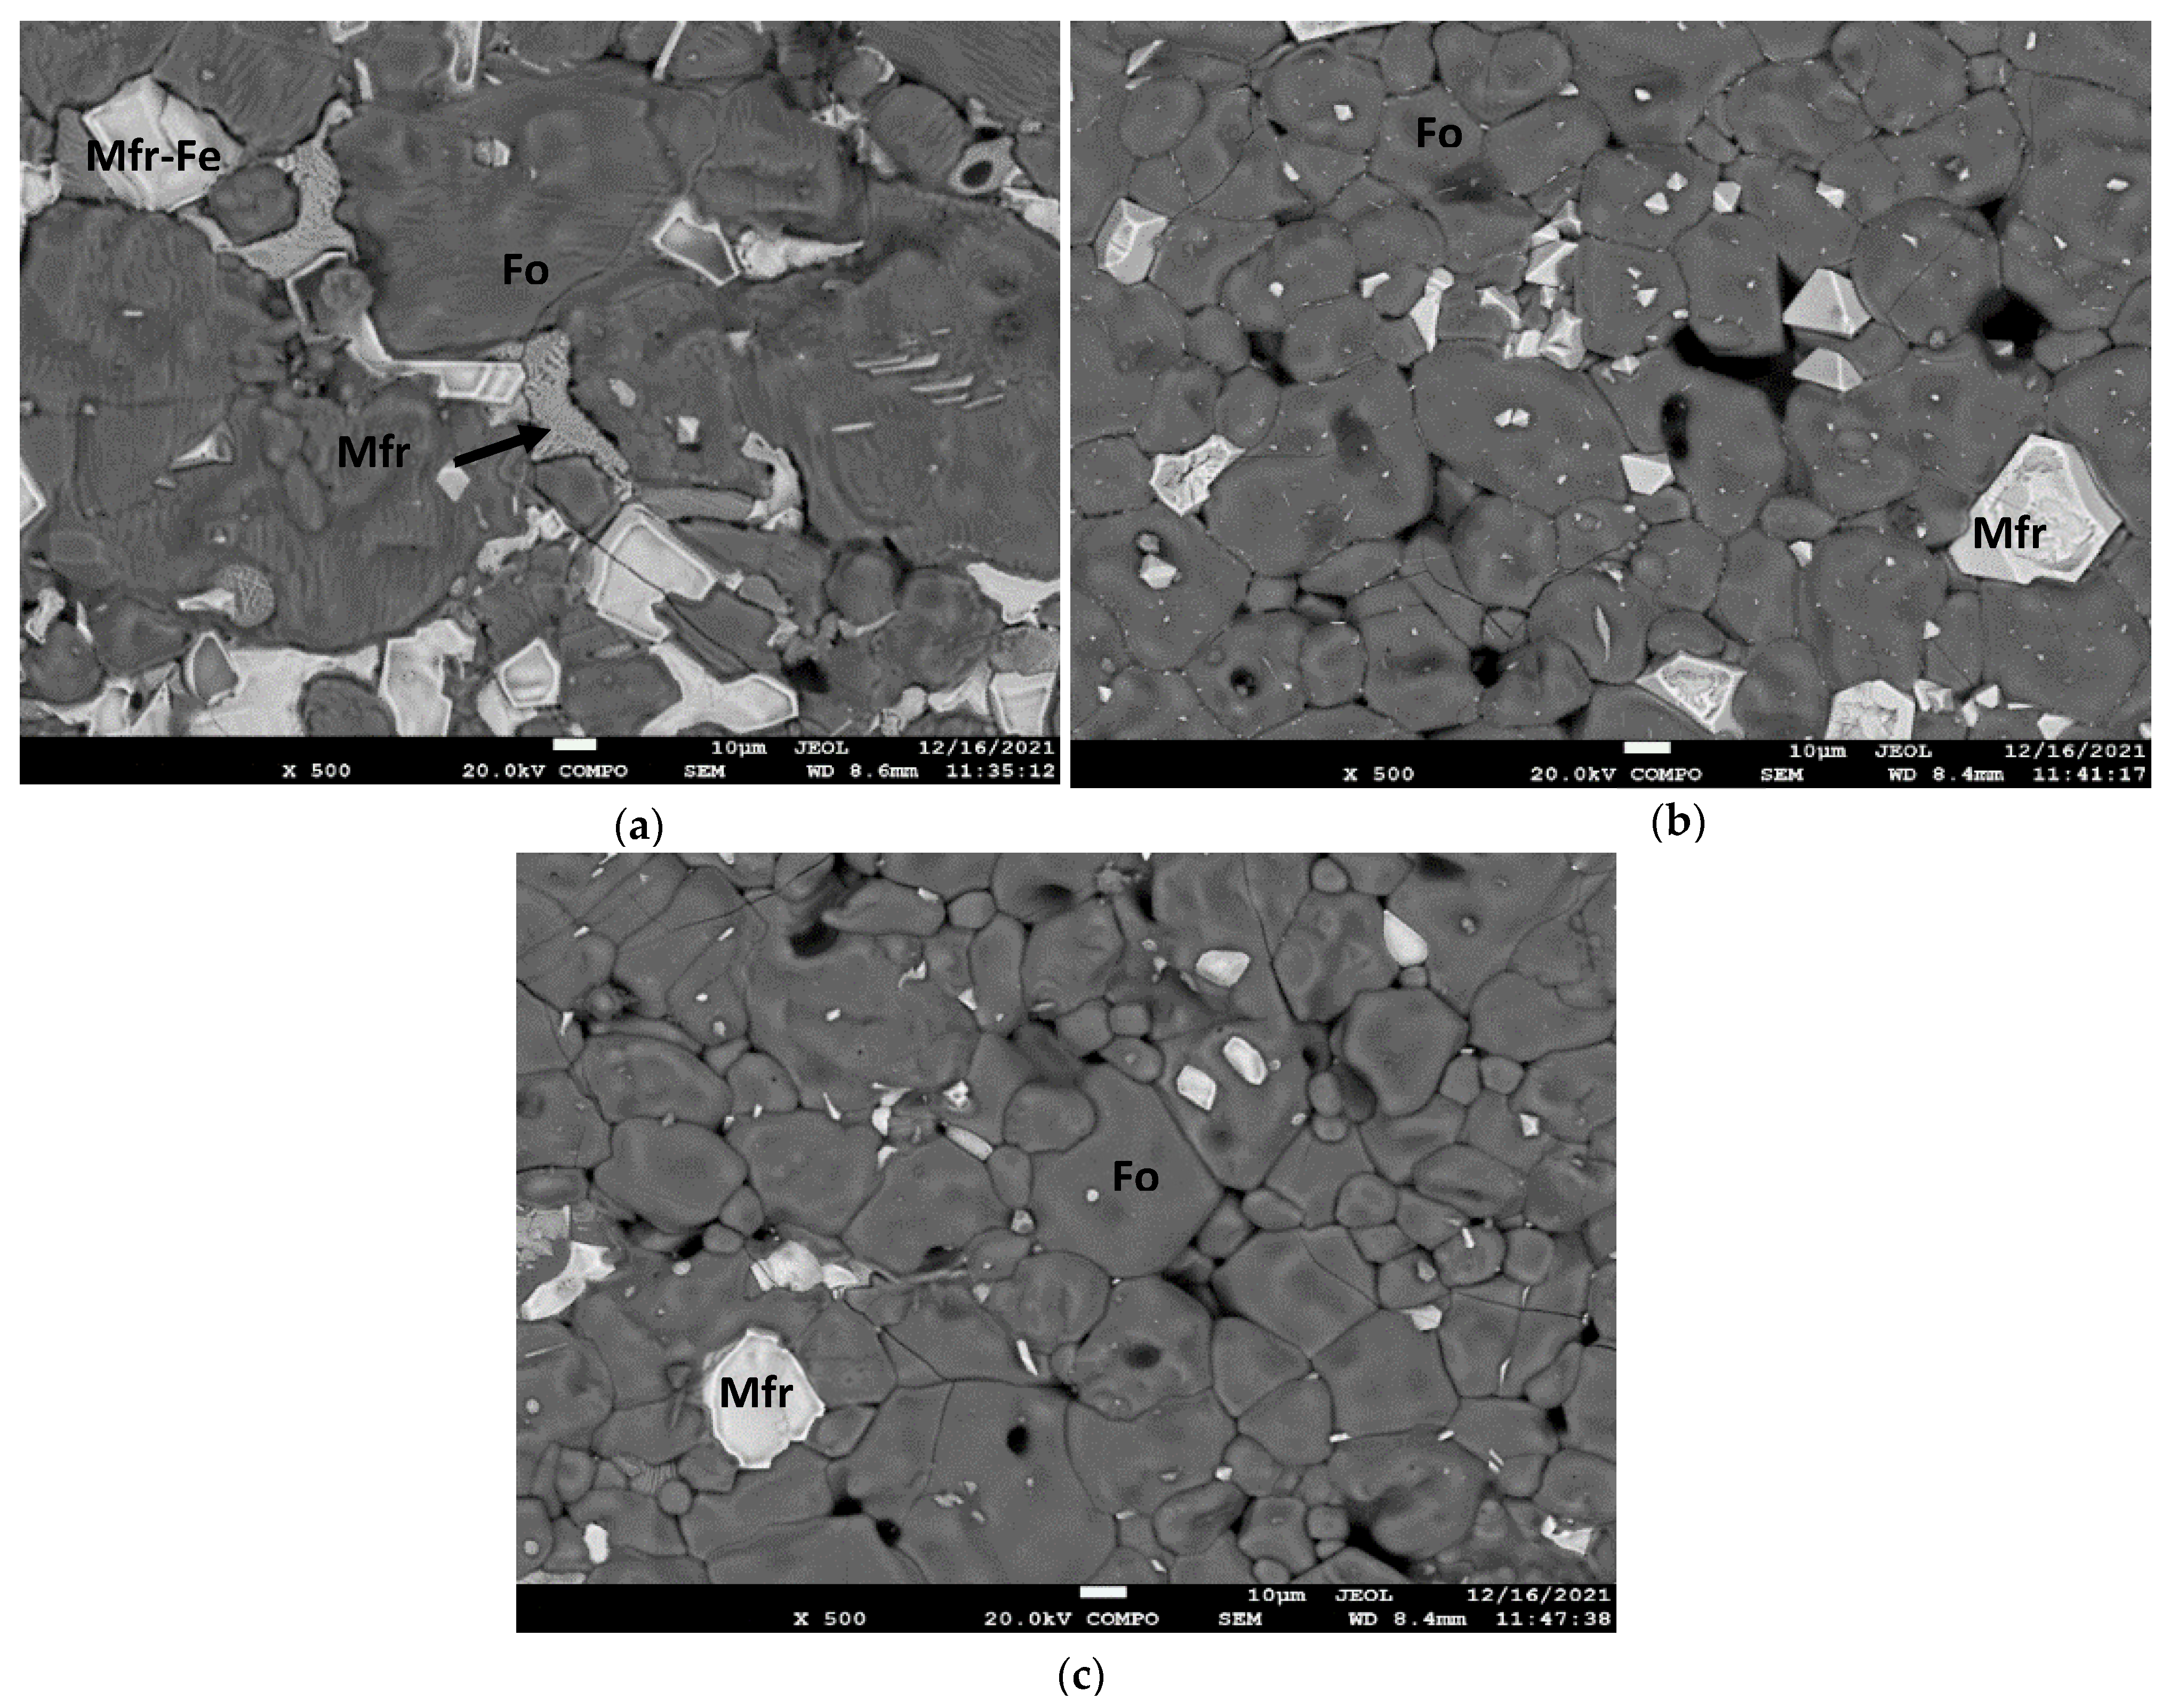
  • The percentage of unwanted pyroxenes (clinoenstatite) decreased and was eventually eliminated as the pyroxenes (enstatite) phases melted at 1557 °C [26,37]. Clinoenstatite is one of the enstatite polymorphs. The rate of metastatic inversion of protoenstatite to clinoenstatite during the cooling step is overly sensitive to the initial properties of the examined sample. It depends on the particle and crystallite size, the thermal treatment temperature, and the degree of compaction of the sample [38].
  • Periclase formation is attributed to the excess of wt.% MgO in terms of the optimum dose required for the formation of olivine for samples W12 and W13, which is 9.4 and 15.6 wt.%, respectively (Table 3).
  • The reported percentages for the desired crystal phase of olivine are higher than 88% as well as the relative percentage of the olivine (forsterite) phase obtained at 1300 °C (+~5wt.%), and of the unwanted crystal phase of pyroxenes is absent at 1600 °C according to the data presented in Tables S1–S4 (Supplementary Material), however, the quantification of mineral phases at 1600 °C cannot lead to safe results, due to the formation of glassy phase at this temperature in high percentages.

3.2. Physical Properties

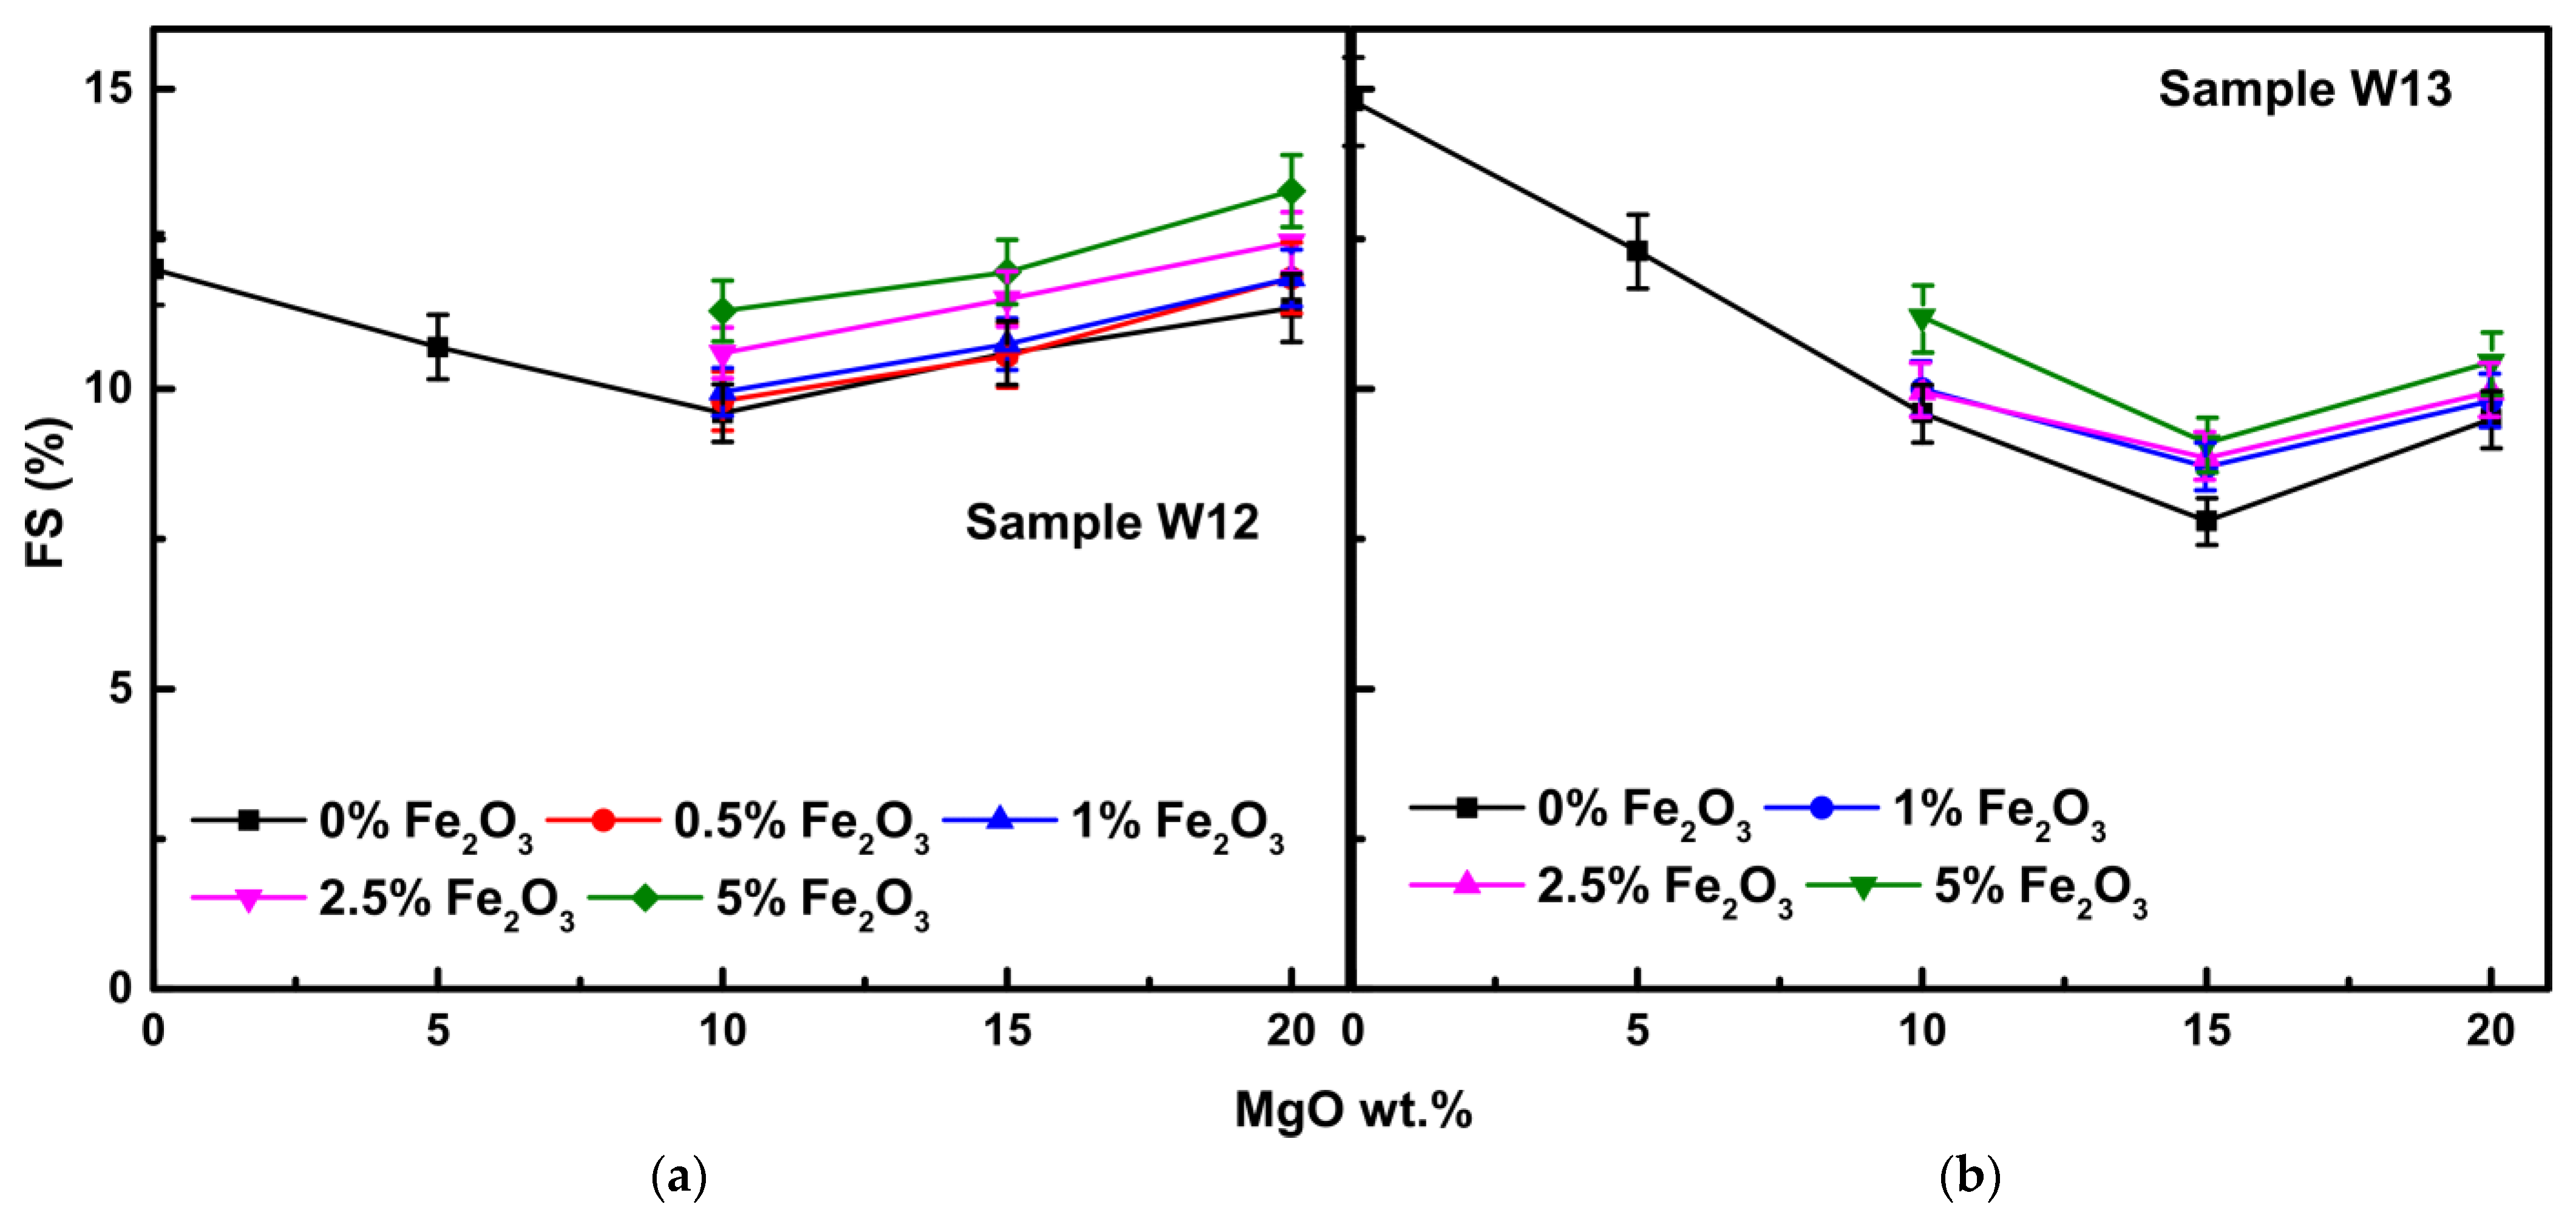
3.2.1. Firing Shrinkage

The evaluation of the quality of the refractoriness of the products includes various physical properties of high importance as the firing shrinkage. Firing products at high temperatures are usually accompanied by shrinkage, which must be minimized (lower than 10%). High levels of permanent firing shrinkage lead to the collapse of the material. This depends on cracks that may be formed or on the detachment of the material from the product. So, firing shrinkage is an important refractory parameter that has to be cautiously evaluated for the proper determination of its value so that further application of the refractory material can be properly determined [39].
The effects of caustic calcined magnesia (MgO) addition in combination with hematite (Fe2O3) on the firing shrinkage of the mining waste samples after applying thermal treatments at 1300 °C and 1600 °C for 120 min were examined. The results and the relevant error bars of the firing shrinkage (FS%) of the examined mining samples after their thermal treatment at 1300 °C and 1600 °C for 120 min are presented in Figure 3 and Figure 4, with the average standard variation (SD%) around ±5% of the presented data (Figure 4 and Figure 5).
A decreasing trend is observed for the FS(%) levels for both selected mineral waste samples at 1300 °C for 120 min with increasing MgO wt.% addition. This trend is more obvious in samples with only MgO wt.% addition than in samples with the combination of additives MgO and Fe2O3 (Figure 4) as well. The FS (%) of the samples W12 and W13 decreased from 4.9% and 4.8% initially, down to 1.9% and 2.3%, respectively, with the addition of only 15 wt.% MgO. This decreasing trend (with increasing MgO wt.%) is obvious, and also with all Fe2O3 wt.% addition doses, even with 5 wt.% Fe2O3, to a lesser extent. The highest reduction level compared to all Fe2O3 doses for sample W12 and sample W13 is 2.5 wt.% addition. More specifically, for the product of W12 and 2.5 wt.% Fe2O3, FS (%) decreased from 5.9% to 4.9%, and for the product of W13 and 2.5 wt.% from 7.2% to 6.1%. In contrast, with increasing Fe2O3 percentage, FS (%) increases for the same percentage of MgO wt.%. More specifically, for the sample W12 with 10 wt.% MgO, the FS (%) increases in the product from 5.3% (0.5 wt.% Fe2O3) to 6.2% (5 wt.% Fe2O3) and for 15 wt.% MgO, FS (%) increases from 4.8% (0.5 wt.% Fe2O3) to 5.5% (5 wt.% Fe2O3). The results for the products of W13 regarding the increasing trend with Fe2O3 wt.% are similar.
In general, caustic calcined magnesia improves the refractoriness of the original samples [30] due to its high melting point (2800 °C) [32] and high refractoriness quality, while it decreases FS (%) levels even in samples with Fe2O3. In addition, the required dose of MgO (Table 3) can maximize the formation of olivine (forsterite) at the examined firing temperature, thereby improving the refractory properties while maintaining FS(%) at low levels [30]. In contrast, adding Fe2O3 increases FS (%) due to the formation of magnesioferrite. High solubility in MgO is reported for the iron oxide (Fe2O3), which forms cationic vacancies in MgO, causing high atomic mobility. In addition, it encourages the deposition of magnesioferrite spinel by periclase, enhancing direct bond formation [33].
The FS (%) levels at thermal treatment at 1600 °C for 120 min for both samples showed a minimum FS (%) value. This trend is obvious in all samples, with the addition of only MgO wt.%, and in samples with a combination of additives MgO and Fe2O3. For sample W12, the minimum FS (%) is 10 wt.% MgO addition (optimum dose 9.4 wt.%) and for sample W13 for 15 wt.% MgO addition (optimum dose 15.6 wt.%) (Table 3). These results indicate that the optimum dose addition of MgO wt.% for both samples improves refractoriness (lower FS (%) levels) even when higher temperature treatment (1600 °C) is applied and in combination with other additives. However, the addition of MgO plus the optimal dose slightly increases FS (%) due to the transformation of MgO excess to periclase and by the addition of Fe2O3.

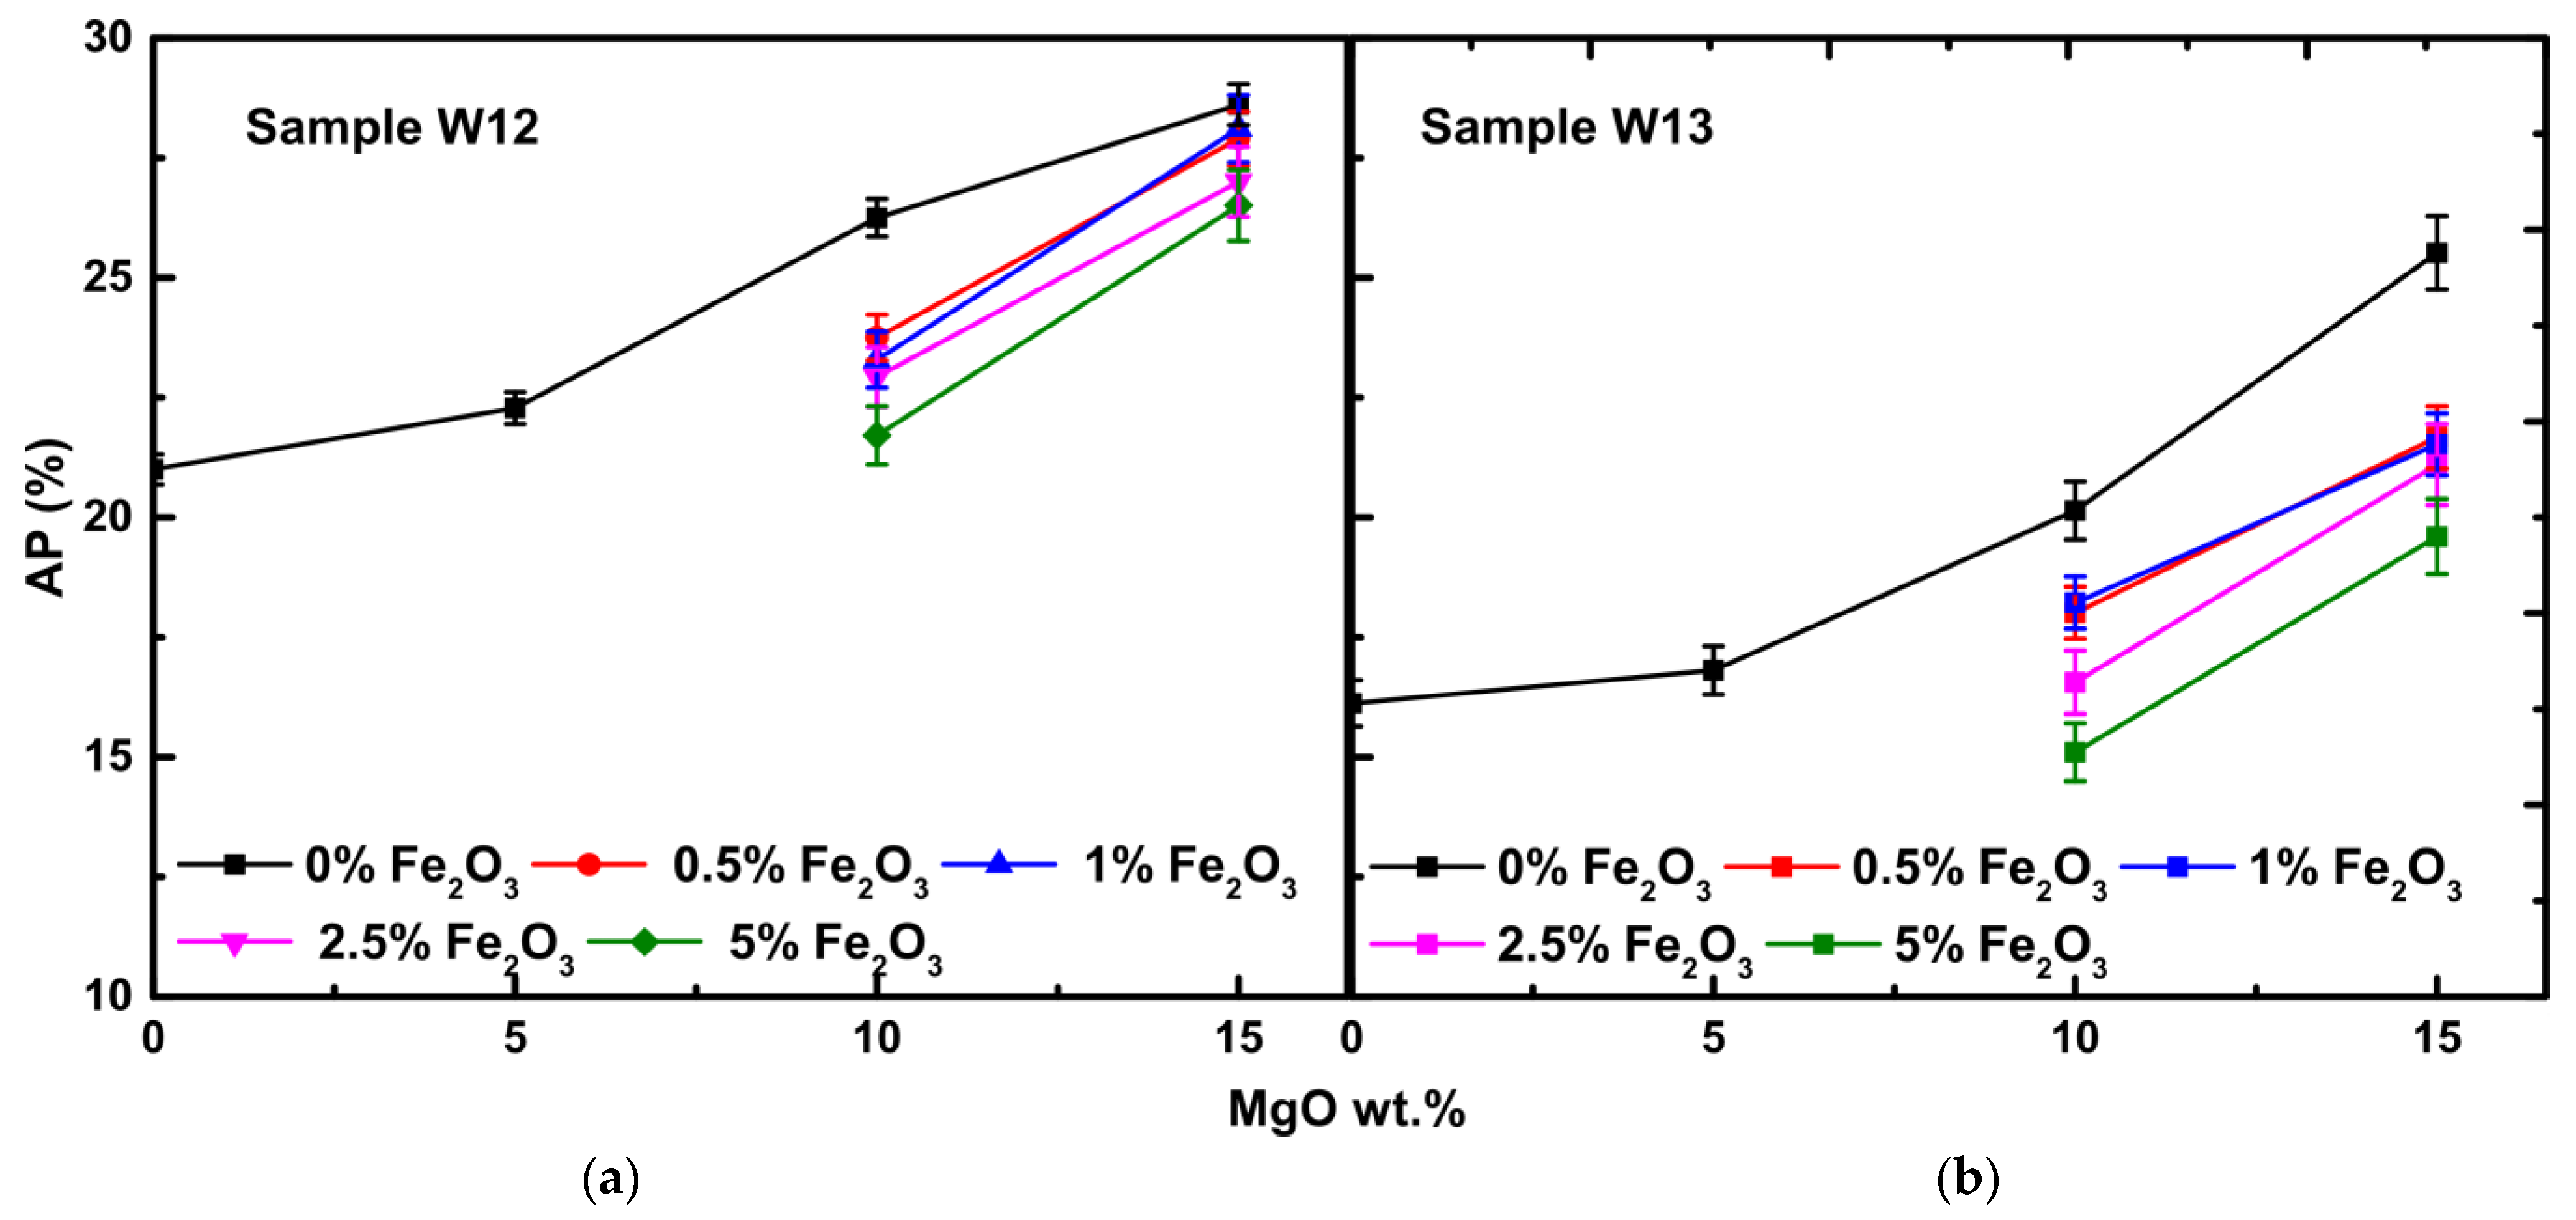
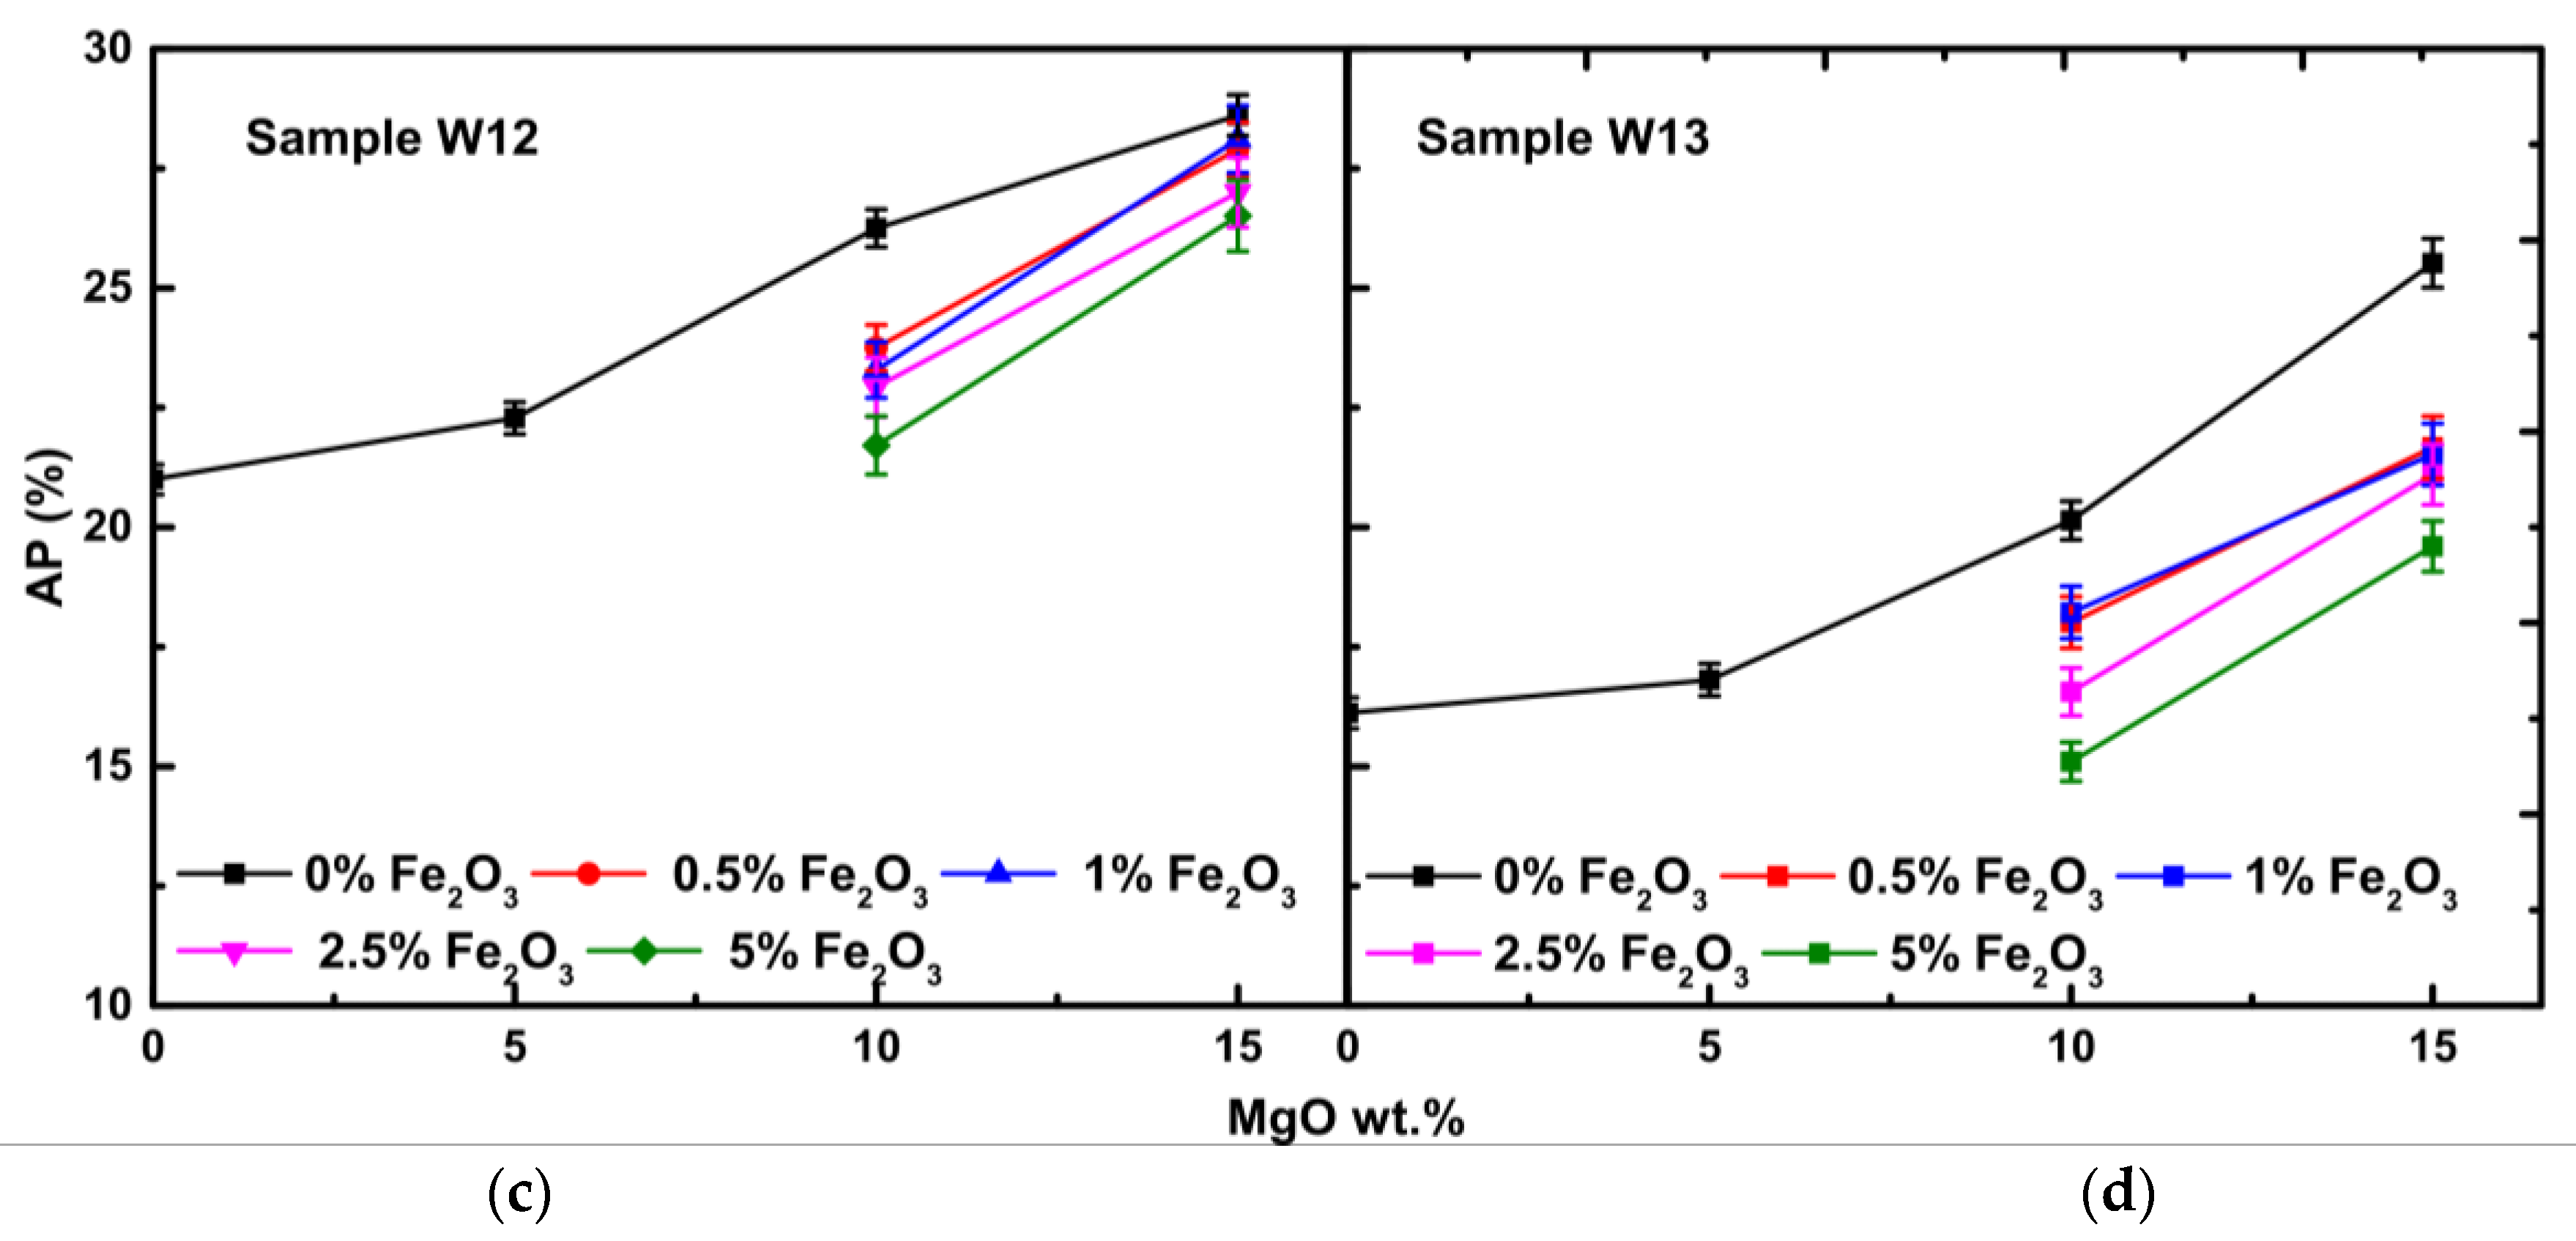
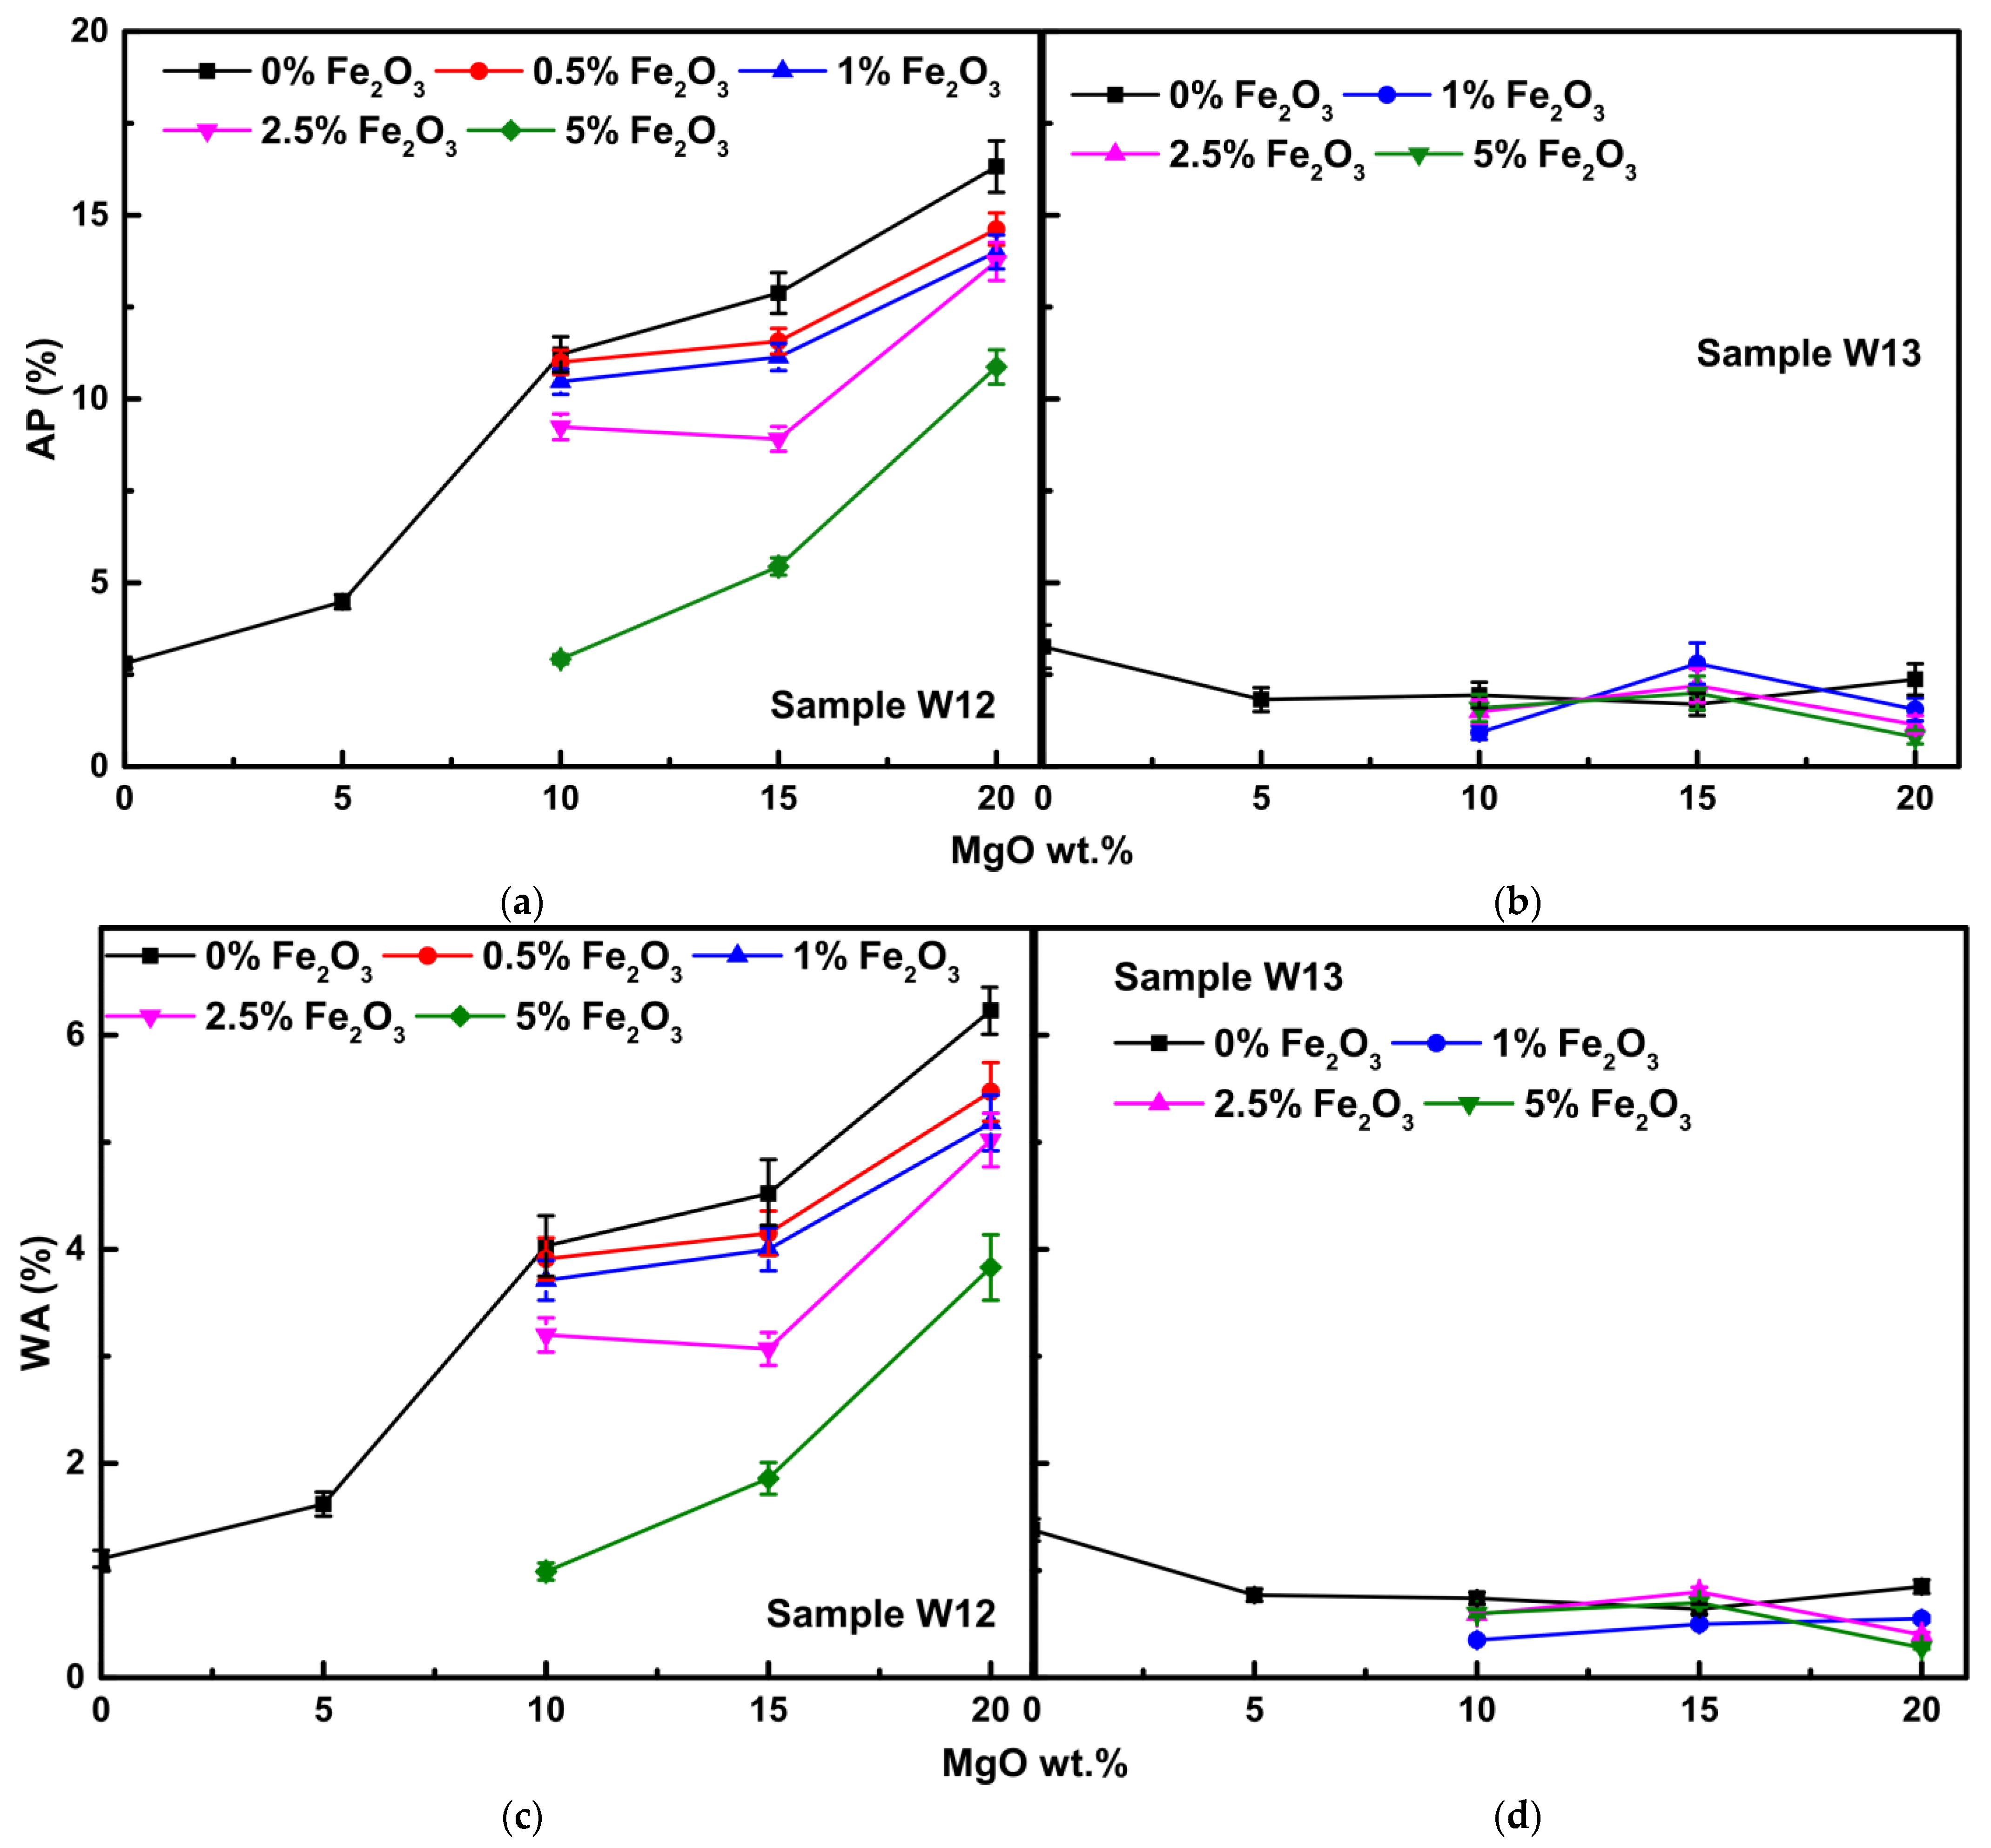
3.2.2. Water Absorption and Apparent Porosity
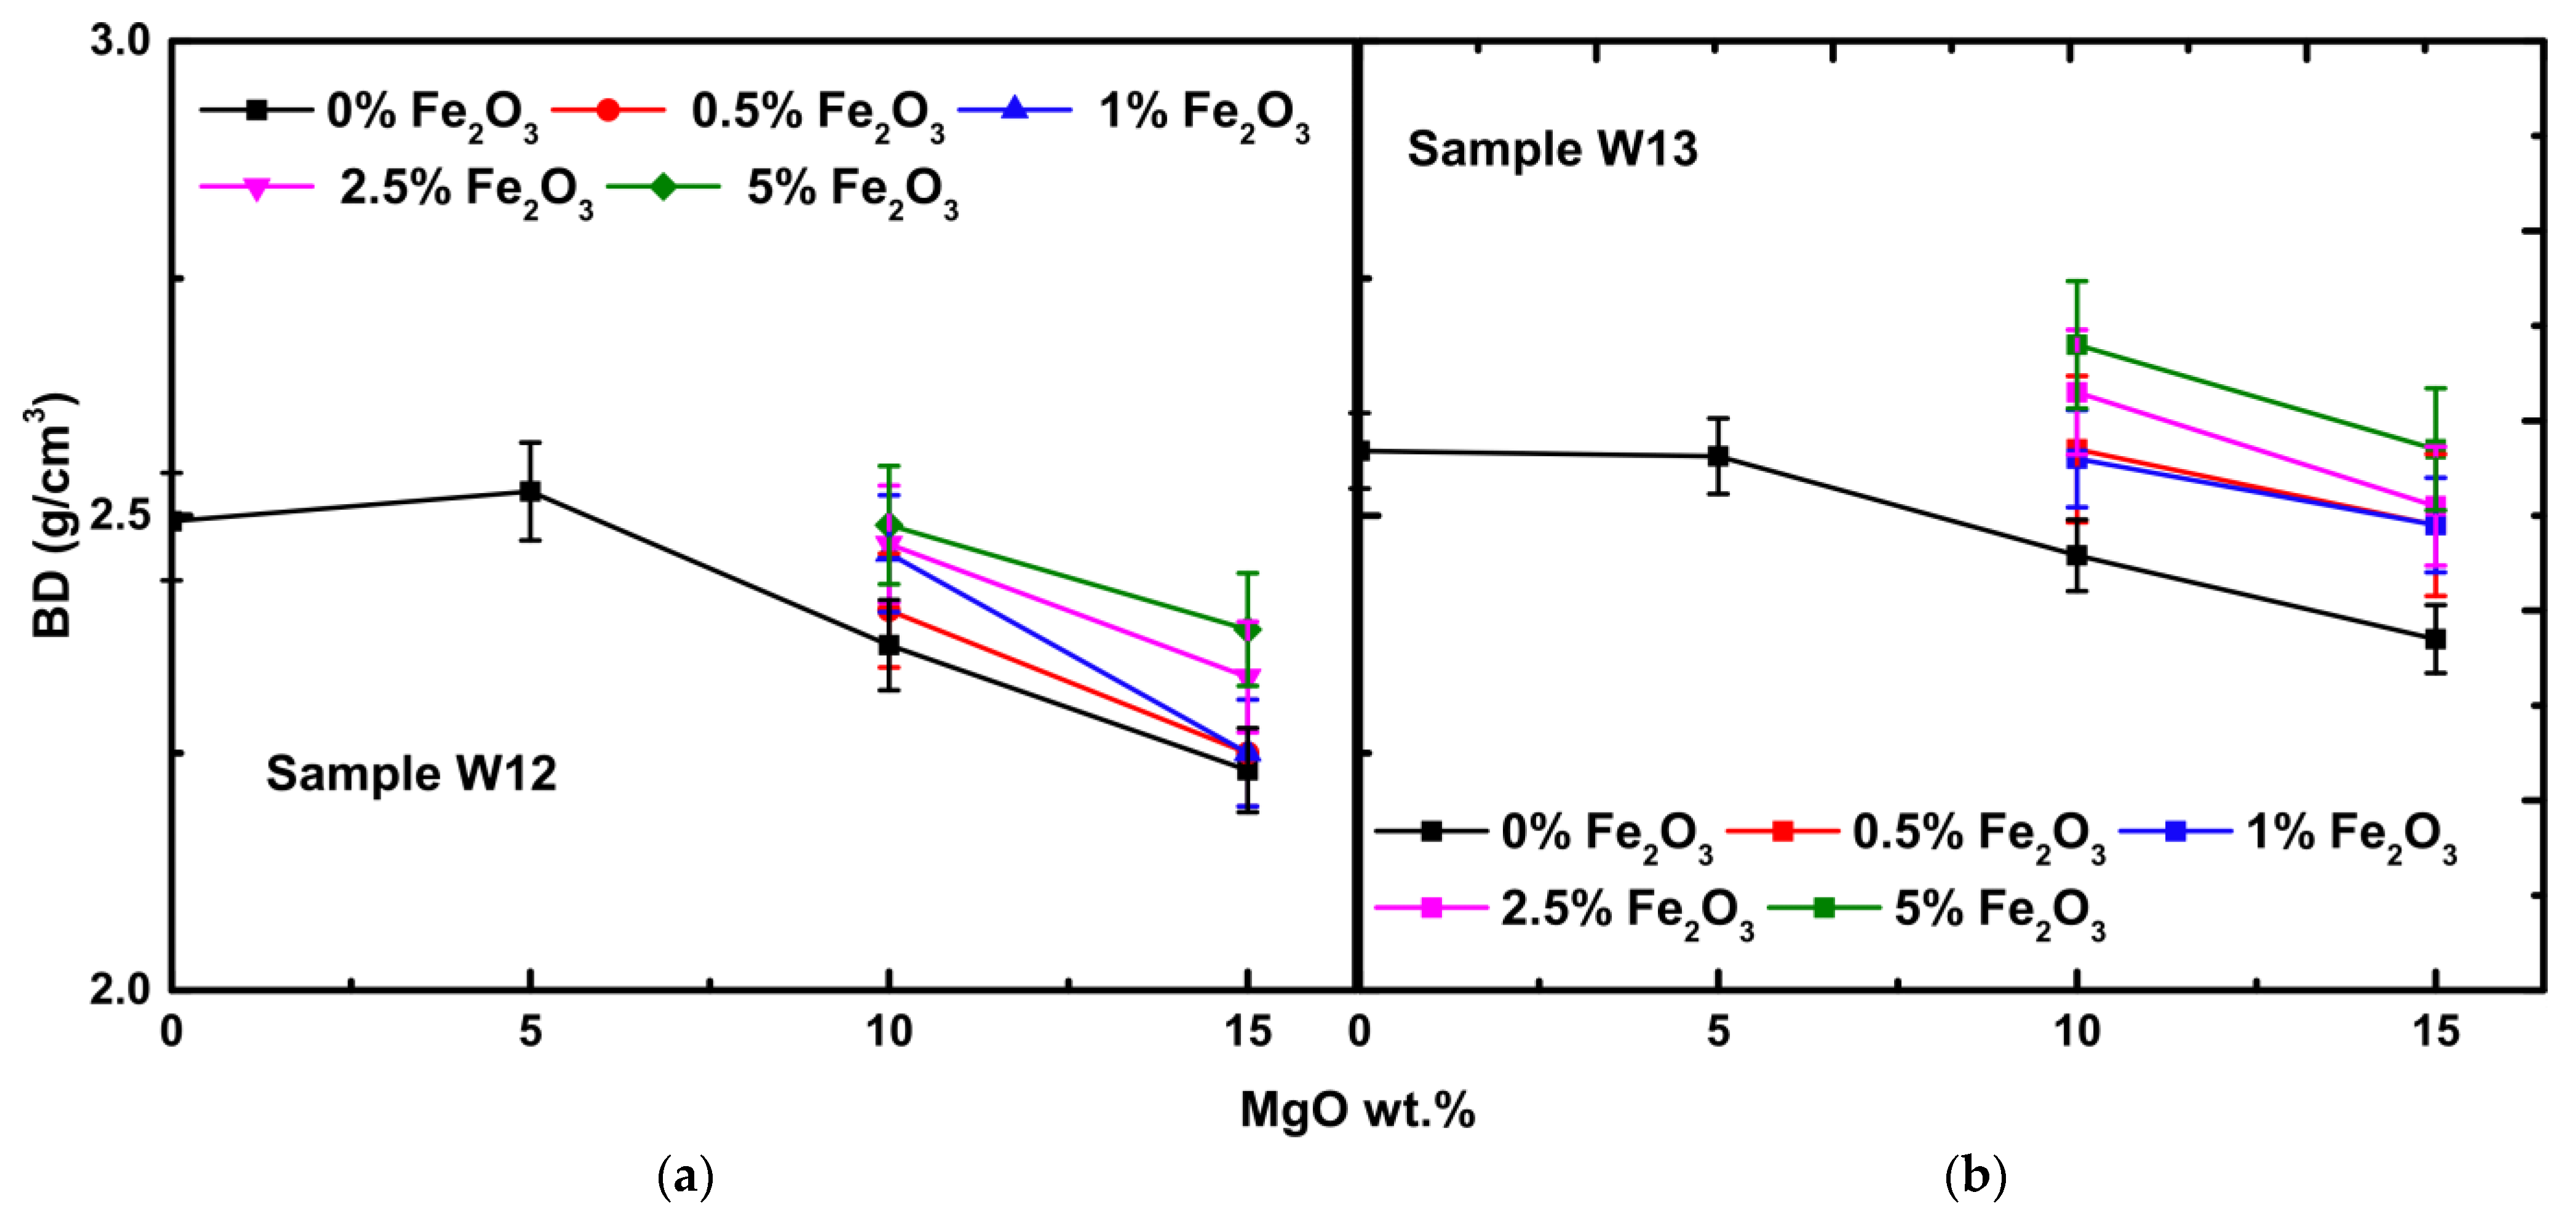
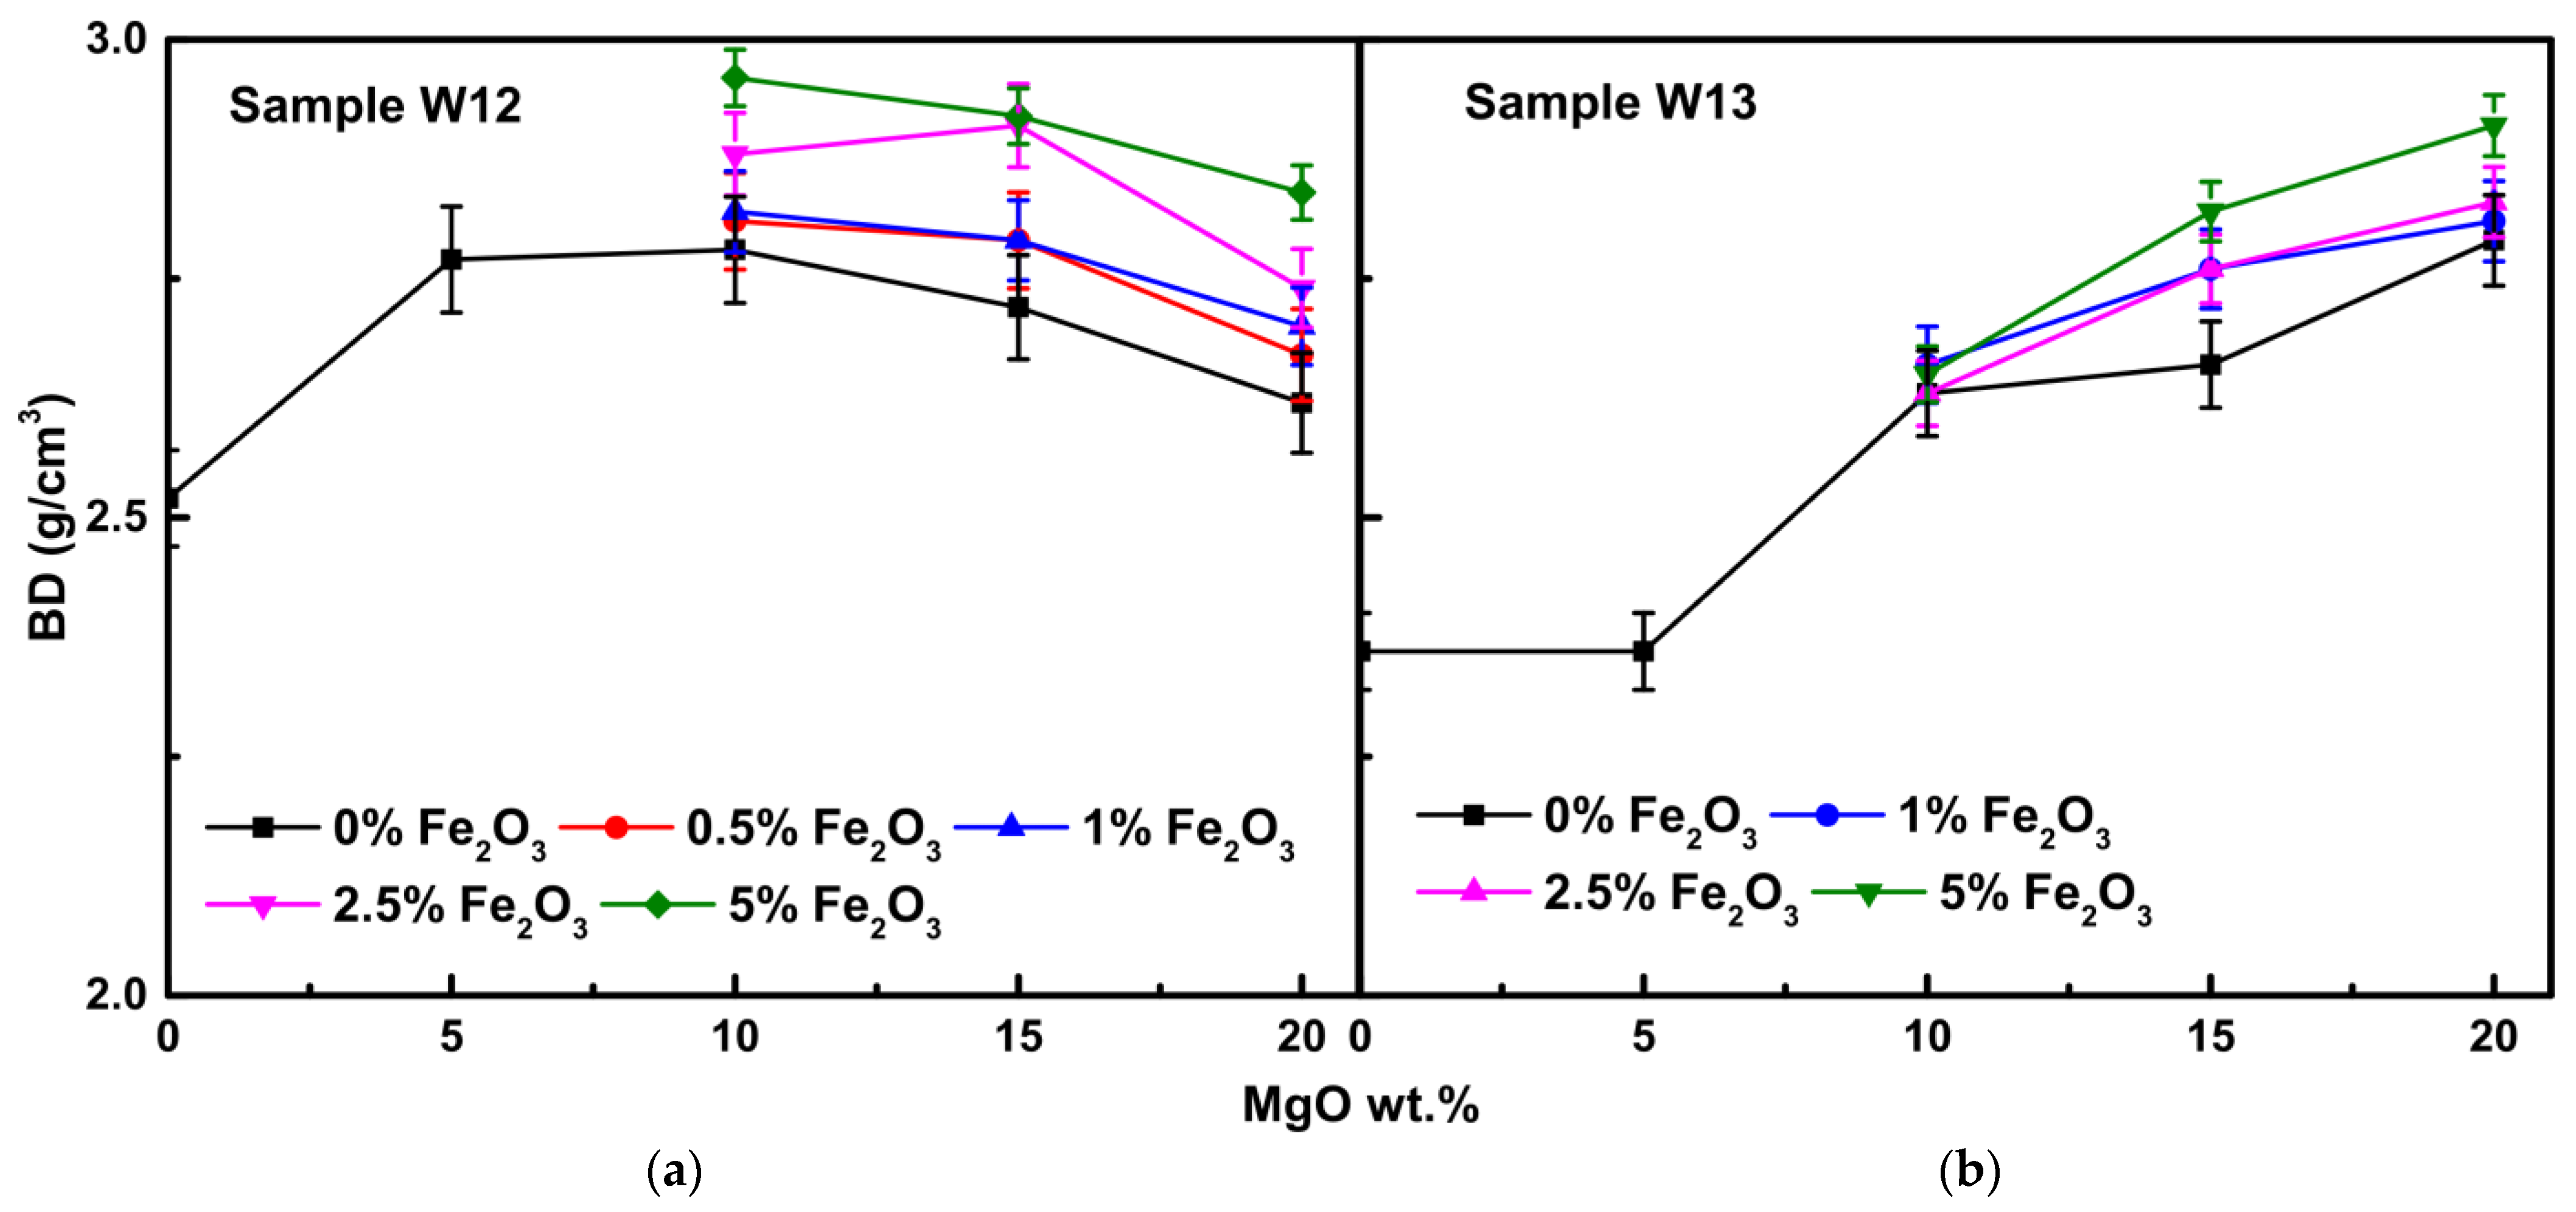
Water absorption (WA%) and Apparent Porosity (AP%) are important physical properties of working refractories; however, they are usually connected with microcracking and mechanical properties. The results and the relevant error bars of WA% and AP% of the examined mining waste samples after their thermal treatment at 1300 °C and 1600 °C for 120 min are presented in Figure 5 and Figure 6, with the average standard variation (SD%) around ±5% of the presented data (Figure 6 and Figure 7).
The WA (%) and AP (%) values for the products of W12 and W13 after thermal treatment at 1300 °C for 120 min increased with the addition of MgO wt.%, while they decreased with an increase of Fe2O3 wt.% addition for the same percentage of MgO (Figure 6). More specifically, the WA (%) values for the W12 sample increased by 2.5–3% with increasing the percentage of MgO from 10 to 15 wt.%, while at the same time, AP (%) values increased by >4%. The same increasing trend was applied for the W13 sample, while WA (%) values increased by 1.5–2% with increasing MgO percentage from 10 to 15 wt.%, while at the same time, AP (%) values increased by 3–4%. The observed increase in WA (%) and AP (%) values can be attributed to the hydration of magnesia. Magnesium oxide tends to hydrate, resulting in magnesium hydroxide (Mg(OH)2) [40]. Another important factor influencing hydration is the open porosity of magnesia particles since magnesia generally shows a higher hydration rate than the already fused (dead burn) magnesia [41].
However, for sample W12 and stable addition of MgO 10 wt.%, increasing of Fe2O3 wt.%, decreases WA (%) from 11.1% (no Fe2O3) to 8.7% (5 wt.% Fe2O3) and AP (%) values, from 26.3% (no Fe2O3) to 21.7% (5 wt.% Fe2O3). Similarly for stable addition of MgO 15 wt.%, WA (%) values are decreased from 12.8% (no Fe2O3) to 11.1% (5 wt.% Fe2O3) and AP (%) values from 28.6% (no Fe2O3) to 26.5% (5 wt.% Fe2O3). In addition, for sample W13 and stable of MgO 10 wt.%, WA (%) values are decreased from 8.2% (no Fe2O3) to 5.6% (5 wt.% Fe2O3) and AP (%) values from 20.1% (no Fe2O3) to 15.1% (5 wt.% Fe2O3). Furthermore, the same sample for stable addition of MgO 15 wt.%, WA (%) values are decreased from 10.8% (no Fe2O3) to 7.6% (5 wt.% Fe2O3) and AP (%) values from 25.5% (no Fe2O3) to 19.6% (5 wt.% Fe2O3). These results can be attributed to the effect of Fe2O3 and the formation of magnesioferrite. The actual density of magnesioferrite (MgFe2O4 = 4.51 g/cm3) and actual density of Fe2O3 (5.24 g/cm3) are higher compared to MgO (3.58 g/cm3) [33]. Therefore, adding Fe2O3 favors sintering due to the formation of magnesioferrite and reduces porosity. WA (%) and AP (%) are two refractory properties directly connected with the sintering process. Elimination of porosity and high diffusion rates in the liquid (due to sintering) results in faster bonding and densification of the products with the corresponding improvement of the refractory properties, i.e., in physical, chemical, and mechanical properties [42].
In general, the AP (%) values for the W12 sample ranges from 21.7–28.6% and for sample W13 from 15.1–25.5%. AP (%) values for sample W12 are higher than sample W13, while sample W12 has an excess of MgO wt.% regarding the necessary dose for olivine formation. The optimum dose for sample W12 is 9.4%, while sample W13 is 15.6% (Table 3). The permissible limits for the production of refractory MgO products that are commercially applicable, regarding the AP (%) values, for the bricks that contain 90% MgO, usually range between 18–21%, and for the respective bricks that contain 98% MgO, between 17–20% [43], therefore some of the samples are into the permissible levels depending on the group of refractories.
The WA (%) and AP (%) values for sample W12 and thermal treatment at 1600 °C for 120 min showed the same increasing trend with the addition of MgO wt.%, while they decreased with increasing of Fe2O3 wt.% for the same percentage of MgO addition (Figure 7). On the other hand, for sample W13, the values WA (%) and AP (%) have small fluctuations with a final downward trend.
More specifically, the WA (%) values for the W12 sample increased >1.5–2% with the increasing MgO percentage from 10 to 20 wt.%, while at the same time, AP (%) values increased >4–8%. In Elmagharaby et al., apparent porosity also increased from 5 to 20% with the addition of MgCO3 [14]. For the sample W13 and MgO wt.% 10–20%, the WA (%) values range from 0.3 to 0.9% and the corresponding AP (%) values from 0.8 to 2.8%. These values are significantly lower than the corresponding values of the W12 sample. The noticed increase of WA (%) and AP (%) values for the W12 sample can be attributed to the hydration of magnesia to (Mg(OH)2) [42] and to the open porosity of the magnesia particles, which show high hydration percentage [43].
Increasing Fe2O3 wt.% also decreased the WA (%) and AP (%) values for the W12 sample and thermal treatment at 1600 °C. More specifically, the WA (%) for the stable addition of MgO 10 wt.% decreased from 4.0% (no Fe2O3) to 1.0% (5 wt.% Fe2O3) and the AP (%) values decreased from 11.2% (no Fe2O3) to 2.9% (5 wt.% Fe2O3). Similarly, for stable addition of 15 wt.% MgO, WA (%) values decreased from 4.5% (no Fe2O3) to 1.9% (5 wt.% Fe2O3) and AP (%) values from 19.9% (no Fe2O3) to 5.4% (5 wt.% Fe2O3), and finally for 20 wt.% MgO, WA (%) values from 6.2% (no Fe2O3) decreased to 3.8% (5 wt.% Fe2O3) and AP (%) values from 16.3% (no Fe2O3) decreased to 10.9% (5 wt.% Fe2O3). Moreover, for sample W13, the values WA (%) and AP (%) have small fluctuations with increasing Fe2O3 addition, with a final downward trend. The downward trend of the values, in thermal treatment at 1600 °C, with increasing of Fe2O3, can be attributed to the influence of Fe2O3 on the sintering due to a lower melting point of iron oxide compared to MgO and the formation of magnesioferrite. The actual density of magnesioferrite (MgFe2O4 = 4.51 g/cm3) and the actual density of Fe2O3 (5.24 g/cm3) are higher compared to MgO (3.58 g/cm3) [33]. Therefore, the addition of Fe2O3 favors sintering and reduces porosity.
The decrease in Water Absorption/Apparent Porosity values is associated with the increased strength of the product. In contrast, the lower porosity levels are linked with higher bulk density values, corresponding to higher hardness, mechanical strength, and high resistance to chemical attack of the products; inversely, the lower porosity levels produce the opposite results [44,45]. In conclusion, the desired results are values of low apparent porosity and high bulk density.
In general, the AP (%) values for W12 range from 2.9–16.3% and for the sample W13 from 0.8–2.8%. AP (%) values for sample W12 are higher than sample W13, while sample W12 has an excess of MgO wt.% regarding the necessary dose for olivine formation. The optimum dose for sample W12 is 9.4% instead of 15.6% for sample W13 (Table 3). In addition, the AP (%) values for both samples at 1600 °C are significantly lower than the corresponding samples at 1300 °C. This is attributed to the sintering process, which is enhanced at higher temperatures. Also, in the study of Emrullahoglu et al., apparent porosity decreased to 3.4% with increasing sintering temperature to 1400 °C in serpentine mining waste samples with the addition of magnesium chloride water solution [14]. The permissible limits for the production of refractory MgO products that are commercially applicable, regarding the AP (%) values for bricks that contain 90% MgO, usually range between 18–21% for the bricks containing 90% MgO, and for the respective bricks that contain 98% MgO, between 17–20% for the respective bricks with 98% MgO content [46]; therefore some of the samples are at the permissible levels depending on the group of refractories being targeted.

3.2.3. Bulk Density

The results and the relevant error bars regarding the Bulk Density (BD) values for the examined mining samples W12 and W13 with MgO and Fe2O3 wt.% addition after thermal treatment at 1300 °C and 1600 °C for 120 min are presented in Figure 8 and Figure 9. The Standard Deviation (SD%) was approximately within ±5.
A decreasing trend is reported for BD values for both examined mining waste samples, following the increase of MgO wt.% addition and in all Fe2O3 wt.% percentage (0.5–5 wt.%) after the thermal treatment at 1300 °C for 120 min. Still, an increasing trend was observed with increasing Fe2O3 wt.% for the same percentage of MgO. More specifically, for the W12 sample this parameter decreased from 2.36–2.49 g/cm3 (stable 10 wt.% MgO) to 2.23–2.38 g/cm3 (stable 15 wt.% MgO) and for the sample W13 from 2.46–2.68 g/cm3 (stable 10 wt.% MgO) down to 2.37–2.57 g/cm3 (stable 15 wt.% MgO) (Figure 8). The reason this trend is observed is due to the addition of MgO, more specifically for sample W12, where an excess of MgO presence compared to the theoretical requirement for olivine formation is noticed (Table 3). The inverse correlation between the BD values with the AP (%) measurements is verified by the obtained results (Section 3.2.2).
On the other hand, BD levels for both samples showed an increasing trend with the increase of Fe2O3 wt.%. BD values for sample W12 and stable 10 wt.% MgO increased from 2.36 g/cm3 (no Fe2O3) to 2.49 g/cm3 (5 wt.% Fe2O3), and stable t 15 wt.% MgO increased from 2.23g/cm3 (no Fe2O3) to 2.38 g/cm3 (5 wt.% Fe2O3). Similarly, for sample W13 and stable 10 wt.% MgO increased from 2.46 g/cm3 (no Fe2O3) to 2.68 g/cm3 (5 wt.% Fe2O3) and stable 15 wt.% MgO increased from 2.37g/cm3 (no Fe2O3) to 2.57 g/cm3 (5 wt.% Fe2O3) (Figure 7). The results showing an increase in BD values correlate with the corresponding small decrease shown for AP (%) levels after adding Fe2O3 since the BD measurements present a reverse relation to the AP (%) measurements. This increase is attributed to the influence of the addition of Fe2O3 due to magnesioferrite spinel formation [33]. The increase in bulk density indicates that sintering has occurred [47].
The BD values of the sample W12 for thermal treatment at 1600 °C and 120 min showed a slightly decreasing trend after the increase of MgO wt.%, but an increasing trend with increasing Fe2O3 wt.% for the same percentage of MgO. More specifically, for the sample W12 this parameter was decreased from 2.78–2.96 g/cm3 (stable 10 wt.% MgO) to 2.72–2.92g/cm3 (stable 15 wt.% MgO) and finally to 2.62–2.84 g/cm3(stable 20 wt.% MgO). Also, in Elmaghraby et al., bulk density decreased with increasing MgCO3 [14]. In contrast, for the sample W13, BD values showed an increasing trend with increasing MgO wt.%, and more specifically, from 2.63–2.65 g/cm3 (stable 10 wt.% MgO) to 2.66–2.82 g/cm3 (stable 15 wt.% MgO) and finally to 2.79–2.91 g/cm3 (stable 20 wt.% MgO) (Figure 9). In the study of Emrullahoglu et al., bulk density values increased in serpentine samples with the addition of magnesium chloride water solution and increasing temperature to a final value of 2.92 g/cm3 at 1400 °C [13]. The decreasing trend of sample W12 can be attributed to the addition of MgO, where an excess of MgO presence is noticed compared to the theoretical requirement for olivine formation (Table 3). On the other hand, sample W13 seems to have an increasing trend of BD values due to the absence of a high excess MgO wt.% (compared to W12) and better sintering at a higher temperature. These results are in good agreement with the respective WA (%) and AP (%), while BD measurements are inversely related to AP (%) measurements (Section 3.2.2).
BD levels for both samples showed an increasing trend with increasing Fe2O3 wt.%. BD values for sample W12 and stable 10 wt.% MgO increased from 2.78 g/cm3 (no Fe2O3) to 2.96 g/cm3 (5 wt.% Fe2O3), for 15 wt.% MgO increased from 2.72g/cm3 (no Fe2O3) to 2.92 g/cm3 (5 wt.% Fe2O3), and finally, for 20 wt.% MgO, increased from 2.62 g/cm3 (no Fe2O3) to 2.82 g/cm3 (5 wt.% Fe2O3). Similarly, for sample W13 and 10 wt.% MgO increased from 2.63 g/cm3 (no Fe2O3) to 2.65 g/cm3 (5 wt.% Fe2O3), 15 wt.% MgO increased from 2.66 g/cm3 (no Fe2O3) to 2.82 g/cm3 (5 wt.% Fe2O3), and finally for 20 wt.% MgO increased from 2.79 g/cm3 (no Fe2O3) to 2.91 g/cm3 (5 wt.% Fe2O3). In the study of Rodríguez Gomez et al., bulk density values also increased with the increase of high-grade nano-iron oxide (a-Fe2O3) Fe2O3 addition to 3.38 g/cm3 with 5 wt.% Fe2O3 and a sintering temperature of 1600 °C. The increase of BD values agrees with the corresponding small decrease of AP (%) after adding Fe2O3 due to magnesioferrite spinel formation [33]. The increase in bulk density indicates that sintering has occurred, and at thermal treatment at 1600 °C, the sintering temperature has decreased because the iron oxide has a lower melting point than MgO [33,42,46]. In general, BD values of the samples at 1600 °C are higher than the respective ones at 1300 °C and indicate that for the thermally treated samples at a higher temperature (1600 °C), sintering is favored, which consequently increases the BD values.
The permissible BD values are for sample W12 for 10 wt.% MgO and 1–5 wt.% Fe2O3, for 15 wt.% MgO and 2.5–5 wt.% Fe2O3 and for 20 wt.% MgO for 5 wt.% Fe2O3. In addition, for sample W13 for 15 wt.% MgO and 5 wt.% Fe2O3 and for 20 wt.% MgO and 1–5 wt.% Fe2O3. These results indicate that the addition of Fe2O3 is required, while the formation of magnesioferrite, due to the high diffusion of iron oxide (Fe2O3) in MgO, affects the sintering, increasing the bond strength and, therefore, the mechanical properties and resistance to many kinds of stresses during operation [31,34]. Moreover, under a normal atmosphere, the reported solubility of Fe2O3 in MgO is 10% at 1200 °C and 35% at 1400 °C, while the alteration of the crystal structure and the respective increase of the inner crystal energy due to the development of thin inclusions are a result of the diffusion of Fe ions into periclase grains that form a solid solution. This process further facilitates the sintering through the increase in the recrystallization ability and promotes the growth of periclase granules (MgO). Even at very low rates, the Fe-compounds increase the growth rate of MgO grains during the Fe2+/Fe3+ change since the high ion density of O2− provides the respective electrical stability to achieve that growth [42]. In conclusion, the addition of Fe2O3 in small percentages is a positive outcome, while increasing BD was found to improve the matrix-aggregate bond and improve corrosion resistance. If the slag aggression on refractories is reduced, the corrosion will decrease, and refractories will survive for a longer time. Higher bulk density values also result in increased values of hardness and mechanical strength, and high resistance to chemical attack during the application of the products [44]. In conclusion, the desired results are high bulk density values.

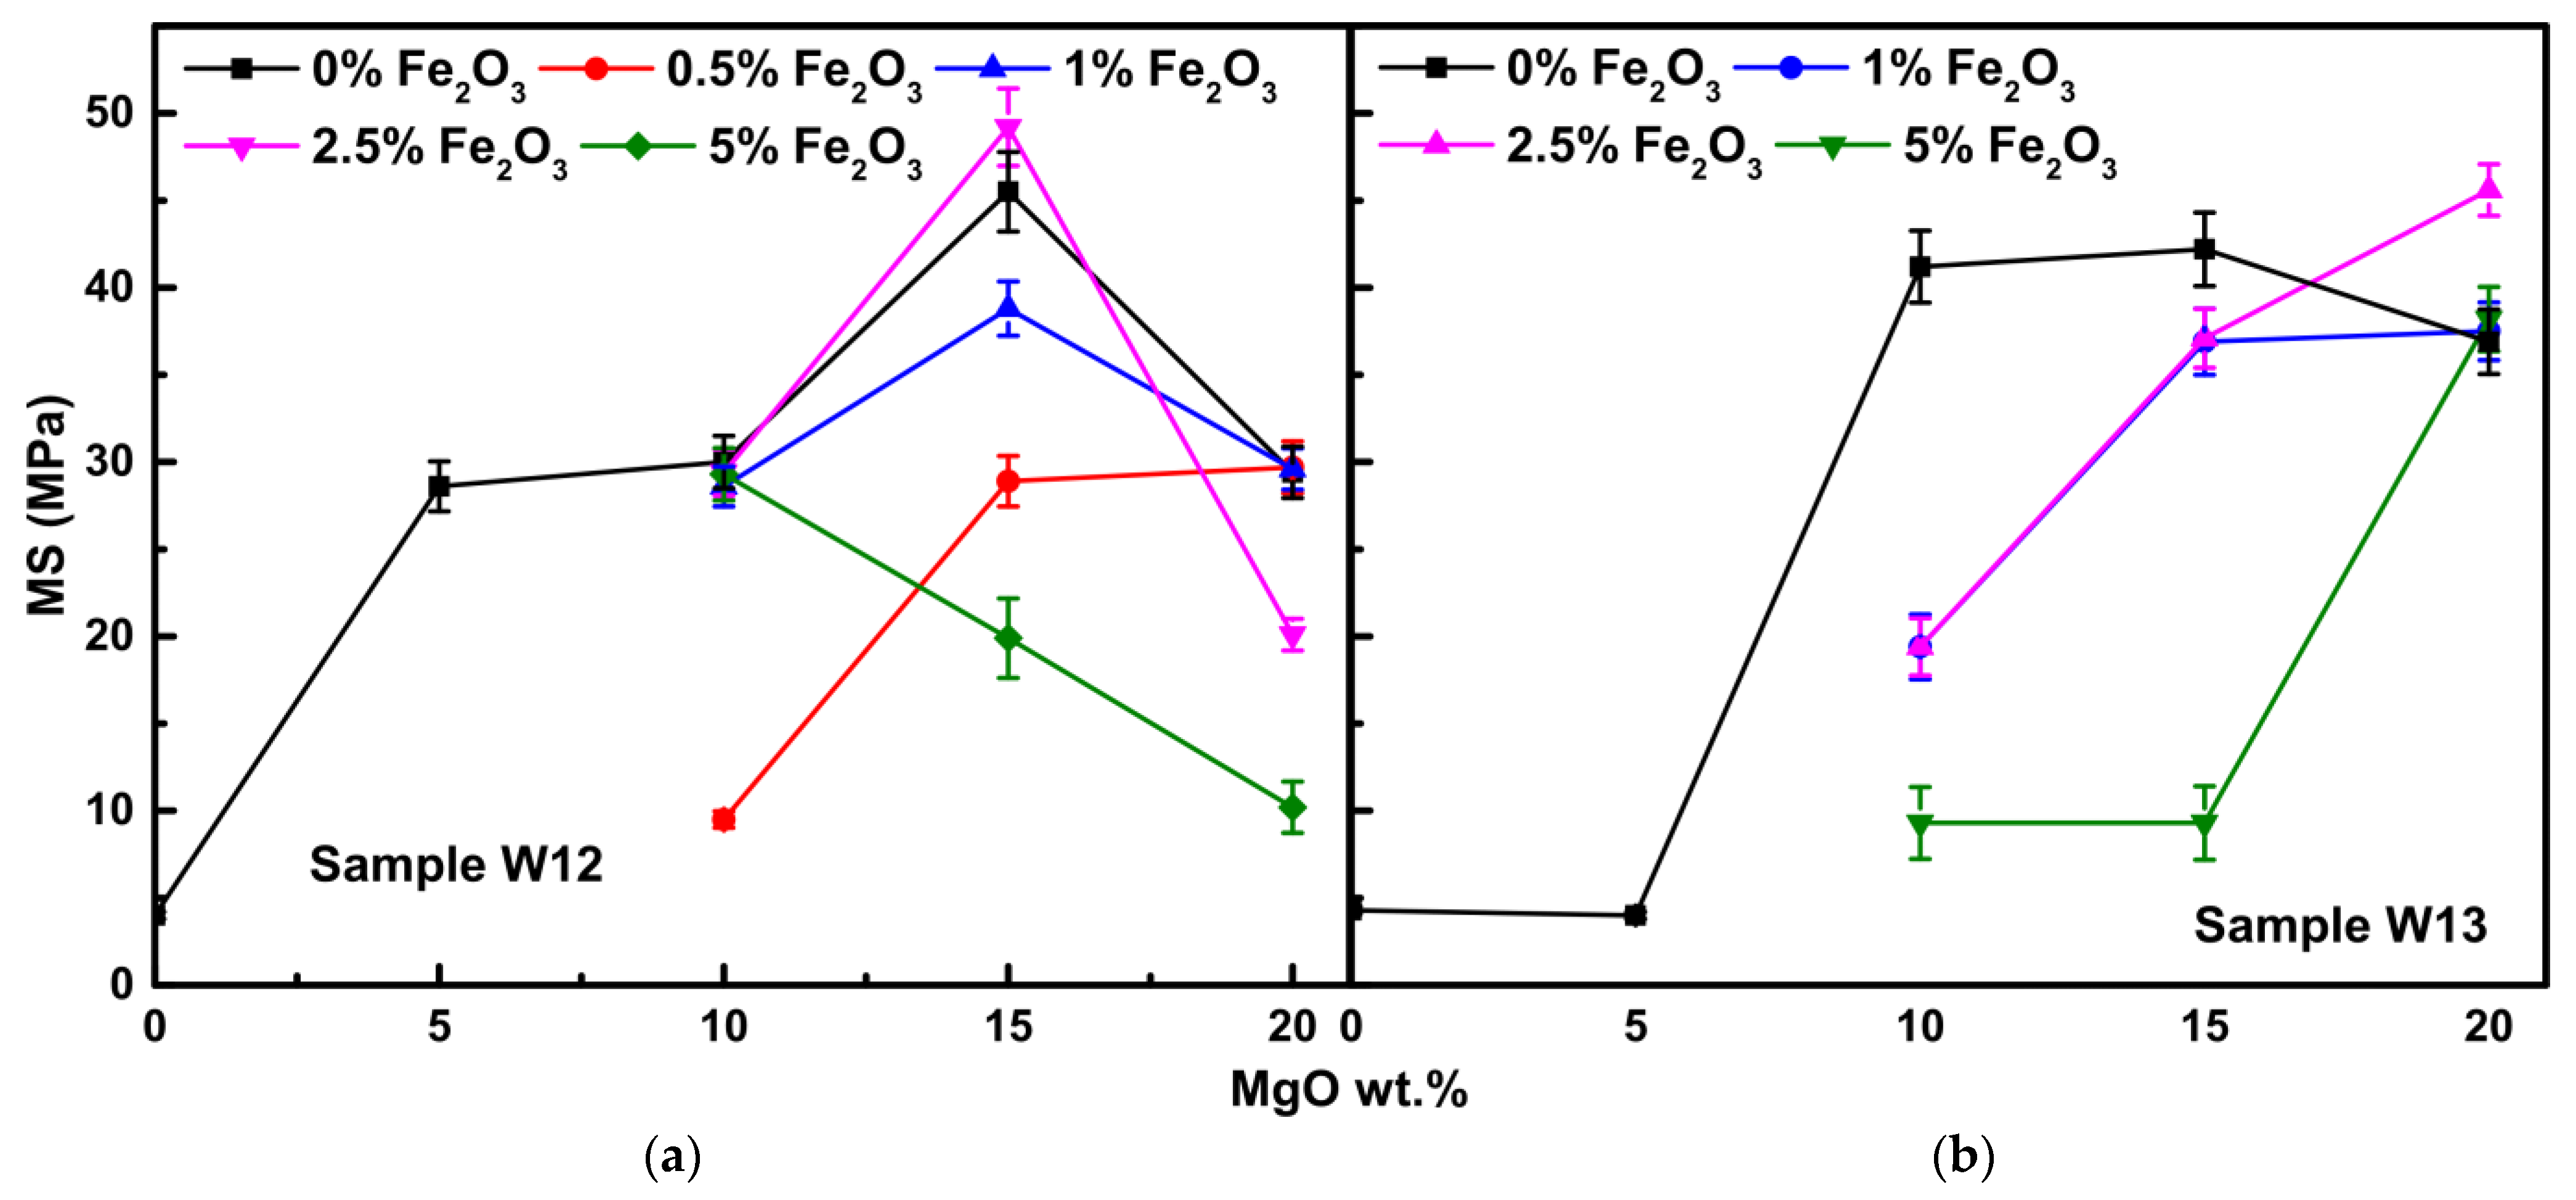
3.2.4. Mechanical Strength

The results and the relevant error bars regarding mechanical strength (MS) values of samples W12 and W13 with the additives MgO and Fe2O3 wt.% after thermal treatment at 1300 °C and 1600 °C for 120 min are presented in Figure 10 and Figure 11. The average Standard Deviation (SD%) was within ±5%.
MS values for the products from the mining sample W12, after the respective thermal treatment at 1300 °C for 120 min, with 10 and 15 wt.% MgO and 0.5–5 wt.% Fe2O3 range from 25.5 to 39.2 MPa and do not present significant changes with MgO wt.% addition from 10 to 15 wt.%, except for the sample with a 2.5 wt.% Fe2O3 addition and 15 wt.% MgO having the maximum value of MS (39.2MPa). In general, in our previous research, adding Fe2O3 seems to improve mechanical strength by ≤5 wt.% [31]. This complies with increasing BD values (to a small degree) with increasing Fe2O3 addition (Section 3.2.3). For the products from the mining sample W13, adding MgO from 10 to 15 wt.% seems to improve MS values, with a maximum value of 5 wt.% Fe2O3. MS values for sample W13 and 10 wt.% MgO ranges from 8.8 to 27.3 MPa, and for 15 wt.% MgO from 25.9 to 35.8 MPa. The permissible limits for the common magnesium refractories range between 21–41 MPa [43].
MS values for sample W12 with 10, 15, and 20 wt.% MgO and 0.5–5 wt.% Fe2O3, after thermal treatment at 1600 °C for 120 min, have a maximum MS value at 15 wt.% MgO with 2.5 wt.% Fe2O3 (Figure 10). The optimum dose of MgO wt.% for olivine formation for the W12 sample is 9.4 wt.% (Table 3), so it seems that for thermal treatment at higher temperatures (1600 °C), +5 wt.% MgO is required from the optimum dose in combination with Fe2O3, with maximum MS results obtained with 2.5 wt.% Fe2O3 (49.2 MPa). Similarly, the mechanical strength values for sample W13 with 10, 15, and 20 wt.% MgO and 1, 2.5 and 5 wt.% Fe2O3 after thermal treatment at 1600 °C for 120 min, have a maximum MS value at 20 wt.% MgO with 2.5 wt.% Fe2O3. The optimum dose of MgO wt.% for olivine formation for sample W12 is 15.6 wt.% (Table 3). It seems that for thermal treatment at 1600 °C, and for sample W13, a +5 wt.% MgO is also required from the optimum dose in combination with Fe2O3 for maximum MS value, with the optimum results obtained with 2.5 wt.% Fe2O3 (45.6 MPa). In the Emrullahoglu et al. study, the mechanical strength of serpentine samples, with the addition of magnesium chloride-water solution, have mechanical strength values of 34.44 MPa at a sintering temperature of 1400 °C [13]. Also, in Rodríguez Gomez et al., mechanical strength values increased with the increase of high-grade nano-iron oxide (a-Fe2O3) addition to final 65.08 MPa with 5 wt.% Fe2O3 and sintering temperature of 1600 °C [33].
In general, the addition of iron oxide affects the sintering process and improves mechanical strength [31], while the high solubility of Fe2O3 in periclase due to the near ionic radius of iron and magnesium leads to the formation of cationic vacancies in magnesia, resulting in precipitation of magnesioferrite spinel from periclase and enhancing bonding formation [33]. Higher BD values are associated with a higher mechanical strength of the final products.
Higher MS values result from high proportions of continuous bonding to the microstructure, higher diffusion rates, faster bonding, and densification, resulting in improved mechanical properties. Improving the mechanical strength of bonding, the bulk density combined with lower porosity due to the addition of iron oxide improves the corrosion resistance. If the slag aggression in the refractory is reduced, the corrosion will decrease, and refractories will survive longer [47]. Moreover, it must be pointed out that the production process shows zero carbon dioxide emissions which is an important factor for future applications that affect the growth of the global economy and global warming [48].

3.3. SEM Analysis

The microstructure chemical content and the mineralogical content on the surface of sample W12, with the addition of 10 wt.% MgO, 15 wt.% MgO, and 15 wt.% MgO + 2.5 wt.% Fe2O3, after firing at 1600 °C for 120 min, were determined using the SEM and EDS point micro-analysis, as revealed in Figure 12.
The surface point EDS micro-analysis of the product of the mining waste sample W12 with the addition of 10 wt.% MgO after firing at 1600 °C for 120 min indicates the main mineral phases that correspond to those of forsterite and magnesioferrite. In more detail, the wt.% reported results for the surface elemental point micro-analysis of the products of the examined mining waste samples, also considering the mass balance equations and the molar ratio, show that the white/grey areas of SEM images (Figure 12a, Mfr) contain 40.49 wt.% Mg, 18.41 wt.% Fe, 2.91 wt.% Cr, and 1.36 wt.% Al, and correspond to the spinel group of Mg(Cr, Fe, Al)2O4. The main surface of the sample (Figure 12a, Fo) contains 28.15 wt.% Mg and 19.58 wt.%. Si, clarifying that this consists of forsterite. In addition, the white areas (Figure 12a, Mfr-Fe) contain 8.39 wt.% Mg, 58.95 wt.% Fe, 5.48 wt.% Cr, and 1.19 wt.% Al, mainly consisting of a mixture of spinel group (Cr, Fe, Al)2O4 with the highest percentage of Fe. The SEM-EDS results also agree with the respective XRD results, as previously presented (Section 3.1).
The surface point EDS micro-analysis of the product of the mining waste sample W12 with the addition of 15 wt.% MgO after firing at 1600 °C for 120 min indicates the main mineral phases that correspond to those of forsterite and magnesioferrite. In more detail, the wt.% reported results for the surface elemental point micro-analysis of the products of the examined mining waste samples, also considering the mass balance equations and the molar ratio, show that the white/grey areas of SEM images (Figure 12b, Mfr) contain 17.91 wt.% Mg, 47.47 wt.% Fe, 3.46 wt.% Cr and 1.57 wt.% Al, and correspond to Mg(Cr, Fe, Al)2O4 spinel group. The main surface of the sample (Figure 12b, Fo) contains 33.81 wt.% Mg and 19.55 wt.%. Si, and so it clarifies that this consists of forsterite. The SEM-EDS results also agree with the respective XRD results, as previously presented (Section 3.1).
The surface point EDS micro-analysis of the product of the mining waste sample W12 with the addition of 15 wt.% MgO and 2.5 wt.% Fe2O3 after firing at 1600 °C for 120 min indicates the main mineral phases of forsterite and magnesioferrite. In more detail, the wt.% reported results for the surface elemental point micro-analysis of the products of the examined mining waste samples, also considering the mass balance equations and the molar ratio, show that the white/grey areas of SEM images (Figure 12c, Mfr) contain 16.18 wt.% Mg, 45.57 wt.% Fe, 4.65 wt.% Cr, and 1.37 wt.% Al, and correspond to the Mg(Cr, Fe, Al)2O4 spinel group. The main surface of the sample (Figure 12c, Fo) contains 33.41 wt.% Mg and 18.90 wt.%. Si and clarifies that this consists of forsterite. The SEM-EDS results also agree with the respective XRD, as previously presented (Section 3.1).
Conclusively, the SEM images for the W12 sample indicate that the optimum results regarding the surface of the final samples are with 15 wt.% MgO and 2.5 wt.%, while the excess of MgO +5 wt.%. From the optimum dose MgO addition for sample W12 (Table 3) in combination with the addition of 2.5 wt.% Fe2O3, favor sintering, minimizing the gaps in the surface. The grains are homogenized, increasing the mechanical strength (Section 3.2.4).
The microstructure chemical content and the mineralogical content on the surface of sample W13, with the addition of 15 wt.% MgO, 20 wt.% MgO, and 20 wt.% MgO + 2.5 wt.% Fe2O3, after firing at 1600 °C for 120 min, were determined using the SEM and EDS point micro-analysis, as revealed in Figure 13.
The surface point EDS micro-analysis of the product of the mining waste sample W13 with the addition of 15 wt.% MgO after firing at 1600 °C for 120 min indicates the main mineral phases that correspond to those of forsterite and magnesioferrite. In more detail, the wt.% reported results for the surface elemental point micro-analysis of the products of the examined mining waste samples, also considering the mass balance equations and the molar ratio, show that the white/grey areas of SEM images (Figure 13a, Mfr) contain 32.71 wt.% Mg, 25.87 wt.% Fe, 3.48 wt.% Cr, and 0.9 wt.% Al, and correspond to the Mg(Cr, Fe, Al)2O4 spinel group. The main surface of the sample (Figure 13a, Fo) contains 32.9 wt.% Mg and 19.66 wt.%. Si, clarifying that it consists of forsterite. In addition, the white areas (Figure 13a, Mfr-Fe) contain 16.04 wt.% Mg, 50.7 wt.% Fe, 4.46 wt.% Cr, and 0.88 wt.% Al, and mainly consist of a mixture of spinel group (Cr, Fe, Al)2O4 with the highest percentage of Fe. The SEM-EDS results agree with the respective XRD, as previously presented (Section 3.1).
The surface point EDS micro-analysis of the product of the mining waste sample W13 with the addition of 20 wt.% MgO after firing at 1600 °C for 120 min indicates the mineral phases that correspond to those of forsterite and magnesioferrite. In more detail, the wt.% reported results for the surface elemental point micro-analysis of the products of the examined mining waste samples, also considering the mass balance equations and the molar ratio, show that the white/grey areas of SEM images (Figure 13b, Mfr) contain 15.78 wt.% Mg, 50.06 wt.% Fe, 3.88 wt.% Cr and 1.99 wt.% Al, and correspond to Mg(Cr, Fe, Al)2O4 spinel group. The main surface of the sample (Figure 13b, Fo) contains 33.94 wt.% Mg and 19.52 wt.%. Si, and it clarifies that it consists of forsterite. The SEM-EDS results also agree with the respective XRD, as previously presented (Section 3.1).
The surface point EDS micro-analysis of the product of the mining waste sample W13 with the addition of 20 wt.% MgO and 2.5 wt.% Fe2O3, after firing at 1600 °C for 120 min, indicates mineral phases that correspond to those of forsterite and magnesioferrite. In more detail, the reported wt.% results for the surface elemental point micro-analysis of the products of the examined mining waste samples, also considering the mass balance equations and the molar ratio, show that the white/grey areas of SEM images (Figure 13c, Mfr) contain 18.27 wt.% Mg, 45.94 wt.% Fe, 3.71 wt.% Cr, and 2.73 wt.% Al, and correspond to the Mg(Cr, Fe, Al)2O4 spinel group. The main surface of the sample (Figure 13c, Fo) contains 33.57 wt.% Mg and 19.76 wt.%. Si, and thus clarifies it consists of forsterite. The SEM-EDS results also agree with the respective XRD, as previously presented (Section 3.1).
Conclusively, the results for SEM images for the mining waste sample W13 indicate that the optimum results regarding the surface of the final samples are with 20 wt.% MgO and 2.5 wt.%, while the excess of MgO +5 wt.%. from the optimum dose MgO addition for sample W12 (Table 3), in combination with the addition of 2.5 wt.% κ.β. Fe2O3, favor sintering, minimizing the gaps in the surface. The grains are better homogenized, increasing mechanical strength (Section 3.2.4).
In addition, the white areas on the surface of the samples in SEM images are attributed to a spinel group Mg(Cr, Fe, Al)2O4 and MgFe2O4, which is in agreement with the highest values of bulk density (Section 3.2.3). These results are attributed to the higher density of Fe2O3 (5.24 g/cm3) in comparison with the MgO additive (3.58 g/cm3) and the eventual formation of a respective spinel MgFe2O4 (4.51 g/cm3) [34]. The main surface of the samples consists of the desired mineral phase (forsterite).

4. Conclusions

The addition of 10, 15, and 20 wt.% MgO in combination with 0.5, 1, 2.5, and 5 wt.% Fe2O3 to mining wastes from stocked piles of magnesite enrichment ores processes after thermal treatment at 1300 °C and 1600 °C for 120 min has improved the physicochemical properties of the wastes, favoring the production of potentially useful refractory products. From the XRD patterns, at both temperatures, the formation of magnesioferrite is reported, whereas the percentage of unwanted pyroxenes (mainly enstatite) decreases with the increasing addition of MgO (wt.%), and the percentage of desirable olivine (forsterite) increases. Periclase formation is associated with the excess of MgO presence.
FS% decreases with increasing MgO wt.% at 1300 °C for 120 min and has a minimum value at the optimum MgO dose for olivine formation for both samples at 1600 °C for 120 min. Olivine formation improves refractoriness and minimizes shrinkage. FS (%) increases for a stable percentage of MgO wt.% with increasing Fe2O3 due to the formation of magnesioferrite, leading to a sintering process. WA (%) and AP (%) values generally increase with the addition of MgO after thermal treatment at 1300 °C and 1600 °C for 120 min due to the hydration of magnesia and decrease by increasing Fe2O3 while iron oxide enhances sintering. Also, the increase of the addition of Fe2O3 wt.% (for stable MgO) increases the BD values due to the formation of magnesioferrite and sintering as well. Moreover, adding Fe2O3 improves MS values with the optimum results obtained at 1600 °C for optimum MgO wt.% dose plus 5 wt.% MgO from the optimum dose in combination with Fe2O3, with maximum MS results obtained with 2.5 wt.% Fe2O3. These results agree with the SEM-EDS analysis.
In general, iron oxide, with the optimum results shown for 2.5 wt.% Fe2O3 addition, is a significant additive since its addition results in the homogenization of the surface and improvement of bonding, bulk density, and a mechanical strength increase in combination with lower porosity, improving corrosion resistance. Also, FS (%) decreases with the optimum MgO dose and improves the refractory properties of the products, indicating that the addition of MgO and Fe2O3 produces an upgraded refractory material under the frame of circular economy from the mining waste samples examined.

Supplementary Materials

The following supporting information can be downloaded at: https://www.mdpi.com/article/10.3390/cleantechnol4040067/s1. Table S1: The mineralogical content (wt.%) of examined mineral waste sample W12 with the addition of different percentages of MgO and Fe2O3 after their thermal treatment at 1300 °C for 120 min; Table S2: The mineralogical content (wt.%) of examined mineral waste sample W13 with the addition of different percentages of MgO and Fe2O3 after their thermal treatment at 1300 °C for 120 min; Table S3: The mineralogical content (wt.%) of examined mineral waste sample W12 with the addition of different percentages of MgO and Fe2O3 after their thermal treatment at 1600 °C for 120 min; Table S4: The mineralogical content (wt.%) of examined mineral waste sample W14 with the addition of different percentages of MgO and Fe2O3 after their thermal treatment at 1600 °C for 120 min.

Author Contributions

Conceptualization, V.Z. and M.M.; methodology, M.M.; software, E.P. and K.K.; validation, K.K., M.M. and A.Z.; formal analysis, E.P. and K.K.; investigation, E.P. and K.K.; resources, A.Z.; data curation, E.P. and K.K.; writing—original draft preparation, E.P.; writing—review and editing, M.M. and A.Z.; visualization, V.Z.; supervision, M.M. and A.Z.; project administration, A.Z.; funding acquisition, A.Z. All authors have read and agreed to the published version of the manuscript.

Funding

This research was funded by the European Union and Greek National Funds through the Operational Program Competitiveness, Entrepreneurship and Innovation, under the call RESEARCH–CREATE–INNOVATE (project code: T1EDK-03543).

Data Availability Statement

The authors confirm that the data supporting the findings of this study are available within the article and its Supplementary Material. Raw data that support the findings of this study are available from the corresponding authors upon reasonable request.

Acknowledgments

Specific thanks are due to X. Ntampou (Chemist, Dept. of Chem. Eng., Aristotle University) for the preparation and elaboration of XRD measurements.

Conflicts of Interest

The authors declare no conflict of interest.

References

  1. Tayebi-Khorami, M.; Edraki, M.; Corder, G.; Golev, A. Re-Thinking Mining Waste through and Integrative Approach Led by Circular Economy Aspirations. Minerals 2019, 9, 286. [Google Scholar] [CrossRef] [Green Version]
  2. Pactwa, K.; Woźniak, J.; Dudek, M. Coal mining waste in Poland in reference to circular economy principles. Fuel 2020, 270, 117493. [Google Scholar] [CrossRef]
  3. Haibin, L.; Zhenling, L. Recycling utilization patterns of coal mining waste in China. Resour. Conserv. Recycl. 2010, 54, 1331–1340. [Google Scholar] [CrossRef]
  4. Borja, W.; El Boudour El Idrissi, H.; Mossaab, M.; Sbi, S.; Daafi, Y.; Tamraoui, Y.; Alami, J. Phosphate waste rocks recycling in ceramic wall tiles: Technical performances. Ceram. Int. 2022, 48, 30031–30040. [Google Scholar] [CrossRef]
  5. Sánchez-Soto, P.J.; Garzón, E.; Pérez-Villarejo, L.; Angelopoulos, G.N.; Eliche-Quesada, D. Mining Wastes of an Albite Deposit as Raw Materials for Vitrified Mullite Ceramics. Minerals 2021, 11, 232. [Google Scholar] [CrossRef]
  6. Aznar-Sánchez, J.A.; García-Gómez, J.J.; Velasco-Muñoz, J.F.; Carretero-Gómez, A. Mining Waste and Its Sustainable Management: Advances in Worldwide Research. Minerals 2018, 8, 284. [Google Scholar] [CrossRef] [Green Version]
  7. Dino, G.A.; Rossetti, P.; Perotti, L.; Alberto, W.; Sarkka, H.; Coulon, F.; Wagland, S.; Griffiths, Z.; Rodeghiero, F. Landfill mining from extractive waste facilities: The importance of a correct site characterization and evaluation of the potentialities. A case study from Italy. Resourc. Policy 2018, 59, 50–61. [Google Scholar] [CrossRef] [Green Version]
  8. Hossain, S.K.; Roy, P.K. Sustainable ceramics derived from solid wastes: A review. J. Asian Ceram. Soc. 2020, 8, 984–1009. [Google Scholar] [CrossRef]
  9. Shaheen, F.; Lodhi, M.S.; Rosak-Szyrocka, J.; Zaman, K.; Awan, U.; Asif, M.; Ahmed, W.; Siddique, M. Cleaner Technology and Natural Resource Management: An Environmental Sustainability Perspective from China. Clean Technol. 2022, 4, 584–606. [Google Scholar] [CrossRef]
  10. Gadaleta, G.; De Gisi, S.; Todaro, F.; Notarnicola, M. Environmental Comparison of Different Mechanical–Biological Treatment Plants by Combining Life Cycle Assessment and Material Flow Analysis. Clean Technol. 2022, 4, 380–394. [Google Scholar] [CrossRef]
  11. Diamantis, K.; Exarhakos, G.; Migiros, G.; Gartzos, E. Evaluating the Triaxial Characteristics of Ultamafic Rocks from Central Greece Using the Physical, Dynamic and Mechanical Properties. OALib 2016, 03, 2333–9705. [Google Scholar] [CrossRef]
  12. Cheng, T.W.; Ding, Y.C.; Chiu, J.P. A study of synthetic forsterite refractory materials using waste serpentine cutting. Min. Eng. 2002, 15, 271–275. [Google Scholar] [CrossRef]
  13. Emrullahoglu Abi, C.B.; Gürel, S.B.; Kılınç, D.; Emrullahoglu, Ö.F. Production of forsterite from serpentine—Effects of magnesium chloride hexahydrate addition. Adv. Powder Technol. 2015, 26, 947–953. [Google Scholar] [CrossRef]
  14. Elmaghraby, M.S.; Ismail, A.I.M.; Abd El Ghaffar, N.I. Atalla Egyptian serpentinite for producing forsterite and its thermos-mechanical behavior. Int. J. Res. Stud. Sci. Eng. Technol. 2015, 2, 137–146. [Google Scholar]
  15. Ramezani, A.; Emami, S.M.; Nemat, S. Effect of waste serpentine on the properties of basic insulating refractories. Ceram. Int. 2018, 44, 9269–9275. [Google Scholar] [CrossRef]
  16. Emami, S.M.; Ramezani, A.; Nemat, S. Sintering behavior of waste serpentine from Abdasht chromite mines and Kaolin blends. Ceram. Int. 2017, 43, 15189–15193. [Google Scholar] [CrossRef]
  17. Zhu, P.; Wang, L.Y.; Hong, D.; Qian, G.R.; Zhou, M. A study of making synthetic oxy-fluoride construction material using waste serpentine and kaolin mining tailings. Int. J. Min. Process. 2012, 104–105, 31–36. [Google Scholar] [CrossRef]
  18. Abdelwahab, W.; Mekky, H.; Khalil, A.; Belal, Z. Production of spinel forsterite refractories using sheared serpentinized ultramafic rocks Um Seleimat, Egypt. J. Eng. Appl. Sci. 2019, 14, 3386–3400. [Google Scholar]
  19. Mymrin, V.; Presotto, P.; Alekseev, K.; Avanci, A.M.; Rolim, P.H.B.; Petukhov, V.; Taskin, A.; Gidarakos, E.; Valouma, A.; Yu, G. Application of hazardous serpentine rocks’ extraction wastes in composites with glass waste and clay-sand mix to produce environmentally clean construction materials. Constr. Build. Mater. 2020, 234, 117319. [Google Scholar] [CrossRef]
  20. Ramezani, A.; Emami, S.M.; Nemat, S. Reuse of spent FCC catalyst, waste serpentine and kiln rollers waste for synthesis of cordierite and cordierite-mullite ceramics. J. Hazard. Mater. 2017, 338, 177–185. [Google Scholar] [CrossRef]
  21. IlIna, V.P. Ceramic heat-insulation materials based on serpentinites. Glas. Ceram. (Engl. Transl. Steklo I Keram.) 2013, 70, 12–15. [Google Scholar] [CrossRef]
  22. Zhao, J.; Hao, X.; Wang, S.; Zhang, X.; Wang, Z.; Luo, X.; Xie, Z.; Luo, J. Sintering behavior and thermal shock resistance of aluminum titanate (Al2TiO5)-toughened MgO-based ceramics. Ceram. Int. 2021, 47, 26643–26650. [Google Scholar] [CrossRef]
  23. Kusiorowski, R.; Wojsa, J.; Psiuk, B.; Wala, T. Influence of zirconia addition on the properties of magnesia refractories. Ceram. Int. 2016, 42, 11373–11386. [Google Scholar] [CrossRef]
  24. Kucuk, I.; Boyraz, T.; Gökçe, H.; Öveçoğlu, M.L. Thermomechanical properties of aluminum titanate (Al2TiO5)-reinforced forsterite (Mg2SiO4) ceramic composites. Ceram. Int. 2018, 44, 8277–8282. [Google Scholar] [CrossRef]
  25. Rauta, P.R.; Sahoo, N. Properties enhancement of refractory bricks by incorporation of nano materials. In Proceedings of the 2015 International Conference on Nascent Technologies in the Engineering Field (ICNTE), Navi Mumbai, India, 9–10 January 2015. [Google Scholar] [CrossRef]
  26. Nemat, S.; Ramezani, A.; Emami, S.M. Recycling of waste serpentine for the production of forsterite refractories: The effects of various parameters on the sintering behavior. J. Aust. Ceram. Soc. 2019, 55, 425–431. [Google Scholar] [CrossRef]
  27. Nemat, S.; Ramezani, A.; Emani, S.M. Possible use of waste serpentine from Abdasht chromite mines into refractory and ceramic industries. Ceram. Int. 2016, 42, 18479–18483. [Google Scholar] [CrossRef]
  28. Cheng, T.W.; Hsu, C.W. A study of silicon carbide synthesis from waste serpentine. Chemosphere 2006, 64, 510–514. [Google Scholar] [CrossRef]
  29. Kulikova, S.A.; Vinokurov, S.E.; Khamizov, R.K.; Vlasovskikh, N.S.; Belova, K.Y.; Dzhenloda, R.K.; Konov, M.A.; Myasoedov, B.F. The use of MgO obtained from serpentinite in the synthesis of a magnesium potassium phosphate matrix for radioactive waste immobilization. Appl. Sci. 2021, 11, 220. [Google Scholar] [CrossRef]
  30. Pagona, E.; Kalaitzidou, K.; Zouboulis, A.; Mitrakas, M. Estimation and addition of MgO dose for upgrading the refractory characteristics of magnesite ore mining wastes/by-products. Waste Biomass Valor. 2022, 13, 4057–4072. [Google Scholar] [CrossRef]
  31. Kalaitzidou, K.; Pagona, E.; Stratigousis, P.; Ntampou, X.; Zaspalis, V.; Zouboulis, A.; Mitrakas, M. Hematite nanoparticles addition to serpentine/pyroxenes by-products of magnesite mining enrichment process for the production of refractories. Appl. Sci. 2022, 12, 2094. [Google Scholar] [CrossRef]
  32. Sadik, C.; Moudden, O.; El Bouari, A.; El Amrani, I. Review on the elaboration and characterization of ceramics refractories based on magnesite and dolomite. J. Asian Ceram. Soc. 2016, 4, 219–233. [Google Scholar] [CrossRef]
  33. Rodríguez Gomez, C.; Das Roy, T.K.; Shaji, S.; Castillo Rodríguez, G.A.; García Quiñonez, L.; Rodríguez, E.; González, J.O.; Aguilar-Martínez, J.A. Effect of addition of Al2O3 and Fe2O3 nanoparticles on the microstructural and physicochemical evolution of dense magnesia composite. Ceram. Int. 2015, 41, 7751–7758. [Google Scholar] [CrossRef]
  34. Pagona, E.; Tzamos, E.; Grieco, G.; Zouboulis, A.; Mitrakas, M. Characterization and evaluation of magnesite ore mining by-products of Gerakini mines (Chalkidiki, N. Greece). Sci. Total Environ. 2020, 732, 139279. [Google Scholar] [CrossRef] [PubMed]
  35. ASTM Standard C20; Standard Test Methods for Apparent Porosity, Water Absorption, Apparent Specific Gravity, and Bulk Density of Burned Refractory Brick and Shapes by Boiling Water. ASTM International: West Conshohocken, PA, USA, 2015. [CrossRef]
  36. Biswas, S.; Sarkar, D. Introduction to Refractories for Iron- and Steelmaking; Springer: Berlin/Heidelberg, Germany, 2020. [Google Scholar]
  37. Kadziolka-Gawel, M.; Adamczyk, Z.; Kalinowski, L. Mossbauer study of changes in olivine after heating in air. Can. Mineral. 2019, 57, 105–115. [Google Scholar] [CrossRef]
  38. Kanzaki, M.; Xue, X. Protoenstatite in MgSiO3 samples prepared by conventional solid state reaction. J. Mineral. Petrol. Sci. 2017, 112, 359–364. [Google Scholar] [CrossRef] [Green Version]
  39. Katsavou, I.D.; Krokida, M.K.; Ziomas, I.C. Effect of production conditions on structural properties of refractory materials. Mater. Res. Innov. 2011, 15, 47–52. [Google Scholar] [CrossRef]
  40. Park, S.H.; Jeon, S.; Jang, J. Characteristic behavior of hydration of magnesium oxide. In Geotechnics for Sustainable Infrastructure Development; Lecture Notes in Civil Engineering 62; Duc Long, P., Dung, N., Eds.; Springer: Singapore, 2020. [Google Scholar] [CrossRef]
  41. dos Santos, T.; Pinola, F.G.; Luz, A.P.; Pagliosa, C.; Pandolfelli, V.C. Al2O3-MgO refractory castables with enhanced explosion resistance due to in situ formation of phases with lamellar structure. Ceram. Int. 2018, 44, 8048–8056. [Google Scholar] [CrossRef]
  42. Wang, W.B.; Shi, Z.M.; Wang, X.G.; Wang, Z.X.; Cao, Z.; Fan, W. The synthesis and properties of high-quality forsterite ceramics using desert drift sands to replace traditional raw materials. J. Ceram. Soc. Japan 2017, 125, 88–94. [Google Scholar] [CrossRef] [Green Version]
  43. Bennett, J.P. High-Temperature Properties of Magnesia-Refractory Brick Treated with Oxide and Salt Solutions; Pergamon Press: Oxford, UK, 1985. [Google Scholar]
  44. Routschka, G.; Wuthnow, H. Handbook of Refractory Materials: Design, Properties, Testing; Vulkan-Verlag: Essen, Germany, 2012. [Google Scholar]
  45. Surendranathan, A.O. An Introduction to Ceramics and Refractories, 1st ed.; CRC Press: Boca Raton, FL, USA, 2014. [Google Scholar]
  46. Nguyen, M.; Sokolář, R. Corrosion Resistance of Novel Fly Ash–Based Forsterite–Spinel Refractory Ceramics. Materials 2022, 15, 1363. [Google Scholar] [CrossRef]
  47. Golestani Fard, F.; Talimian, A. Improving corrosion behavior of magnesia-chrome refractories by addition of nanoparticles. Refract. Worldforum 2014, 6, 93. [Google Scholar]
  48. Fernandes, D.; Wang, S.; Xu, Q.; Buss, R.; Chen, D. Process and Carbon Footprint Analyses of the Allam Cycle Power Plant Integrated with an Air Separation Unit. Clean Technol. 2019, 1, 325–340. [Google Scholar] [CrossRef]
Figure 1. Schematical diagram reflecting the experimental procedure.
Cleantechnol 04 00067 g001
Figure 2. Selected XRD patterns of products thermally treated at 1300 °C for 120 min (a) W12, 10 wt.% MgO and 0.5, 1, 2.5 and 5 wt.% Fe2O3 addition (b) W13, 10 wt.% MgO and 0.5, 1, 2.5 and 5 wt.% Fe2O3 addition (c) W12, 15 wt.% MgO and 0.5, 1, 2.5 and 5 wt.% Fe2O3 addition (d) W13, 15 wt.% MgO and 0.5, 1, 2.5 and 5 wt.% Fe2O3 addition.
Cleantechnol 04 00067 g002aCleantechnol 04 00067 g002b
Figure 3. Selected XRD patterns of products thermally treated at 1600 °C for 120 min (a) W12, 10 wt.% MgO and 0.5, 1, 2.5 and 5 wt.% Fe2O3 addition (b) W13, 10 wt.% MgO and 1, 2.5 and 5 wt.% Fe2O3 addition (c) W12, 15 wt.% MgO and 0.5, 1, 2.5 and 5 wt.% Fe2O3 addition (d) W13, 15 wt.% MgO and 1, 2.5 and 5 wt.% Fe2O3 addition (e) W12, 20 wt.% MgO and 0.5, 1, 2.5 and 5 wt.% Fe2O3 addition (f) W13, 20 wt.% MgO and 1, 2.5 and 5 wt.% Fe2O3 addition.
Cleantechnol 04 00067 g003
Figure 4. FS (%) of samples at 1300 °C and for 120 min treatment time (a) W12 and (b) W13 vs. the wt.% of MgO and wt.% of Fe2O3 addition.
Cleantechnol 04 00067 g004
Figure 5. FS (%) of samples at 1600 °C and for 120 min treatment time (a) W12 and (b) W13 vs. the wt.% of MgO and wt.% of Fe2O3 addition.
Cleantechnol 04 00067 g005
Figure 6. (a) AP (%) values of sample W12 (b) AP (%) values of sample W13 (c) WA (%) values of sample W12 (d) WA (%) values of sample W13 vs. the wt.% of MgO and wt.% of Fe2O3 addition at 1300 °C and for 120 min treatment time.
Cleantechnol 04 00067 g006aCleantechnol 04 00067 g006b
Figure 7. (a) AP (%) values of sample W12 (b) AP (%) values of sample W13 (c) WA (%) values of sample W12 (d) WA (%) values of sample W13 vs. the wt.% of MgO and wt.% of Fe2O3 addition at 1600 °C and for 120 min treatment time.
Cleantechnol 04 00067 g007
Figure 8. BD values at 1300 °C for 120 min treatment time (a) W12 and (b) W13 vs. the wt.% of MgO and wt.% of Fe2O3 addition.
Cleantechnol 04 00067 g008
Figure 9. BD values at 1600 °C for 120 min treatment time (a) W12 and (b) W13 vs. the wt.% of MgO and wt.% of Fe2O3 addition.
Cleantechnol 04 00067 g009
Figure 10. MS values at 1300 °C for 120 min treatment time. (a) W12 and (b) W13 vs. the wt.% of MgO and wt.% of Fe2O3 addition.
Cleantechnol 04 00067 g010
Figure 11. MS values at 1600 °C for 120 min treatment time. (a) W12 and (b) W13 vs. the wt.% of MgO and wt.% of Fe2O3 addition.
Cleantechnol 04 00067 g011
Figure 12. SEM images of the W12 sample fired at 1600 °C for 120 min in the presence of additives: (a) 10 wt.% MgO, (b) 15 wt.% MgO, (c) 15 wt.% MgO + 2.5 wt.% Fe2O3. Abbreviations: Fo: Forsterite; Mfr: Magnesioferrite, Mg(Cr, Fe, Al)2O4.
Cleantechnol 04 00067 g012
Figure 13. SEM images of the W13 sample fired at 1600 °C for 120 min in the presence of additives. (a) 15 wt.% MgO, (b) 20 wt.% MgO, (c) 20 wt.% MgO + 2.5 wt.% Fe2O3. Abbreviations: Fo: Forsterite; Mfr: Magnesioferrite, Mg(Cr, Fe, Al)2O4.
Cleantechnol 04 00067 g013
Table 1. Chemical composition of the examined W12 and W13 mining waste samples [30].
SampleW12W13
wt.%
MgO42.940.8
FeO7.37.2
Al2O30.501.4
CaO0.351.6
Na2O0.300.30
SiO241.544.5
LOI6.74.1
mg/kg
K2O650730
MnO214601510
NiO31102870
Cr2O3450850
Table 2. Mineralogical content (wt.%) in the examined raw mining waste samples W12 and W13 after thermal treatment at various temperatures [30].
Sample
(Temperature, °C)
OlivinePyroxenesSerpentine
W1265.1 ± 4.58.4 ± 1.326.4 ± 1.8
W12 (650)79.0 ± 5.713.1 ± 2.17.9 ± 0.7
W12 (850)80.9 ± 6.019.1 ± 2.3---
W12 (1300)66.0 ± 4.834.0 ± 3.5---
W1352.9 ± 3.319.6 ± 1.727.5 ± 2.0
W13 (650)64.8 ± 4.526.8 ± 3.08.3 ± 1.0
W13 (850)76.3 ± 5.223.7 ± 2.3---
W13 (1300)55.0 ± 3.845.0 ± 3.6---
Table 3. Mass balance for MgO addition determination for W12 and W13 mining waste samples to optimize the formation of olivine [30,34].
SampleMgOSiO2FeOOptimum MgO DoseOptimum MgO Dose
mol/100 gwt.%
W121.1410.7410.1090.2329.4
W131.0560.7730.1040.38615.6
Publisher’s Note: MDPI stays neutral with regard to jurisdictional claims in published maps and institutional affiliations.

