
Power Quality Assessment in a Real Microgrid-Statistical Assessment of Different Long-Term Working Conditions

 ,
,  , ,
, ,  ,
,  , , ,
, , ,
Abstract
:1. Introduction
2. Literature Review
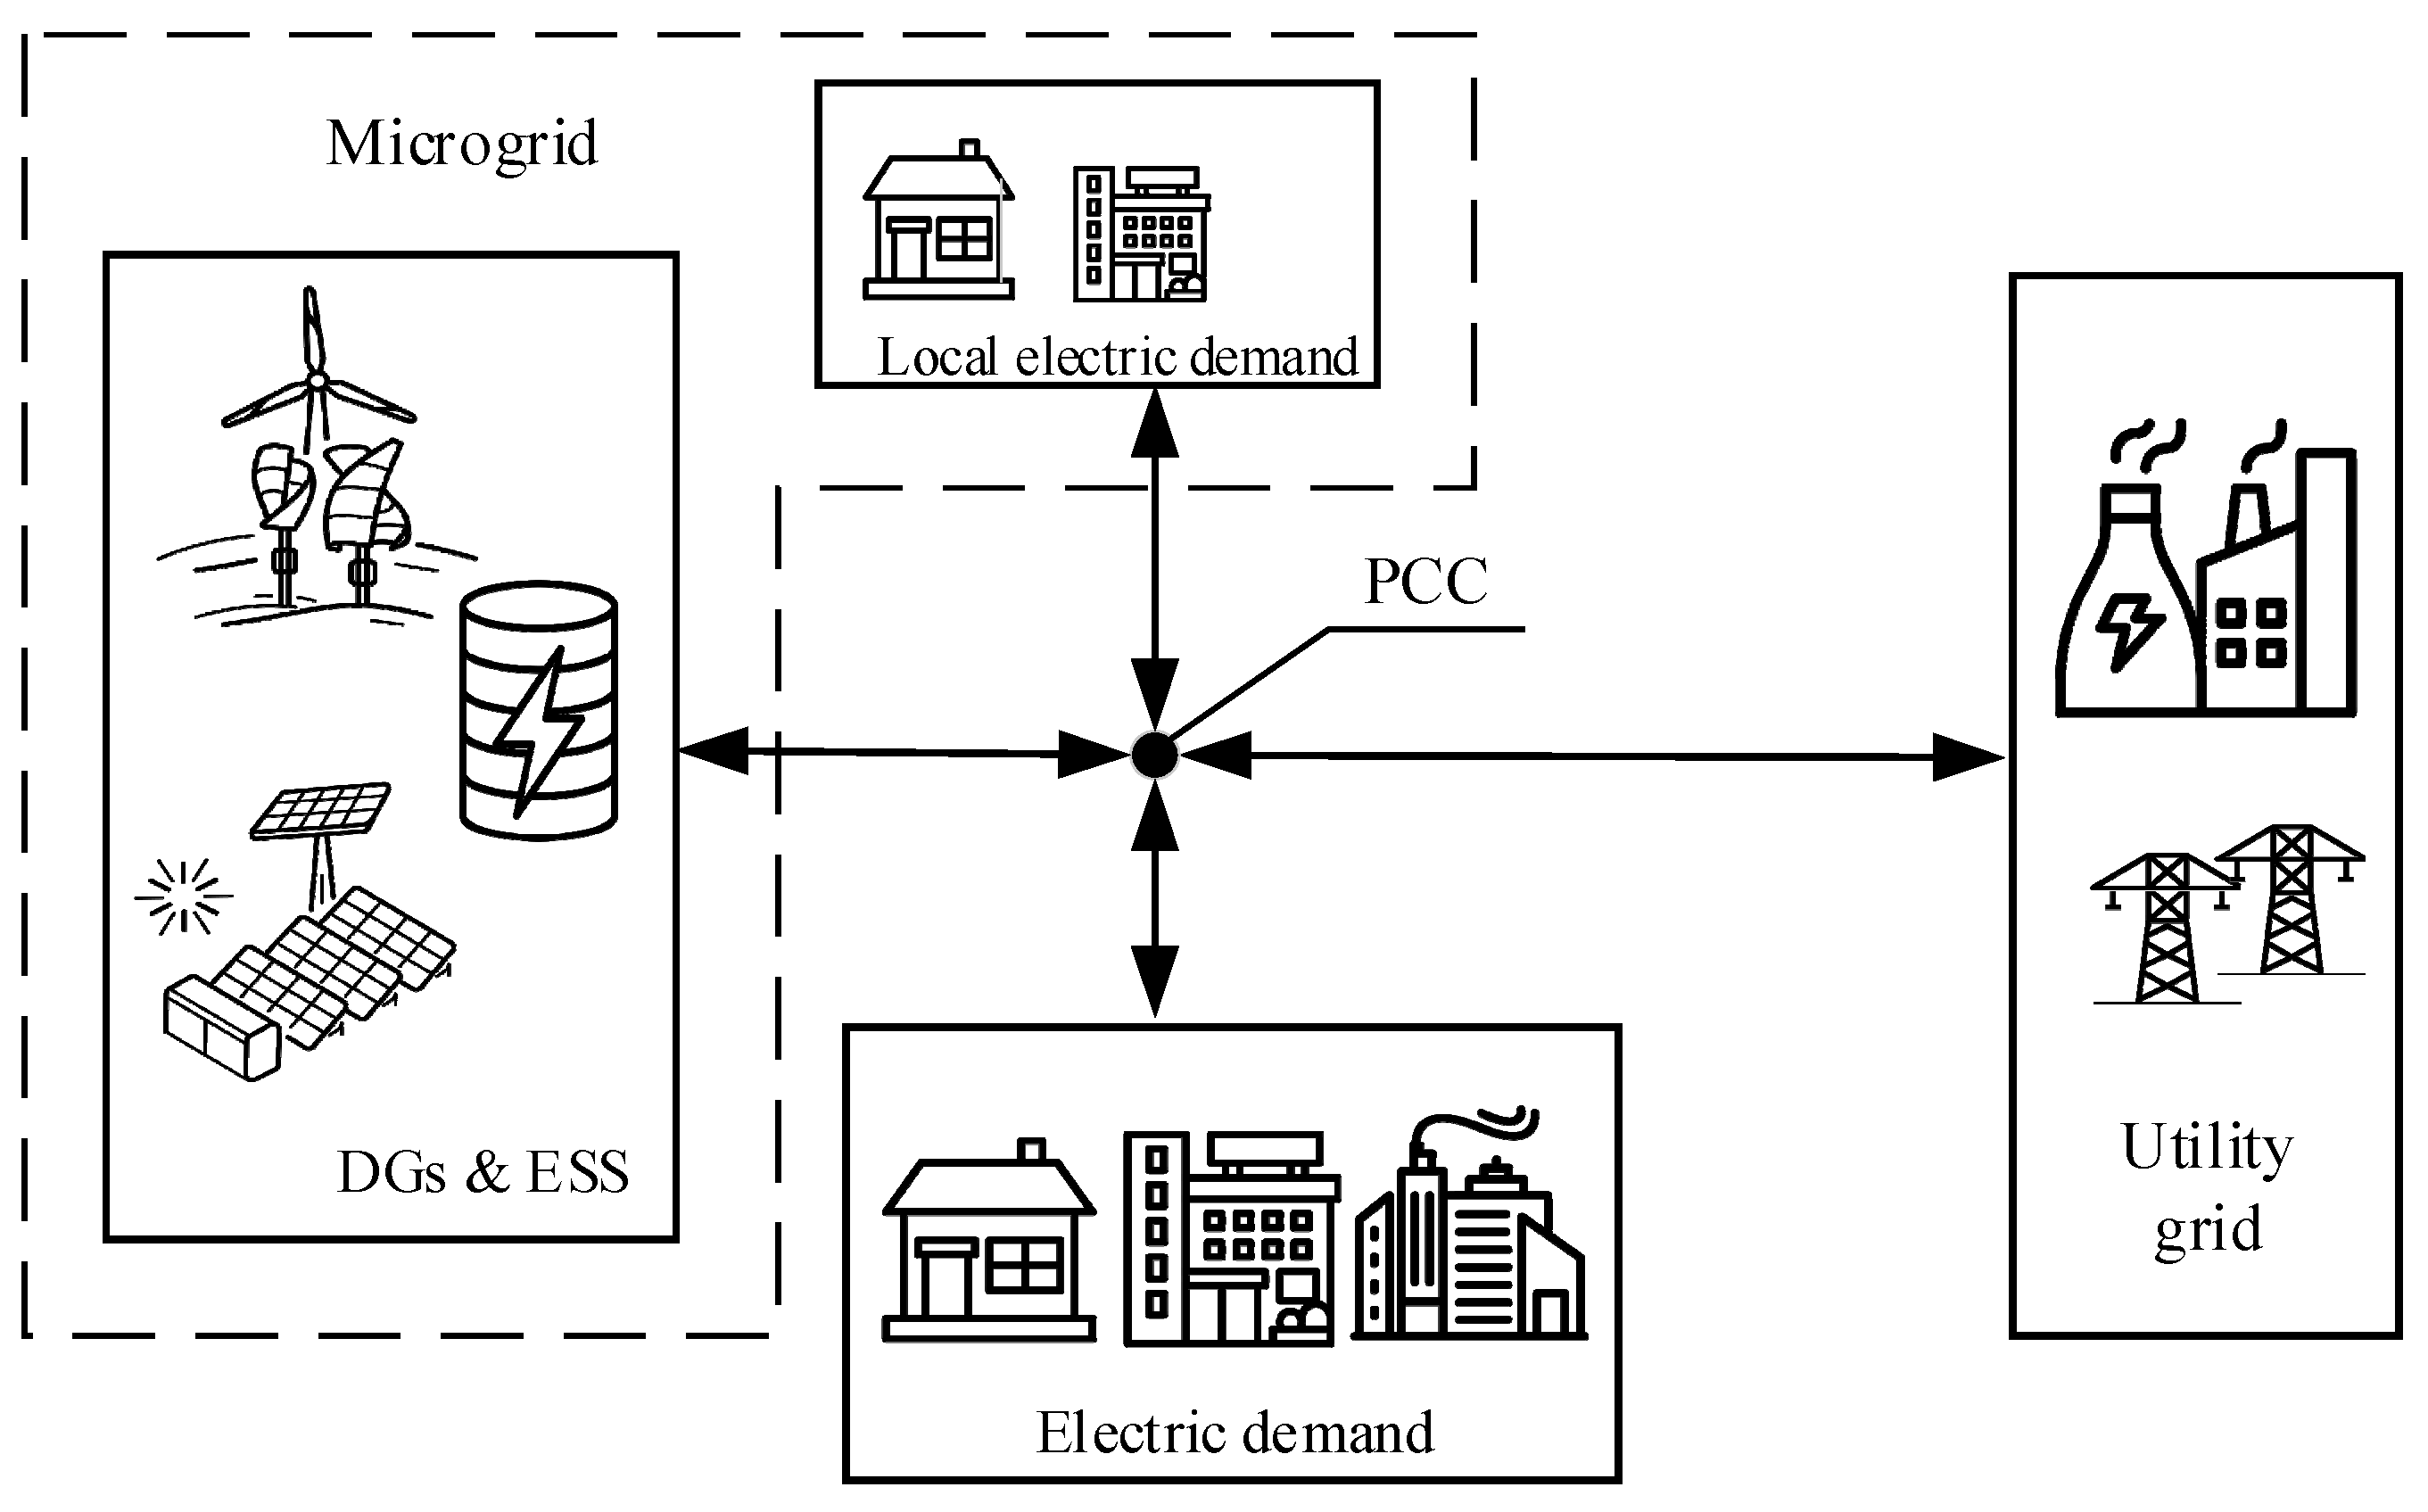
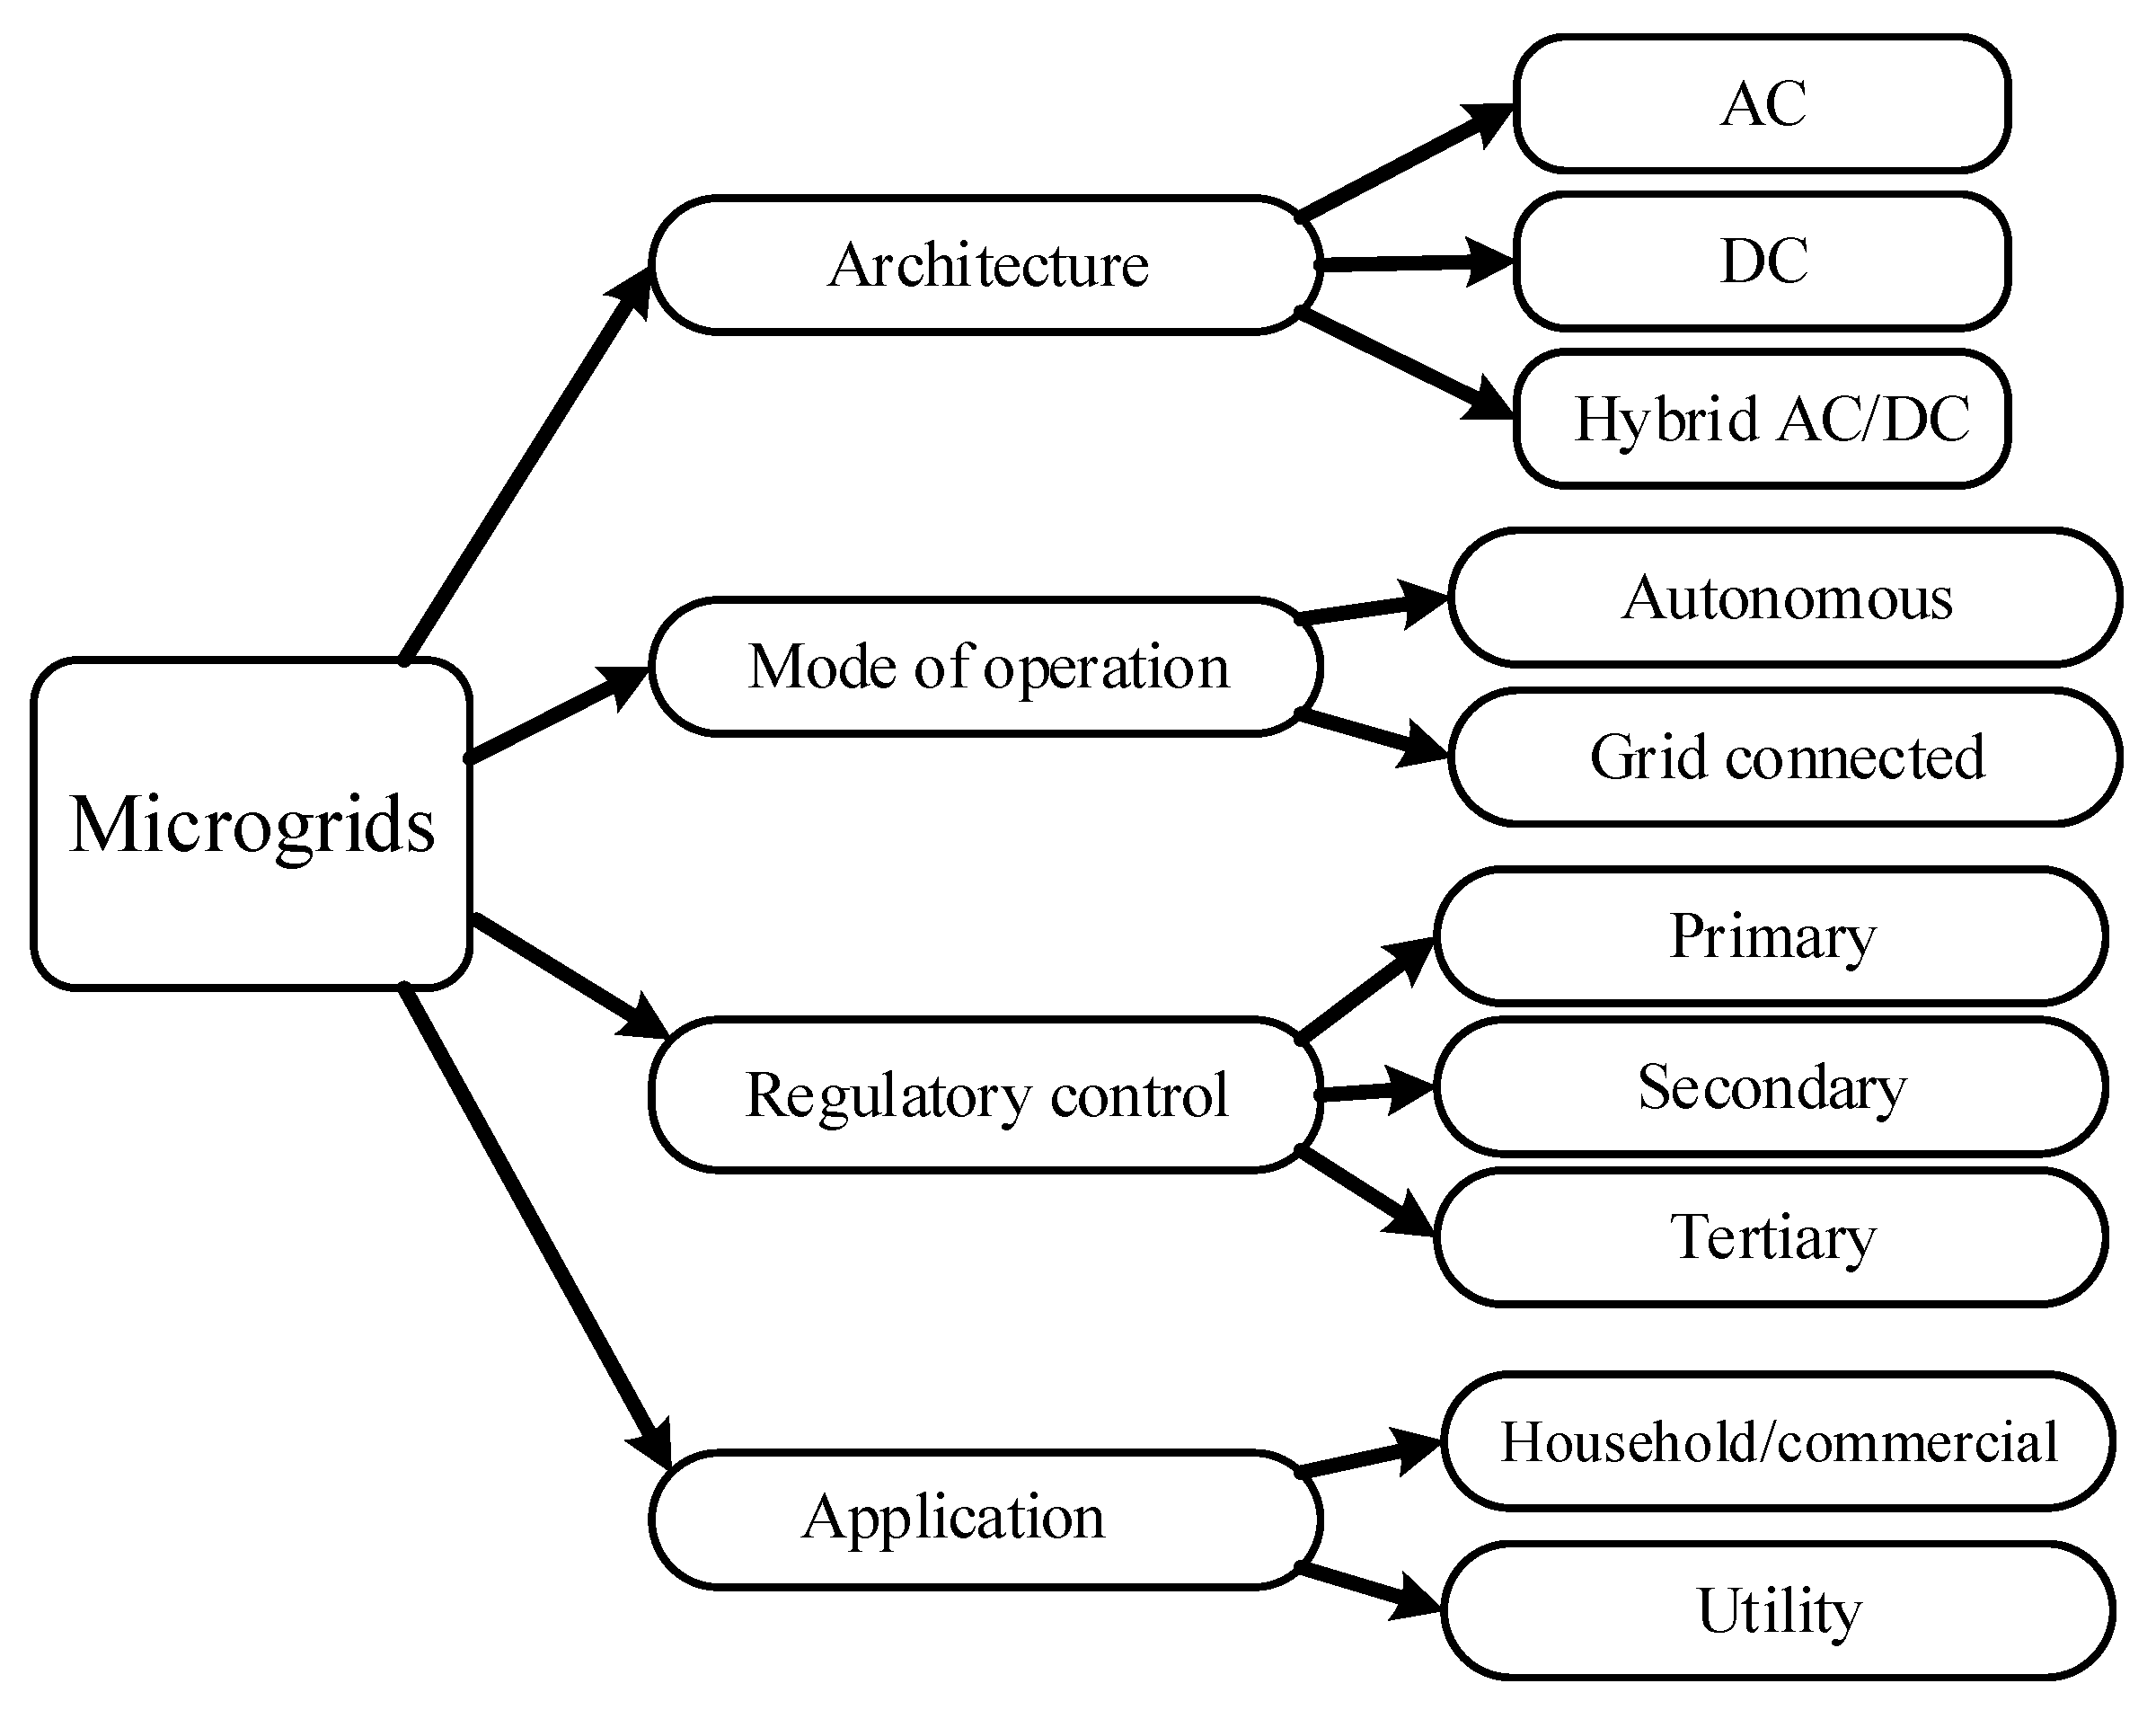
2.1. Microgrid Architecture
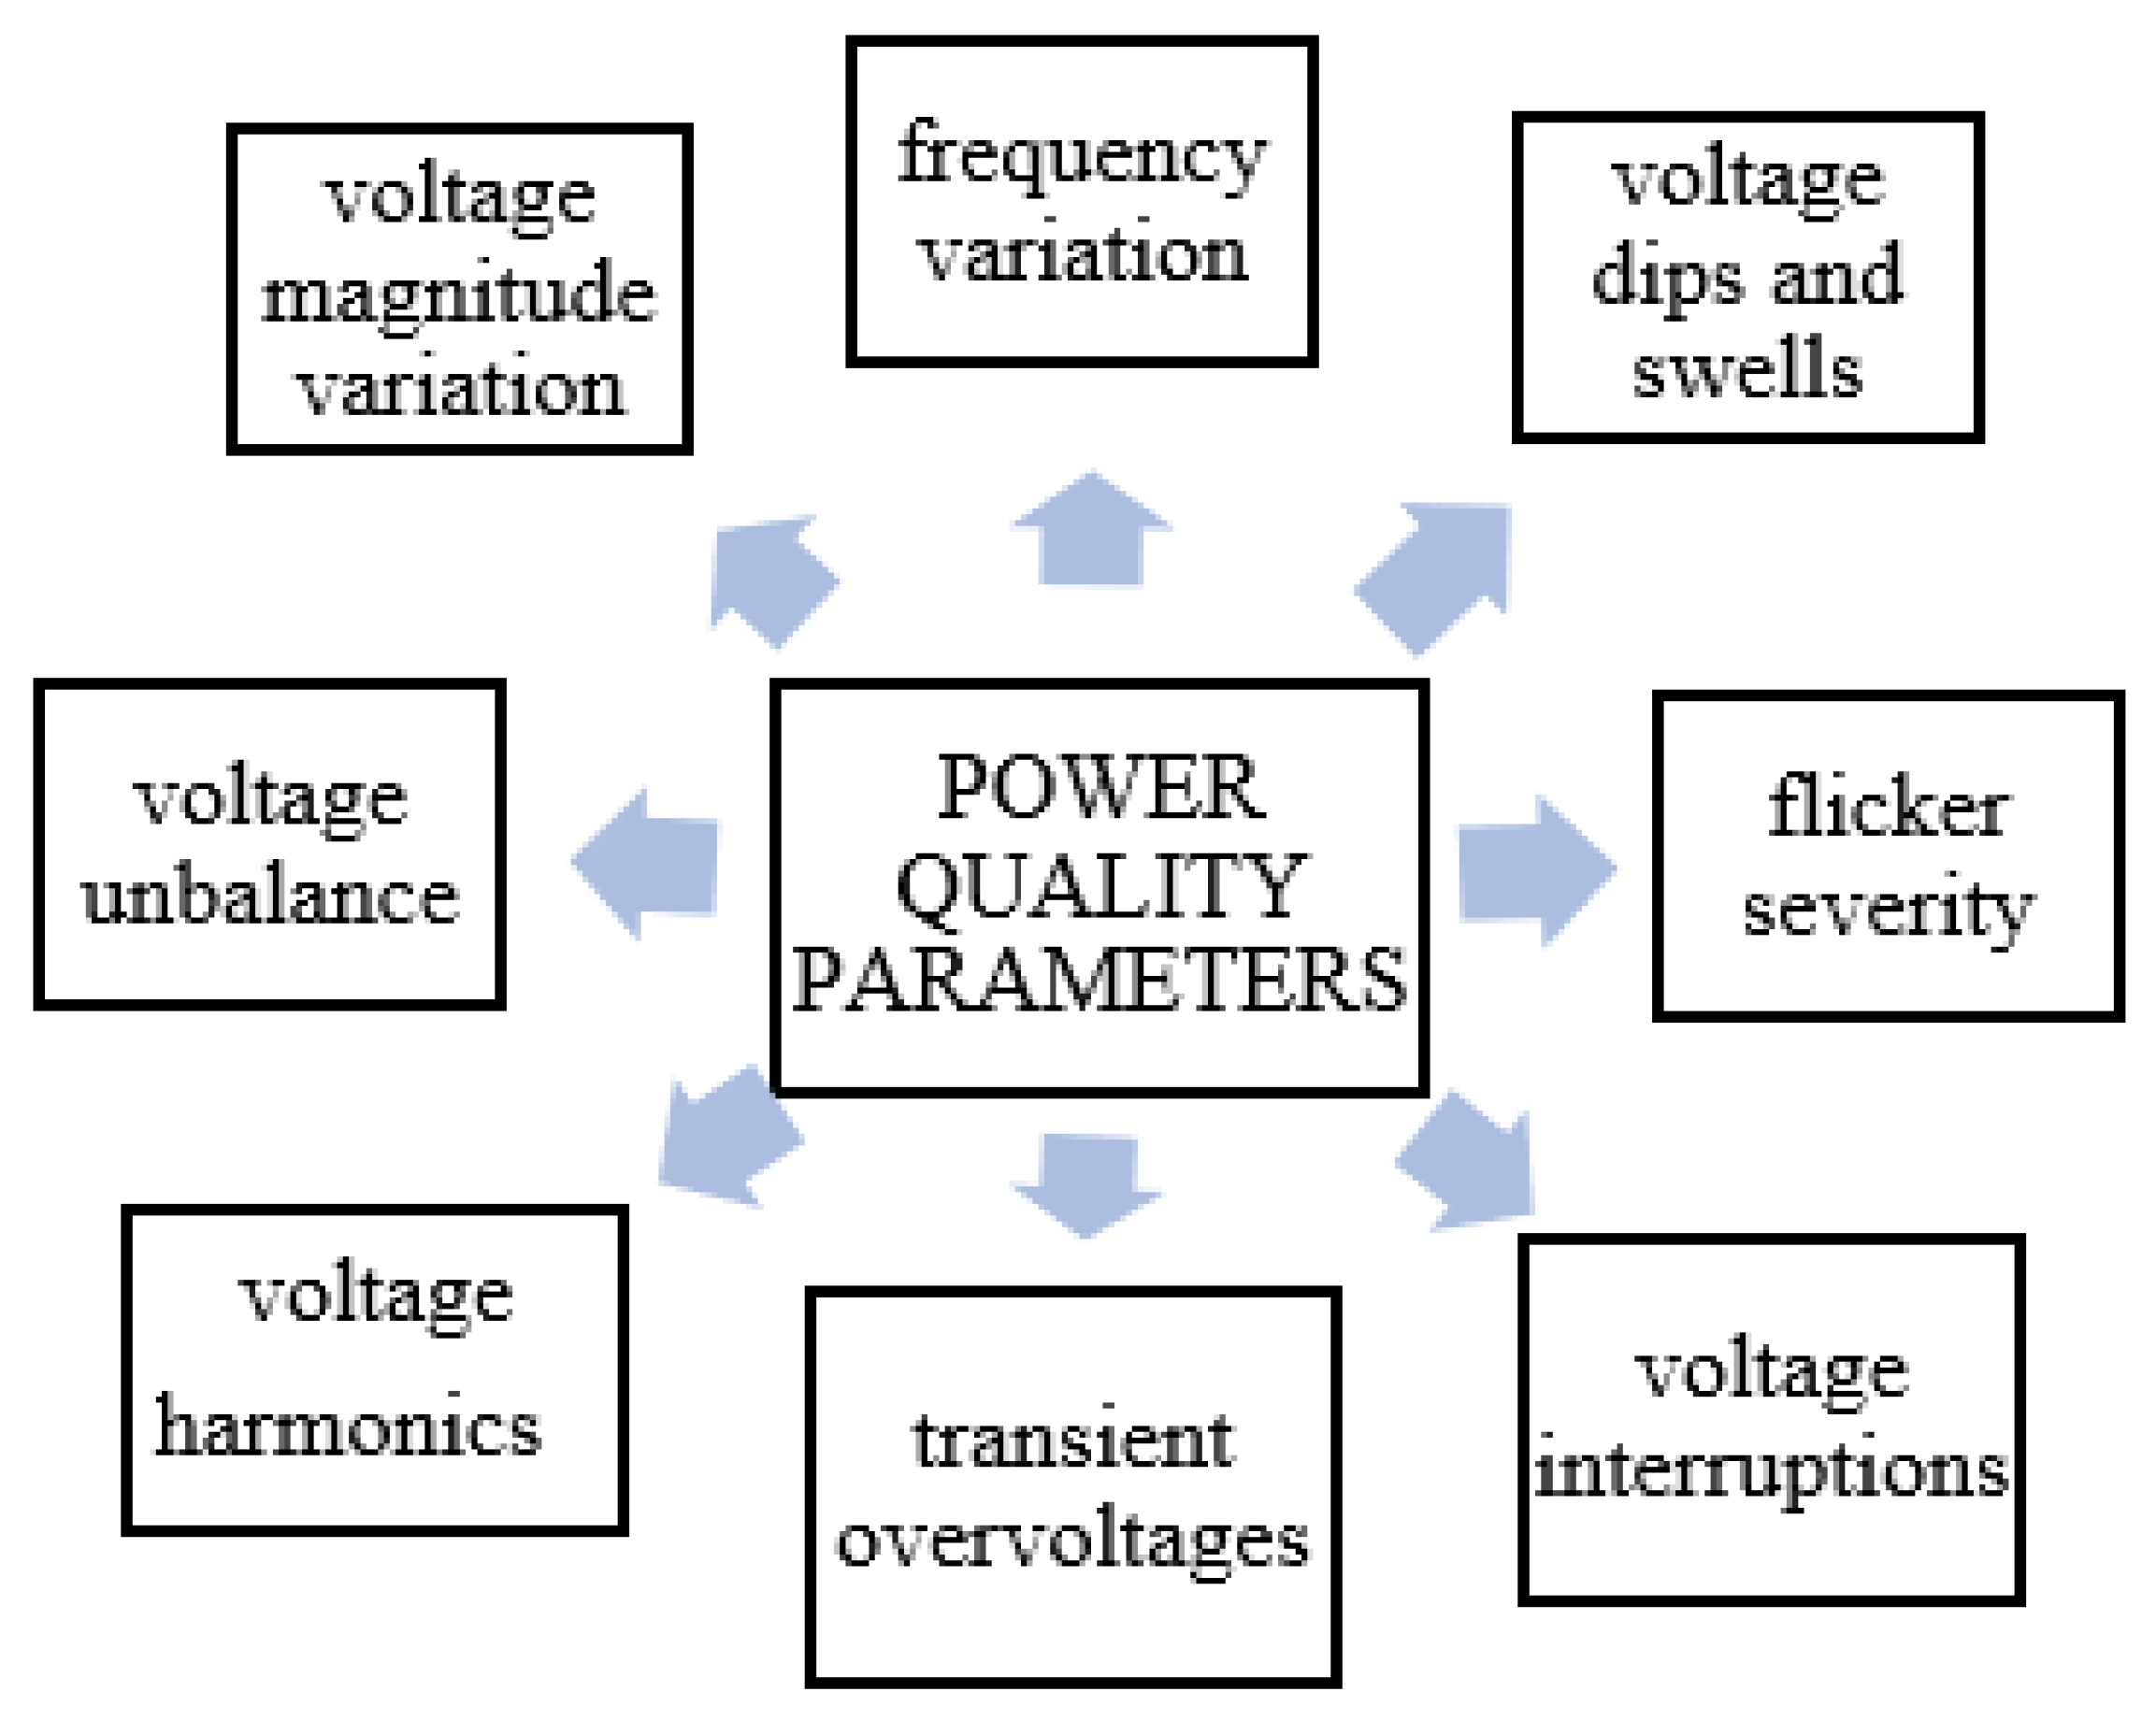
2.2. Power Quality in Microgrids
- bidirectional energy flow;
- access to a large number of power electronic devices (inverters, controllers);
- the stochastic nature of RES generation.
3. Methodology and Research Object
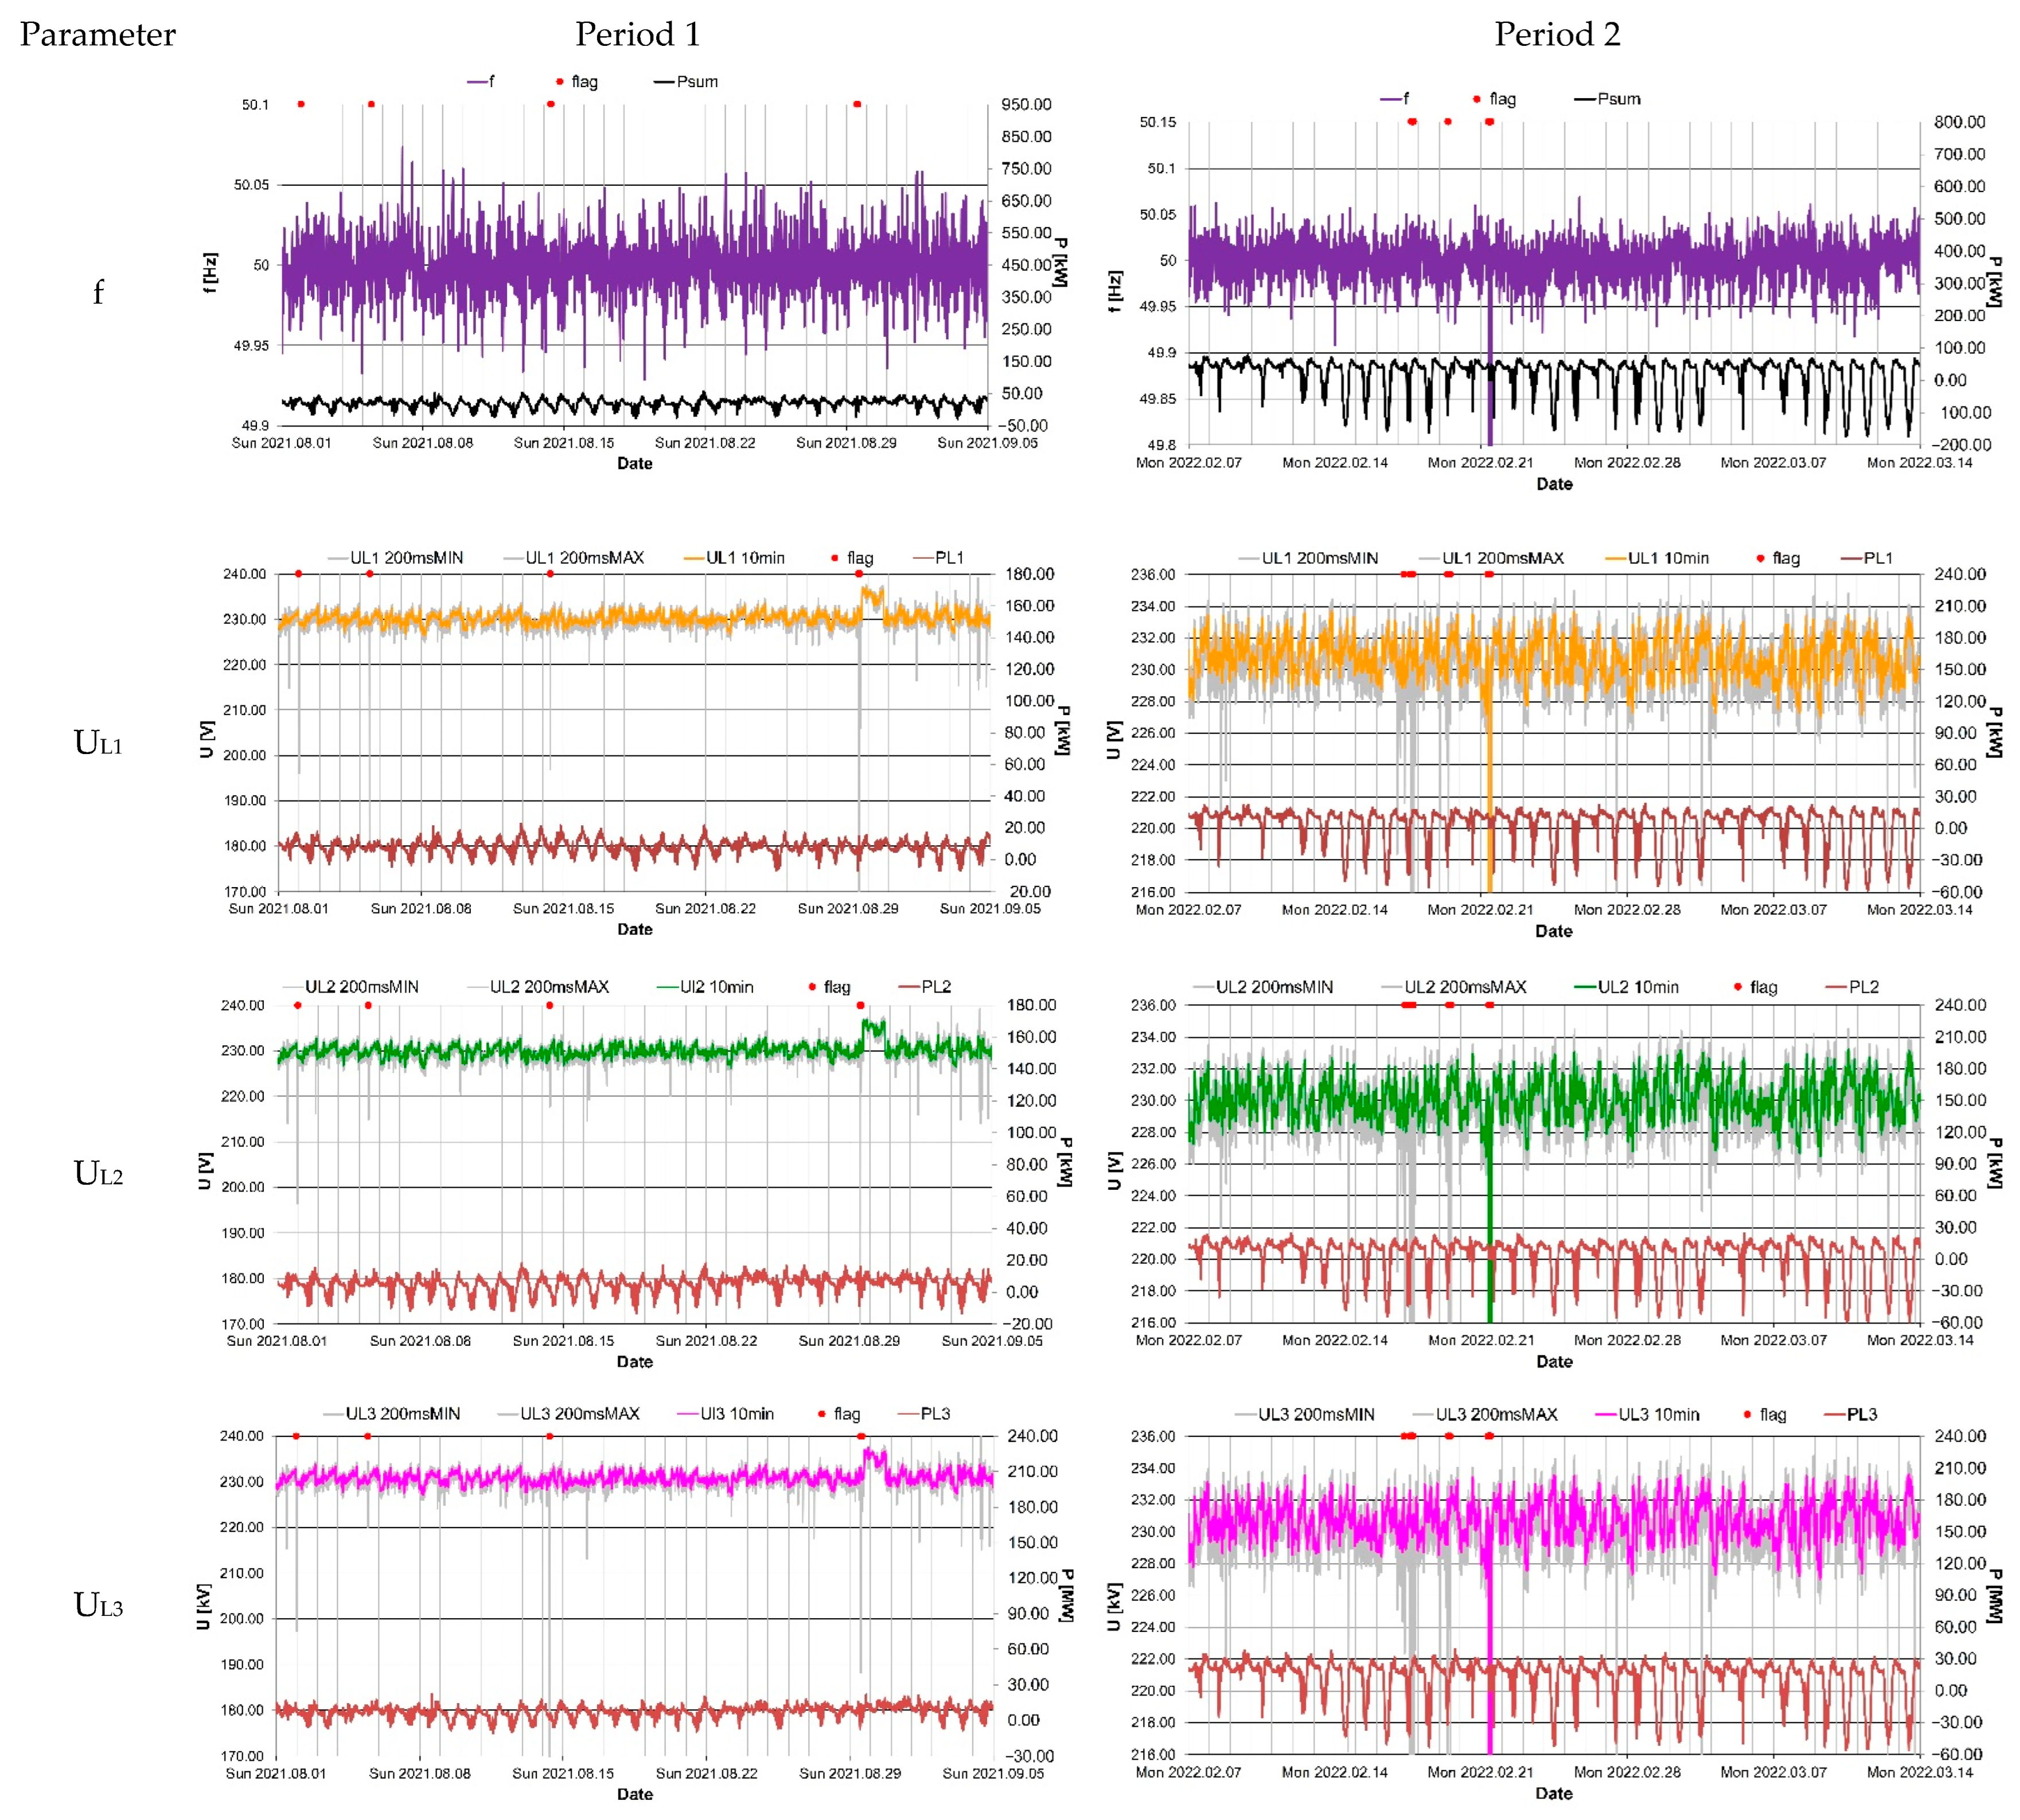
- before implementation of the microgrid into the system. The duration of the measurements was from 01 August 2021 to 05 September 2021;
- after implementing the microgrid into the system (synchronous operation of the microgrid and the system). The duration of the measurements was from 7 February 2022 to 14 March 2022;
- For the indicated measurement point and periods, the PQ assessment was realized using classical 10 min aggregated values of PQ parameters, and for the voltage changes and total harmonic distortion, the 200-ms values of local maximum and minimum were added. However, the obtained data can be also implemented for the comparison of microgrid nodes in terms of power quality using the global power quality index (GPQI) [67], but this issue is outside the scope of this paper. The research applied the rule of flagging and excluding events (dips, short and long interruptions) from the long-term assessment of aggregated values in accordance with the flagging concept of the standard IEC 61000-4-30 [68].
3.1. Power Quality Limits
3.2. Research Object
4. Results
4.1. Power Quality Analysis
- The frequency changes were within a range not exceeding 0.072 Hz;
- The voltage values were fluctuating within a variation range not exceeding 7.33 V;
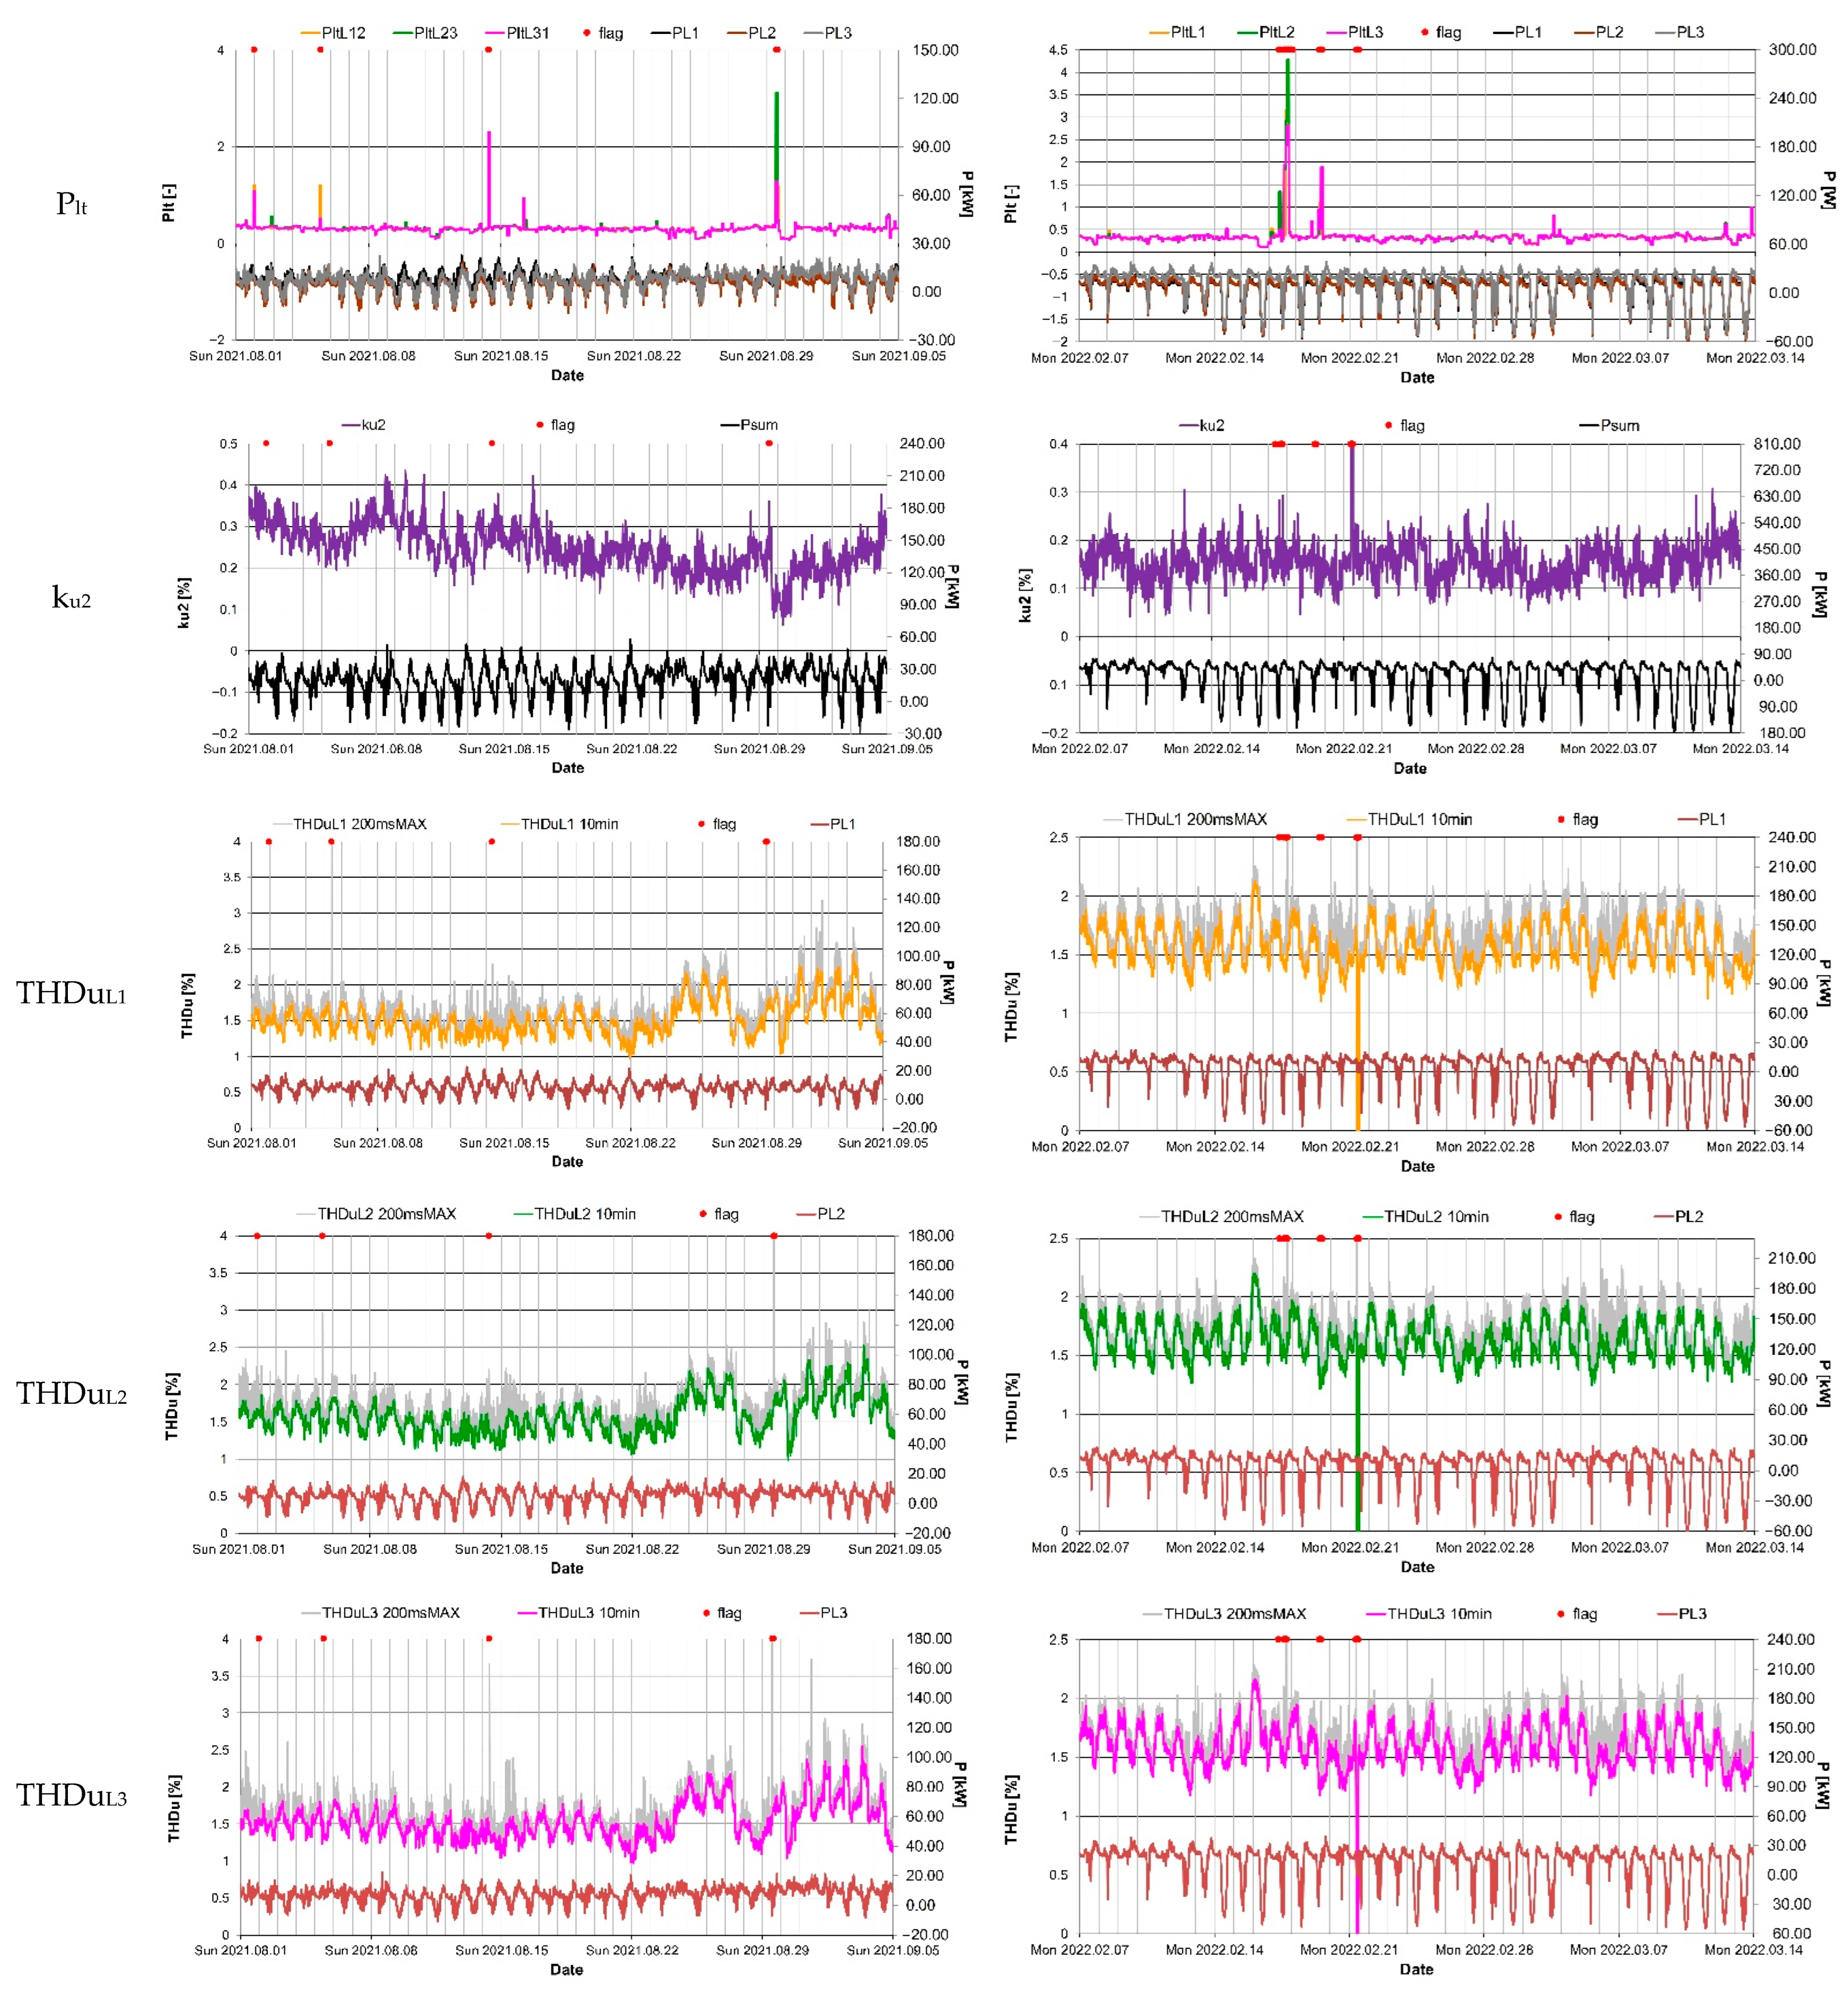
- Voltage fluctuations were represented by Plt within 0.19;
- Asymmetry changes within the range were not exceeding 0.12%;
- The content of harmonics represented by THDu were in the range of 0.8%.
- The frequency changes were within a range not exceeding 0.091 Hz;
- The voltage values fluctuated within a variation range not exceeding 3.69 V;
- Voltage fluctuations were represented by Plt within 0.11;
- Asymmetry changes within the range were not exceeding 0.12%;
- The content of harmonics represented by THDu were in the range of 0.8%.
4.2. Comparative Assessment
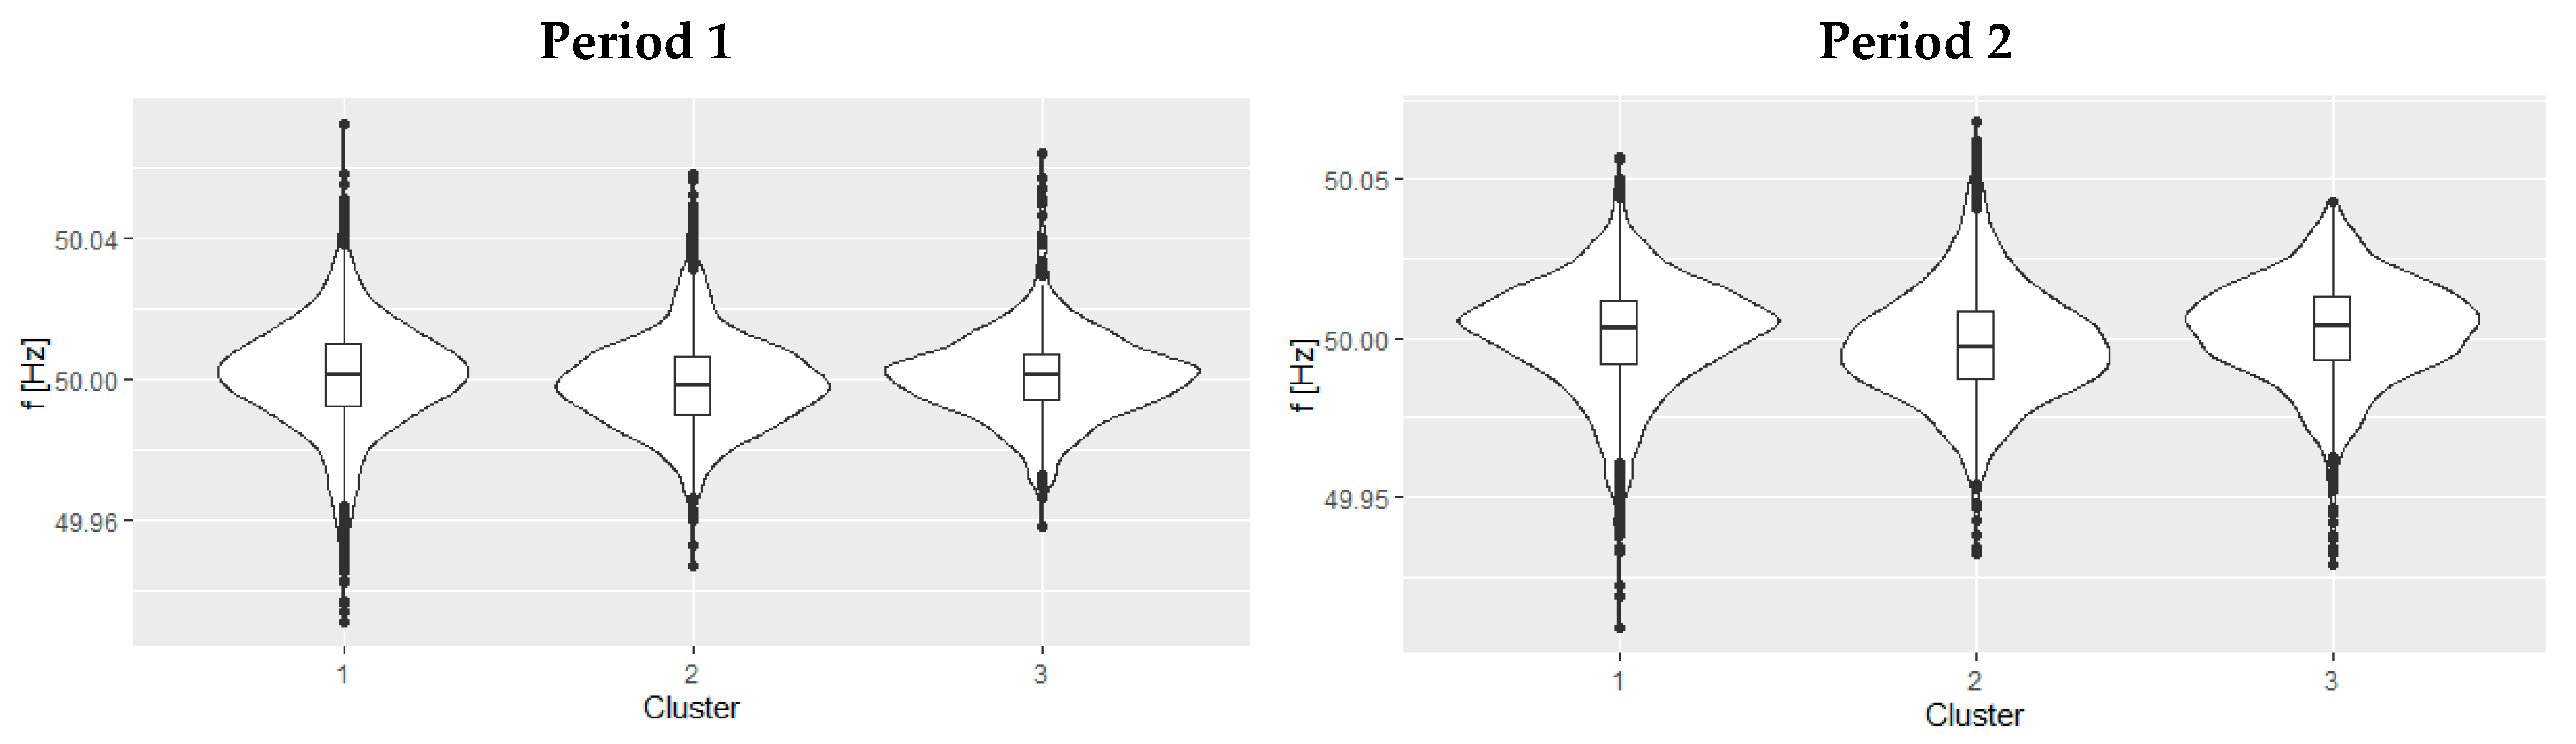
- When the local generation fully meets local demand (cluster 3);
- When the local generation does not meet local demand (clusters 1 and 2).
- Cluster 1—night represented by 2310 10 min data (approximately 46% of the measurement time);
- Cluster 2—day without full coverage of local demand represented by 1737 10 min data (approximately 35% of the measurement time);
- Cluster 3—day with full coverage of local demand represented by 971 10 min data (approximately 19% of the measurement time).
4.2.1. Frequency
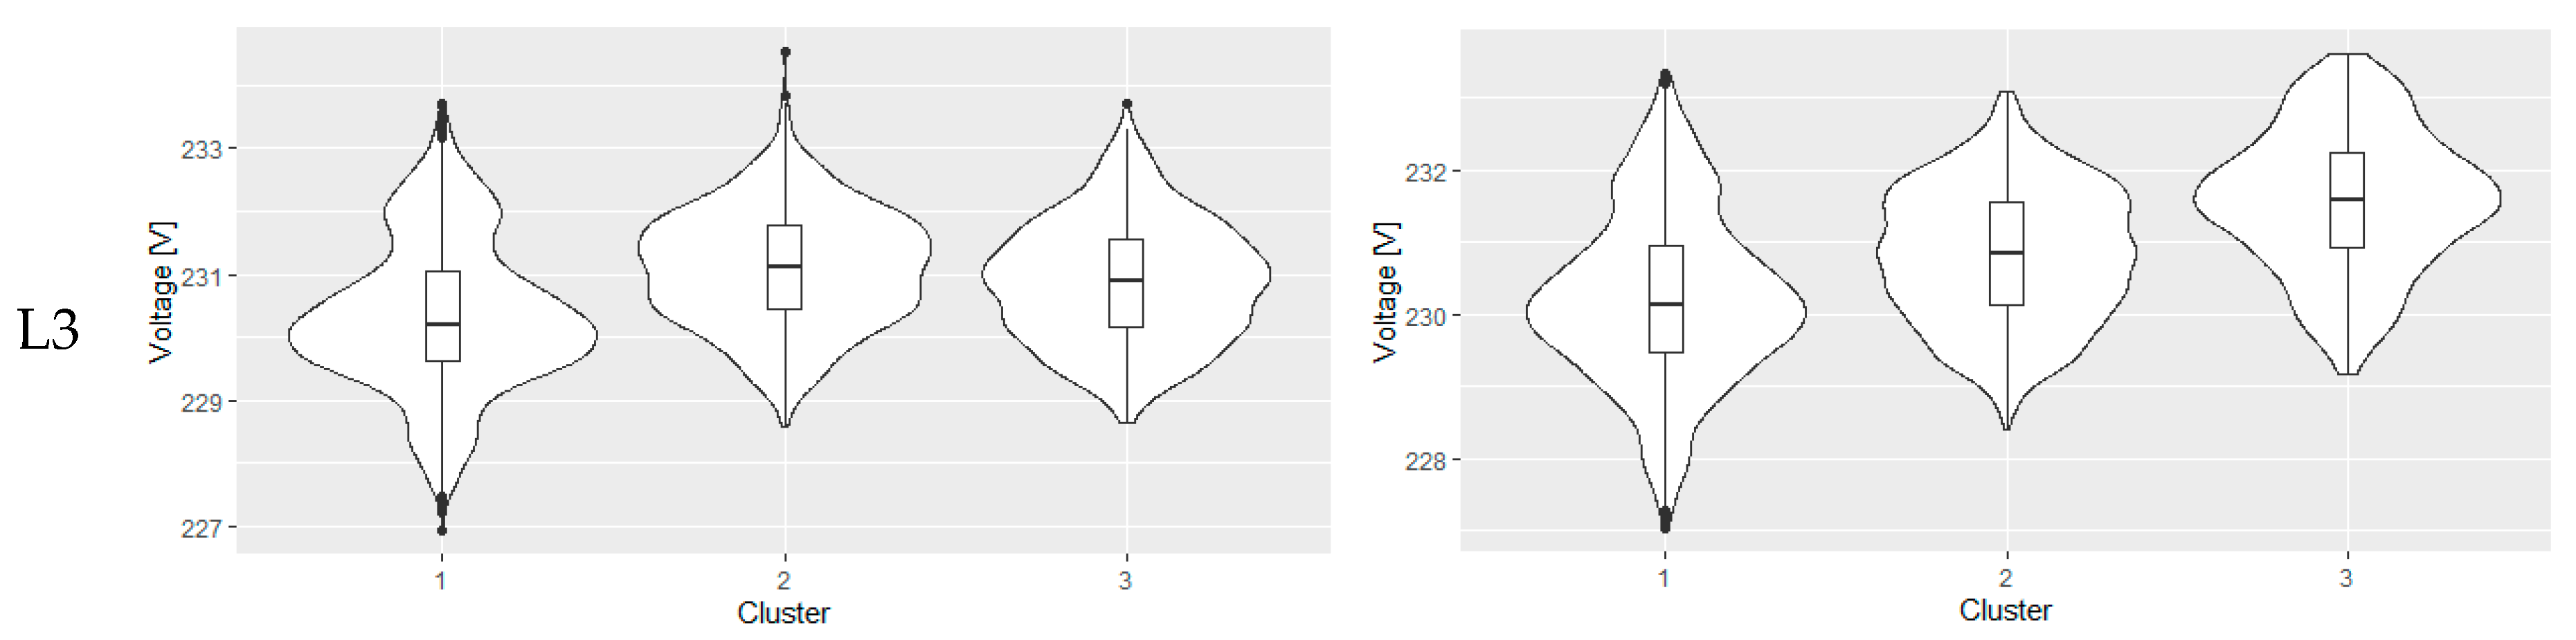
4.2.2. Voltage
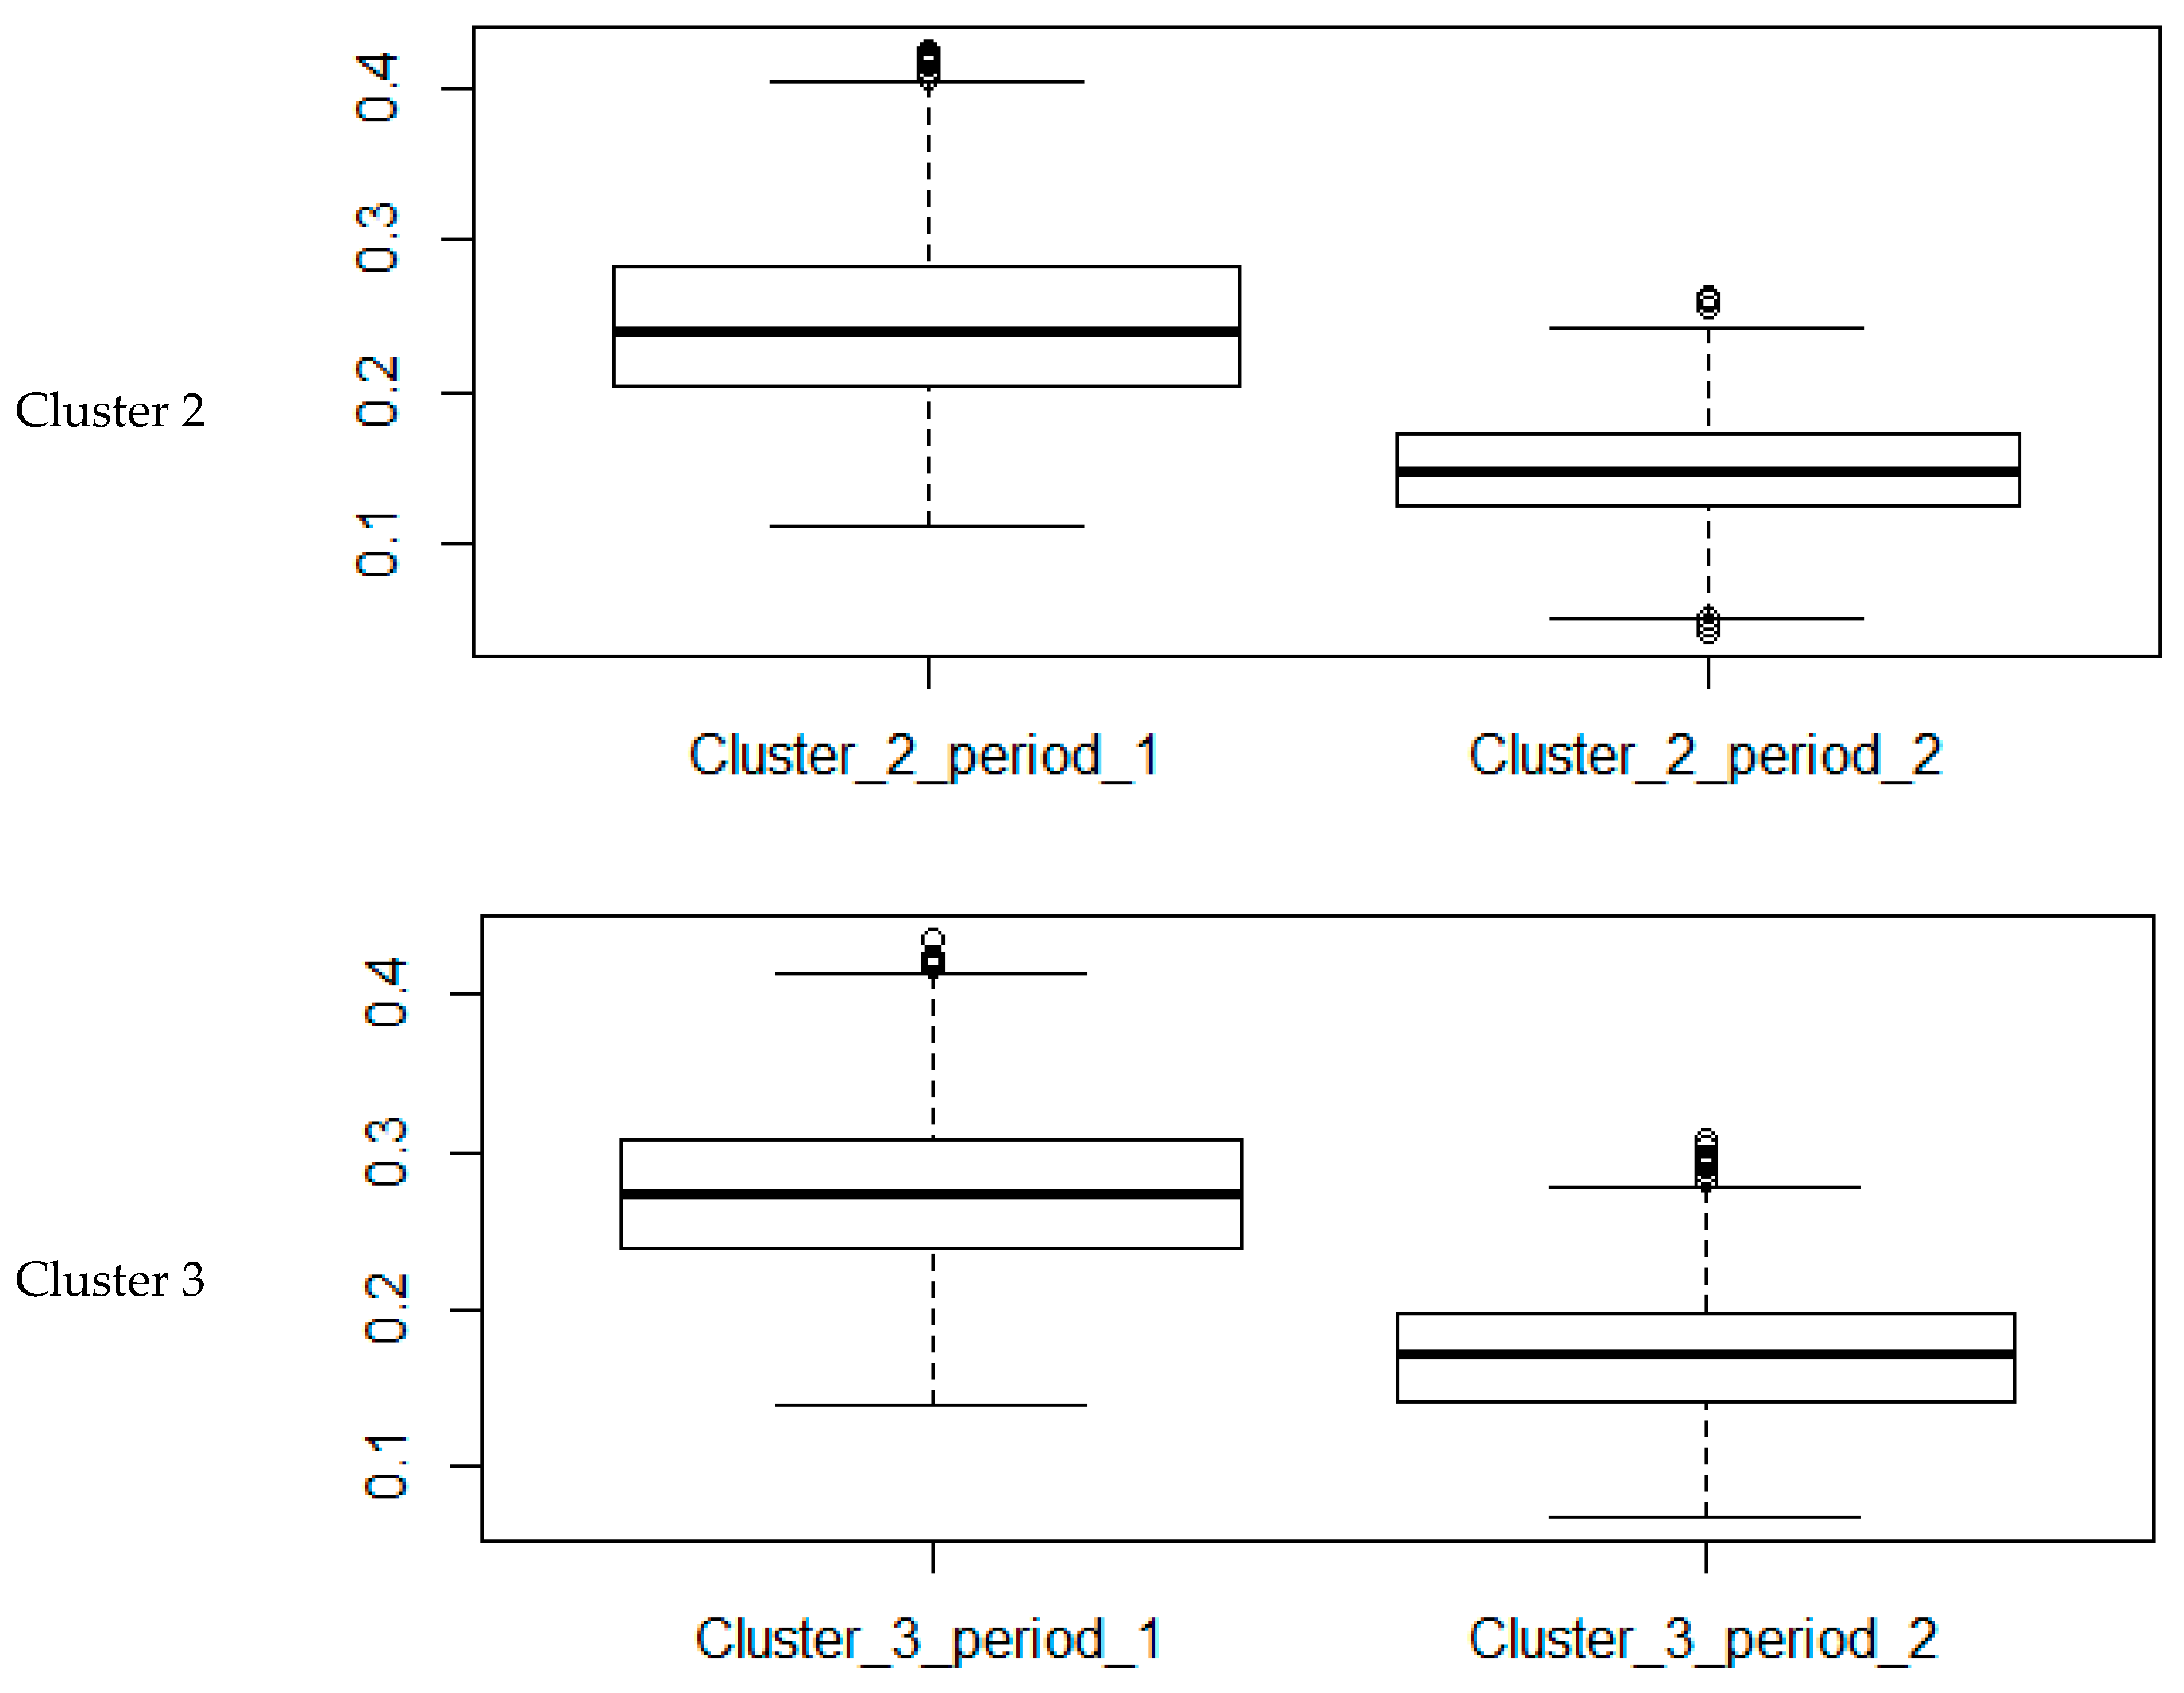
4.2.3. Flickers
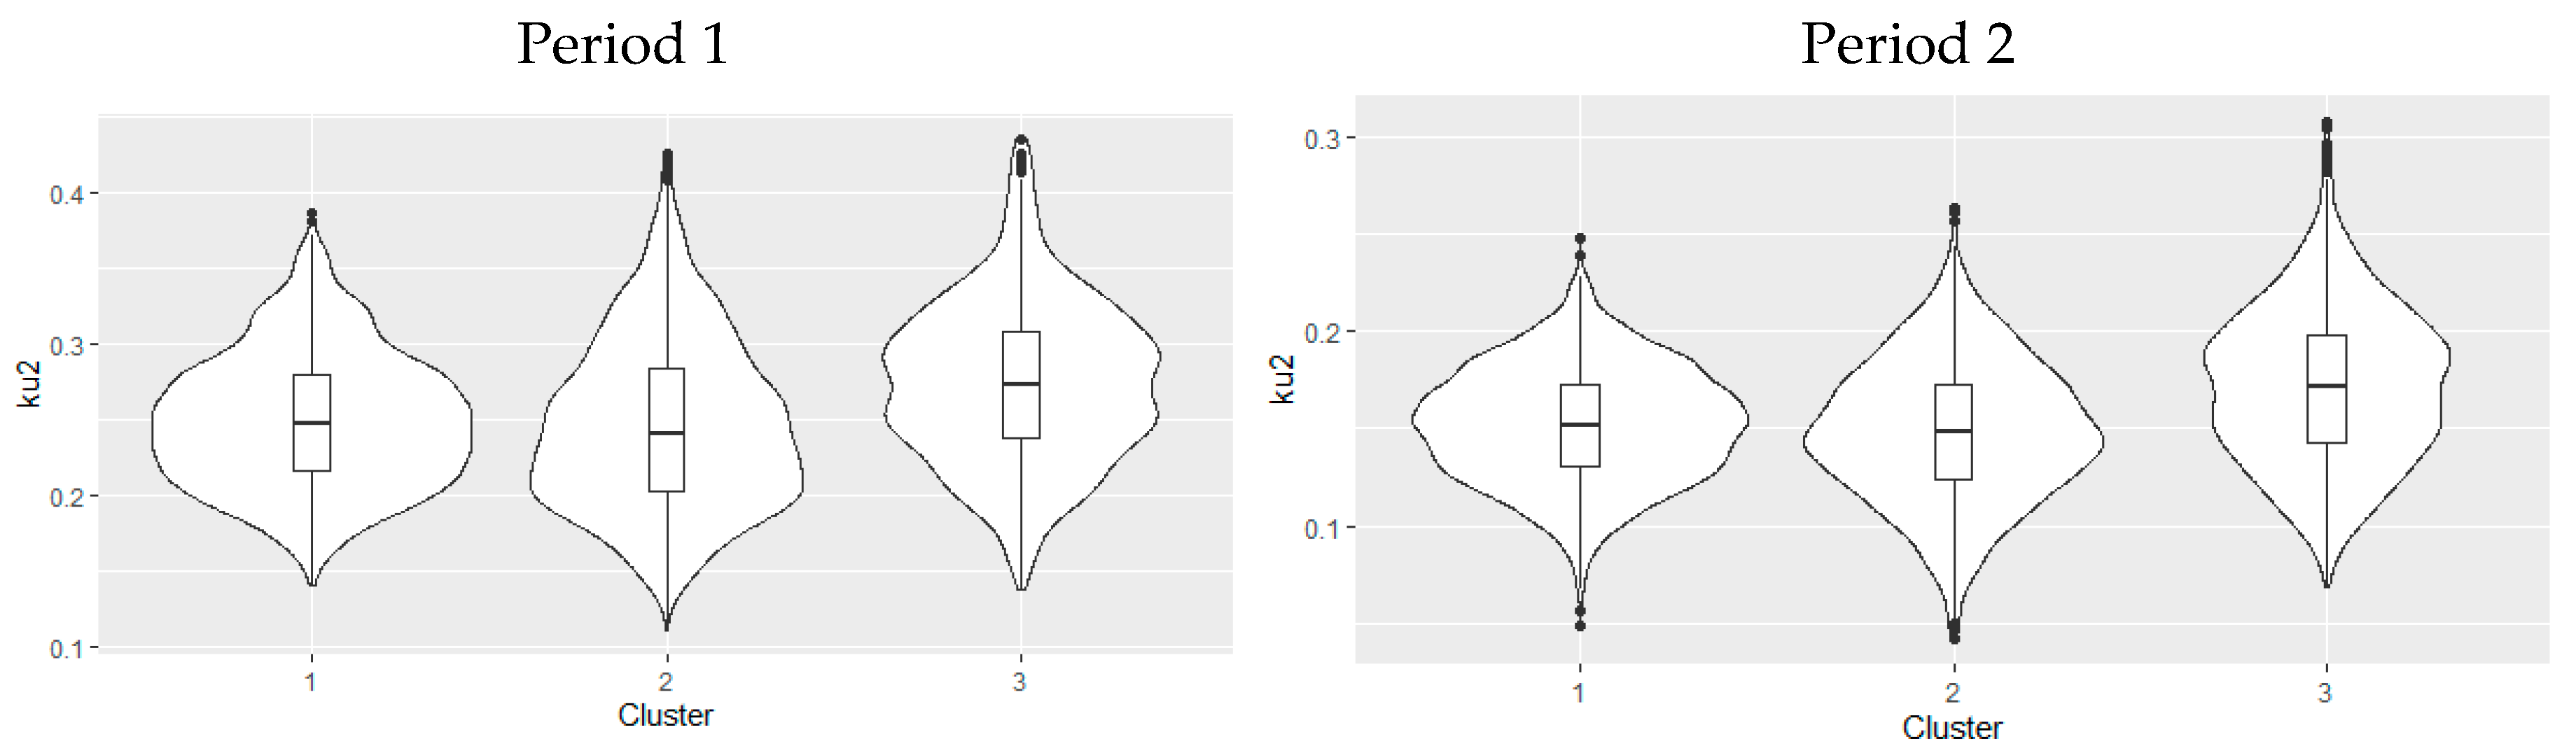
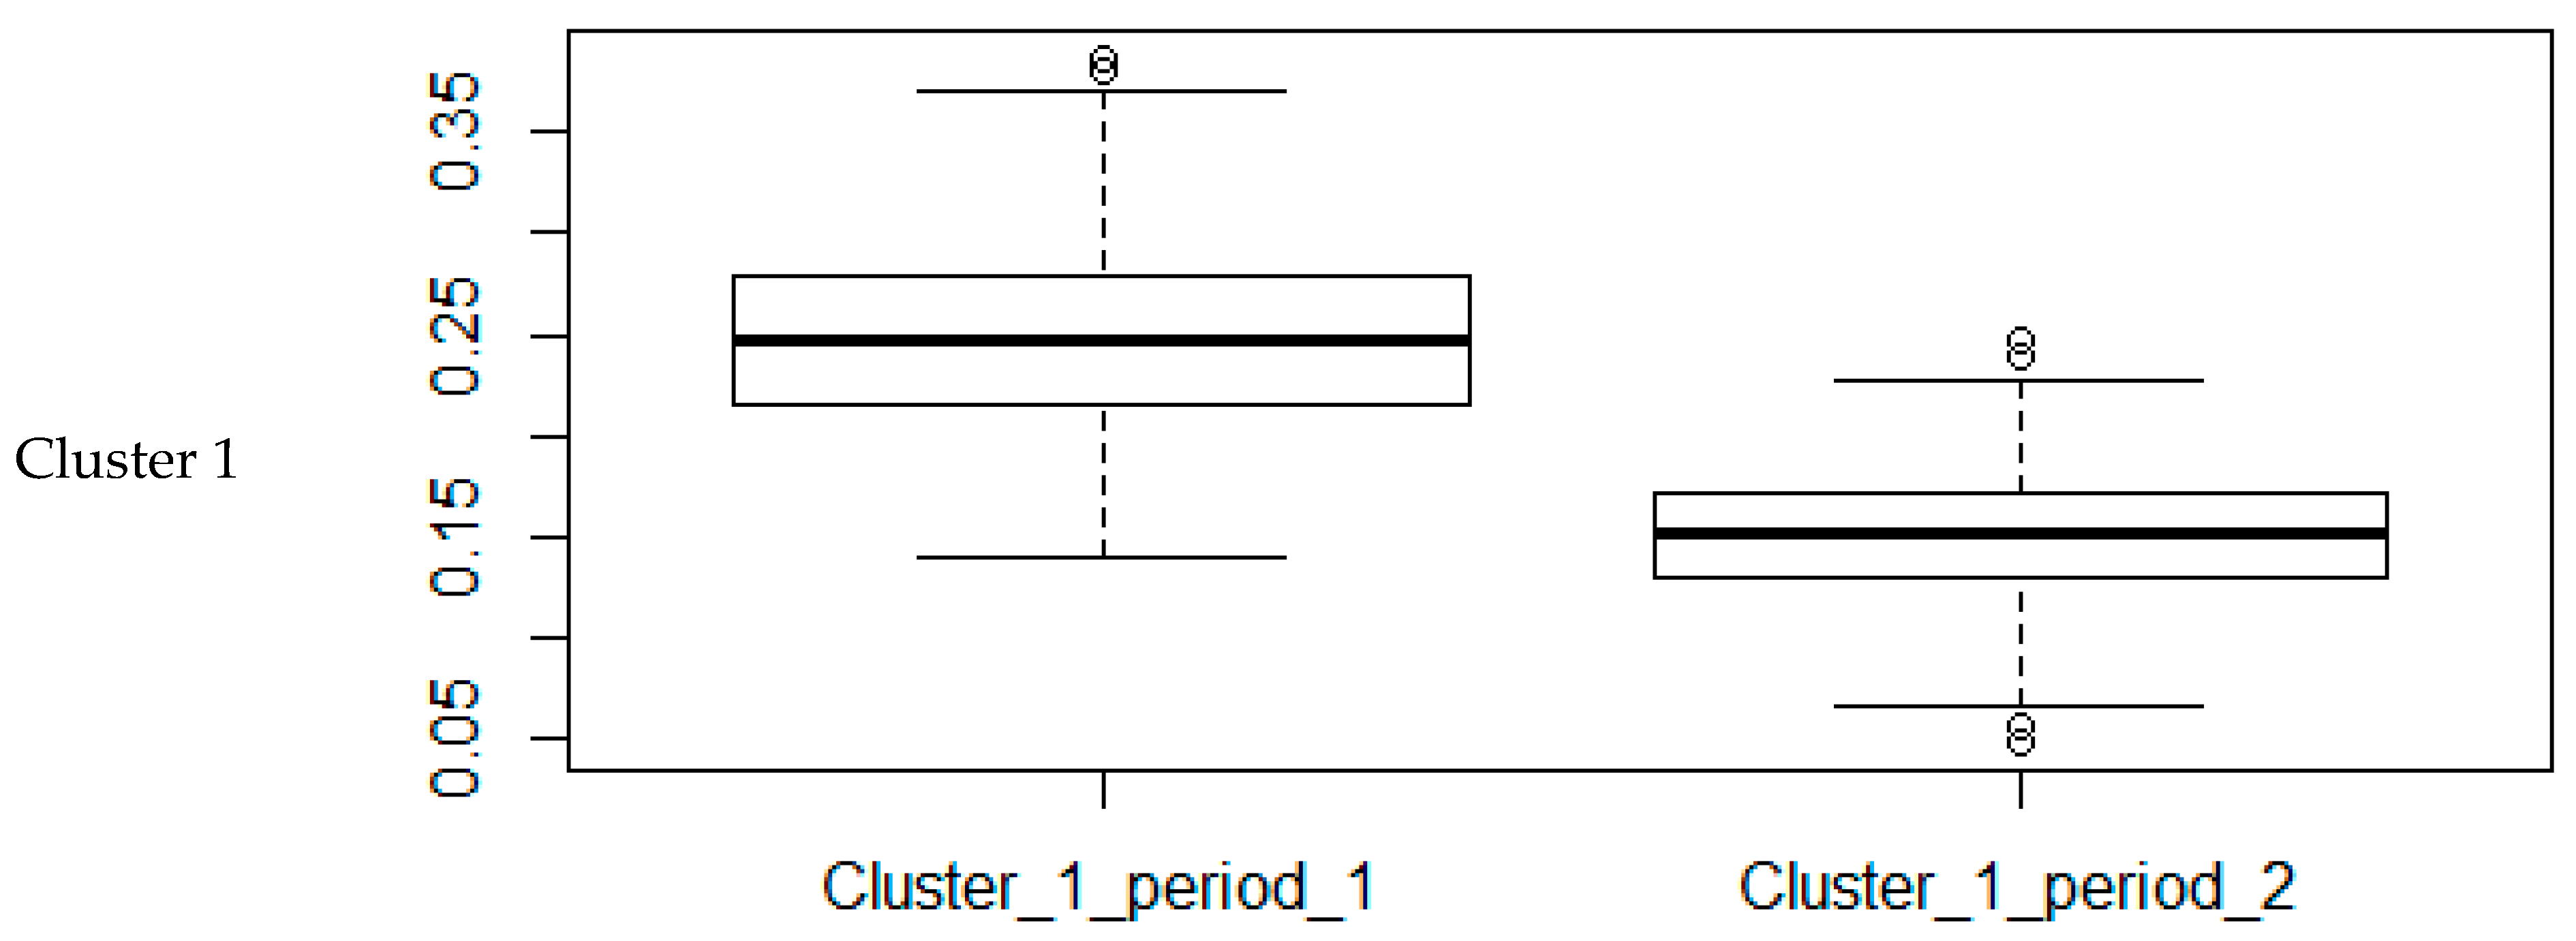
4.2.4. Voltage Unbalance Factor
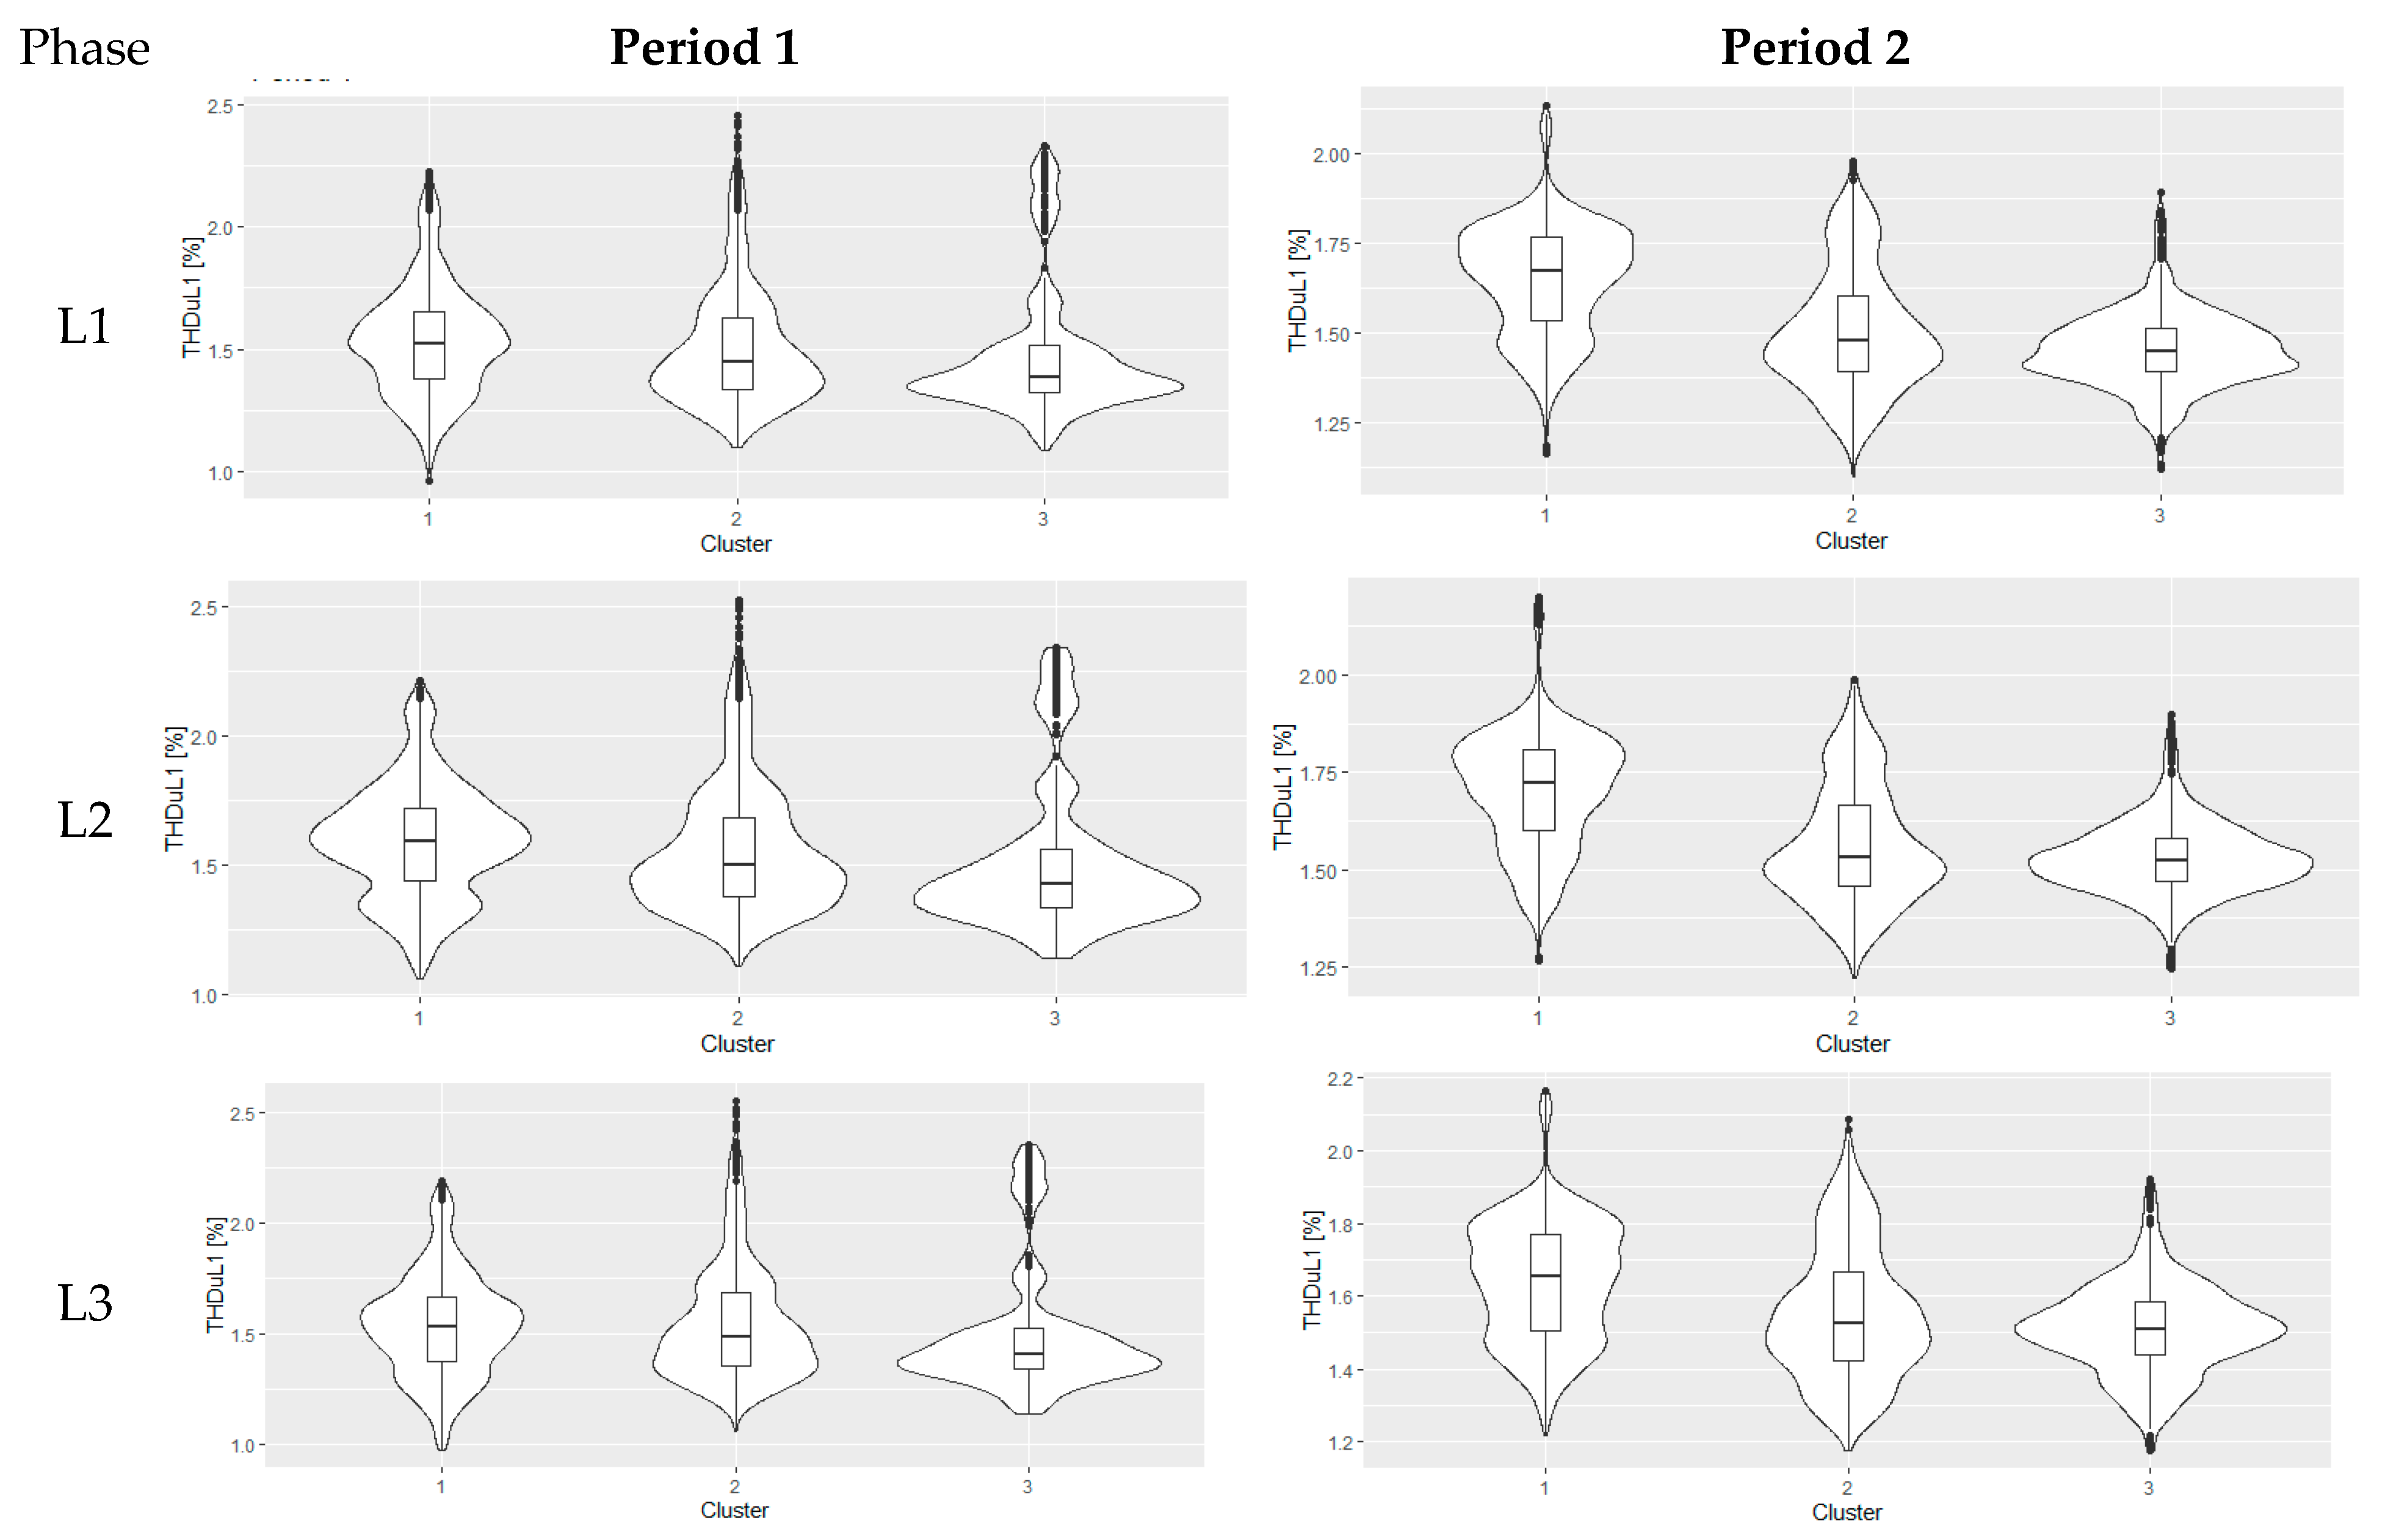
4.2.5. Total Harmonic Distortion
5. Conclusions
Author Contributions
Funding
Data Availability Statement
Conflicts of Interest
Abbreviations
| Qu | quantiles (successively 1st, 2nd, 3rd, 4th) |
| A | Anderson–Darling normality |
| AC | alternating current |
| D | Kołmogorov–Smirnov test |
| DC | direct current |
| DER | distributed energy resources |
| DG | distributed generation |
| ESS | energy storage system |
| f | power frequency |
| GPQI | global power quality index |
| ILC | bidirectional interlinking converter |
| IQR | interquartile range |
| ku2 | voltage unbalance factor |
| LV | low voltage |
| max | maximum value |
| MG | microgrid |
| min | minimum value |
| MV | middle voltage |
| MW | mega watt (coherent unit of power) |
| PCC | point of common coupling |
| Plt | flicker severity |
| PQ | power quality |
| PQI | power quality indices |
| PV | photovoltaic, photovoltaic power unit |
| p-value | rank-sum test statistic W |
| PVDG | photovoltaic distributed generation |
| RES | renewable energy sources |
| RMS | root-mean-square value |
| SPWM | sinusoidal pulse width modulation |
| St. Dev. | standard deviation |
| TDD | total demand distortion |
| THC | total harmonic current |
| THD | total harmonic distortion |
| THDu | total harmonic distortion for voltage |
| THDuL1, THDuL2, THDuL3 | total harmonic distortion for voltage in each phase: L1, L2, L3 |
| U | voltage |
| UL1, UL2, UL3 | phase voltage in phase: L1, L2, L3 |
| W | test statistic value |
References
- Levenda, A.M.; Behrsin, I.; Disano, F. Renewable Energy for Whom? A Global Systematic Review of the Environmental Justice Implications of Renewable Energy Technologies. Energy Res. Soc. Sci. 2021, 71, 101837. [Google Scholar]
- Li, L.; Lin, J.; Wu, N.; Xie, S.; Meng, C.; Zheng, Y.; Wang, X.; Zhao, Y. Review and Outlook on the International Renewable Energy Development. Energy Built Environ. 2022, 3, 139–157. [Google Scholar] [CrossRef]
- Maradin, D. Advantages and Disadvantages of Renewable Energy Sources Utilization. Int. J. Energy Econ. Policy 2021, 11, 176–183. [Google Scholar] [CrossRef]
- Radmehr, R.; Shayanmehr, S.; Ali, E.B.; Ofori, E.K.; Jasińska, E.; Jasiński, M. Exploring the Nexus of Renewable Energy, Ecological Footprint, and Economic Growth through Globalization and Human Capital in G7 Economics. Sustainability 2022, 14, 12227. [Google Scholar] [CrossRef]
- Hernik, J.; Noszczyk, T.; Rutkowska, A. Towards a Better Understanding of the Variables That Influence Renewable Energy Sources in Eastern Poland. J. Clean. Prod. 2019, 241, 118075. [Google Scholar] [CrossRef]
- Szyba, M. Spatial Planning and the Development of Renewable Energy Sources in Poland. Acta Innov. 2021, 2021, 5–14. [Google Scholar] [CrossRef]
- Paska, J.; Surma, T.; Terlikowski, P.; Zagrajek, K. Electricity Generation from Renewable Energy Sources in Poland as a Part of Commitment to the Polish and EU Energy Policy. Energies 2020, 13, 4261. [Google Scholar] [CrossRef]
- Ahmed, N.; Sheikh, A.A.; Mahboob, F.; Ali, M.S.; Jasińska, E.; Jasiński, M.; Leonowicz, Z.; Burgio, A. Energy Diversification: A Friend or Foe to Economic Growth in Nordic Countries? A Novel Energy Diversification Approach. Energies 2022, 15, 5422. [Google Scholar] [CrossRef]
- Hatziargyriou, N. Microgrids: Architectures and Control; John Wiley & Sons: Hoboken, NJ, USA, 2013. [Google Scholar]
- Gust, G.; Brandt, T.; Mashayekh, S.; Heleno, M.; DeForest, N.; Stadler, M.; Neumann, D. Strategies for Microgrid Operation under Real-World Conditions. Eur. J. Oper. Res. 2021, 292, 339–352. [Google Scholar] [CrossRef]
- Ghorbanian, M.; Dolatabadi, S.H.; Siano, P. Big Data Issues in Smart Grids: A Survey. IEEE Syst. J. 2019, 13, 4158–4168. [Google Scholar] [CrossRef]
- Dhupia, B.; Usha Rani, M.; Alameen, A. The Role of Big Data Analytics in Smart Grid Management. In Emerging Research in Data Engineering Systems and Computer Communications; Springer: Berlin/Heidelberg, Germany, 2020; Volume 1054, pp. 403–412. [Google Scholar]
- Golla, M.; Sankar, S.; Chandrasekaran, K. Renewable Integrated UAPF Fed Microgrid System for Power Quality Enhancement and Effective Power Flow Management. Int. J. Electr. Power Energy Syst. 2021, 133, 107301. [Google Scholar] [CrossRef]
- Ding, Y. Analysis of Operation and Maintenance of Power Distribution Network Management Technology under the Background of Big Data Era. In Advances in Intelligent Systems and Computing; Springer: Berlin/Heidelberg, Germany, 2020; Volume 1117. [Google Scholar]
- Jasiński, M.; Sikorski, T.; Borkowski, K. Clustering as a Tool to Support the Assessment of Power Quality in Electrical Power Networks with Distributed Generation in the Mining Industry. Electr. Power Syst. Res. 2019, 166, 52–60. [Google Scholar] [CrossRef]
- Nair, D.R.; Nair, M.G.; Thakur, T. A Smart Microgrid System with Artificial Intelligence for Power-Sharing and Power Quality Improvement. Energies 2022, 15, 5409. [Google Scholar] [CrossRef]
- Guo, X.-H.; Chang, C.-W.; Chang-Chien, L.-R. Digital Implementation of Harmonic and Unbalanced Load Compensation for Voltage Source Inverter to Operate in Grid Forming Microgrid. Electronics 2022, 11, 886. [Google Scholar] [CrossRef]
- Moreno Escobar, J.J.; Morales Matamoros, O.; Tejeida Padilla, R.; Lina Reyes, I.; Quintana Espinosa, H. A Comprehensive Review on Smart Grids: Challenges and Opportunities. Sensors 2021, 21, 6978. [Google Scholar] [PubMed]
- Jasiński, M. Combined Correlation and Cluster Analysis for Long-Term Power Quality Data from Virtual Power Plant. Electronics 2021, 10, 641. [Google Scholar] [CrossRef]
- Jasinski, M.; Martirano, L.; Najafi, A.; Homaee, O.; Leonowicz, Z.; Kermani, M. Microgrid Working Conditions Identification Based on Cluster Analysis—A Case Study From Lambda Microgrid. IEEE Access 2022, 10, 70971–70979. [Google Scholar] [CrossRef]
- Choudhury, S. Review of Energy Storage System Technologies Integration to Microgrid: Types, Control Strategies, Issues, and Future Prospects. J. Energy Storage 2022, 48, 103966. [Google Scholar] [CrossRef]
- Tembo, G. Overview of the Microgrid Concept and Its Hierarchical Control Architecture. Int. J. Eng. Res. Technol. 2016, 5, 1–6. [Google Scholar]
- Marchand, S.; Monsalve, C.; Reimann, T.; Heckmann, W.; Ungerland, J.; Lauer, H.; Ruhe, S.; Krauß, C. Microgrid Systems: Towards a Technical Performance Assessment Frame. Energies 2021, 14, 2161. [Google Scholar] [CrossRef]
- Zia, M.F.; Elbouchikhi, E.; Benbouzid, M. Microgrids Energy Management Systems: A Critical Review on Methods, Solutions, and Prospects. Appl. Energy 2018, 222, 1033–1055. [Google Scholar] [CrossRef]
- Vanashi, H.K.; Mohammadi, F.D.; Verma, V.; Solanki, J.; Solanki, S.K. Hierarchical Multi-Agent Based Frequency and Voltage Control for a Microgrid Power System. Int. J. Electr. Power Energy Syst. 2022, 135, 107535. [Google Scholar] [CrossRef]
- Yoldaş, Y.; Önen, A.; Muyeen, S.M.; Vasilakos, A.V.; Alan, İ. Enhancing Smart Grid with Microgrids: Challenges and Opportunities. Renew. Sustain. Energy Rev. 2017, 72, 205–214. [Google Scholar] [CrossRef]
- Nasser, N.; Fazeli, M. Buffered-Microgrid Structure for Future Power Networks; A Seamless Microgrid Control. IEEE Trans. Smart Grid 2021, 12, 131–140. [Google Scholar] [CrossRef]
- Zhou, Y.; Ngai-Man Ho, C. A Review on Microgrid Architectures and Control Methods. In Proceedings of the 2016 IEEE 8th International Power Electronics and Motion Control Conference, IPEMC-ECCE Asia 2016, Hefei, China, 22–26 May 2016. [Google Scholar]
- Rajesh, K.S.; Dash, S.S.; Rajagopal, R.; Sridhar, R. A Review on Control of Ac Microgrid. Renew. Sustain. Energy Rev. 2017, 71, 814–819. [Google Scholar] [CrossRef]
- Sarangi, S.; Sahu, B.K.; Rout, P.K. Review of Distributed Generator Integrated AC Microgrid Protection: Issues, Strategies, and Future Trends. Int. J. Energy Res. 2021, 45, 14117–14144. [Google Scholar] [CrossRef]
- Al-Ismail, F.S. DC Microgrid Planning, Operation, and Control: A Comprehensive Review. IEEE Access 2021, 9, 36154–36172. [Google Scholar] [CrossRef]
- Chandra, A.; Singh, G.K.; Pant, V. Protection Techniques for DC Microgrid—A Review. Electr. Power Syst. Res. 2020, 187, 106439. [Google Scholar] [CrossRef]
- Mariscotti, A. Power Quality Phenomena, Standards, and Proposed Metrics for DC Grids. Energies 2021, 14, 6453. [Google Scholar] [CrossRef]
- Sahoo, S.K.; Sinha, A.K.; Kishore, N.K. Control Techniques in AC, DC, and Hybrid AC-DC Microgrid: A Review. IEEE J. Emerg. Sel. Top. Power Electron. 2018, 6, 738–759. [Google Scholar] [CrossRef]
- Ahmed, M.; Meegahapola, L.; Vahidnia, A.; Datta, M. Stability and Control Aspects of Microgrid Architectures-A Comprehensive Review. IEEE Access 2020, 8, 144730–144766. [Google Scholar] [CrossRef]
- Patrao, I.; Figueres, E.; Garcerá, G.; González-Medina, R. Microgrid Architectures for Low Voltage Distributed Generation. Renew. Sustain. Energy 2015, 43, 415–424. [Google Scholar] [CrossRef]
- Sahoo, B.; Routray, S.K.; Rout, P.K. AC, DC, and Hybrid Control Strategies for Smart Microgrid Application: A Review. Int. Trans. Electr. Energy Syst. 2021, 31, e12683. [Google Scholar] [CrossRef]
- Astriani, Y.; Shafiullah, G.M.; Anda, M.; Hilal, H. Techno-Economic Evaluation of Utilizing a Small-Scale Microgrid. Energy Procedia 2019, 158, 3131–3137. [Google Scholar] [CrossRef]
- Chandak, S.; Rout, P.K. The Implementation Framework of a Microgrid: A Review. Int. J. Energy Res. 2021, 45, 3523–3547. [Google Scholar] [CrossRef]
- Alayi, R.; Zishan, F.; Mohkam, M.; Hoseinzadeh, S.; Memon, S.; Garcia, D.A. A Sustainable Energy Distribution Configuration for Microgrids Integrated to the National Grid Using Back-to-Back Converters in a Renewable Power System. Electronics 2021, 10, 1826. [Google Scholar] [CrossRef]
- Iweh, C.D.; Gyamfi, S.; Tanyi, E.; Effah-Donyina, E. Distributed Generation and Renewable Energy Integration into the Grid: Prerequisites, Push Factors, Practical Options, Issues and Merits. Energies 2021, 14, 5375. [Google Scholar] [CrossRef]
- Chen, S.; Zhang, J.; Wang, L.; Zhang, H.; Li, L. Evaluation of Power Quality and Reliability of Distributed Generation in Smart Grid. In Proceedings of the IOP Conference Series: Earth and Environmental Science, Jakarta, Indonesia, 25–26 September 2021; Volume 632. [Google Scholar]
- Dragicevic, T.; Vazquez, S.; Wheeler, P. Advanced Control Methods for Power Converters in Distributed Generation Systems and Microgrids. IEEE Trans. Ind. Electron. 2019, 66, 8866–8869. [Google Scholar] [CrossRef] [Green Version]
- Martirano, L.; Jasinski, M.; Najafi, A.; Cocira, V.; Leonowicz, Z. Integration of Supervision and Monitoring Systems of Microgrids—A Case Study from Lambda Microgrid for Correlation Analysis. In Proceedings of the 2021 IEEE International Conference on Environment and Electrical Engineering and 2021 IEEE Industrial and Commercial Power Systems Europe (EEEIC/I&CPS Europe), Bari, Italy, 7–10 September 2021; pp. 1–4. [Google Scholar]
- Liao, J.; Zhou, N.; Wang, Q.; Li, C.; Yang, J. Definition and Correlation Analysis of Power Quality Index of DC Distribution Network. Zhongguo Dianji Gongcheng Xuebao/Proc. Chin. Soc. Electr. Eng. 2018, 38, 6847–6860. [Google Scholar] [CrossRef]
- Silva, E.N.M.; Rodrigues, A.B.; da Guia Da Silva, M. Stochastic Assessment of the Impact of Photovoltaic Distributed Generation on the Power Quality Indices of Distribution Networks. Electr. Power Syst. Res. 2016, 135, 59–67. [Google Scholar] [CrossRef]
- Shi, H.; Zhuo, F.; Yi, H.; Geng, Z. Control Strategy for Microgrid under Three-Phase Unbalance Condition. J. Mod. Power Syst. Clean Energy 2016, 4, 94–102. [Google Scholar] [CrossRef] [Green Version]
- Liu, B.; Zhao, X.; Liu, Y.; Zhu, Y.; Chen, J. Control Strategy of Clustered Micro-Grids for Grid Voltage Unbalance Compensation without Communications. IET Gener. Transm. Distrib. 2020, 14, 4410–4415. [Google Scholar] [CrossRef]
- Arbab-Zavar, B.; Palacios-Garcia, E.J.; Vasquez, J.C.; Guerrero, J.M. Smart Inverters for Microgrid Applications: A Review. Energies 2019, 12, 840. [Google Scholar] [CrossRef] [Green Version]
- Golkhandan, N.H.; Ali Chamanian, M.; Tahami, F. A New Control Method for Elimination of Current THD under Extremely Polluted Grid Conditions Applied on a Three Phase PWM Rectifier. In Proceedings of the INTELEC, International Telecommunications Energy Conference (Proceedings), Turino, Italy, 7–11 October 2018. [Google Scholar]
- Li, G.; Zhang, X. Comparison between Two Probabilistic Load Flow Methods for Reliability Assessment. In Proceedings of the 2009 IEEE Power Energy Society General Meeting, Calgary, AB, Canada, 26–30 July 2009; pp. 1–7. [Google Scholar]
- Li, Y.; Nejabatkhah, F. Overview of Control, Integration and Energy Management of Microgrids. J. Mod. Power Syst. Clean Energy 2014, 2, 212–222. [Google Scholar] [CrossRef] [Green Version]
- Sakar, S.; Balci, M.E.; Abdel Aleem, S.H.E.; Zobaa, A.F. Integration of Large-Scale PV Plants in Non-Sinusoidal Environments: Considerations on Hosting Capacity and Harmonic Distortion Limits. Renew. Sustain. Energy Rev. 2018, 82, 176–186. [Google Scholar]
- Zhang, M.; Li, Y.; Liu, F.; Li, W.; Peng, Y.; Wu, W.; Cao, Y. Cooperative Operation of DG Inverters and a RIHAF for Power Quality Improvement in an Integrated Transformer-Structured Grid-Connected Microgrid. IEEE Trans. Ind. Appl. 2019, 55, 1157–1170. [Google Scholar] [CrossRef]
- Pourarab, M.; Meyer, J.; Stiegler, R. Assessment of Harmonic Contribution of a Photovoltaic Installation Based on Field Measurements. Renew. Energy Power Qual. J. 2017, 1, 865–870. [Google Scholar] [CrossRef]
- Wang, N.; Zheng, S.; Gao, W. Microgrid Harmonic Mitigation Strategy Based on the Optimal Allocation of Active Power and Harmonic Mitigation Capacities of Multi-Functional Grid-Connected Inverters. Energies 2022, 15, 6109. [Google Scholar] [CrossRef]
- Michalec, Ł.; Jasiński, M.; Sikorski, T.; Leonowicz, Z.; Jasiński, Ł.; Suresh, V. Impact of Harmonic Currents of Nonlinear Loads on Power Quality of a Low Voltage Network—Review and Case Study. Energies 2021, 14, 3665. [Google Scholar] [CrossRef]
- Javadi, M.; Gong, Y.; Chung, C.Y. Frequency Stability Constrained Microgrid Scheduling Considering Seamless Islanding. IEEE Trans. Power Syst. 2022, 37, 306–316. [Google Scholar] [CrossRef]
- Iqbal, A.; Ayoub, A.; Waqar, A.; Ul-Haq, A.; Zahid, M.; Haider, S. Voltage Stability Enhancement in Grid-Connected Microgrid Using Enhanced Dynamic Voltage Restorer (EDVR). AIMS Energy 2021, 9, 150–177. [Google Scholar] [CrossRef]
- Ortega, R.; García, V.H.; García-García, A.L.; Rodriguez, J.J.; Vásquez, V.; Sosa-Savedra, J.C. Modeling and Application of Controllers for a Photovoltaic Inverter for Operation in a Microgrid. Sustainability 2021, 13, 5115. [Google Scholar] [CrossRef]
- Howlader, A.M.; Sadoyama, S.; Roose, L.R.; Chen, Y. Active Power Control to Mitigate Voltage and Frequency Deviations for the Smart Grid Using Smart PV Inverters. Appl. Energy 2020, 258, 114000. [Google Scholar] [CrossRef]
- Liu, Z.; Xu, X.; Abdelsalam, H.A.; Makram, E. Power System Harmonics Study for Unbalanced Microgrid System with PV Sources and Nonlinear Loads. J. Power Energy Eng. 2015, 3, 43–55. [Google Scholar] [CrossRef] [Green Version]
- Sun, X.; Lei, W.; Dai, Y.; Yin, Y.; Liu, Q. Optimization Configuration of Grid-Connected Inverters to Suppress Harmonic Amplification in a Microgrid. Energies 2022, 15, 4989. [Google Scholar] [CrossRef]
- IEEE Std 519-2014 (Revision of IEEE Std 519-1992); IEEE Recommended Practice and Requirements for Harmonic Control in Electric Power Systems. IEEE: Piscataway, NJ, USA, 2014; Volume 2014.
- Homaee, O.; Najafi, A.; Jasinski, M.; Tsaousoglou, G.; Leonowicz, Z. Coordination of Neighboring Active Distribution Networks under Electricity Price Uncertainty Using Distributed Robust Bi-Level Programming. IEEE Trans. Sustain. Energy 2022, preonline. [Google Scholar] [CrossRef]
- EN 50160; Voltage Characteristics of Electricity Supplied by Public Distribution Network. Orgalim: Brussels, Belgium, 2015.
- Jasinski, M.; Sikorski, T.; Kaczorowska, D.; Kostyla, P.; Leonowicz, Z.; Rezmer, J.; Janik, P.; Bejmert, D. Global Power Quality Index Application in Virtual Power Plant. In Proceedings of the 2020 12th International Conference and Exhibition on Electrical Power Quality and Utilisation-(EPQU), Cracow, Poland, 14–15 September 2020; pp. 1–6. [Google Scholar]
- European Standard EN61000-4-30; Electromagnetic Compatibility (EMC)—Part 4–30: Testing and Measurement Techniques—Power Quality Measurement Methods. International Electrotechnical Commission: Geneva, Switzerland, 2015.


| Parameter | Symbol | Limit |
|---|---|---|
| Power frequency | f | ±1% (49.5 ÷ 50.5) Hz for 99.5% of the measurement data set |
| Supply voltage | U | ±10% Uref for 99% of the measurement data set |
| −15%/+10% Uref for 100% of measurement data set | ||
| Flicker severity | Plt | 1.0 for 95% of the measurement data set |
| Voltage unbalance | ku2 | 2% for 95% of the measurement data set |
| Harmonics | THDu | 8% for 95% of the measurement data set |
| Parameter | Symbol | Period 1 | Period 2 |
|---|---|---|---|
| Power frequency | f |  | |
| Supply voltage | U | | |
| Flicker severity | Plt | | |
| Voltage unbalance | ku2 | | |
| Harmonics h2–h40 | THDuU | | |
| Parameter | Period 1 | Period 2 | ||||
|---|---|---|---|---|---|---|
| Cluster 1 | Cluster 2 | Cluster 3 | Cluster 1 | Cluster 2 | Cluster 3 | |
| Min | 49.93 | 49.95 | 49.96 | 49.91 | 49.93 | 49.93 |
| 1st Qu | 49.99 | 49.99 | 49.96 | 49.99 | 49.99 | 49.99 |
| Median | 50.00 | 50.00 | 50.00 | 50.00 | 50.00 | 50.00 |
| Mean | 50.00 | 50.00 | 50.00 | 50.00 | 50.00 | 50.00 |
| 3rd Qu | 50.01 | 50.01 | 50.01 | 50.01 | 50.01 | 50.01 |
| Max | 50.07 | 50.06 | 50.06 | 50.06 | 50.07 | 50.04 |
| St. Dev. | 0.016 | 0.013 | 0.013 | 0.018 | 0.018 | 0.017 |
| Clusters | 1 | 2 | 3 |
|---|---|---|---|
| W= | 2,525,096 | 1,800,456 | 240,385 |
| p-value | 0.001419 | 0.07374 | 0.0004081 |
| Parameter | Period 1 | Period 2 | ||||
|---|---|---|---|---|---|---|
| Cluster 1 | Cluster 2 | Cluster 3 | Cluster 1 | Cluster 2 | Cluster 3 | |
| Min | 226.4 | 227.9 | 228.0 | 227.0 | 228.3 | 229.0 |
| 1st Qu | 229.1 | 229.8 | 229.7 | 229.5 | 230.2 | 231.0 |
| Median | 229.7 | 230.6 | 230.3 | 230.2 | 230.9 | 231.6 |
| Mean | 229.8 | 230.5 | 230.3 | 230.3 | 230.9 | 231.6 |
| 3rd Qu | 230.6 | 231.2 | 231.0 | 231.1 | 231.6 | 232.2 |
| Max | 233.5 | 234.2 | 233.2 | 233.7 | 233.4 | 233.6 |
| St. Dev. | 1.20 | 0.97 | 0.96 | 1.22 | 0.96 | 0.96 |
| Parameter | Period 1 | Period 2 | ||||
|---|---|---|---|---|---|---|
| Cluster 1 | Cluster 2 | Cluster 3 | Cluster 1 | Cluster 2 | Cluster 3 | |
| Min | 226.2 | 227.6 | 227.9 | 226.4 | 227.9 | 228.4 |
| 1st Qu | 228.7 | 229.6 | 229.4 | 228.9 | 229.5 | 230.3 |
| Median | 229.4 | 230.3 | 230.1 | 229.5 | 230.2 | 231.0 |
| Mean | 229.5 | 230.3 | 230.2 | 229.6 | 230.2 | 231.0 |
| 3rd Qu | 230.2 | 231.0 | 230.8 | 230.3 | 230.9 | 231.7 |
| Max | 233.0 | 234.0 | 233.0 | 232.9 | 232.5 | 233.2 |
| St. Dev. | 1.21 | 0.96 | 0.94 | 1.18 | 0.95 | 1.01 |
| Parameter | Period 1 | Period 2 | ||||
|---|---|---|---|---|---|---|
| Cluster 1 | Cluster 2 | Cluster 3 | Cluster 1 | Cluster 2 | Cluster 3 | |
| Min | 226.9 | 228.6 | 228.7 | 227.0 | 228.4 | 229.2 |
| 1st Qu | 229.6 | 230.4 | 230.2 | 229.5 | 230.1 | 230.9 |
| Median | 230.2 | 231.1 | 230.9 | 230.1 | 230.8 | 231.6 |
| Mean | 230.3 | 231.1 | 230.9 | 230.2 | 230.8 | 231.6 |
| 3rd Qu | 231.0 | 231.8 | 231.5 | 230.9 | 231.6 | 231.2 |
| Max | 233.7 | 234.5 | 233.7 | 233.3 | 233.1 | 233.6 |
| St. Dev. | 1.19 | 0.93 | 0.96 | 1.18 | 0.93 | 0.97 |
| Phase | Period | I | II | ||||
|---|---|---|---|---|---|---|---|
| Cluster | 1 | 2 | 3 | 1 | 2 | 3 | |
| L1 | A= | 10.495 | 1.6372 | 0.4493 | 3.8034 | 5.8403 | 2.0735 |
| p-value | <2.2 × 10⁻¹⁶ | 0.0003332 | 0.2762 | 1.76 × 10−09 | 2.243 × 10⁻¹⁴ | 2.83 × 10−05 | |
| L2 | A= | 10.899 | 1.37 | 0.70164 | 6.3382 | 5.0331 | 1.2789 |
| p-value | <2.2 × 10⁻¹⁶ | 0.00151 | 0.0667 | 1.48 × 10⁻¹⁵ | 1.915 × 10⁻¹² | 0.00252 | |
| L3 | A= | 12.048 | 1.7583 | 0.85627 | 5.8126 | 5.1961 | 1.637 |
| p-value | <2.2 × 10⁻¹⁶ | 0.000168 | 0.02766 | 2.622 × 10⁻¹⁴ | 7.787 × 10⁻¹³ | 0.000332 | |
| Phase | Clusters | 1 | 2 | 3 |
|---|---|---|---|---|
| L1 | W= | 2,075,186 | 1,394,365 | 100,515 |
| p-value | <2.2 × 10⁻¹⁶ | <2.2 × 10⁻¹⁶ | <2.2 × 10⁻¹⁶ | |
| L2 | W= | 2,459,191 | 1,825,554 | 146,966 |
| p-value | 1.715 × 10−06 | 0.9946 | <2.2 × 10⁻¹⁶ | |
| L3 | W= | 2,807,853 | 2,019,790 | 166,338 |
| p-value | 0.9988 | 1 | <2.2 × 10⁻¹⁶ |
| Parameter | Period 1 | Period 2 | ||||
|---|---|---|---|---|---|---|
| Cluster 1 | Cluster 2 | Cluster 3 | Cluster 1 | Cluster 2 | Cluster 3 | |
| Min | 0.0485 | 0.0465 | 0.0567 | 0.0399 | 0.0480 | 0.0518 |
| 1st Qu | 0.1711 | 0.1508 | 0.1365 | 0.1755 | 0.1600 | 0.1506 |
| Median | 0.2712 | 0.2598 | 0.2316 | 0.2831 | 0.2665 | 0.2535 |
| Mean | 0.2680 | 0.2598 | 0.2434 | 0.2798 | 0.2634 | 0.2618 |
| 3rd Qu | 0.3507 | 0.3479 | 0.3323 | 0.3676 | 0.3491 | 0.3533 |
| Max | 0.9148 | 1.2137 | 0.7278 | 1.1461 | 0.9753 | 1.6727 |
| St. Dev. | 0.1167 | 0.1258 | 0.1209 | 0.1256 | 0.1237 | 0.1400 |
| Parameter | Period 1 | Period 2 | ||||
|---|---|---|---|---|---|---|
| Cluster 1 | Cluster 2 | Cluster 3 | Cluster 1 | Cluster 2 | Cluster 3 | |
| Min | 0.0495 | 0.0486 | 0.0566 | 0.0434 | 0.0499 | 0.0532 |
| 1st Qu | 0.1746 | 0.1541 | 0.1434 | 0.1762 | 0.1610 | 0.1557 |
| Median | 0.2738 | 0.2621 | 0.2393 | 0.2859 | 0.2682 | 0.2550 |
| Mean | 0.2736 | 0.2631 | 0.2464 | 0.2817 | 0.2648 | 0.2647 |
| 3rd Qu | 0.3540 | 0.3499 | 0.3334 | 0.3705 | 0.3506 | 0.3562 |
| Max | 1.8105 | 1.2550 | 0.7918 | 0.9101 | 1.4730 | 1.3985 |
| St. Dev. | 0.1250 | 0.1263 | 0.1187 | 0.1251 | 0.1270 | 0.1377 |
| Parameter | Period 1 | Period 2 | ||||
|---|---|---|---|---|---|---|
| Cluster 1 | Cluster 2 | Cluster 3 | Cluster 1 | Cluster 2 | Cluster 3 | |
| Min | 0.0498 | 0.0480 | 0.0587 | 0.0416 | 0.0478 | 0.0515 |
| 1st Qu | 0.1685 | 0.1499 | 0.1357 | 0.1746 | 0.1581 | 0.1533 |
| Median | 0.2770 | 0.2621 | 0.2375 | 0.2928 | 0.2687 | 0.2662 |
| Mean | 0.2717 | 0.2587 | 0.2435 | 0.2833 | 0.2659 | 0.2701 |
| 3rd Qu | 0.3538 | 0.3462 | 0.3364 | 0.3738 | 0.3547 | 0.3617 |
| Max | 2.1364 | 1.2275 | 0.7420 | 1.4009 | 2.2206 | 2.1247 |
| St. Dev. | 0.1254 | 0.1239 | 0.1212 | 0.1275 | 0.1328 | 0.1587 |
| Phase | Clusters | 1 | 2 | 3 |
|---|---|---|---|---|
| L1 | W= | 2,532,889 | 1,703,690 | 250,796 |
| p-value | 0.00254 | 0.2521 | 0.02278 | |
| L2 | W= | 2,556,778 | 1,722,794 | 251,462 |
| p-value | 0.01272 | 0.5712 | 0.02804 | |
| L3 | W= | 2,520,772 | 1,685,785 | 244,808 |
| p-value | 0.001018 | 0.09141 | 0.002701 |
| Parameter | Period 1 | Period 2 | ||||
|---|---|---|---|---|---|---|
| Cluster 1 | Cluster 2 | Cluster 3 | Cluster 1 | Cluster 2 | Cluster 3 | |
| Min | 0.140 | 0.111 | 0.139 | 0.049 | 0.042 | 0.069 |
| 1st Qu | 0.216 | 0.204 | 0.238 | 0.130 | 0.124 | 0.142 |
| Median | 0.247 | 0.241 | 0.274 | 0.152 | 0.148 | 0.171 |
| Mean | 0.249 | 0.247 | 0.275 | 0.152 | 0.148 | 0.172 |
| 3rd Qu | 0.279 | 0.284 | 0.308 | 0.172 | 0.173 | 0.198 |
| Max | 0.386 | 0.425 | 0.435 | 0.248 | 0.263 | 0.307 |
| St. Dev. | 0.044 | 0.056 | 0.053 | 0.029 | 0.036 | 0.040 |
| Clusters | 1 | 2 | 3 |
|---|---|---|---|
| W= | 5,205,856 | 3,276,778 | 507,850 |
| p-value | <2.2 × 10⁻¹⁶ | <2.2 × 10⁻¹⁶ | <2.2 × 10⁻¹⁶ |
| Data | Period 1 | Period 2 | ||||
|---|---|---|---|---|---|---|
| Cluster 1 | Cluster 2 | Cluster 3 | Cluster 1 | Cluster 2 | Cluster 3 | |
| D | 0.027513 | 0.035645 | 0.037319 | 0.036627 | 0.036395 | 0.043335 |
| p-value | 0.06366 | 0.01093 | 0.421 | 0.003702 | 0.0222 | 0.05234 |
| Parameter | Period 1 | Period 2 | ||||
|---|---|---|---|---|---|---|
| Cluster 1 | Cluster 2 | Cluster 3 | Cluster 1 | Cluster 2 | Cluster 3 | |
| a = Shape1 | 24.01255 | 14.72601 | 19.16599 | 21.48934 | 13.36818 | 14.73362 |
| b = Shape2 | 72.23202 | 44.91723 | 50.66585 | 119.99269 | 76.79445 | 71.17371 |
| Parameter | Period 1 | Period 2 | ||||
|---|---|---|---|---|---|---|
| Cluster 1 | Cluster 2 | Cluster 3 | Cluster 1 | Cluster 2 | Cluster 3 | |
| Min | 0.9641 | 1.102 | 1.090 | 1.168 | 1.101 | 1.124 |
| 1st Qu | 1.3802 | 1.336 | 1.326 | 1.535 | 1.392 | 1.391 |
| Median | 1.5236 | 1.446 | 1.388 | 1.672 | 1.477 | 1.447 |
| Mean | 1.5343 | 1.503 | 1.481 | 1.650 | 1.506 | 1.453 |
| 3rd Qu | 1.6556 | 1.627 | 1.515 | 1.765 | 1.604 | 1.514 |
| Max | 2.2258 | 2.453 | 2.329 | 2.131 | 1.979 | 1.892 |
| St. Dev. | 0.2197 | 0.2378 | 0.2676 | 0.1534 | 0.1683 | 0.1051 |
| Parameter | Period 1 | Period 2 | ||||
|---|---|---|---|---|---|---|
| Cluster 1 | Cluster 2 | Cluster 3 | Cluster 1 | Cluster 2 | Cluster 3 | |
| Min | 1.059 | 1.108 | 1.139 | 1.267 | 1.220 | 1.244 |
| 1st Qu | 1.438 | 1.379 | 1.331 | 1.599 | 1.455 | 1.470 |
| Median | 1.593 | 1.496 | 1.424 | 1.722 | 1.531 | 1.522 |
| Mean | 1.589 | 1.555 | 1.511 | 1.704 | 1.561 | 1.529 |
| 3rd Qu | 1.721 | 1.685 | 1.558 | 1.809 | 1.665 | 1.580 |
| Max | 2.217 | 2.545 | 2.344 | 2.200 | 1.990 | 1.897 |
| St. Dev. | 0.2181 | 0.2441 | 0.2808 | 0.1503 | 0.1522 | 0.0937 |
| Parameter | Period 1 | Period 2 | ||||
|---|---|---|---|---|---|---|
| Cluster 1 | Cluster 2 | Cluster 3 | Cluster 1 | Cluster 2 | Cluster 3 | |
| Min | 0.9732 | 1.057 | 1.141 | 1.216 | 1.176 | 1.244 |
| 1st Qu | 1.3760 | 1.353 | 1.339 | 1.507 | 1.422 | 1.470 |
| Median | 1.5356 | 1.486 | 1.411 | 1.654 | 1.526 | 1.522 |
| Mean | 1.5363 | 1.544 | 1.504 | 1.641 | 1.550 | 1.529 |
| 3rd Qu | 1.6641 | 1.687 | 1.526 | 1.770 | 1.665 | 1.580 |
| Max | 2.1901 | 2.555 | 2.358 | 2.164 | 2.088 | 1.897 |
| Phase | Clusters | 1 | 2 | 3 |
|---|---|---|---|---|
| L1 | W = | 1,668,852 | 1,584,933 | 219,530 |
| p-value | <2.2 × 10⁻¹⁶ | 2.086 × 10−06 | 1.437 × 10−09 | |
| L2 | W = | 1,715,456 | 1,538,138 | 174,365 |
| p-value | <2.2 × 10⁻¹⁶ | 7.122 × 10⁻¹⁰ | <2.2 × 10⁻¹⁶ | |
| L3 | W = | 1,846,383 | 1,571,882 | 160,227 |
| p-value | <2.2 × 10⁻¹⁶ | 2.739 × 10−07 | <2.2 × 10⁻¹⁶ |
Publisher’s Note: MDPI stays neutral with regard to jurisdictional claims in published maps and institutional affiliations. |
© 2022 by the authors. Licensee MDPI, Basel, Switzerland. This article is an open access article distributed under the terms and conditions of the Creative Commons Attribution (CC BY) license (https://creativecommons.org/licenses/by/4.0/).
Share and Cite
Ostrowska, A.; Michalec, Ł.; Skarupski, M.; Jasiński, M.; Sikorski, T.; Kostyła, P.; Lis, R.; Mudrak, G.; Rodziewicz, T. Power Quality Assessment in a Real Microgrid-Statistical Assessment of Different Long-Term Working Conditions. Energies 2022, 15, 8089. https://doi.org/10.3390/en15218089
Ostrowska A, Michalec Ł, Skarupski M, Jasiński M, Sikorski T, Kostyła P, Lis R, Mudrak G, Rodziewicz T. Power Quality Assessment in a Real Microgrid-Statistical Assessment of Different Long-Term Working Conditions. Energies. 2022; 15(21):8089. https://doi.org/10.3390/en15218089
Chicago/Turabian StyleOstrowska, Anna, Łukasz Michalec, Marek Skarupski, Michał Jasiński, Tomasz Sikorski, Paweł Kostyła, Robert Lis, Grzegorz Mudrak, and Tomasz Rodziewicz. 2022. "Power Quality Assessment in a Real Microgrid-Statistical Assessment of Different Long-Term Working Conditions" Energies 15, no. 21: 8089. https://doi.org/10.3390/en15218089
APA StyleOstrowska, A., Michalec, Ł., Skarupski, M., Jasiński, M., Sikorski, T., Kostyła, P., Lis, R., Mudrak, G., & Rodziewicz, T. (2022). Power Quality Assessment in a Real Microgrid-Statistical Assessment of Different Long-Term Working Conditions. Energies, 15(21), 8089. https://doi.org/10.3390/en15218089