Review

The Impact of Soiling on PV Module Performance in Saudi Arabia

by
Hassan Z. Al Garni
Department of Electrical Engineering, Jubail Industrial College, Al Jubail 31961, Saudi Arabia
Energies 2022, 15(21), 8033; https://doi.org/10.3390/en15218033
Submission received: 2 October 2022 / Revised: 21 October 2022 / Accepted: 21 October 2022 / Published: 28 October 2022
(This article belongs to the Section A2: Solar Energy and Photovoltaic Systems)

Abstract

:
Solar photovoltaic (PV) deployment is rapidly expanding around the world. However, the soiling factor has an impact on its performance. Saudi Arabia has high solar irradiation and plans to diversify its energy mix for electricity generation by deploying more solar PV across the country. However, it is located in an arid and desert environment, making it a challenging project due to dust accumulation on solar modules. The soiling and PV performance in Saudi Arabia are examined in this paper. Furthermore, it highlights several mitigation techniques that can be used to maintain PV performance through preventive and restorative measures. Furthermore, this study looks into the size and characterization of dust in Saudi Arabia, as well as the entire life cycle of dust accumulation on PV modules. In this review study, the performance of solar PV systems is evaluated under soiling in different regions of Saudi Arabia. Depending on the local environment and other factors, the PV performance has been reduced by somewhere between 2% and 50%. A single sandstorm reduced the module power output by 20%. As revealed in Dhahran, the PV module was exposed to an outdoor environment and not cleaned for 6 months resulting in a power drop of more than 50%. It is strongly advised to clean PV panels once a month or fewer to maintain a high-performance system. However, in the event of a dust storm, it is advised to clean the system immediately to avoid a major decline in PV performance. The bi-facial PV solar panels technology associated with solar trackers and utilizing robotic cleaning systems have maximized the received solar irradiation and minimized the soiling loss efficiently. The most common elements found in dust particles are primarily derived from the natural desert. It has been noted that the composition and sizes of dust particles depend heavily on the location of the PV module. It is concluded that dust accumulation and cleaning costs are not a significant barrier to large-scale, cost-effective solar PV deployments in Saudi Arabia, particularly in the central region, which is considered a high-suitable region for utility-size PV plants due to many factors. The results of this study are essential for enlightening the PV engineering community, investors, and the research community about how soiling may affect regions with significant solar potential, such as Saudi Arabia, and what potential soiling mitigation strategies may be considered to maintain high-performance solar PV projects.

1. Introduction

Solar photovoltaic (PV) is growing at an extraordinary rate which brought the global total to approximately 942 GW, including both on-grid and off-grid capacity by the end of 2021 [1]. Solar PV growth continues to break records, with annual additions reaching 162 GW by 2022 as shown in Figure 1 [2].
Saudi Arabia is an oil-dependent country and relies entirely on fossil fuels to generate electricity. Thus, as a part of Saudi Arabia’s 2030 vision, the country is targeting to diversify the energy mix used in electricity generation and increase the share of renewable energy and natural gas to around 50% each by 2030 [3].
The motivation for this research is that Saudi Arabia plans to develop several solar PV projects to supply its existing energy portfolio with clean energy sources, primarily from solar PV. The deployment of solar PV across the country is associated with many challenges including the soiling impact. Several grid-connected solar PV farms have been developed or are under planning and development stages. For example, with an installed capacity of 1.5 GW, a grid-connected PV power plant in Sudair, Saudi Arabia’s central area, is considered to be one of the biggest solar PV facilities in the world and the largest of its kind in the country [4]. Around 185,000 households will be powered by it, and it will decrease 2.9 million tons of emissions annually. In 2019, a 300 MW solar PV project developed in Sakaka was connected to the grid as Saudi Arabia’s initial project utilizing renewable energy [5]. 91 MW solar farm is under construction in Layla, Riyadh province which is expected to be fully operational by 2024 [6]. Known as Faisaliah Solar Power Project, a giant PV plant of 2,600 MW installed capacity is proposed for the Makkah region and is being developed by the Saudi Ministry of Energy in phases [7]. Figure 2 highlights the status of solar PV projects in Saudi Arabia, including operational, under construction, and planned solar PV projects with their power capacities [4,5,7,8,9].
The intermittent nature of solar radiation complicates energy management, particularly in maintaining the production/consumption balance within an electrical grid [10,11]. Moreover, the output power of solar PV is influenced by various internal and external factors including the amount of solar irradiation [11,12,13,14,15], the type of PV technology [14,16,17,18] tilt angle [13,14,19,20], shading [21,22,23,24], ambient and module temperature [24,25,26,27,28,29,30] and dust accumulation [14,31,32,33,34,35,36,37,38].
In the case of Saudi Arabia, which is located in an arid and desert environment solar PV farms become very challenging projects due to dust accumulation on solar modules. Figure 3 illustrates the global distribution of ambient air pollution which can be greatly influenced by sand storms mostly in areas nearby deserts where PM2.5 refers to fine particulate matter with a diameter of 2.5 microns or less [39].
The objective of this study is to review the soiling and PV performance in Saudi Arabia. It highlights the soiling challenges in utility-scale PV projects, current solutions, and future perspectives in Saudi Arabia. The findings of this study are crucial for informing the research community, investors, and PV engineers on how soiling may influence countries with great solar potential, such as Saudi Arabia, and what potential soiling mitigation strategies might be taken into consideration.
  • The following are the primary contributions of this research study: it offers a critical review of the soiling impact on solar PV performance in arid and high solar irradiation regions such as Saudi Arabia for the first time.
  • The results and recommendations concluded from this study are essential for enlightening the PV engineering community, investors, and the research community about how soiling may affect regions with significant solar potential, such as Saudi Arabia.
  • It describes in detail various soiling mitigation techniques and highlights the benefits and drawbacks of each technique, as well as which one is best suited for maintaining high-performance solar PV projects in such a hot and arid country. Current solar PV projects in Saudi Arabia that have recently been implemented have been considered and discussed.
  • This study will encourage researchers to focus more on the need for energy diversification and to broaden research on the effect of dust on PV modules in developing countries like Saudi Arabia, which has a high potential for solar energy deployment but has got limited research on these topics to date.
The structure of this research study is as follows: The life cycle of dust deposition on solar panels is described in Section 2. Section 3 presents a detailed review of the soiling impact on solar PV in Saudi Arabia. It deals with soiling sources and the PV performance under soiling besides the dust particle size and composition in Saudi Arabia. In Section 4, several mitigation techniques along with their advantages and disadvantages are reported. Then, Section 5 discusses and investigates the implications of the research based on the findings. Finally, Section 6 draws meaningful conclusions from this study.

2. Dust Formation Life Cycle on PV

The definitions of dust vary depending on how the study is applied in the literature. In this study, dust is referred to as solid inorganic particles that are produced as a result of rock weathering. The dust particle size has a diameter smaller than 500 µm. Figure 4 depicts the entire soiling process initiated by dust generation, including dust particle transportation and dust deposition on PV panels, where some particles adhere and others rebound or are removed and resuspended.
In general, dust particles are generated from desert storms, industrial emissions, vehicle exhaustion, construction sites, volcano eruption, pollen, air pollution, plant material, and other anthropogenic sources [40].
Global dust originated from different regions in the world which is mainly from desert zones. Some of the major source regions are Arabian, and Saharan parts of North Africa, Peninsula Eastern and Western China, Central Asia, South America, and Australia. The atmospheric dust concentration of the Middle east is mainly from desert dust.
The phase of dust deposition on a PV surface depends on the particle matter and wind speed. Based on the transport mechanism, the deposition of particles can be categorized into three groups dry, wet, and shadow [41]. The dry mechanism took place when airborne particles migrated to the ground surface, whether on people, vegetation, animals, or other objects. Dry refers to the process, not the characteristics of the surface, that controls the transfer of particles to the surface. Wet deposition is the interaction of particles with atmospheric water. Shadow deposition is an intermediate mechanism between dry and wet which has been attributed to cloud or fog droplets [41].
Soiling is a major issue that can degrade the PV performance. In addition, there are many factors influencing dust settlement on PV modules including: site characteristic, dust properties, wind, temperature, humidity, tilt angle, surface orientation and PV surface property.
Electrostatic, van der Waals, and capillary forces all contribute to the adherence of dust to a PV surface. Electrostatic force results in an adhesive force when the particles are moist and close to one another. In the atmosphere, the dust particle hits each other and generates an electric charge that results in the accumulation of more dust on the PV panels [42,43].
Minor dry dust particles adhere over a dry PV surface due to the van der Waals force, which is considered the main force between a solid surface and a dry particle. In the dust, the soluble matter dissolves in the condensation droplets then during the daytime they will dry again and leaves a solid material bond between dust particles and the PV panel surface that could be hard to remove. Even in the absence of the cementation mechanism, the surface condensation causes capillary adhesion [44,45,46,47]. The adhesion forces (capillary, van der Waals, electrostatic, and gravitational) all exist almost everywhere, but the strength of their adhesion depends on the climate and the physical and chemical characteristics of the dust particles.

3. Soiling Impact on Solar PV in Saudi Arabia

Saudi Arabia, which occupies the majority of the Arabian Peninsula and spans an area of around 2 million km2, is situated in southeast Asia. Rahman et al. [48] studied the duration of sunshine and the yearly global horizontal irradiance (GHI) over 41 cities in Saudi Arabia. Results indicated that the yearly sunshine duration is 3248 h, while the GHI varies between 1.63 MWh/m2/year (at Tabuk, a northwestern region) and 2.56 MWh/m2/year (at Bisha, a southwestern region). Figure 5 shows the annual average of GHI for the long term obtained from the SolarGIS database [49]. The minimum yearly GHI is above the average GHI in several leading counties in solar PV. Additionally, the GHI and sunshine patterns follow the trend of energy demand. The most advantageous renewable energy source for Saudi Arabia is solar energy, particularly during the summer when electricity demand is at its highest and is mostly driven by air conditioning systems [12,50].

3.1. Soiling Generation Sources

Saudi Arabia is located in the Arabian Peninsula which is recognized as one of the major sources of dust generation worldwide [51,52,53]. Due to Saudi Arabia’s location, which falls inside the desert and arid areas whose precipitation rate does not surpass 50 mm, the country’s atmosphere is mostly impacted by desert dust. The sandy regions in Saudi Arabia are represented by the Empty Quarter (Rub’ Al Khali), Al-Dahna, and Al-Nofuth deserts, which spread in most provinces and cover more than 30% of the country [54,55]. The Empty Quarter, the largest desert on the Arabian Peninsula and one of the largest sand deserts in the world, dominates most of southern and southeast Saudi Arabia. It is regarded as the main local source of dust.
Other primary remote sources of dust in the country are the Iraqi Desert, for the northern and eastern parts, and the Saharan Desert, for the western region of Saudi Arabia. Furthermore, the sources of dust in the country are the eastern regions of Yemen, the eastern part of Syria, and the plateau of eastern Jordan [52,56]. Due to the poor vegetation cover, loosened soil, and lack of wind cohesiveness, sandstorms have increased. Regarding the seasons, the major spread of dust storms is observed during the spring [54,56] and summer seasons [52,55].
With 30 years of data, Labban and Butt [55] studied the relationship between dust storms and meteorological parameters in Saudi Arabia. Results showed that sand and dust storm events have the lowest correlation with precipitation and the highest correlation with wind speed and temperature. Ground station Qaisumah (318 events) and Ahsa (313 events), both in eastern Saudi Arabia, reported the largest number of sand storms per year. In contrast, the lowest number of annual sand storms (10 events) occurred in Alwejh and Alkhamis located in the western and southern regions, respectively, followed by Taif (12 events) located on the western side of Saudi Arabia. According to the seasonal analysis, Qaisumah (198 events) recorded the spring storm peak while Al Ahsa, which lies in the east, reported the summer (90 events) and winter (60 events) storm peaks. On the other side, the ground station in Gizan (51), which is situated South of Saudi Arabia, reports the autumn peak.

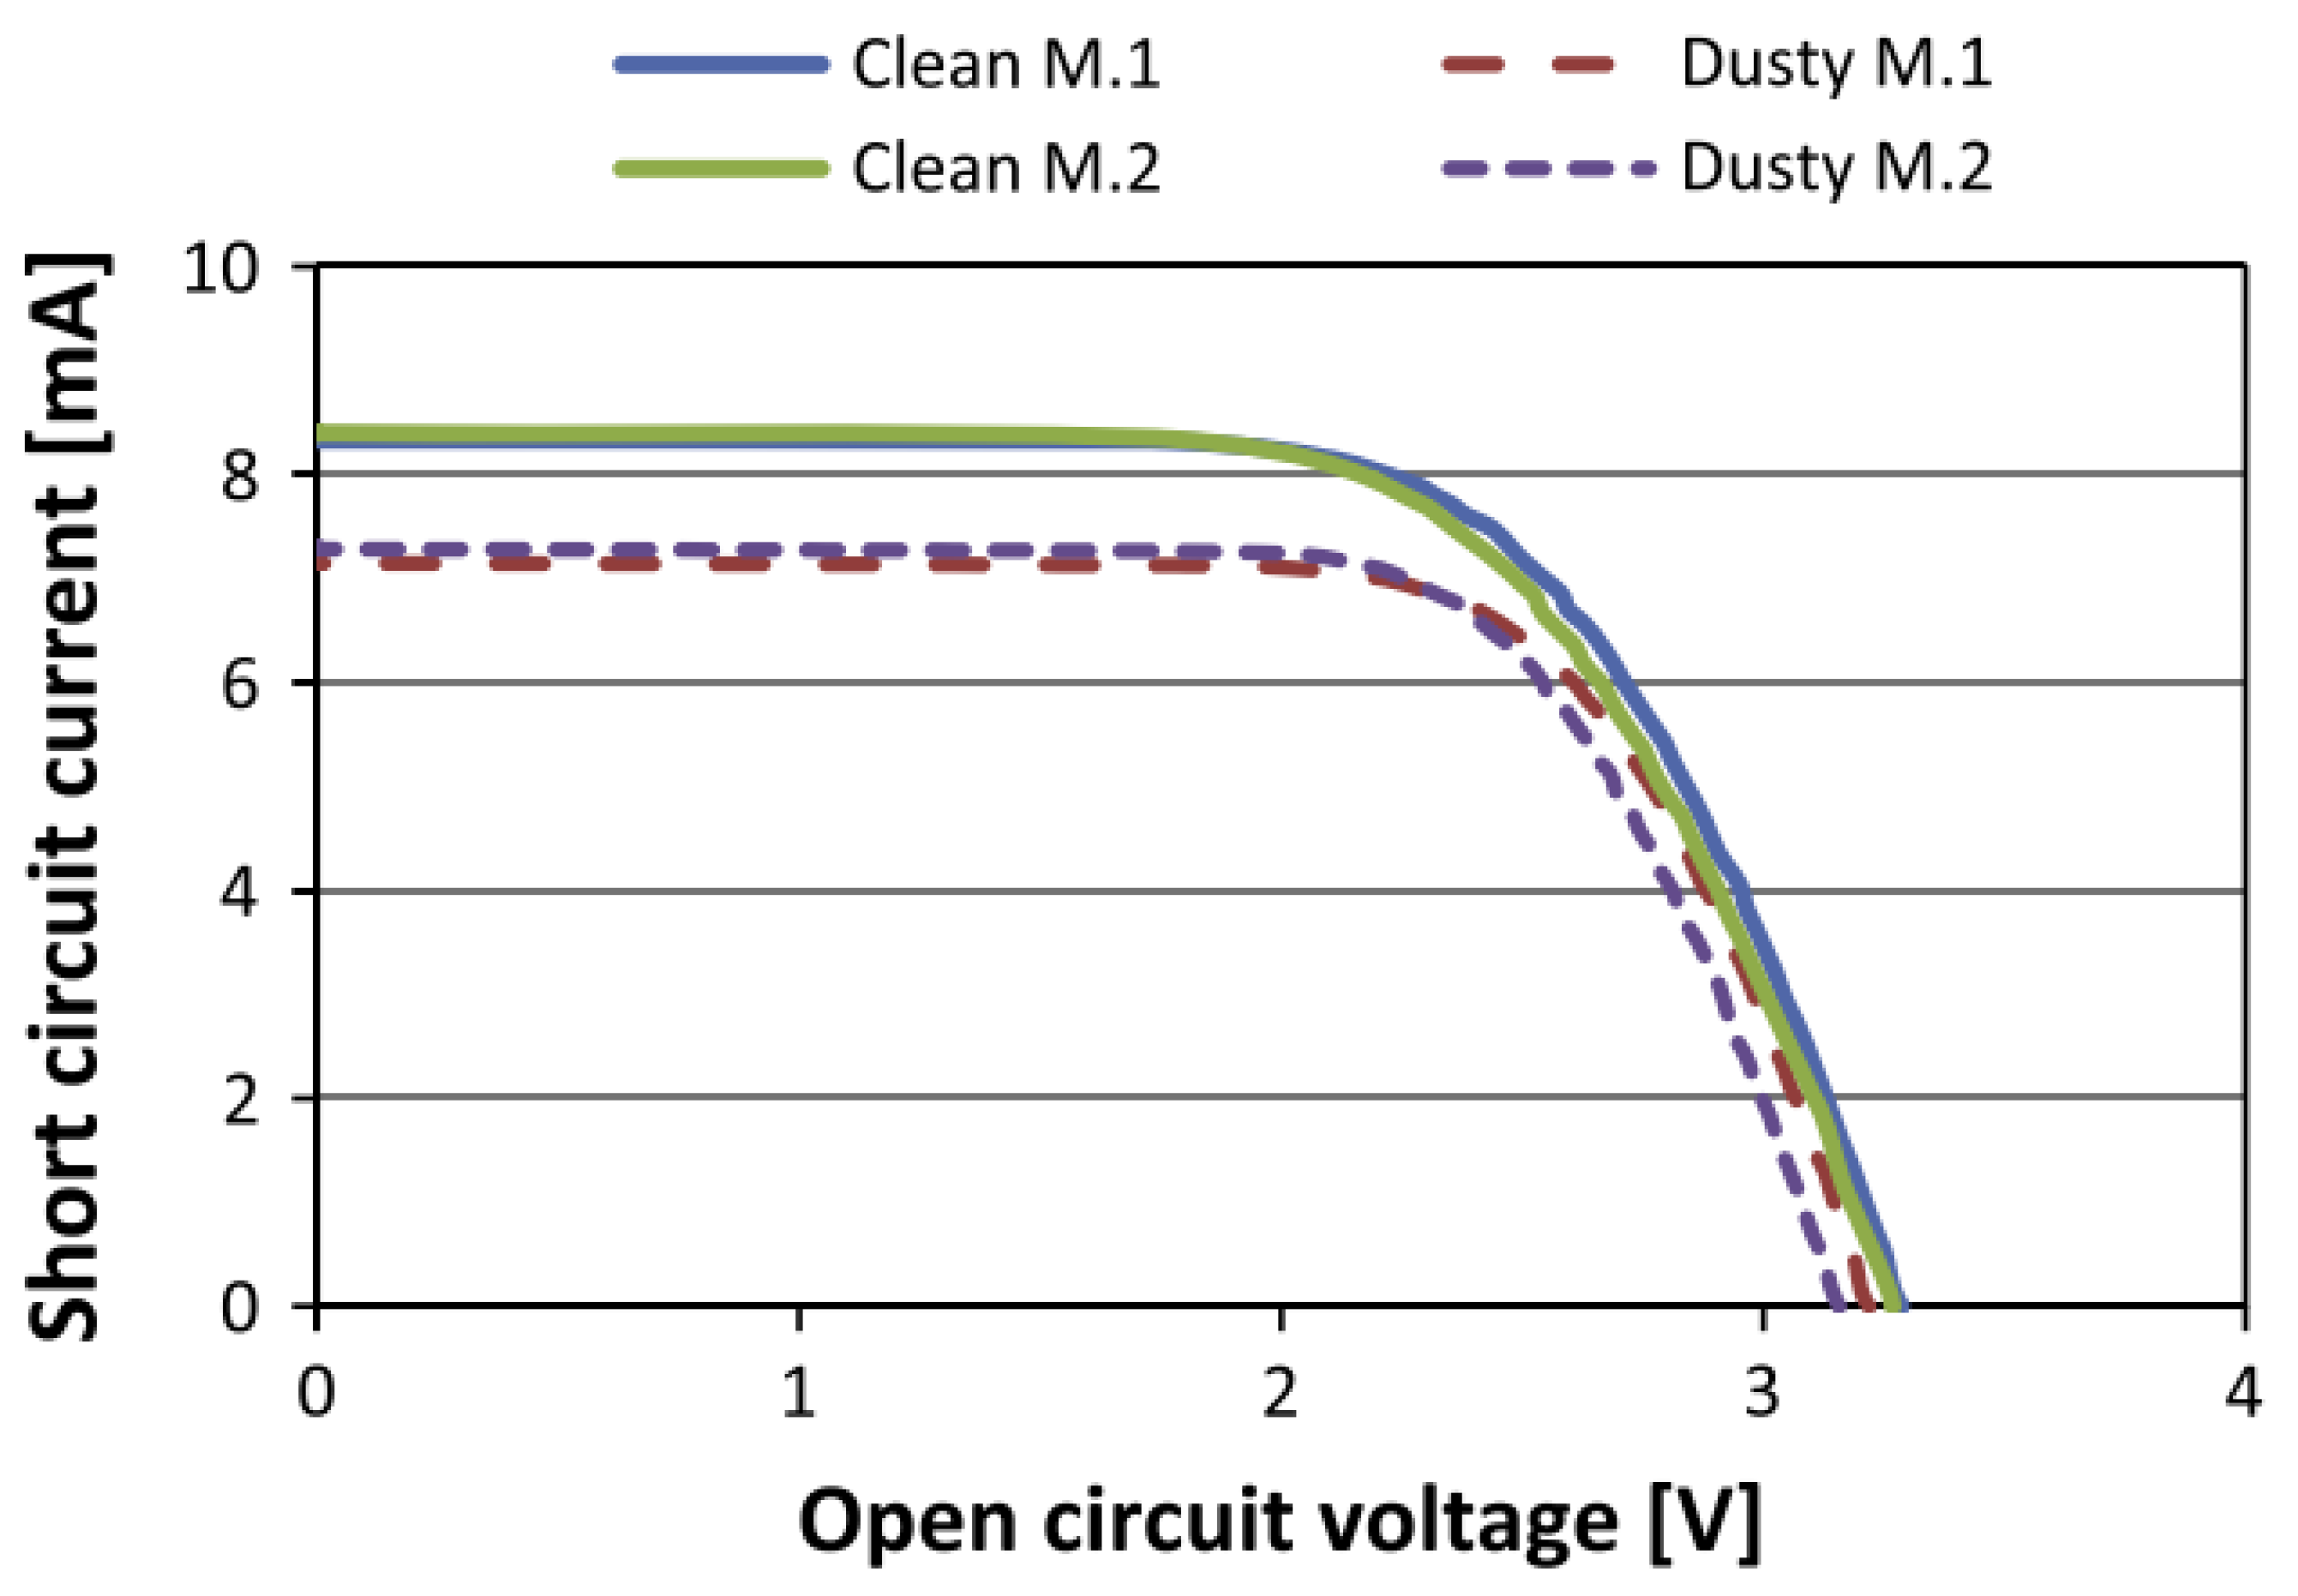
3.2. Solar PV Performance under Soiling in Saudi Arabia

The performance of solar PV may be affected by two factors in soiling circumstances. The first factor is the dust particle’s size. Second, the accumulation of dust on the solar PV surface, which affects the optical property [57]. In the atmosphere, if the dust particle is greater than the solar irradiation wavelength then the radiation will scatter and will lead to solar irradiation reduction. Therefore, dust particles will create a layer that can cause solar irradiation to be absorbed or reflected. As a result, the module’s performance will decline due to a drop in transmittance.
Several studies in the literature have examined the impact of soiling on solar PV performance in several countries with high solar irradiation and soiling exposure, including Morocco, India, Oman, Pakistan, Nigeria, and the United States.
In [33], the authors provide a comprehensive, detailed description and elaboration of the evolution of soiling research in the solar energy field from 1942 to 2019. In [34], the authors represent an updated survey on the effect of soiling on PV performance, as well as a summary of the key contributions of this phenomenon in both Morocco and India, and concluded that soiling can dramatically reduce the amount of solar energy received by the panel. The authors in [35] have studied and investigated the soiling effect on solar PV performance in six cities in Oman for one year. The reduction in PV output efficiencies for the studied cities reached from 5.5% to 18%. In Lahore, Pakistan, the authors in [36] observed that the soiling rate was around 0.8% per day for a 30° tilted panel which is among the highest soiling rates reported for various urban locations throughout South Asia and the Gulf region. Another more recent study examined the effects of soiling in Nigeria [37], the authors investigated the effects of dust on four different PV technologies (Monocrystalline Silicon, Polycrystalline Silicon, Cadmium Telluride, and amorphous Silicon). The findings reveal significant losses, with a yield loss of 78.3% and efficiencies declining by 78% for amorphous Si, 77% and 77% for cadmium telluride, 70% and 71% for polycrystalline, and 68.6% and 71% for monocrystalline Si.
The authors in [38] studied the soiling losses for solar photovoltaic systems in California, USA. Overall, soiling losses averaged 0.051% per day, with 26% of the sites experiencing losses greater than 0.1% per day. Soiling losses were greater at sites with small tilt angles (<5°).
In reference [58] a PV panel’s performance was evaluated after several months of outdoor exposure in Dhahran, KSA. They discovered that the PV panel’s efficiency degraded on average by 7% per month.
The authors in [28] report a power loss of about 11.5% in a PV module after only 72 h of outdoor exposure in Riyadh’s central region. A study by Salim et al. [29] examined the long-term soiling effect on a PV system near Riyadh and found that after 8 months of soiling, the solar modules’ performance had decreased by 32%.
In Thuwal, western region, the authors in [44] examined the effect of the soiling on solar PV for outdoor exposure for a week. Due to the dust accumulation on the first day, they found that the transmittance reduction was 2%. They claim that the dust adhesion was high the first time due to the surface electrostatic force. Figure 6 shows the transmittance of the samples which decreases over time as a result of the continuous dust accumulation in a week of exposure (the x-axis denotes the wavelength in nm and the y-axis denotes the glass transmittance in percentage).
In [30], Said and Walwil investigated how dust accumulation affected the glass cover of PV modules in Dhahran, Saudi Arabia. After 45 days of outdoor exposure, the results exhibited that the dust deposition was 5 g/m2, the transmittance reduction was 35% and the total transmittance reduction was 20%. Consequently, the power reduction was about 6% in 5 weeks of exposure. The PV power output of the dusty modules concerning exposure time is shown in Figure 7. The result is determined by dividing the weekly average daily peak power output of clean modules by the weekly average daily peak power output of dusty modules, and it represents the normalized weekly average daily peak power output of dusty modules.
Figure 8 shows that, on average, the short circuit current has decreased by 13% after 5 weeks of exposure to the outdoors. For different exposure periods, the tilt angles of the PV modules are investigated. It has been observed that the likelihood of removing some dust particles would be increased by the high tilt angle. Figure 9 shows that increasing the inclination angle decreases the amount of accumulated dust on the glass and improves the glass transmittance.
Moreover, the authors have tested and compared the anti-reflective coated glass with no coated plain glass and found that the coated glass showed less reduction in transmittance due to the roughness of the surface.
In Rumah, near Riyadh city, the authors in [60], investigated the soiling impact on power loss for different solar PV technologies. The panels are oriented at a tilt angle of 15° concerning the zenith and are mounted 16° due south. The soiling loss rates of all the technologies examined over a 30-day period ranged from 2% to 18%. Figure 10 depicts the soiling losses of the different PV technologies. Concerning the rate of dust accumulation, there is a strong seasonal pattern with losses of around 16% in April (dustiest) versus only around 2% in July (least dusty). The soil weight on glass samples for each month has been investigated under two positions: tilted to 15° and horizontal orientations. Figure 11 shows the soil weight for each month under the two orientations as a function of the weeks of exposure. In summary, the accumulated soil weight correlates well with the dust accumulation loss which has been modeled by the following simple exponential:
L s ( t ) = 1 e a t
The coefficients are the value of a that best fits measured data by reducing the square of the difference between the modeled and measured values for the month and technology type. The properties of the model are:
L s ( 0 ) = 0   and   L s   1   as   t  
Adinoyi and Syed, in [31], studied the performance of six modules outdoors in Dhahran, the eastern part of Saudi Arabia. The modules were tilted at Dhahran latitude of 26° and faced south. They have noticed that there is dust suspended in the atmosphere which can scatter the solar irradiation in addition to the dust accumulated on solar PV modules. The maximum power was recorded around noontime on a cloudless day, with a radiation intensity of 800 W/m2 or greater. Figure 12 demonstrates the power decreasing continuously due to soiling. In March, a single sandstorm reduced the module power output of solar PV modules by 20% whereas in November, due to rainfall the power output for all the modules increased to their highest values. Though from December to March a weekly cleaning routine has been applied to all modules, therefore the power outputs of the modules remained high. The power outputs started to decrease again as there was no further cleaning from April. They concluded that if the PV module is exposed to outdoor conditions and not cleaned for 6 months, the power output will experience a drop of more than 50%. They also noticed that the decrease in power output is relying on the frequency and density of the dust not only on the duration of the exposure.
As illustrated in Figure 13, the solar tracker has improved the PV module performance by halving the dust effect. At noon time PV module delivers its maximum power. The maximum differences between the output of the two modules occur at sunrise and sunset times.
Through field exposure of solar modules in Arar, north of Saudi Arabia, the author in [61] has reported a decrease in both the short circuit current and the open circuit voltage by 2.78% and 0.863% per day respectively due to dust deposition. Furthermore, a strong correlation is observed between the tilt angle and dust accumulation on the glass cover of a PV module.
In Madinah city, western Saudi Arabia the researcher in [62] has investigated the impact of dust on IV characteristics and the efficiency of solar PV. The output power loss reached 28% if dust accumulated up to 60 days of outdoor exposure. They have concluded that even though rainfall has partially cleaned the module and minimized dust accumulation, it cannot be counted on it for cleaning the modules since the rainfall is occasional at Madinah during the year.
A recent study In [63], investigated the performance of clean and dusty solar PV installed in Rabigh, the eastern part of Saudi Arabia. It has observed a significant drop in solar PV performance when the thickness of dust accumulation is increased. It is concluded that a cleaning system must be considered for PV panels in Rabigh to maintain a high-performance solar PV system.

3.3. Dust Particles Size and Composition

According to several studies, the size and composition of dust vary from site to site around the world. This can have an impact on dust accumulation and PV module performance [58,64,65,66]. In rural locations, plants and vegetation as well as wind-blown dust compounds are the main sources of dust particles, whereas, in urban areas, construction sites and vehicle exhaust are the major sources.
Most of the dust studied from PV modules in Saudi Arabia’s neighboring countries, including Qatar, the United Arab Emirates, and Kuwait is caused by wind-blown dust containing calcite, dolomite, quartz, and feldspar. Moreover, since these countries border the sea, sea salts can be found [46,67].
Because dust particle size and composition vary depending on location, a thorough investigation of the soiling mechanism using analytical tools such as XRD, XPS, and scanning electron microscopy (SEM) analysis is required to find more suitable cleaning solutions for PV modules. Several studies have found that the particle composition can vary even within the same location [46,59,66].
Said and Walwil, in [59], investigated various dust particles collected from solar PV surfaces in Dhahran city. The highest concentration was discovered to be oxygen, followed by silicon, calcium, iron, and sulfur. Calcite and quartz compounds account for more than 60% of dust particle content. In general, the study found that dust particles have a spherical shape. They discovered that the majority of the particles have a size of less than 2 μm and can scatter solar irradiation.
Mehmood et al. [66] investigated the characteristics of dust that accumulated on PV modules in the same location. They discovered that the dust particles were not evenly distributed. It also has a small amount of Na and a large amount of Ca. Si, C, Fe, and Mg are the other elements. It has been discovered that there is no standard size for dust particles. Figure 14 below depicts the size distribution of the dust sample.
SEM morphological analysis of the dust sample reveals that the tiny dust particles accumulated in clusters of about 1–2 μm (Figure 15a). Due to the opposite charges’ existence, Figure 15b shows that small particles are joined to large particles. Moreover, Figure 15c shows that flake-like particles which are rich in Ca and Si are also presented in the dust sample.
In addition, Adinoyi and Said [31] presented a study on the impact of soiling on solar PV performance in Dhahran city. They studied the performance of six modules exposed to the outdoor condition. The SEM revealed that the dust has irregular particle sizes. Using Energy Dispersive Spectroscopy (EDS), the results show that O2 makes up the majority of the dust composition (an average of 58%), followed by calcium, carbon, and Sulphur.
Similarly, [45] investigated the dust accumulated on the surface of the protective glass of PV modules in Dammam, Saudi Arabia, which was collected every two weeks. The SEM images of the soiling on a PV protective glass test surface were studied. The average particle size was 1.2 μm. The little dust particles become adhered to the giant particles as a result of the forces created by charges acting on the various materials. The morphologies of the dust particles varied, and some had flake-like structures, while others had sharp edges and round corners. In general, Si, Ca, Mg, Na, K, S, O, and Fe were the most common elements detected in dust particles regardless of size.
It can be concluded that the most common elements are oxygen, calcium, silicon, magnesium, and iron, while the dominant components are quartz, calcite, and dolomite, which are primarily derived from natural desert particles. It should be noted that the composition and sizes of dust particles depend on the location of the PV module.

4. Mitigation Strategies

Several mitigation techniques have been discussed in literature aiming to mitigate the challenge of PV soiling [44,46,68,69,70,71,72,73,74]. The cleaning techniques including manual, natural, automated, and self-cleaning are illustrated in Figure 16.

4.1. Manual Cleaning

In this case, the solar PV will be scrubbed and washed using rags and brushes to restore cleanliness as shown in Figure 17. This approach is effective in removing the hard soiling and cementations. However, it may cause an abrasive effect on solar modules due to the direct brushing method. Moreover, this technique is considered an expensive method mainly due to intensive labor requirements and a large amount of water necessity [69,71,74,75]. This technique is only suitable for low-scale PV plants and will be very tedious and challenging for workers due to the PV sensitivity and the height where the module is installed [76].

4.2. Natural Cleaning

Natural phenomena, including wind, rainfall, and gravity, have an impact on removing the dust from solar PV modules. Rainfall is an effective natural cleaning process that can recover the performance of solar PV modules. The droplets that stay on the PV module can cause adhesiveness on the module. The light rainfall tends to collect flying dust particles and accumulate on the surface which leads to a decrease in the efficiency of the PV system. In arid areas, this phenomenon is not regular and cannot be relied on [69,75].
Wind eliminates the dust particles from the PV module surface. Some factors play a role such as the speed of the wind, direction of the wind, and module tilt angle. The wind is a natural phenomenon like rainfall and being dependent on it for cleaning the modules is not a good option especially when it is a low-speed wind since it will accumulate dust on the PV surface and then deteriorate the system performance [42,77].

4.3. Automated Cleaning

4.3.1. Water-Based Cleaning

It is the most commonly used method of mitigating dust from solar PV surfaces [35,40]. Highly pressurized water (with detergent sometimes) is used to clean the surface and can efficiently remove dust accumulation. However, water scarcity is an issue, especially in arid and semiarid areas where solar irradiation is high. Moreover, for the hot PV panels using water for cleaning could cause a thermal shock due to the water being cooler than the PV surface. Moreover, when the PV panel surface is wet after cleaning, it may attract more dust particles. Such drawbacks could be avoided by regulating the timing of cleaning [41].

4.3.2. Mechanized Cleaning

A variety of mechanical automated cleaning methods which include mechanical wiping, robotic cleaning, drone brushing, blowing, and vibrating are utilized to clean the PV module surface. These techniques minimize labor intensity and utilize automation systems. At large-scale solar plants, robotic cleaning devices can move on their own to clean solar panels, as illustrated in Figure 18 [44].
A quick, efficient, and water-saving cleaning solution for PV modules in solar power plants is a tractor-mounted hydraulic arm as shown in Figure 19. It is made to be simple and operated by a single person. Additionally, it is designed to be compact and portable so that it may fit in places other cleaning equipment cannot and operate well in tight sites. Moreover, it is easy to maneuver, park, and operate [45].
Drones are an emerging technology in the solar PV sector due to their long-range monitoring, efficient data logging, inspection reliability, and ease to control and access. It is considered an alternative to fixed robotic and manual cleaning approaches. Recently, drones have been utilized in monitoring, inspection, and cleaning of solar PV panels as presented in recent research [80,81,82] A recent study [82] examines the efficiency of several PV cleaning techniques for potential retrofitting into drones. The authors found that brush and microfiber based-cloth wipers are the best-suited options for drone-based solar PV cleaning due to their low weight, small size, and ease of use. Several commercial drones are available for cleaning utility-scale solar PV farms. For example, Cleardron uses sensor fusion, computer vision, and artificial intelligence to detect and clean PV panels [83]. It contains a glass cleaning device and a detachable container with cleaning fluid. Hercules 10 Spray drone [84] developed by Drone Volt equipped with a spray system and powerful pump which spray up to 3 L per minute as shown in Figure 20. Furthermore, Aerial Power which makes use of a drone’s downward airflow to clean the PV panel is a fast and waterless cleaning method [85]. The key shortcomings of drones include the short flight period and the required recharging time which could be overcome by customizing the power source and optimizing the cleaning cycles. Using a drone for PV cleaning has various advantages including its autonomy, and mobility, and is utilized on-need basis, hence eliminating high-cost fixed installations as in robotic cleaning techniques. Additionally, based on the cleaning approach utilized, drones can also offer a water-free cleaning method [82]. Cleaning solar panels with drones is currently in the research and development stages.
The piezoelectric technique is used in the vibration technology to provide vibration that cleans the module surface. With this method, the power efficiency of PV modules can be restored to about 95% [73,86]. A programmable logical controller (PLC) and microcontroller are used to run the wiper and brushes to clean the module. Similarly, the robotic cleaning technique uses automation for module cleaning.
The drawbacks of these techniques include electrical energy requirements and the high initial cost of such automatic systems. Additionally, the mechanized systems required regular maintenance. The cleaning efficiency of the technologies is uncertain and may prove to be not quite efficient in the case of high soiling case [75].

4.4. Automated Cleaning

4.4.1. Super-Hydrophobic Plane (SHOP)

This technique uses a chemical coating or screen layer that repulses dust particles back into the air. It helps water-shedding without the energy needed as shown in Figure 21 [87]. SHOP has a low wettability, which makes it less likely for liquid droplets to adhere to the surface. This helps to remove dust particles when it rains, enhancing efficiency and improving cleanliness. SHOP is working more efficiently with rainfall to make this cleaning effective [75]. The lifespan of this technology is limited and when subjected to a lot of ultraviolet (UV) radiation, it may crack. The efficiency of using SHOP is still unconfirmed, especially under various atmospheric conditions [69,71,75].

4.4.2. Super Hydrophilic Plane (SHIP)

Hydrophilicity can be expressed as contrary characteristics of hydrophobicity. SHIP is a preventive approach that has a strong pull on the water while SHOP resists water [88]. The hydrophilic state of a module, represented by the contact between the liquid and solid, can be achieved through the development of the module’s roughness. Hydrophilic surfaces are created using titanium oxide nanofilm and glass surface fabrication via nanopatterning. Water droplets on the hydrophilic surface are flattened and widely spread across the surface, whereas water droplets on the hydrophobic surface do not spread and are mostly sphere shaped on the surface [71]. The difference in contact angles between the droplet and the surface for both hydrophilic and hydrophobic is shown in Figure 22.
The water droplet on the hydrophilic surface spreads and goes beneath the dust particle, carrying it away, whereas the spherical droplet on the hydrophobic surface rolls and picks up the dust particle [90]. When the surface coating begins to deteriorate due to prolonged UV exposure, the hydrophilic surface can cause more dust accumulation.

4.4.3. Electrodynamic Screen (EDS)

An electrodynamic screen is a preventive method that utilized an electrostatic field to prevent dust deposition on a PV module without the use of water or mechanical parts. The EDS can restore over 90% of module performance in 2 min in dry, arid, and desert environments [71,91]. EDS is a fast method of cleaning that needs a high voltage supply to create an electrical field. The cross-sectional view of EDS is illustrated in Figure 23 [74,92].
In a recent study [92], EDS removed more than 80% of lightly deposited dust, however, when the dust strongly adhered to the panel, the cleaning system performed poorly. The microcontroller with sensors is used to operate the EDS system. Though, UV exposure has the potential to degrade the screen. High voltage was required for EDS, which could reduce generation efficiency by 15% [75]. Moreover, it has been demonstrated that it is ineffective for wet or cemented dust particles.

5. Discussion

In Saudi Arabia, desert dust is a major source of dust deposition on solar PV. This is mainly due to the geographical location of Saudi Arabia which fall within arid and semi-arid region. There are local dust sources including the Empty Quarter in the South of Saudi Arabia besides remote sources including the Saharan desert which affect mainly the western part of Saudi Arabia. The dust accumulation on solar PV modules depends on various factors including the site location, precipitation, duration of exposure, wind speed and direction, and panel tilt angle. From the literature review, it has been observed that the dust accumulation on solar PV mainly increases as the duration of exposure increases, especially in spring months where the seasonal analysis indicates that the spring sand and dust storms peak which accordingly deteriorates the PV performance. Depending on the local environment and other factors, the PV performance may be reduced by somewhere between 2% and 50%. A single sandstorm reduced the module power output by 20%. As revealed in Dhahran, the PV module was exposed to an outdoor environment and not cleaned for 6 months resulting in a power drop of more than 50% [31].
According to previous studies it has been observed that the high tilt angle will improve the probability of removing dust particles especially the large ones from solar modules. However, this might reduce the output power as a result of missing the optimal tilt angle which is supposed to yield the maximum output power. Therefore, it is important for PV systems designers to select an optimum tilt angle that will minimize dust accumulation and achieve the maximum amount of power available.
On the other side, compared to the fixed solar system, the solar tracker has been demonstrated to reduce dust accumulation on PV panels and could boost PV performance by reducing the dust effect by 50%. In our previous work in [15], grid-connected solar PV systems with six tracking technologies were investigated and compared for Makkah, Saudi Arabia. The results show that the two-axis tracking system can produce 34% more power than the fixed-axis tracking system. In addition, the vertical axis with continuous adjustment demonstrated significant technical and economic performance and was recommended as the best tracking system for Makkah city’s western region. Therefore, utilizing such a tracking system could minimize dust accumulation and enhance the system performance, especially for the potential 2.6 GW solar PV project in Faisaliah Solar Project which is proposed for the Makkah region.
Seven solar PV technologies were tested in the central region under the same conditions and their soiling loss rates varied. This is primarily due to variations in the module properties, specifically the front cover’s texture.
In the context of mitigation strategies, self-cleaning techniques like superhydrophobic planes and superhydrophilic planes rely on water to adequately clean the PV module. Due to the limited yearly precipitation, it is not recommended to adopt this type of technology in Saudi Arabia.
The authors of [60] calculated the levelized cost of energy (LCOE) of cleaning cost for the Rumah site in the central region for both manual and machine-assisted cleaning. They found that the LCOE for machine-assisted cleaning is 50% less than for manual cleaning which improves the overall LCOE by more than 1%. Al-Jawah, in [93], developed a decision framework to assess PV power plant cleaning alternatives in Riyadh, Saudi Arabia. The use of sprinklers, physical labor, and a PV panel cleaning robot was found to be the optimum cleaning methods, respectively. Cleaning was suggested when the cleaning threshold (the difference between clean and dusty panels) reached 3%, 8%, and 8% using sprinklers, manual labor, and the robot, respectively. The author claimed that a site with higher solar irradiation and higher dust accumulation is preferred to more than one with low solar irradiation and lower dust accumulation.
Currently, the 300 MW Sakaka solar PV project which has an LCOE of US Cents 2.3417/kWh (a world record-breaking as in February 2018) has a single-axis automatic tracking system (from East to West) [5]. Moreover, the project employs a tractor equipped with large brushes and water pumps for the cleaning system. Each row of modules will be cleaned every 10 days on average to avoid soiling loss. The cleaning strategy in this project has successfully maintained the average soiling losses below 1% [94]. The tractors, however, require both manpower and water to operate. The tracking system used in this project will help minimize dust accumulation while also improving PV performance by tracking the path of the sun throughout the day. Additionally, with a very low LCOE, it undoubtedly shows that investing in tracking and cleaning systems is feasible.
Regarding the 1.5 GW Sudair solar PV project in the central region, a bi-facial PV solar panels technology will be employed while the solar modules will be equipped with a tracking system. In addition, an automatic robotic cleaning system will be operated. This project has recorded a significantly low LCOE of US cents 1.239/kWh (2nd lowest cost globally for PV power generation as of April 2021) [95]. It is expected to be operational by the end of 2022. Compared to the other 6 types of PV tested under soiling in [60], the bi-facial PV solar panels technology has demonstrated the lowest observed soiling loss. This is due to the fact that the back side of these panels is not subjected to soiling losses. Moreover, Sudair PV project is utilizing a tracking system and a robotic cleaning system which will maximize the received solar irradiation and minimize the soiling loss efficiently.
Giving to considerable studies conducted in Saudi Arabia and other arid regions, including Bahrain [64], Oman [65], and a desert environment [66], it is strongly advised to clean PV panels once a month or fewer to maintain a high-performance system. However, in the event of a dust storm, it is advised to clean the system immediately to avoid a major decline in PV performance. However, planning the cleaning cycles can be aided by real-time soiling assessment and dust forecasting.
According to several studies and actual solar PV projects, dust accumulation and cleaning costs are not a significant barrier to large-scale, cost-effective PV deployments in Saudi Arabia, particularly in the central region, which is considered to be a high-suitable region for utility-size PV plants owing to its favorable high solar irradiance, proximity to populated areas, mild slope, and proximity to major roads, grid lines, and urban areas, as determined by our previous study in [12].

6. Conclusions

When installing solar PV in an arid region with high solar irradiation, as in Saudi Arabia, one of the challenging problems is soiling. Dust accumulation has the potential to significantly reduce the performance of solar PV modules. The majority of the country is subject to desert dust, which is frequently produced by either domestic (like the Empty Quarter in the South and Southeast) or overseas (like the Saharan desert in North Africa) deserts.
This review began by describing the process of dust formation on solar PV panels. The sources of soiling in Saudi Arabia were then investigated. A detailed review of the literature was conducted for related studies investigating the performance of solar PV under soiling from various regions in Saudi Arabia. Furthermore, the effect of PV panel orientation on soiling losses and power output was highlighted in this review. Various mitigation strategies have been thoroughly described, with the benefits and drawbacks of each technique highlighted.
The study leads to the following conclusions:
  • Due to Saudi Arabia’s location in a dry, low-precipitation zone with vulnerability to dust storms, the investment in cleaning solutions is advised and worthwhile given the significant influence that soiling has on solar PV performance.
  • Soiling will not prevent the widespread deployment of PV plants in Saudi Arabia and other arid regions if the proper cleaning methods are used.
  • The recommended cleaning cycles of PV panels for the central region in Saudi Arabia and similar soiling environments are every month or less to avoid a substantial loss in PV performance. Other regions may experience different soiling exposure which may need different cleaning frequencies.
  • In the event of a dust storm, it is recommended that the system be cleaned as soon as possible to avoid a significant decrease in PV performance.
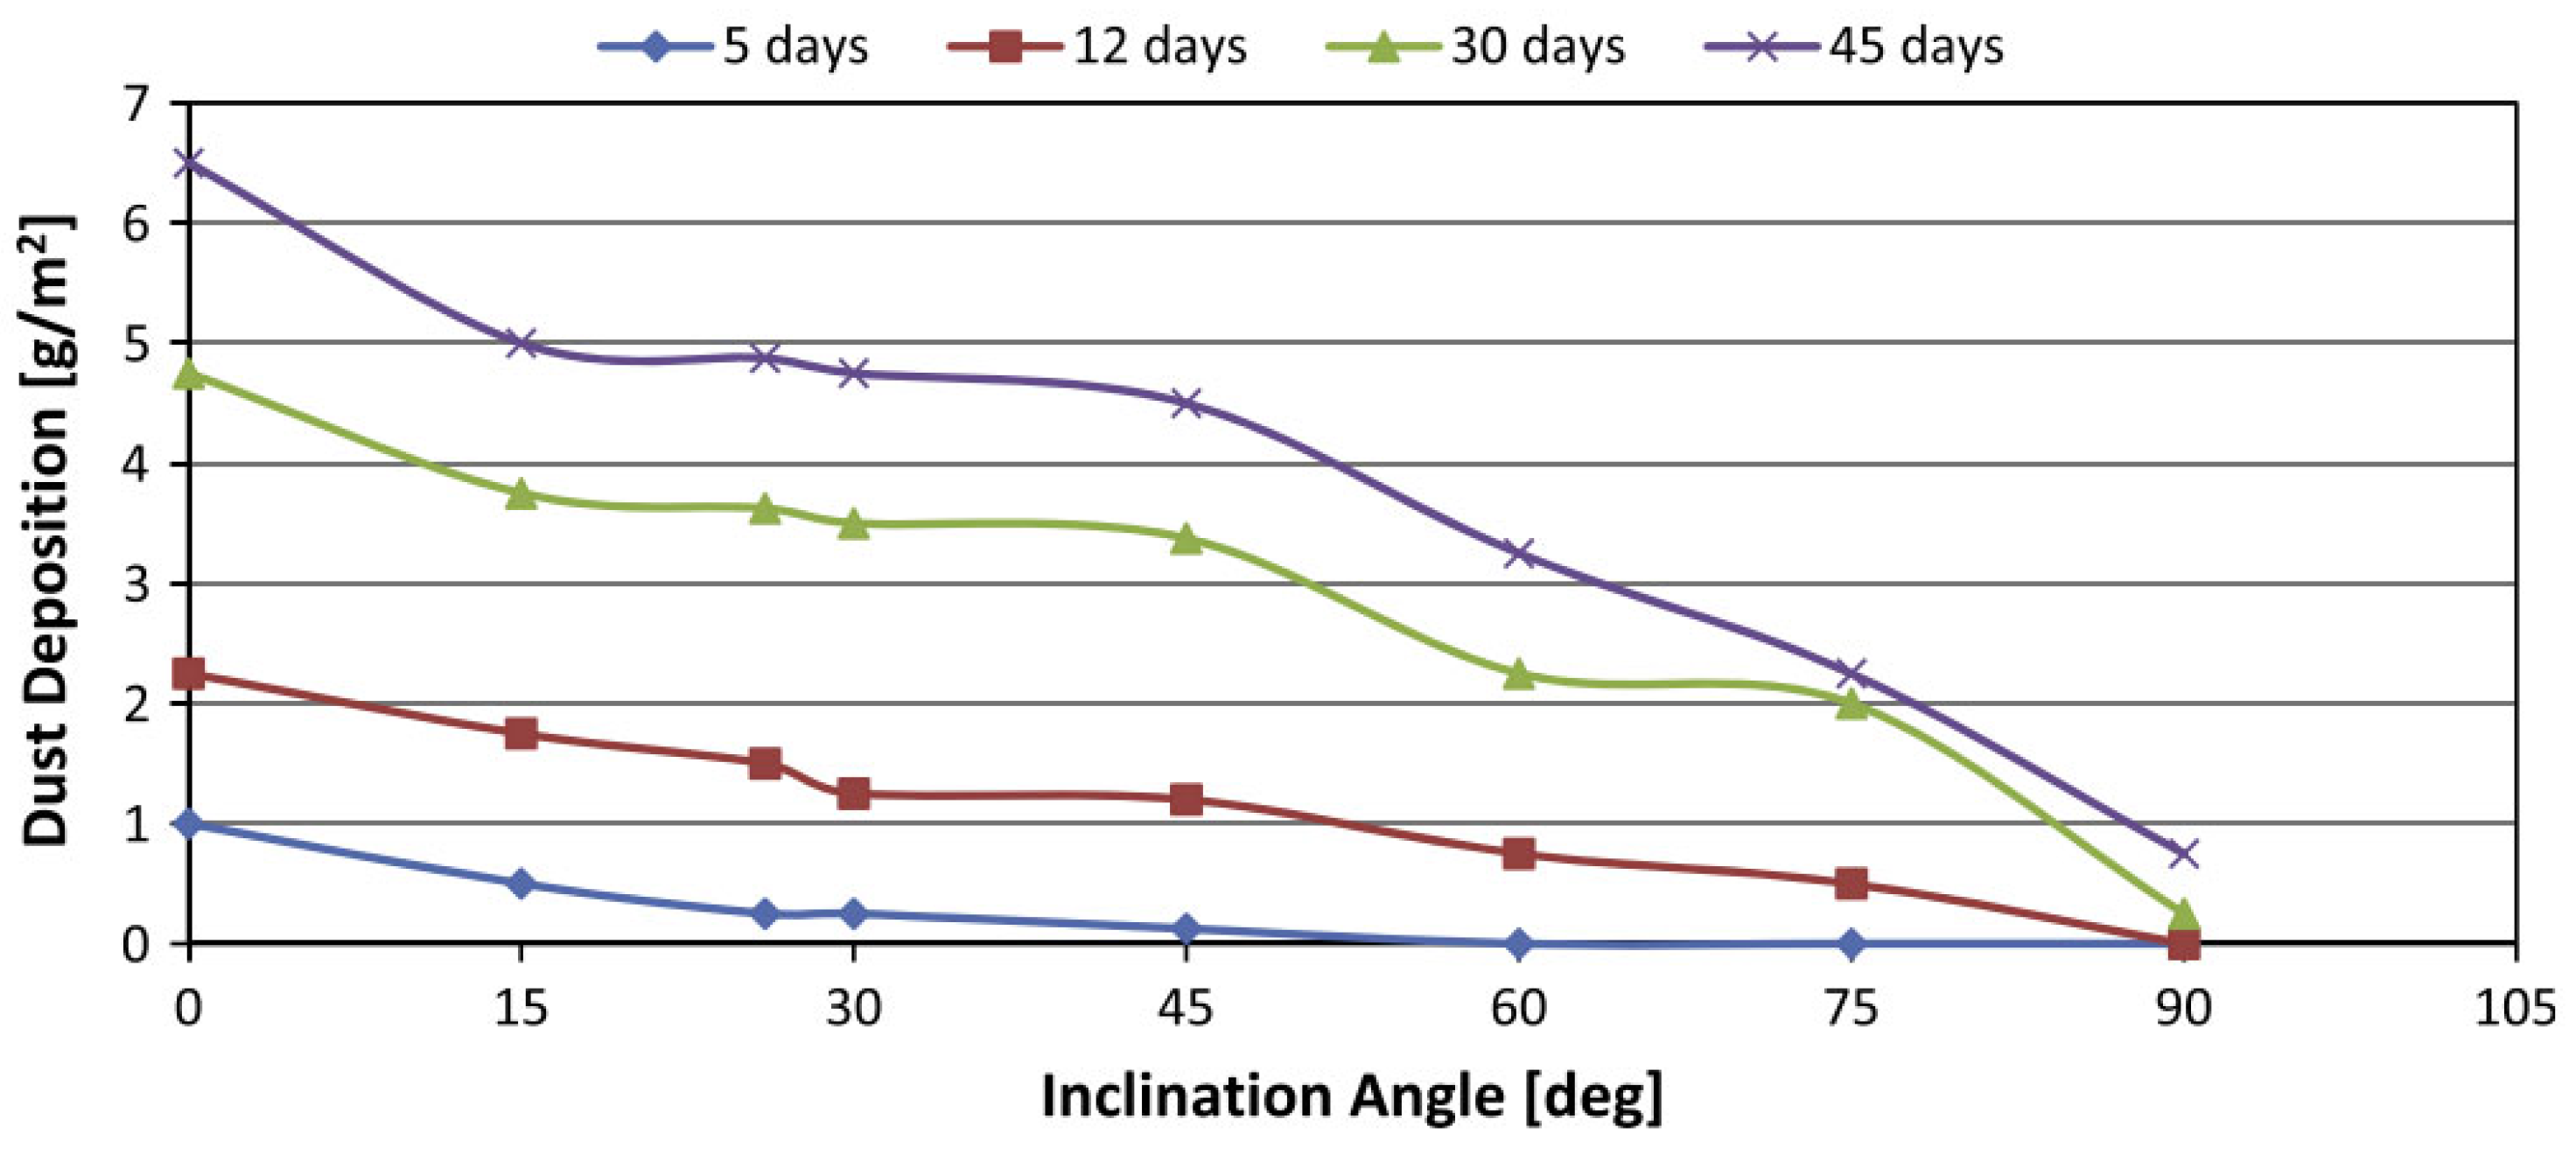
  • Regarding the fixed solar PV modules, the tilt angle has a strong influence on accumulated dust density. The high tilt angle has improved eliminating dust particles. Nevertheless, this might reduce the output power as a result of missing the optimal tilt angle. Therefore, PV systems designers have to adjust the tilt angle optimally aiming to minimize dust accumulation and attain the maximum amount of power.
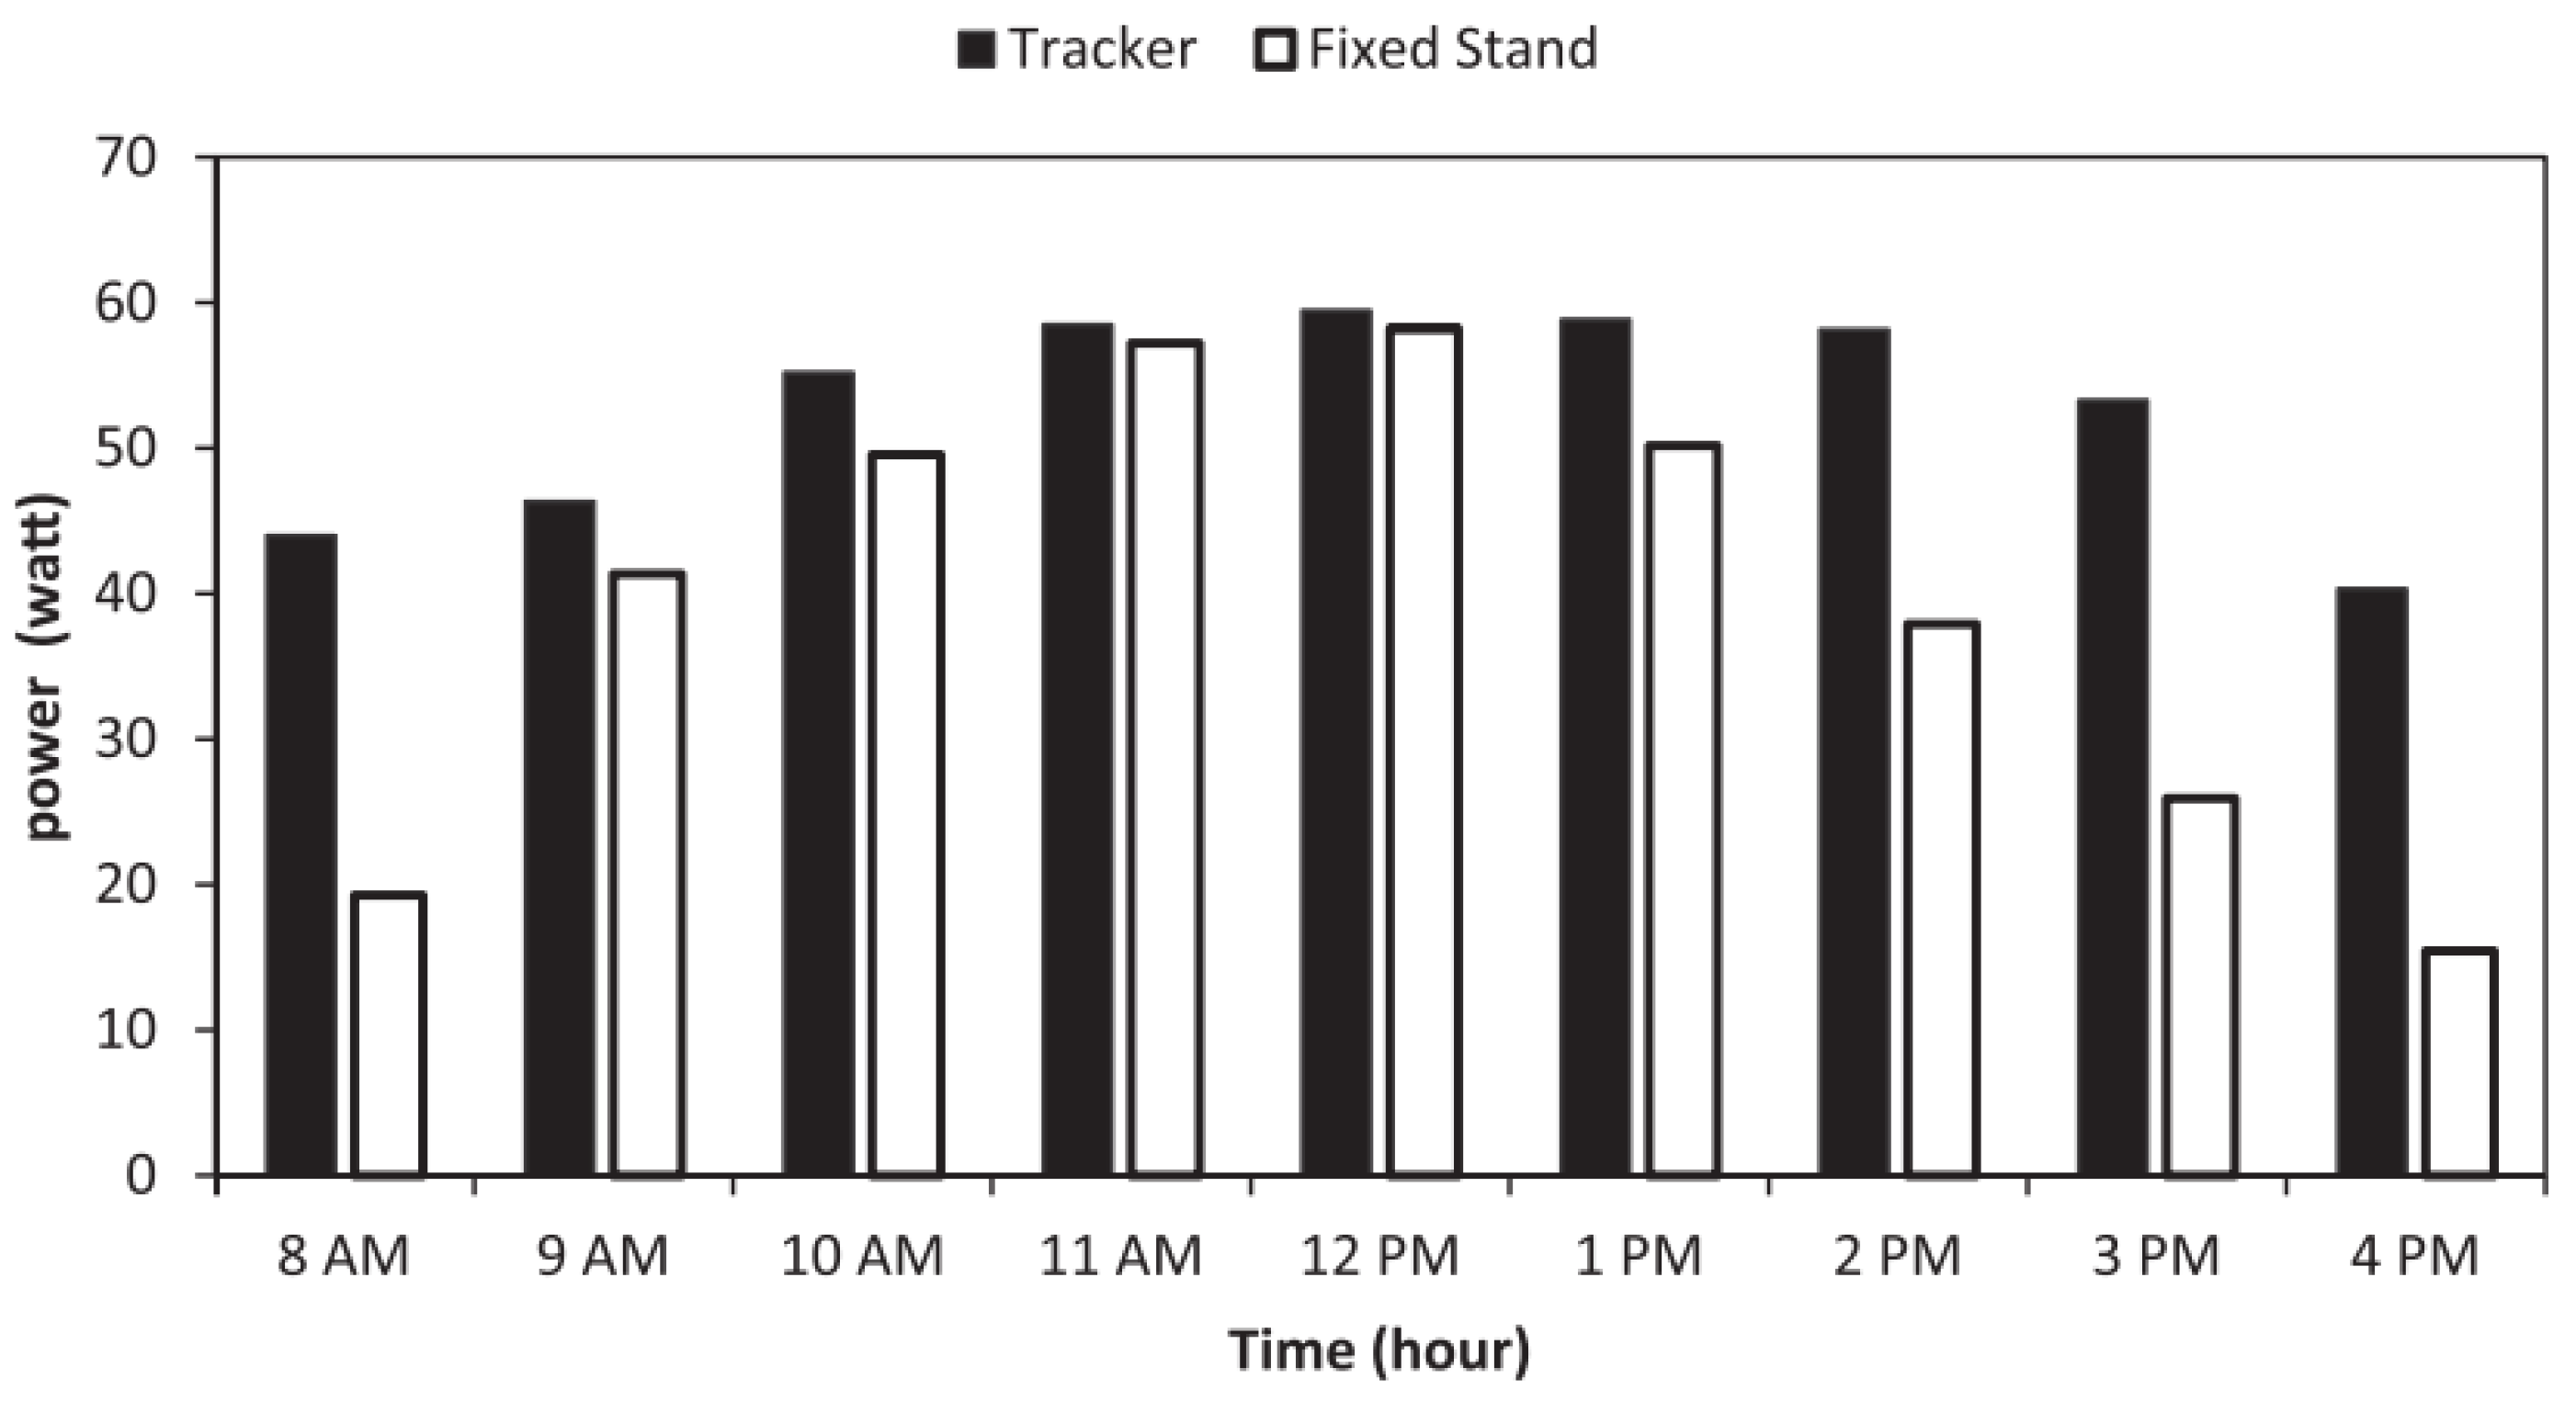
  • It is recommended that Saudi Arabia consider the solar tracking system because, compared to a fixed solar PV system, the solar tracker reduces dust deposition on PV panels and improves PV performance.
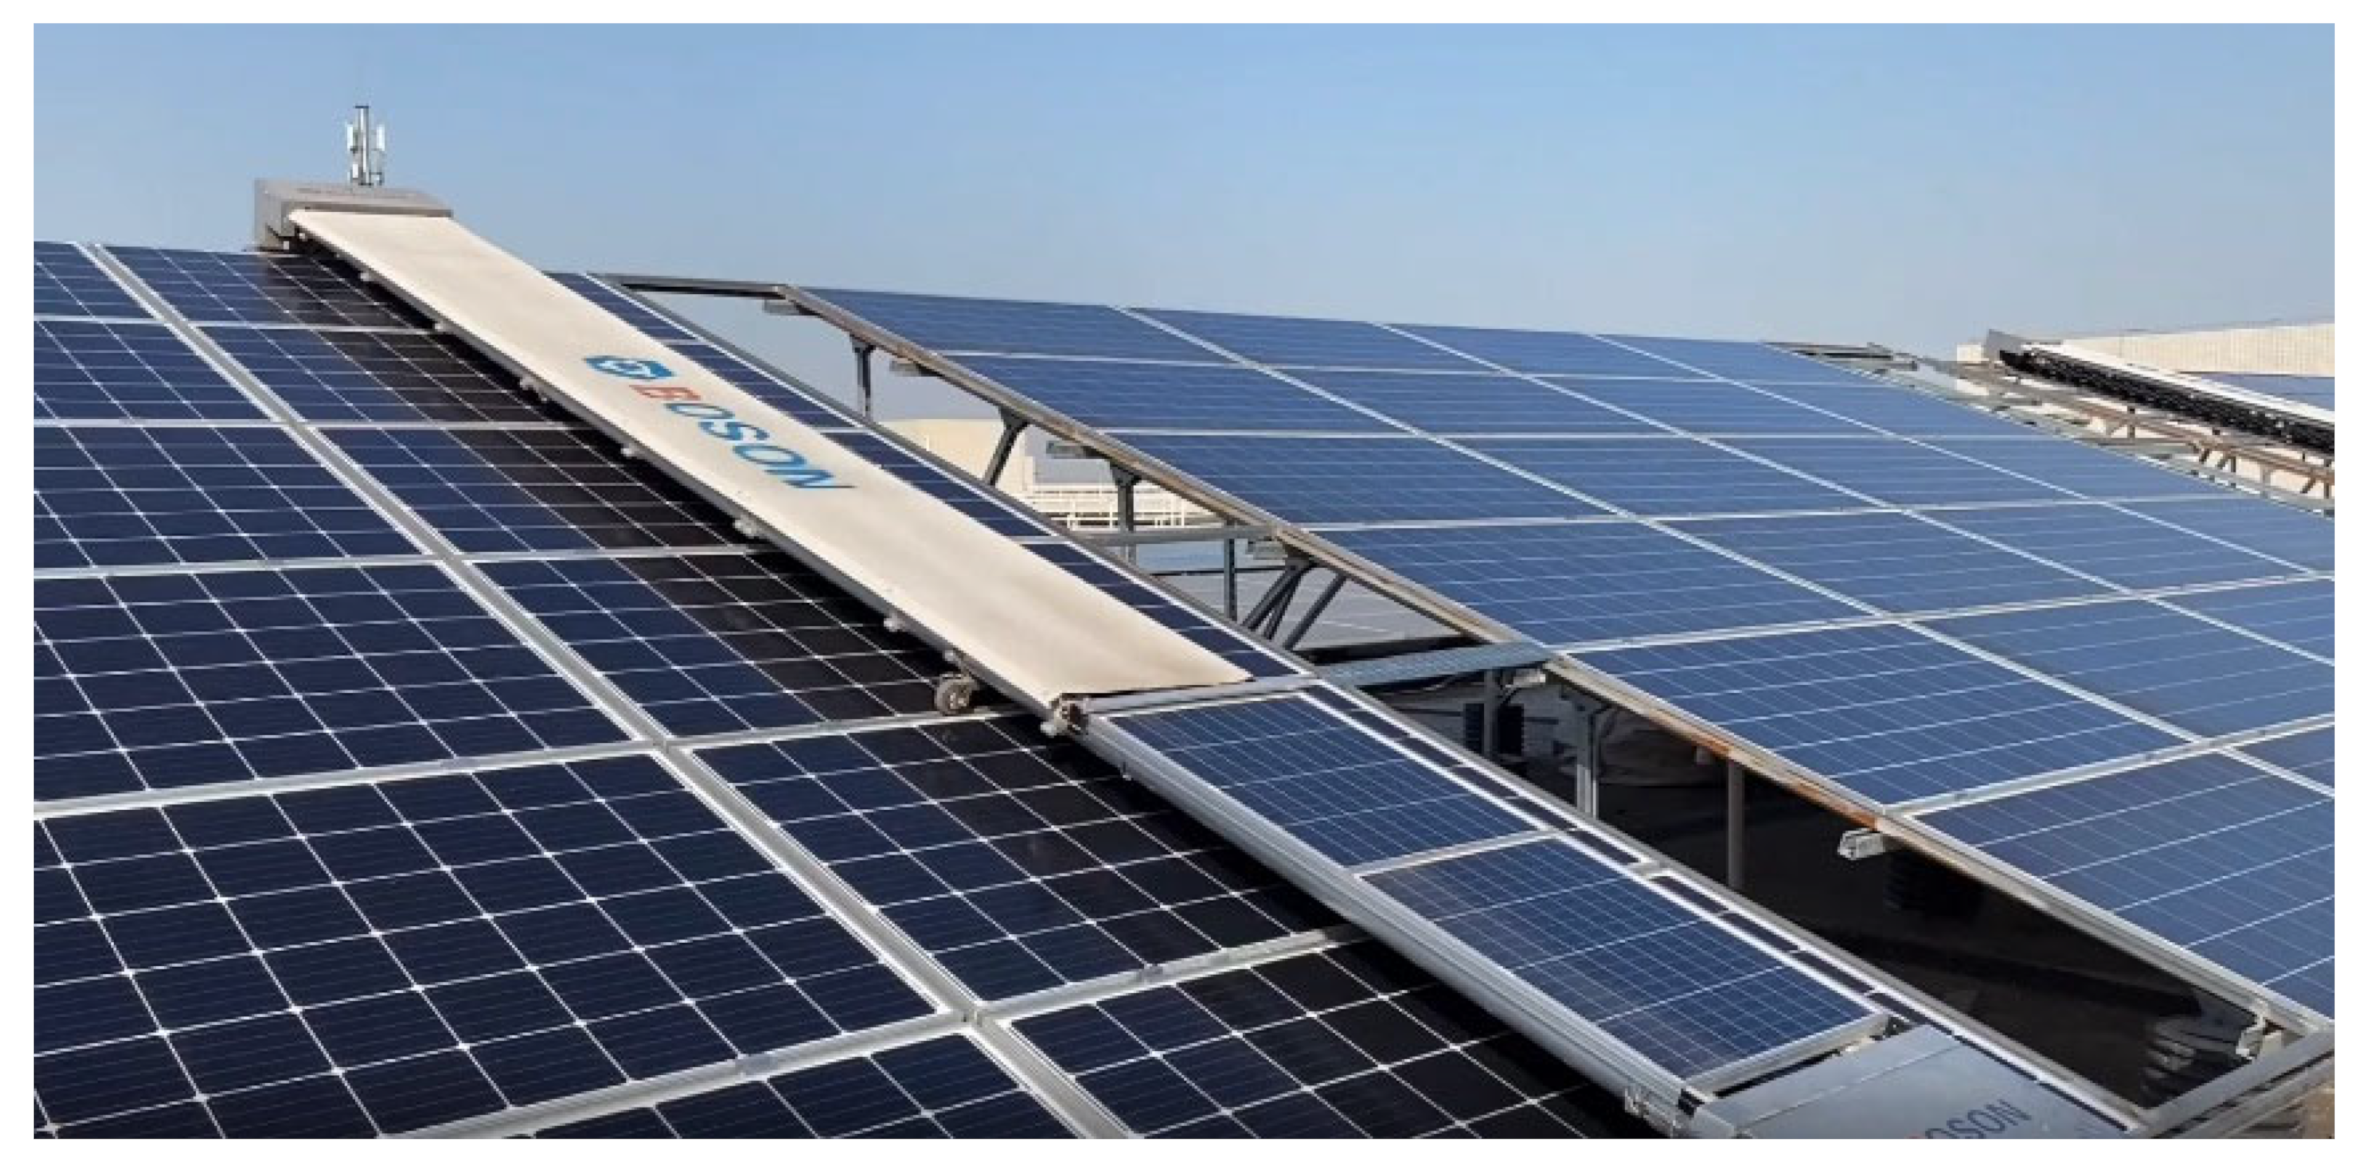
  • The solar PV projects have shown a considerably low levelized cost of energy for the central region of Saudi Arabia. It makes use of bi-facial solar panels and is equipped with a tracking system and a robotic cleaning mechanism.
  • Self-cleaning strategies, such as superhydrophobic and superhydrophilic planes, could help to further lower the frequency and cost of cleaning. They do, however, need water to clean the PV module adequately. Due to the low yearly precipitation in Saudi Arabia, this type of strategy may be inappropriate to consider.
Future research should consider the following directions:
  • Using artificial intelligence and other techniques to forecast dust storms is a promising strategy that will aid plant operators in making plans for the best cleaning operations for solar PV modules.
  • The selection of the appropriate cleaning and mitigation techniques should be aided by a deeper understanding of the dust properties and characteristics in the study area.
  • The development of soiling prediction models is crucial for feasibility studies and future solar PV plant bidding initiatives.
  • More research is needed to determine how environmental factors such as humidity, wind direction, and wind speed impact the efficiency of solar PV systems.
One of the study’s limitations was the limited research on the soiling effect on solar PV performance in Saudi Arabia. They have primarily targeted only several cities in Saudi Arabia’s Central, Eastern, and Western regions. Furthermore, dust size and characterization studies in Saudi Arabia were insufficient to comprehend the nature and characteristics of dust particles throughout the country.

Funding

This research received no external funding.

Conflicts of Interest

The author declare no conflict of interest.

References

  1. REN21. Renewables 2022, Global Status Report; REN21: Paris, France, 2022; ISBN 978-3-948393-04-5. [Google Scholar]
  2. IEA. Annual Solar PV Capacity Additions by Application Segment, 2015–2022; IEA: Paris, France, 2022. [Google Scholar]
  3. Saudi Vision 2030 Vision, Energy & Sustainability. Available online: https://www.vision2030.gov.sa/thekingdom/explore/energy/ (accessed on 12 March 2022).
  4. IEA Saudi Arabia—Sudair Solar Plant Project. Available online: https://www.iea.org/policies/14162-saudi-arabia-sudair-solar-plant-project (accessed on 6 September 2022).
  5. ACWA ACWA Power Connects The First Renewable Energy Project in the Kingdom, Sakaka PV IPP, to the National Electricity Grid, Commencing Initial Production. Available online: https://www.acwapower.com/news/acwa-power-connects-the-first-renewable-energy-project-in-the-kingdom-sakaka-pv-ipp-to-the-national-electricity-grid-commencing-initial-production/ (accessed on 6 September 2022).
  6. LAYLA SOLAR PV IPP. Available online: https://acwapower.com/en/projects/layla-solar-pv-ipp/ (accessed on 6 September 2022).
  7. DMS Acwa Power—GIC—Al Babtain Contracting Company—National Renewable Energy Program (NREP)—Al Faisaliah. Available online: https://www.dmsprojects.net/saudi-arabia/projects/acwa-power-gic-al-babtain-contracting-company-national-renewable-energy-program-nrep-al-faisaliah-600-mw-solar-pv-plant/PRJ00025968 (accessed on 6 September 2022).
  8. Ministry of Energy Renewable Energy. Available online: https://www.moenergy.gov.sa/en/OurPrograms/RenewableEnergy/Pages/Initiatives.aspx (accessed on 2 September 2022).
  9. Rehman, S.; Aliyu, K.N.; Alhems, L.M.; Mohandes, M.A.; Himri, Y.; Allouhi, A.; Mahbub, M.A. A Comprehensive Global Review of Building Integrated Photovoltaic Systems. FME Trans. 2021, 49, 253–268. [Google Scholar] [CrossRef]
  10. Khan, N.; Haq, I.U.; Ullah, F.U.M.; Khan, S.U.; Lee, M.Y. Cl-Net: Convlstm-Based Hybrid Architecture for Batteries’ State of Health and Power Consumption Forecasting. Mathematics 2021, 9, 3326. [Google Scholar] [CrossRef]
  11. Al Garni, H.Z.; Awasthi, A. Solar PV Power Plants Site Selection: A Review. In Advances in Renewable Energies and Power Technologies; Yahyaoui, I., Ed.; Elsevier: Amsterdam, The Netherlands, 2018; pp. 57–75. ISBN 978-0-12-812959-3. [Google Scholar]
  12. Al Garni, H.Z.; Awasthi, A. Solar PV Power Plant Site Selection Using a GIS-AHP Based Approach with Application in Saudi Arabia. Appl. Energy 2017, 206C, 1225–1240. [Google Scholar] [CrossRef]
  13. Al Garni, H.Z.; Awasthi, A.; Wright, D. Optimal Orientation Angles for Maximizing Energy Yield for Solar PV in Saudi Arabia. Renew. Energy 2019, 133, 538–550. [Google Scholar] [CrossRef]
  14. Rahman, M.M.; Hasanuzzaman, M.; Rahim, N.A. Effects of Various Parameters on PV-Module Power and Efficiency. Energy Convers. Manag. 2015, 103, 348–358. [Google Scholar] [CrossRef]
  15. Al Garni, H.Z.; Awasthi, A.; Ramli, M.A.M. Optimal Design and Analysis of Grid-Connected Photovoltaic under Different Tracking Systems Using HOMER. Energy Convers. Manag. 2018, 155, 42–57. [Google Scholar] [CrossRef]
  16. Honrubia-Escribano, A.; Ramirez, F.J.; Gómez-Lázaro, E.; Garcia-Villaverde, P.M.; Ruiz-Ortega, M.J.; Parra-Requena, G. Influence of Solar Technology in the Economic Performance of PV Power Plants in Europe. A Comprehensive Analysis. Renew. Sustain. Energy Rev. 2018, 82, 488–501. [Google Scholar] [CrossRef]
  17. de Azevedo Dias, C.L.; Branco, D.A.C.; Arouca, M.C.; Legey, L.F.L. Performance Estimation of Photovoltaic Technologies in Brazil. Renew. Energy 2017, 114, 367–375. [Google Scholar] [CrossRef]
  18. Othman, R.; Hatem, T.M. Assessment of PV Technologies Outdoor Performance and Commercial Software Estimation in Hot and Dry Climates. J. Clean. Prod. 2022, 340, 130819. [Google Scholar] [CrossRef]
  19. Rowlands, I.H.; Kemery, B.P.; Beausoleil-Morrison, I. Optimal Solar-PV Tilt Angle and Azimuth: An Ontario (Canada) Case-Study. Energy Policy 2011, 39, 1397–1409. [Google Scholar] [CrossRef]
  20. Hafez, A.Z.; Soliman, A.; El-Metwally, K.A.; Ismail, I.M. Tilt and Azimuth Angles in Solar Energy Applications—A Review. Renew. Sustain. Energy Rev. 2017, 77, 147–168. [Google Scholar] [CrossRef]
  21. Bingöl, O.; Özkaya, B. Analysis and Comparison of Different PV Array Configurations under Partial Shading Conditions. Sol. Energy 2018, 160, 336–343. [Google Scholar] [CrossRef]
  22. Ramabadran, R.; Mathur, B. Effect of Shading on Series and Parallel Connected Solar PV Modules. Mod. Appl. Sci. 2009, 3. [Google Scholar] [CrossRef]
  23. Bayrak, F.; Ertürk, G.; Oztop, H.F. Effects of Partial Shading on Energy and Exergy Efficiencies for Photovoltaic Panels. J. Clean. Prod. 2017, 164, 58–69. [Google Scholar] [CrossRef]
  24. Said, S.A.M.; Hassan, G.; Walwil, H.M.; Al-Aqeeli, N. The Effect of Environmental Factors and Dust Accumulation on Photovoltaic Modules and Dust-Accumulation Mitigation Strategies. Renew. Sustain. Energy Rev. 2018, 82, 743–760. [Google Scholar] [CrossRef]
  25. Agyekum, E.B.; PraveenKumar, S.; Alwan, N.T.; Velkin, V.I.; Shcheklein, S.E. Effect of Dual Surface Cooling of Solar Photovoltaic Panel on the Efficiency of the Module: Experimental Investigation. Heliyon 2021, 7, e07920. [Google Scholar] [CrossRef] [PubMed]
  26. Praveenkumar, S.; Agyekum, E.B.; Alwan, N.T.; Mohammed, A.; Velkin, V.I.; Shcheklein, S.E. Experimental Assessment of Thermoelectric Cooling on the Efficiency of PV Module. Int. J. Renew. Energy Res. 2022, 12, 1670–1681. [Google Scholar]
  27. Praveenkumar, S.; Gulakhmadov, A.; Agyekum, E.B.; Alwan, N.T.; Velkin, V.I.; Sharipov, P.; Safaraliev, M.; Chen, X. Experimental Study on Performance Enhancement of a Photovoltaic Module Incorporated with CPU Heat Pipe—A 5E Analysis. Sensors 2022, 22, 6367. [Google Scholar] [CrossRef]
  28. PraveenKumar, S.; Agyekum, E.B.; Alwan, N.T.; Velkin, V.I.; Yaqoob, S.J.; Adebayo, T.S. Thermal Management of Solar Photovoltaic Module to Enhance Output Performance: An Experimental Passive Cooling Approach Using Discontinuous Aluminium Heat Sink. Int. J. Renew. Energy Res. 2021, 11, 1700–1712. [Google Scholar] [CrossRef]
  29. Agyekum, E.B.; Praveenkumar, S.; Alwan, N.T.; Velkin, V.I.; Adebayo, T.S. Experimental Study on Performance Enhancement of a Photovoltaic Module Using a Combination of Phase Change Material and Aluminum Fins—Exergy, Energy and Economic (3e) Analysis. Inventions 2021, 6, 69. [Google Scholar] [CrossRef]
  30. Agyekum, E.B.; Praveenkumar, S.; Alwan, N.T.; Velkin, V.I.; Shcheklein, S.E.; Yaqoob, S.J. Experimental Investigation of the Effect of a Combination of Active and Passive Cooling Mechanism on the Thermal Characteristics and Efficiency of Solar Pv Module. Inventions 2021, 6, 63. [Google Scholar] [CrossRef]
  31. Adinoyi, M.J.; Said, S.A.M. Effect of Dust Accumulation on the Power Outputs of Solar Photovoltaic Modules. Renew. Energy 2013, 60, 633–636. [Google Scholar] [CrossRef]
  32. Kimber, A.; Mitchell, L.; Nogradi, S.; Wenger, H. The Effect of Soiling on Large Grid-Connected Photovoltaic Systems in California and the Southwest Region of the United States. In Proceedings of the Conference Record of the 2006 IEEE 4th World Conference on Photovoltaic Energy Conversion, WCPEC-4, Waikoloa, HI, USA, 7–12 May 2007; Volume 2, pp. 2391–2395. [Google Scholar]
  33. Conceição, R.; González-Aguilar, J.; Merrouni, A.A.; Romero, M. Soiling Effect in Solar Energy Conversion Systems: A Review. Renew. Sustain. Energy Rev. 2022, 162, 112434. [Google Scholar] [CrossRef]
  34. Laarabi, B.; El Baqqal, Y.; Rajasekar, N.; Barhdadi, A. Updated Review on Soiling of Solar Photovoltaic Systems Morocco and India Contributions. J. Clean. Prod. 2021, 311, 127608. [Google Scholar] [CrossRef]
  35. Kazem, H.A.; Chaichan, M.T. The Effect of Dust Accumulation and Cleaning Methods on PV Panels’ Outcomes Based on an Experimental Study of Six Locations in Northern Oman. Sol. Energy 2019, 187, 30–38. [Google Scholar] [CrossRef]
  36. Ullah, A.; Amin, A.; Haider, T.; Saleem, M.; Butt, N.Z. Investigation of Soiling Effects, Dust Chemistry and Optimum Cleaning Schedule for PV Modules in Lahore, Pakistan. Renew. Energy 2020, 150, 456–468. [Google Scholar] [CrossRef]
  37. Chanchangi, Y.N.; Ghosh, A.; Baig, H.; Sundaram, S.; Mallick, T.K. Soiling on PV Performance Influenced by Weather Parameters in Northern Nigeria. Renew. Energy 2021, 180, 874–892. [Google Scholar] [CrossRef]
  38. Felipe A Mejia, J.K. Soiling Losses for Solar Photovoltaic Systems in California. Sol. Energy 2013, 95, 357–363. [Google Scholar] [CrossRef] [Green Version]
  39. WHO. Ambient Air Pollution: A Global Assessment of Exposure and Burden of Disease; WHO: Geneva, Switzerland, 2016. [Google Scholar]
  40. Kazem, H.A.; Chaichan, M.T. Experimental Analysis of the Effect of Dust’s Physical Properties on Photovoltaic Modules in Northern Oman. Sol. Energy 2016, 139, 68–80. [Google Scholar] [CrossRef]
  41. Ciaccioli, A.; Griffo, G.; Visconti, P.; Andria, G. Effects of Dust on Photovoltaic Measurements: A Comparative Study. Measurement 2017, 113, 181–188. [Google Scholar] [CrossRef]
  42. Khan, R.A.; Farooqui, S.A.; Khan, M.H. Dust Deposition on PV Module and Its Characteristics Dust Deposition on PV Module and Its. In The Effects of Dust and Heat on Photovoltaic Modules: Impacts and Solutions; Springer International Publishing: Cham, Switzerland, 2022; ISBN 9783030846350. [Google Scholar]
  43. Moutinho, H.R.; Jiang, C.; To, B.; Perkins, C.; Muller, M.; Simpson, L. Solar Energy Materials and Solar Cells Adhesion Mechanisms on Solar Glass: Effects of Relative Humidity, Surface Roughness, and Particle Shape and Size. Sol. Energy Mater. Sol. Cells 2017, 172, 145–153. [Google Scholar] [CrossRef]
  44. Al Shehri, A.; Parrott, B.; Carrasco, P.; Al Saiari, H.; Taie, I. Impact of Dust Deposition and Brush-Based Dry Cleaning on Glass Transmittance for PV Modules Applications. Sol. Energy 2016, 135, 317–324. [Google Scholar] [CrossRef]
  45. Yilbas, B.S.; Ali, H.; Al-Aqeeli, N.; Khaled, M.M.; Said, S.; Abu-Dheir, N.; Merah, N.; Youcef-Toumi, K.; Varanasi, K.K. Characterization of Environmental Dust in the Dammam Area and Mud After-Effects on Bisphenol-A Polycarbonate Sheets. Sci. Rep. 2016, 6, 1–14. [Google Scholar] [CrossRef] [PubMed] [Green Version]
  46. Fares, E.; Buffiere, M.; Figgis, B.; Haik, Y.; Isaifan, R.J. Soiling of Photovoltaic Panels in the Gulf Cooperation Council Countries and Mitigation Strategies. Sol. Energy Mater. Sol. Cells 2021, 231, 111303. [Google Scholar] [CrossRef]
  47. Yilbas, B.S.; Hassan, G.; Ali, H.; Al-aqeeli, N. Environmental Dust Effects on Aluminum Surfaces in Humid Air Ambient. Nat. Publ. Group 2017, 1–12. [Google Scholar] [CrossRef] [PubMed] [Green Version]
  48. Rehman, S.; Bader, M.A.; Al-Moallem, S.A. Cost of Solar Energy Generated Using PV Panels. Renew. Sustain. Energy Rev. 2007, 11, 1843–1857. [Google Scholar] [CrossRef]
  49. GeoModel Solar. Validation of SolarGIS GHI and DNI Data for the Kingdom of Saudi Arabia; GeoModel Solar: Bratislava, Slovakia, 2013. [Google Scholar]
  50. Hepbasli, A.; Alsuhaibani, Z. A Key Review on Present Status and Future Directions of Solar Energy Studies and Applications in Saudi Arabia. Renew. Sustain. Energy Rev. 2011, 15, 5021–5050. [Google Scholar] [CrossRef]
  51. Tanaka, T.Y.; Chiba, M. A Numerical Study of the Contributions of Dust Source Regions to the Global Dust Budget. Glob. Planet. Chang. 2006, 52, 88–104. [Google Scholar] [CrossRef]
  52. Butt, M.J.; Mashat, A.S. MODIS Satellite Data Evaluation for Sand and Dust Storm Monitoring in Saudi Arabia. Int. J. Remote Sens. 2018, 1–19. [Google Scholar] [CrossRef]
  53. Villiers, D.; Heerden, V. Dust Storms and Dust at Abu Dhabi International Airport. Weather 2007, 62, 339–343. [Google Scholar] [CrossRef] [Green Version]
  54. Arishi, A.A. Classification of Sandstorms in Saudi Arabia. Atmos. Clim. Sci. 2021, 11, 177–193. [Google Scholar] [CrossRef]
  55. Labban, A.H.; Butt, M.J. Analysis of Sand and Dust Storm Events over Saudi Arabia in Relation with Meteorological Parameters and ENSO. Arab. J. Geosci. 2021, 14, 22. [Google Scholar] [CrossRef]
  56. Notaro, M.; Alkolibi, F.; Fadda, E.; Bakhrjy, F. Trajectory Analysis of Saudi Arabian Dust Storms. J. Geophys. Res. Atmos. 2013, 118, 6028–6043. [Google Scholar] [CrossRef]
  57. Ilse, K.K.; Figgis, B.W.; Naumann, V.; Hagendorf, C.; Csp, S.; Saale, H. Fundamentals of Soiling Processes on Photovoltaic Modules. Renew. Sustain. Energy Rev. 2018, 98, 239–254. [Google Scholar] [CrossRef]
  58. Said, S.A.M. Effects of Dust Accumulation on Performances of Thermal and Photovoltaic Flat-Plate Collectors. Appl. Energy 1990, 37, 73–84. [Google Scholar] [CrossRef]
  59. Said, S.A.M.; Walwil, H.M. Fundamental Studies on Dust Fouling Effects on PV Module Performance. Sol. Energy 2014, 107, 328–337. [Google Scholar] [CrossRef]
  60. Jones, R.K.; Baras, A.; Al Saeeri, A.; Al Qahtani, A.; Al Amoudi, A.O.; Al Shaya, Y.; Alodan, M.; Al-Hsaien, S.A. Optimized Cleaning Cost and Schedule Based on Observed Soiling Conditions for Photovoltaic Plants in Central Saudi Arabia. IEEE J. Photovolt. 2016, 6, 730–738. [Google Scholar] [CrossRef]
  61. Ibrahim, A. Effect of Shadow and Dust on the Performance of Silicon Solar Cell Effect of Shadow and Dust on the Performance of Silicon Solar Cell. J. Basic Appl. Sci. Res. 2011, 1, 222–230. [Google Scholar]
  62. Benghanem, M.; Almohammedi, A.; Taukeer Khan, M.; Al-Masraqi, A. Effect of Dust Accumulation on the Performance of Photovoltaic Panels in Desert Countries: A Case Study for Madinah, Saudi Arabia. Int. J. Power Electron. Drive Syst. (IJPEDS) 2018, 9, 1356. [Google Scholar] [CrossRef]
  63. Khayyat, A.M.Z.; Alharthi, A.H.; Almohammadi, F.L.; Almarwani, Z.S.; Kannan, N.; Mobarak, Y. The Soiling Impact Effects on the Performance of the Solar Panels in Rabigh, Saudi Arabia. Adv. Comput. Intell. Technol. 2022, 914, 429–440. [Google Scholar] [CrossRef]
  64. John, J.J.; Warade, S.; Tamizhmani, G.; Kottantharayil, A. Study of Soiling Loss on Photovoltaic Modules with Artificially Deposited Dust of Different Gravimetric Densities and Compositions Collected from Different Locations in India. IEEE J. Photovolt. 2016, 6, 236–243. [Google Scholar] [CrossRef]
  65. Kazmerski, L.L.; Al Jardan, M.; Al Jnoobi, Y.; Al Shaya, Y.; John, J.J. Ashes to Ashes, Dust to Dust: Averting a Potential Showstopper for Solar Photovoltaics. In Proceedings of the 2014 IEEE 40th Photovoltaic Specialist Conference, PVSC 2014, Denver, CO, USA, 8–13 June 2014; pp. 187–192. [Google Scholar]
  66. Mehmood, U.; Al-Sulaiman, F.A.; Yilbas, B.S. Characterization of Dust Collected from PV Modules in the Area of Dhahran, Kingdom of Saudi Arabia, and Its Impact on Protective Transparent Covers for Photovoltaic Applications. Sol. Energy 2017, 141, 203–209. [Google Scholar] [CrossRef]
  67. Engelbrecht, J.P.; Mcdonald, E.V.; Gillies, J.A.; Jayanty, R.K.M.; Gertler, A.W. Characterizing Mineral Dusts and Other Aerosols from the Middle East—Part 1: Ambient Sampling. Inhal. Toxicol. 2009, 21, 297–326. [Google Scholar] [CrossRef] [PubMed]
  68. Shenouda, R.; Kandil, H.A. A Review of Dust Accumulation on PV Panels in the MENA and the Far East Regions. J. Eng. Appl. Sci. 2022, 69, 8. [Google Scholar] [CrossRef]
  69. Chanchangi, Y.N.; Ghosh, A.; Sundaram, S.; Mallick, T.K. Dust and PV Performance in Nigeria: A Review. Renew. Sustain. Energy Rev. 2020, 121, 109704. [Google Scholar] [CrossRef]
  70. Picotti, G.; Borghesani, P.; Cholette, M.E.; Manzolini, G. Soiling of Solar Collectors—Modelling Approaches for Airborne Dust and Its Interactions with Surfaces. Renew. Sustain. Energy Rev. 2017, 81, 2343–2357. [Google Scholar] [CrossRef]
  71. Juzaili, W.; Abdul, H.; Shaari, S.; Salam, Z. Performance Degradation of Photovoltaic Power System: Review on Mitigation Methods. Renew. Sustain. Energy Rev. 2017, 67, 876–891. [Google Scholar] [CrossRef]
  72. Gupta, V.; Sharma, M.; Kumar, R.; Babu, K.N.D. Comprehensive Review on Effect of Dust on Solar Photovoltaic System and Mitigation Techniques. Sol. Energy 2019, 191, 596–622. [Google Scholar] [CrossRef]
  73. Sarver, T.; Al-qaraghuli, A.; Kazmerski, L.L. A Comprehensive Review of the Impact of Dust on the Use of Solar Energy: History, Investigations, Results, Literature, and Mitigation Approaches. Renew. Sustain. Energy Rev. 2013, 22, 698–733. [Google Scholar] [CrossRef]
  74. Ghazi, S.; Sayigh, A.; Ip, K. Dust Effect on Flat Surfaces—A Review Paper. Renew. Sustain. Energy Rev. 2014, 33, 742–751. [Google Scholar] [CrossRef]
  75. Deb, D.; Brahmbhatt, N.L. Review of Yield Increase of Solar Panels through Soiling Prevention, and a Proposed Water-Free Automated Cleaning Solution. Renew. Sustain. Energy Rev. 2017, 82, 3306–3313. [Google Scholar] [CrossRef]
  76. Hudedmani, M.G.; Joshi, G.; Umayal, R.M.; Revankar, A. A Comparative Study of Dust Cleaning Methods for the Solar PV Panels. Adv. J. Grad. Res. 2017, 1, 24–29. [Google Scholar] [CrossRef]
  77. Lu, H.; Lu, L.; Wang, Y. Numerical Investigation of Dust Pollution on a Solar Photovoltaic ( PV ) System Mounted on an Isolated Building. Appl. Energy 2016, 180, 27–36. [Google Scholar] [CrossRef]
  78. BOSON Dust Shall Never Shade the Brightness. Available online: https://bosonrobotics.com/en/products/robot (accessed on 14 September 2022).
  79. Israar Israar. Available online: https://www.israar.com/PVCleaningMachine.php#overview (accessed on 28 September 2022).
  80. Kumar, N.M.; Sudhakar, K.; Samykano, M.; Jayaseelan, V. On the Technologies Empowering Drones for Intelligent Monitoring of Solar Photovoltaic Power Plants. Procedia Comput. Sci. 2018, 133, 585–593. [Google Scholar] [CrossRef]
  81. Gallardo-Saavedra, S.; Hernández-Callejo, L.; Duque-Perez, O. Technological Review of the Instrumentation Used in Aerial Thermographic Inspection of Photovoltaic Plants. Renew. Sustain. Energy Rev. 2018, 93, 566–579. [Google Scholar] [CrossRef]
  82. Al-Housani, M.; Bicer, Y.; Koç, M. Experimental Investigations on PV Cleaning of Large-Scale Solar Power Plants in Desert Climates: Comparison of Cleaning Techniques for Drone Retrofitting. Energy Convers. Manag. 2019, 185, 800–815. [Google Scholar] [CrossRef]
  83. Cleandrone Cleandrone. Available online: http://www.cleandrone.com/cleandrone-2/ (accessed on 17 September 2022).
  84. Dronevolt Dronevolt. Available online: https://www.dronevolt.com/en/expert-solutions/hercules-10-spray/# (accessed on 17 September 2022).
  85. Aerial Power Aerial Power. Available online: https://www.aerialpower.com/ (accessed on 17 September 2022).
  86. Williams, R.B.; Tanimoto, R.; Simonyan, A.; Fuerstenau, S. Vibration Characterization of Self-Cleaning Solar Panels with Piezoceramic Actuation. In Proceedings of the Structural Dynamics and Materials Conference, Honolulu, HI, USA, 23–26 April 2007; p. 512. [Google Scholar]
  87. Indiamart Solar Panels—Super Hydrophobic Coating. Available online: https://www.indiamart.com/proddetail/solar-panels-super-hydrophobic-coating-one-kit-good-for-50-panel-2-mtr-x-1-mtr-22056797862.html (accessed on 18 September 2022).
  88. Drelich, J.; Chibowski, E.; Meng, D.D.; Terpilowski, K. Hydrophilic and Superhydrophilic Surfaces and Materials. Soft Matter 2011, 7, 9804–9828. [Google Scholar] [CrossRef]
  89. Bǎlţatu, M.S.; Vizureanu, P.; Bǎlan, T.; Lohan, M.; Ţugui, C.A. Preliminary Tests for Ti-Mo-Zr-Ta Alloys as Potential Biomaterials. IOP Conf. Ser. Mater. Sci. Eng. 2018, 374, 012023. [Google Scholar] [CrossRef]
  90. Nishimoto, S.; Bharat, B. Bioinspired Self-Cleaning Surfaces with Superhydrophobicity, Superoleophobicity, and Superhydrophilicity. RSC Adv. 2013, 3, 671–690. [Google Scholar] [CrossRef]
  91. Mazumder, M.; Horenstein, M.N.; Stark, J.W.; Girouard, P.; Sumner, R.; Henderson, B.; Sadder, O.; Hidetaka, I.; Biris, A.S.; Sharma, R. Characterization of Electrodynamic Screen Performance for Dust Removal from Solar Panels and Solar Hydrogen Generators. IEEE Trans. Ind. Appl. 2013, 49, 1793–1800. [Google Scholar] [CrossRef]
  92. Kawamoto, H. Improved Detachable Electrodynamic Cleaning System for Dust Removal from Soiled Photovoltaic Panels. J. Electrost. 2020, 107, 103481. [Google Scholar] [CrossRef]
  93. Al-Jawah, M. A Decision Aiding Framework for Investing in Cleaning Systems for Solar Photovoltaic (PV) Power Plants in Arid Regions. Ph.D. Thesis, George Washington University, Washington, DC, USA, 2014. [Google Scholar]
  94. KFUPM Forum|Effects of Soiling on Solar Energy Applications: Challenges and Mitigation Techniques. Available online: https://www.youtube.com/watch?v=-TF5UF7h2oA (accessed on 25 September 2022).
  95. ACWA SUDAIR PV IPP. Available online: https://acwapower.com/en/projects/sudair-pv-ipp/ (accessed on 24 September 2022).
Figure 1. Annual solar PV capacity additions by application segment, 2015–2022 Source: IEA, Annual solar PV capacity additions by application segment, 2015–2022, IEA, Paris https://www.iea.org/data-and-statistics/charts/annual-solar-pv-capacity-additions-by-application-segment-2015-2022, (accessed on 1 October 2022). IEA. License: CC BY 4.0 [2].
Energies 15 08033 g001
Figure 2. The current status of Saudi Arabia’s solar PV projects, along with their respective power capacities.
Energies 15 08033 g002
Figure 3. Modeled annual median PM2.5 concentrations, as shown on a map of the world, in µg/m3 Reprinted from WHO, Ambient Air Pollution: A Global Assessment of Exposure and Burden of Disease, WHO, Exposure to ambient air pollution, 33, Copyright (2022) with permission from WHO [39].
Energies 15 08033 g003
Figure 4. Dust accumulation life cycle and interrelated factors.
Energies 15 08033 g004
Figure 5. The annual average of global horizontal irradiance. Reprinted from Solar resource maps of Saudi Arabia, The World Bank, Source: Global Solar Atlas 2.0, Solar resource data: Solargis, Copyright (2022), (CC BY 4.0) [49].
Energies 15 08033 g005
Figure 6. Soiling and its consequence on transmittance over one week of exposure. Reprinted from Solar Energy, 135, Al Shehri A et al., Impact of dust deposition and brush-based dry cleaning on glass transmittance for PV modules applications, 320., Copyright (2016), with permission from Elsevier [44].
Energies 15 08033 g006
Figure 7. Normalized weekly maximum power output of dusty modules. Reprinted from Solar Energy, 107, Said, Syed A.M. et al., Fundamental studies on dust fouling effects on PV module performance, 331., Copyright (2014), with permission from Elsevier [59].
Energies 15 08033 g007
Figure 8. At noon, the I-V curves of the dusty and clean modules. Reprinted from Solar Energy, 107, Said, Syed A.M. et al., Fundamental studies on dust fouling effects on PV module performance, 332., Copyright (2014), with permission from Elsevier [59].
Energies 15 08033 g008
Figure 9. Dust deposition with tilt angle for various exposure periods. Reprinted from Solar Energy, 107, Said, Syed A.M. et al., Fundamental studies on dust fouling effects on PV module performance, 333., Copyright (2014), with permission from Elsevier [59].
Energies 15 08033 g009
Figure 10. The Soiling loss of different PV technologies after 30-day exposure shows a strong seasonal dependence [60].
Energies 15 08033 g010
Figure 11. Monthly dust accumulation weight on horizontal and tilted glass (tilt angle of 15°) [60].
Energies 15 08033 g011
Figure 12. Daily peak power output (monthly averaged). Reprinted from Renewable Energy, 60, Adinoyi M. et al., Effect of dust accumulation on the power outputs of solar photovoltaic modules, 634., Copyright (2013), with permission from Elsevier [31].
Energies 15 08033 g012
Figure 13. The hourly power output of the solar tracker versus fixed stand. Reprinted from Renewable Energy, 60, Adinoyi M. et al., Effect of dust accumulation on the power outputs of solar photovoltaic modules, 635., Copyright (2013), with permission from Elsevier [31].
Energies 15 08033 g013
Figure 14. Size distribution of the dust sample. Reprinted from Solar Energy, 141, Mehmood U. et al., Characterization of dust collected from PV modules in the area of Dhahran, Kingdom of Saudi Arabia, and its impact on protective transparent covers for photovoltaic applications, 205., Copyright (2017), with permission from Elsevier [66].
Energies 15 08033 g014
Figure 15. SEM images of dust samples: (a) dust sizes (b) Adhesion to large particles, and (c) Flake-like particles. Reprinted from Solar Energy, 141, Mehmood U. et al., Characterization of dust collected from PV modules in the area of Dhahran, Kingdom of Saudi Arabia, and its impact on protective transparent covers for photovoltaic applications, 205., Copyright (2017), with permission from Elsevier [66].
Energies 15 08033 g015
Figure 16. Dust mitigation techniques [69].
Energies 15 08033 g016
Figure 17. Manual cleaning [76].
Energies 15 08033 g017
Figure 18. Solar cleaning robot [78].
Energies 15 08033 g018
Figure 19. Tractor-mounted hydraulic arm [79].
Energies 15 08033 g019
Figure 20. Solar panels cleaning using a spray drone [84].
Energies 15 08033 g020
Figure 21. Super Hydrophobic Coating on PV panel [87].
Energies 15 08033 g021
Figure 22. Contact angle for hydrophilic and hydrophobic planes. Source: IOP Conference Series: Materials Science and Engineering, Preliminary Tests for Ti-Mo-Zr-Ta Alloys as Potential Biomaterials, IPO, DOI: 10.1088/1757-899X/374/1/012023, IPO. License: CC BY 3.0 [89].
Energies 15 08033 g022
Figure 23. Electrodynamic screen cross-section view. Reprinted from Renewable and Sustainable Energy Reviews, 22, Sarver T. et al., A comprehensive review of the impact of dust on the use of solar energy: History, investigations, results, literature, and mitigation approaches, 698-733., Copyright (2013), with permission from Elsevier [73].
Energies 15 08033 g023
Publisher’s Note: MDPI stays neutral with regard to jurisdictional claims in published maps and institutional affiliations.

