Article

Connectedness Between Green Financial and Cryptocurrency Markets: A Multivariate Analysis Using TVP-VAR Model and Wavelet-Based VaR Analysis

by
Lamia Sebai
and
Yasmina Jaber
*
RED-Lab, Higher Institute of Management, University of Gabès, Jilani Habib Street, Gabès 6002, Tunisia
*
Author to whom correspondence should be addressed.
J. Risk Financial Manag. 2025, 18(9), 483; https://doi.org/10.3390/jrfm18090483
Submission received: 24 July 2025 / Revised: 21 August 2025 / Accepted: 22 August 2025 / Published: 29 August 2025
(This article belongs to the Section Mathematics and Finance)

Abstract

This paper examines the interconnection and wavelet coherence between the green cryptocurrency market and the green conventional market, utilizing daily data. The research period covers 1 July 2020 to 30 September 2024. Employing the time-varying parametric vector autoregression (TVP-VAR) model and wavelet coherence analysis, we capture both short- and long-term spillovers across markets. The results show that cryptocurrencies, particularly Binance and Litecoin, act as dominant transmitters of volatility and return shocks, while green conventional indices function mainly as receivers with strong self-dependence. Spillover intensity is highly time-varying, with peaks during periods of systemic stress, particularly during the COVID-19 pandemic, and troughs indicating diversification opportunities. These findings advance the literature on systemic risk and portfolio design by showing that crypto assets can simultaneously amplify vulnerabilities and enhance diversification when combined with green finance instruments. For policy, the results highlight the need for regulatory frameworks that integrate sustainability taxonomies, mandate environmental disclosures for digital assets, and incentivize energy-efficient blockchain adoption to align crypto markets with sustainable finance objectives. This research enhances our understanding of the interrelationship between green investments and cryptocurrencies, providing valuable insights for investors and policymakers on risk management and diversification strategies in an increasingly sustainable financial landscape.

1. Introduction

Climate change has heightened interest in green investments, crucial for risk management and diversification. Patel et al. (2023) emphasize the media’s vital role in shaping investors’ attitudes and preferences. Similarly, Umar et al. (2024) and Yousaf et al. (2024) demonstrate that public attention influences asset pricing and investment decisions, highlighting the significance of these dynamics in shaping financial strategies. In this context, climate change and environmental issues, have become pressing global concerns. Zhang et al. (2022) identify key areas of green finance: stocks, bonds, IPOs, loans, risk management, and governance. Recent studies show that public mood and environmental awareness influence sustainable investments.
Mensi et al. (2023) explore quantile connectedness between eight green bonds and the S&P 500, observing strong connectivity during crises, primarily from energy and resource markets. Wu and Qin (2024) reveal asymmetric volatility transmissions between new energy and ESG sectors post-COVID-19, with ESG and green bond markets acting as key net volatility transmitters. Ben Ameur et al. (2024) emphasize the advantages of portfolio optimization, demonstrating the superiority of clean energy and green bonds. Additionally, the literature shows that Bitcoin can serve as a diversifier, hedge, or safe haven compared to traditional assets (Duan et al., 2023; Conlon & McGee, 2020; Dutta et al., 2020). Mensi et al. (2022) recommend using green investments for portfolio diversification and hedging. According to Huang et al. (2022), green bonds are both a strong safe haven and a robust hedge for the crude oil market. In contrast, Yousaf et al. (2024) found that the connectedness between crude oil and green bonds is weak in the short and long run. Green bonds are elements of a portfolio that enhance the green transition. Chopra and Mehta (2023) demonstrate that green bonds are essential elements of a portfolio, strengthening the green transition and serving as a strong safe haven for high-emission sectors. Meanwhile, Cepni et al. (2022) affirm their effectiveness as a haven against climate uncertainty. Özkan et al. (2024) find that green investments serve as havens and hedges, providing valuable insights for effective portfolio diversification and sustainable investment strategies. The growing interest in blockchain for ecological sustainability highlights its potential as a foundation for energy record-keeping systems (De Villiers et al., 2021; Patel et al., 2024).
In recent years, the concept of “green cryptocurrency” has emerged to describe digital assets that operate with significantly lower energy consumption and carbon emissions than traditional proof-of-work blockchains such as Bitcoin. In this study, we define green cryptocurrencies as those that have implemented, or committed to, energy-efficient consensus mechanisms and sustainability-oriented initiatives, in line with definitions found in both academic literature and industry reports (Truby, 2018). Ethereum, for example, transitioned from proof of work to proof of stake in September 2022, reducing its energy use by approximately 99.95% (Truby, 2018). Binance has launched sustainability programs, including carbon-offset partnerships, Litecoin has introduced technical updates to enhance transaction efficiency (Lee et al., 2021), and XRP employs a consensus protocol with minimal energy consumption compared to proof-of-work systems (Sedlmeir et al., 2020).
The primary objective of this study is to examine the connectivity between green financial markets and cryptocurrency markets using advanced techniques, specifically the TVP-VAR model and wavelet-based VaR analysis. The research aims to analyze how the relationships between green assets and cryptocurrencies evolve, particularly during periods of stress, such as the COVID-19 pandemic. It also evaluates the risk and volatility spillovers between these markets and explores investment strategies that optimize the connectivity between green investments and cryptocurrencies, focusing on diversification and risk management.
This study significantly contributes to the literature in several key ways. Firstly, utilizing the TVP-VAR model and wavelet-based VaR analysis, it establishes a robust framework for examining the dynamic interactions between green financial markets and cryptocurrencies, a largely underexplored area. The findings enhance the understanding of how these assets interact, particularly amid rising investor interest in sustainable investments, which is vital for both investors and regulators. Additionally, the insights will inform policymakers on the regulatory frameworks necessary to support green financial markets while managing cryptocurrency risks. Finally, the research offers practical recommendations for portfolio managers on effectively integrating green investments and cryptocurrencies, especially during economic uncertainty. By addressing these points, this study aims to fill critical gaps in the literature and provide valuable insights for stakeholders in green finance and cryptocurrency.
Furthermore, our analysis includes a comparison of selected cryptocurrencies with sustainable financial indices. Specifically, we examined Binance alongside the Dow Jones Sustainability World Developed Index, Ethereum with the Dow Jones Sustainability Emerging Markets Index, Litecoin in relation to the NASDAQ OMX Wind Index, and XRP paired with the NASDAQ OMX Solar Index. This comparison underscores the evolving relationship between digital assets and sustainable investment benchmarks, revealing how these cryptocurrencies align with the principles of sustainable finance.
These findings highlight the interconnectedness of cryptocurrencies and sustainable financial indices, particularly in the context of increasing investor interest in sustainable practices. As the market for green investments continues to grow, understanding these relationships becomes essential for both investors and regulators aiming to navigate this dynamic landscape. Our research offers practical insights for portfolio managers on integrating these cryptocurrencies with sustainable indices, emphasizing the importance of diversification and risk management. By addressing these connections, this study aims to enrich the existing literature and provide valuable guidance for stakeholders in both the cryptocurrency and green finance sectors.
The remaining sections of the study are organized as follows: Section 1 provides a literature review, Section 2 outlines the research data and empirical frameworks, Section 3 presents the results and analysis, and Section 4 summarizes the key findings along with their policy implications.

2. Literature Review

Interest in cryptocurrency investment has significantly increased, similar to green investments, as a fundamental investment concept. As the cryptocurrency market continues to grow, the impact of the cryptocurrency index on other financial assets has become a major concern for investors and regulators (Bohte & Rossini, 2019; Umar et al., 2024). Previous research has shown that the correlations between cryptocurrencies and financial assets can vary over time (Zeng et al., 2025), along with dynamic relationships among these assets during periods of market stress (Corbet et al., 2021; Caferra & Vidal-Tomás, 2021). Moreover, during the COVID-19 pandemic, a dynamic link between cryptocurrency markets and financial markets was observed (Zeng et al., 2025). However, the relationship between the cryptocurrency index and factors such as energy consumption and sustainability remains highly controversial.
The literature also examines Bitcoin’s properties as a hedge or haven, often compared to gold (Baur & Hoang, 2021; Klein et al., 2018), with notable differences in volatility (Smales, 2019). Cryptocurrencies are studied in terms of stocks (Bouri et al., 2020) and commodities less frequently (Urquhart & Zhang, 2019). Yousaf et al. (2021) showed volatility spillovers between Bitcoin and oil before the pandemic but not during it. Other studies highlight diversification opportunities between cryptocurrencies and sectoral stocks (Patel et al., 2023) and the impact of cryptocurrency uncertainty on gold markets (Elsayed et al., 2022).
Gallersdörfer et al. (2020) explain that Bitcoin and Ethereum use energy-intensive proof of work, while “green” cryptocurrencies rely on more efficient algorithms like proof of stake. Patel et al. (2024) provide additional insights into this concept. Ren and Lucey (2022) distinguish between “clean” and “dirty” cryptocurrencies based on their energy consumption. They find that clean energy assets do not effectively hedge dirty cryptocurrencies, as correlations are generally positive. “Green” cryptocurrencies use energy-efficient algorithms, such as proof of stake and Ripple. These green cryptocurrencies are employed by different industries for various projects.
Pourkermani (2024) investigates Value-at-Risk (VaR) estimation using binary response models. The study demonstrates how classification-based approaches can effectively model the probability of extreme losses in financial markets, providing an alternative to traditional parametric or historical VaR methods. This methodology offers robust risk assessment and can be applied to diverse asset classes, including cryptocurrencies and green financial instruments, highlighting its relevance for studies on market risk and spillovers. Li et al. (2025) examine the value of financial data by analyzing analyst forecasts, showing how forecast accuracy impacts market pricing and investment decisions. Their findings highlight the importance of high-quality information in shaping asset returns and risk assessments.
Zeng et al. (2025) find that post-COVID-19, there is a stronger connectedness between green bonds and cryptocurrencies, with both being net receivers of spillovers. Patel et al. (2023) examine the spillovers between green–dirty cryptocurrencies and socially responsible investments (SRI) during the war in Ukraine. They see notable changes in connectivity and asset roles before and during the conflict, with Ethereum playing a key role in transmitting shocks. According to Patel et al. (2024), portfolio managers should not consider green and dirty cryptocurrencies as comparable assets during a crisis, as their behaviors differ. In a recent study, Esparcia et al. (2024) demonstrate that integrating green cryptocurrencies like Cardano into equity portfolios provides short-term diversification benefits, while stablecoins such as Tether serve as effective safe-haven assets for long-term strategies.
Patel et al. (2024) investigate the connectedness among green investments, NFTs, DeFi, and green cryptocurrencies, emphasizing the portfolio diversification and hedging potential of green investments relative to other assets. Utilizing Quantile VAR and Wavelet Quantile Correlation methods, their analysis uncovers a partial connectedness influenced by global uncertainties stemming from COVID-19 and the Russia–Ukraine war.
Özkan et al. (2024) analyze the dynamic connectedness among clean energy, green, and sustainable markets, highlighting the influence of climate policy uncertainty. Using a novel Quantile Connectedness approach, they find significant interconnections: clean energy markets act as net transmitters of shocks, green markets as net receivers, and sustainable markets serve both roles.
Ali et al. (2024) explore the connectedness between green cryptocurrencies as an alternative investment and conventional equity markets. Their findings indicate significant interconnectedness between G7 stock markets and green cryptocurrencies, with G7 markets functioning as net transmitters of these spillovers while green cryptocurrencies act as net recipients. During the COVID-19 pandemic, green crypto showed increased vulnerability, but adding it to portfolios can enhance diversification, particularly during market stress.
However, these studies often focus only on cryptocurrencies or green financial indices and use static models. Our study combines TVP-VAR connectedness with wavelet coherence to capture time-varying spillovers across both green cryptocurrencies and sustainable markets. This enables the identification of risk transmitters and receivers over time, providing actionable insights for portfolio allocation and regulatory monitoring, and offering a novel perspective on systemic risk in green digital finance.
Based on these findings, integrating green finance with cryptocurrency markets requires a strong regulatory framework that encourages innovation while prioritizing sustainability. Such frameworks should include clear environmental taxonomy standards, mandatory reporting of digital asset carbon footprints, and incentives for adopting energy-efficient consensus mechanisms like proof-of-stake or other low-emission methods. This is especially important given the ongoing debate over the environmental effects of cryptocurrencies, where energy-heavy “dirty” assets based on proof of work contrast with “green” cryptocurrencies using more sustainable protocols. Creating classification systems to differentiate between sustainable and non-sustainable crypto assets would help align them with green investment principles, enable investors to make informed decisions, and assist policymakers in developing markets that are both financially sound and environmentally responsible.

3. Methodology and Data

Our study uses two complementary approaches to understand how green cryptocurrencies and sustainable financial markets interact over time. First, we apply the time-varying parameter vector autoregressive (TVP-VAR) connectedness method. This is a statistical model that can track how shocks in one market spill over to others, and how these relationships evolve over time. It tells us whether a market is mainly a transmitter (sending shocks to others) or a receiver (absorbing shocks from others), and how interconnected the entire system is at any point in time. Second, we use wavelet coherence analysis. This technique looks at how two markets move together, not just over time, but also across different investment horizons, short term, medium term, and long term. It also shows whether one market tends to lead or lag the other during periods of high or low correlation. By combining these methods, we capture both dynamic spillover patterns and multi-horizon co-movements, giving a richer picture of market interlinkages than using either method alone.

3.1. TVP-VAR Connectedness Method

In line with a recent study by Antonakakis et al. (2020), we use the TVP-VAR framework to analyze the interactions between critical variables. We implement the TVP-VAR model and the Bayesian Information Criterion (BIC), as shown in the following equation:
x t =   Q t   x t 1 +   ε t ε t       ~ N 0 , U t
v e c Q t = v e c φ t 1 + ρ t , ρ t     ~ N 0 , t
In this context, x t , ε t , and ρ t are N × 1 vectors, while U t and Q t are N × N matrices of two dimensions. We then employ the Generalized Forecast Error Variance Decomposition (GFEVD), which quantifies the variance attributed to asset i from asset j , as captured by the following formula:
φ i j , t g J   =   U i i , t t = 1 J 1 Z i A t U t Z j 1 2 J = 1 N t = 1 J 1 Z i U t A t Z j
φ ~ i j , t g J = φ i j , t g J j = 1 N φ i j , t g J
where Z j represents a zero vector uniformly positioned at j = 1 N φ i j , t g J and j = 1 N φ i j , t g J = N .
The total connectedness index (TCI) quantifies the interdependence among the variables.
T C I t g   J =   i . j = 1 , i # j N φ ~ i j , t g J i . J = 1 N φ i j , t g J
Specifically, the total connectedness index (TCI) measures the average (non-diagonal) spillover effect of a given asset on all other assets, reflecting the influence of variable i on all other variables j This can be represented as
C I i j t g J =   j = 1 , i # j N φ ~ j i t g J
C I i i t g J =   j = 1 , i # j N φ ~ j i t g J
The net value of total directional connectedness is obtained by calculating the difference between C I i j t g J and C I i i t g J   . We utilize the following formula:
C I i t g J = C I i j t g J C I i j t g J  
The TVP-VAR model was estimated using a Normal-Wishart prior with the lag order selected by BIC. The MCMC sampler ran for 20,000 iterations, discarding the first 5000 as burn-in, and convergence was verified using Geweke and cumulative distribution diagnostics. The time-varying coefficients were controlled via state evolution variances, which determine the degree of stochastic drift, and the random wandering variance was set following standard literature guidelines (Antonakakis et al., 2020).

3.2. Wavelet Coherence

The study examines the leading lag and correlations of prices between different markets by employing a method that incorporates both frequency and time-domain relationships of the time series. We adopt the wavelet coherence approach. Specifically, we define the crossed wavelet transform (CWT), introduced by Torrence and Compo (1998), which can be expressed through two time series,
N a b p , q = N a p , q N b p , q
Here, N a p , q and N b p , q denote the continuous transformation of the two-time series of a t and b t . The variable p represents the position index, while q indicates the evaluation parameter.
The complex coherence is represented by . We will apply the cross-wavelet transform to measure the wavelet power, denoted as N a p , q . The cross-wavelet power spectrum can be analyzed in the time domain with respect to frequency, allowing us to highlight unexpected and significant changes in the co-movement patterns of the variables. Torrence and Webster (1999) proposed an adjusted formula for the wavelet coherence coefficient, which is expressed as follows:
W 2 p , q = M M 1 N a b p , q 2 M M 1 N a p , q 2 M M 1 N b p , q 2
where M represents the smoothing mechanism, and the formula is as follows 0 W 2 p , q 1 , which indicates the squared range of the wavelet coherence coefficients. A value of W 2 p , q suggests a lower correlation, while a value closer to 1 indicates a stronger correlation.

3.3. Data

Our study uses daily closing prices for selected green cryptocurrencies and sustainable financial indices from 1 January 2020, to 30 September 2024, downloaded from Investing.com (https://www.investing.com/ accessed on 1 January 2020) on 10 October 2024. The cryptocurrencies include Binance, Ethereum, Litecoin, and XRP, with the CCI30 Index serving as a benchmark. Sustainable financial indices consist of the Dow Jones Sustainability World Developed Index, the Dow Jones Sustainability Emerging Markets Index, the NASDAQ OMX Wind Index, and the NASDAQ OMX Solar Index. To address time-zone differences, all timestamps were converted to Coordinated Universal Time (UTC), and cryptocurrency prices were aligned with the official daily closing times of the green indices. Missing cryptocurrency observations were filled by linear interpolation, while non-trading days for indices were handled by carrying forward the last available value to preserve continuity. To ensure consistency across series, missing values and non-trading days were forward-filled, and all series were converted into daily logarithmic returns using rt = ln(Pt) − ln(Pt−1), where Pt denotes the closing price on day t. These return series were then used as inputs for the TVP-VAR and wavelet coherence analyses.
The selected sample of cryptocurrencies and sustainable financial indices considered in the study:
CryptocurrenciesSustainable Financial Indices
1BinanceDow Jones Sustainability World Developed IndexCCI30 Index
2EthereumDow Jones Sustainability Emerging Markets Index
3LitecoinNASDAQ OMX Wind Index
4XRPNASDAQ OMX Solar Index
We examine Bitcoin, Ethereum, Binance Coin, and Litecoin as they are among the largest and most liquid cryptocurrencies, ensuring relevance for systemic risk analysis. Their selection reflects not only market importance but also technological diversity, since they rely on different consensus mechanisms (proof of work, proof of stake, and delegated proof of stake). This heterogeneity allows us to capture variations in risk transmission linked to energy efficiency and sustainability. Moreover, their distinct roles within the crypto ecosystem (store of value, smart contract platform, exchange utility token, and medium of exchange) provide a comprehensive view of interconnections with sustainability indices.

4. Empirical Results

4.1. Preliminary Analysis

Figure 1 illustrates the daily realized prices for each market from 2020 to 2024, highlighting these trends and fluctuations. During the COVID-19 pandemic, markets experienced increased volatility, especially at the beginning of the crisis. Cryptocurrencies like Bitcoin and Ethereum saw a growing interest due to economic uncertainty, leading to significant price fluctuations. Traditional indices, such as the Dow Jones, reacted differently, with declines followed by recoveries. The rise in investments in sustainable assets and economic stimulus policies also influenced trends, reflecting varied responses to the crisis. After the pandemic, markets experienced a strong recovery, particularly in cryptocurrencies, driven by renewed optimism and the adoption of digital technologies. Interest in sustainable investments increased, but concerns about inflation maintained a degree of volatility, prompting rapid reactions to economic news. Thus, the post-COVID period was marked by significant changes in investment behaviors.
Table 1 presents descriptive statistics of the returns for each asset. Binance shows the highest mean and standard deviation, indicating significant volatility, while the CCI30 Index has a positive mean with relatively low volatility. The Jarque–Bera test demonstrates that most of the series do not follow a normal distribution, suggesting that extreme events influence asset returns and do not behave as expected under a normal distribution. The Phillips–Perron (PP) test results indicate that most series are stationary, as evidenced by significant negative values.
Figure 2 presents the correlation matrix between market pairs, illustrated through a heat map for the entire sample period. The values in this matrix range from −1 to 1, where dark red signifies strong negative correlations and dark blue indicates strong positive correlations. The analysis shows that cryptocurrencies, including Binance, Ethereum, Litecoin, and XRP, exhibit positive correlations, with Binance and Ethereum displaying a perfect correlation of 1.00, indicating they move in tandem. The CCI30 index is also strongly correlated with Litecoin at 0.81, highlighting a close relationship between the performance of these cryptocurrencies and the index. Additionally, the Sustainability World Developed Index and the Sustainability Emerging Markets Index demonstrate a positive correlation of 0.73, suggesting they often move in the same direction. In contrast, the correlation with the solar energy market is relatively low, such as −0.46 with XRP, indicating that the solar market may serve as an effective diversifier. In conclusion, certain cryptocurrencies can enhance portfolio diversification, particularly with traditional assets.

4.2. Dynamic Total and Directional Connectedness

Analysis of Table 2 reveals that the averaged connectedness results highlight strong intra-cryptocurrency spillovers and the relative independence of sustainability and renewable energy indices. Cryptocurrencies like Binance (+3.70%), Litecoin (+2.79%), and XRP (+2.37%) are key net transmitters, actively influencing other assets, while renewable indices such as NASDAQ OMX Wind (−4.88%) and NASDAQ OMX Solar (−2.74%) act as net receivers with high self-dependence (above 90%). Binance exerts the most spillovers (40.92%), reflecting its central role in cryptocurrency dynamics, while sustainability indices remain largely self-contained, stabilizing the overall system. These results emphasize the interconnectedness of cryptocurrencies versus the independence of sustainability-focused assets.
The results presented in Table 3 reveal that the CCI30 Index and sustainability-focused indices are primarily net receivers of volatility, with net negative values (−7.89 for CCI30, −11.65 for Sustainability Emerging Markets, and −13.10 for Sustainability Developed Markets). This indicates that they are more influenced by external volatility than they transmit. In contrast, Litecoin emerges as a key transmitter with a net positive value of 12.77, significantly impacting Ethereum (11.35) and XRP (10.03). Similarly, Litecoin strongly transmits volatility to Binance (26.60), underscoring its influence on the cryptocurrency market. Overall, Ethereum and Litecoin stand out as major volatility transmitters, while the CCI30 Index and all sustainability indices remain largely reactive to external factors.
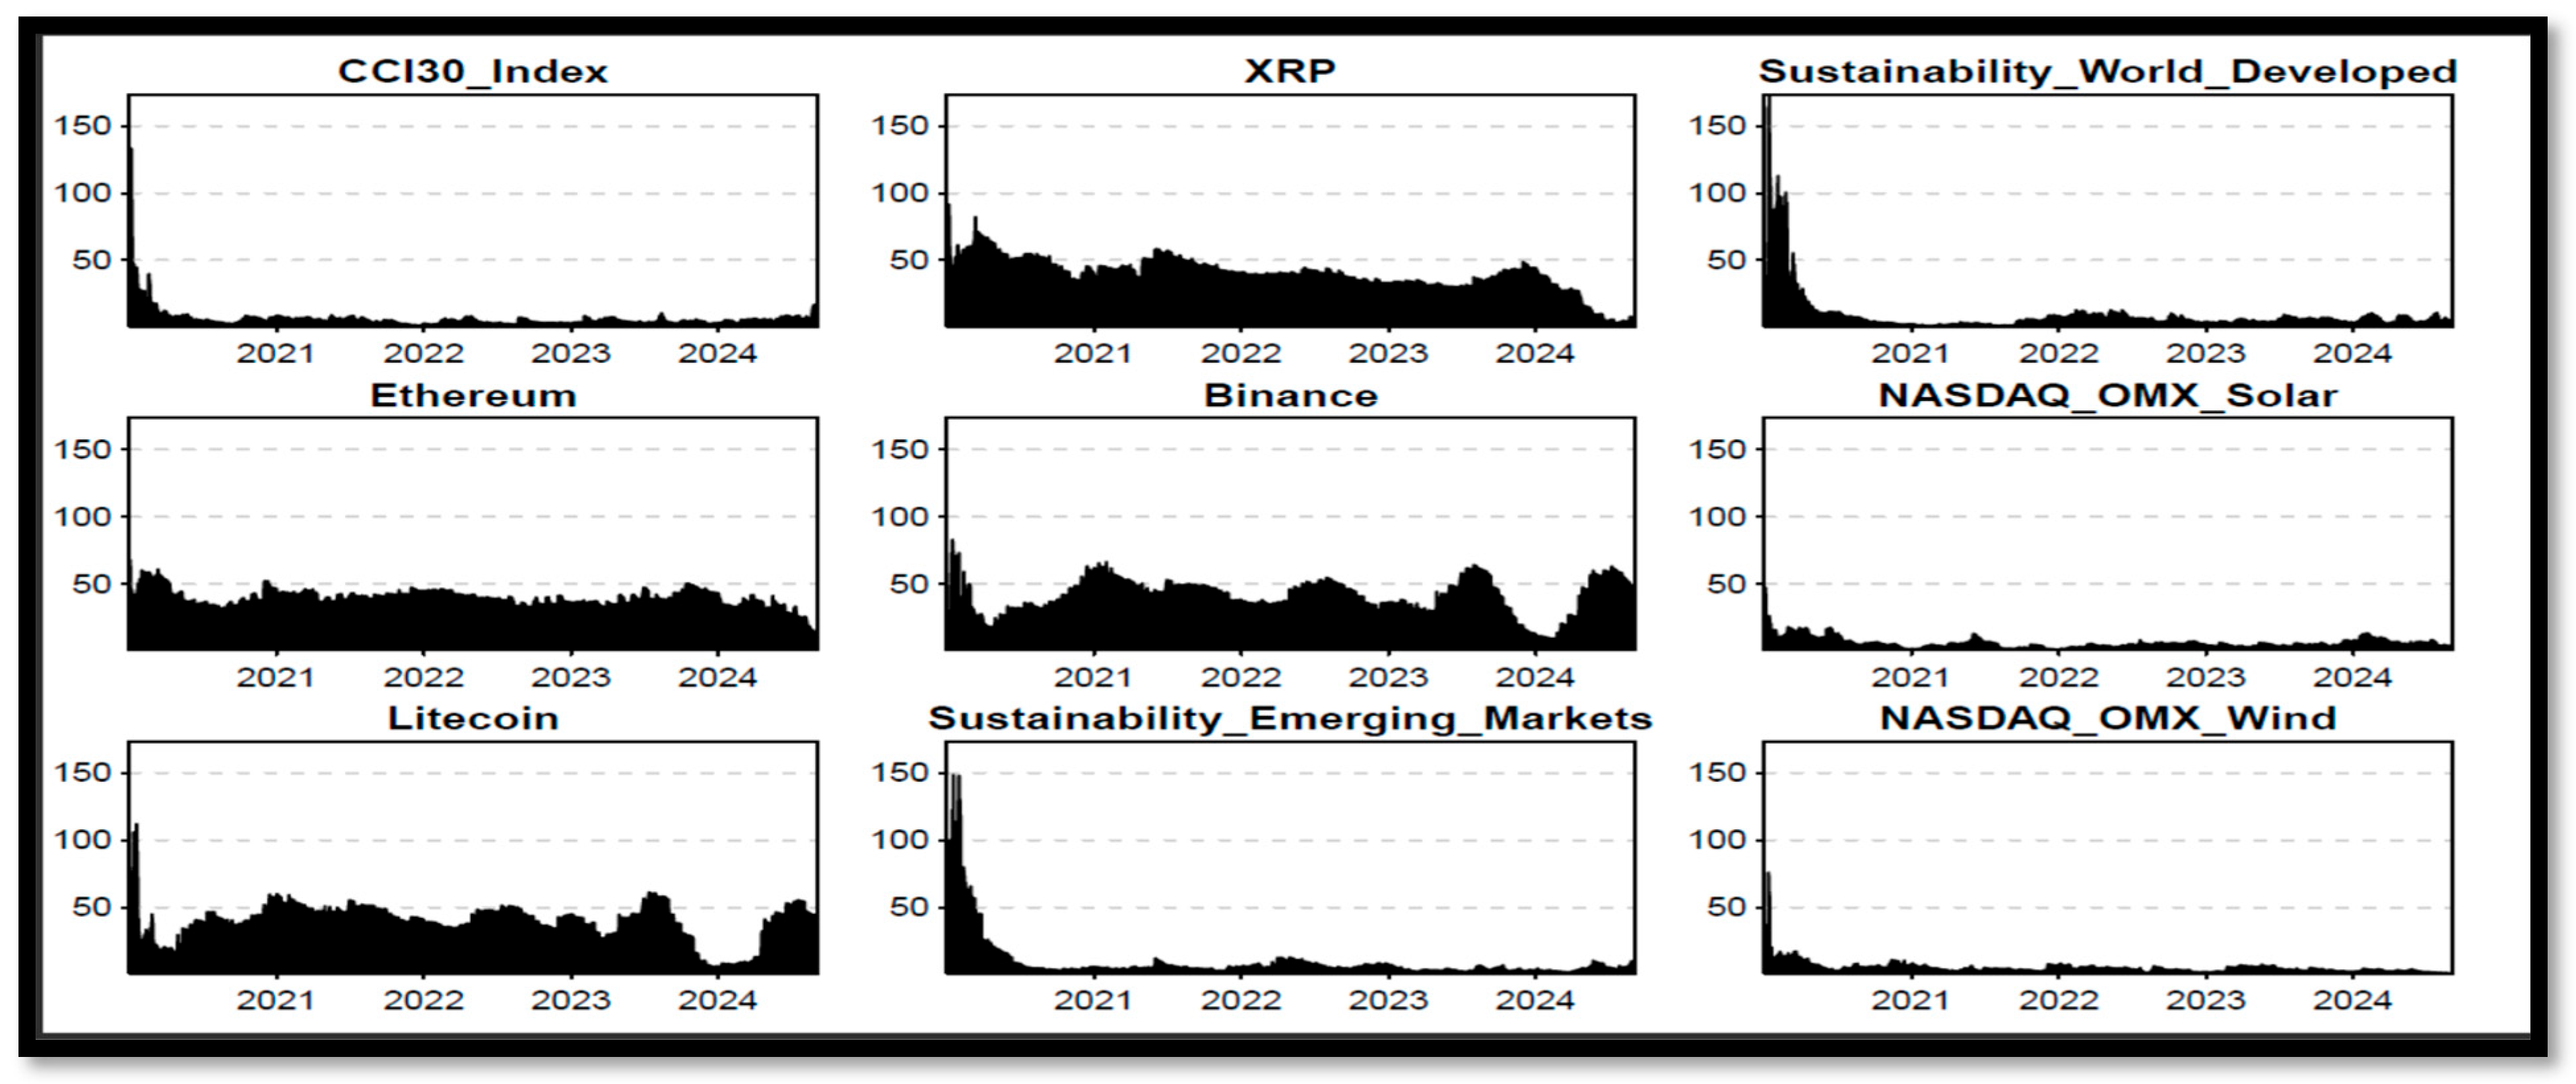
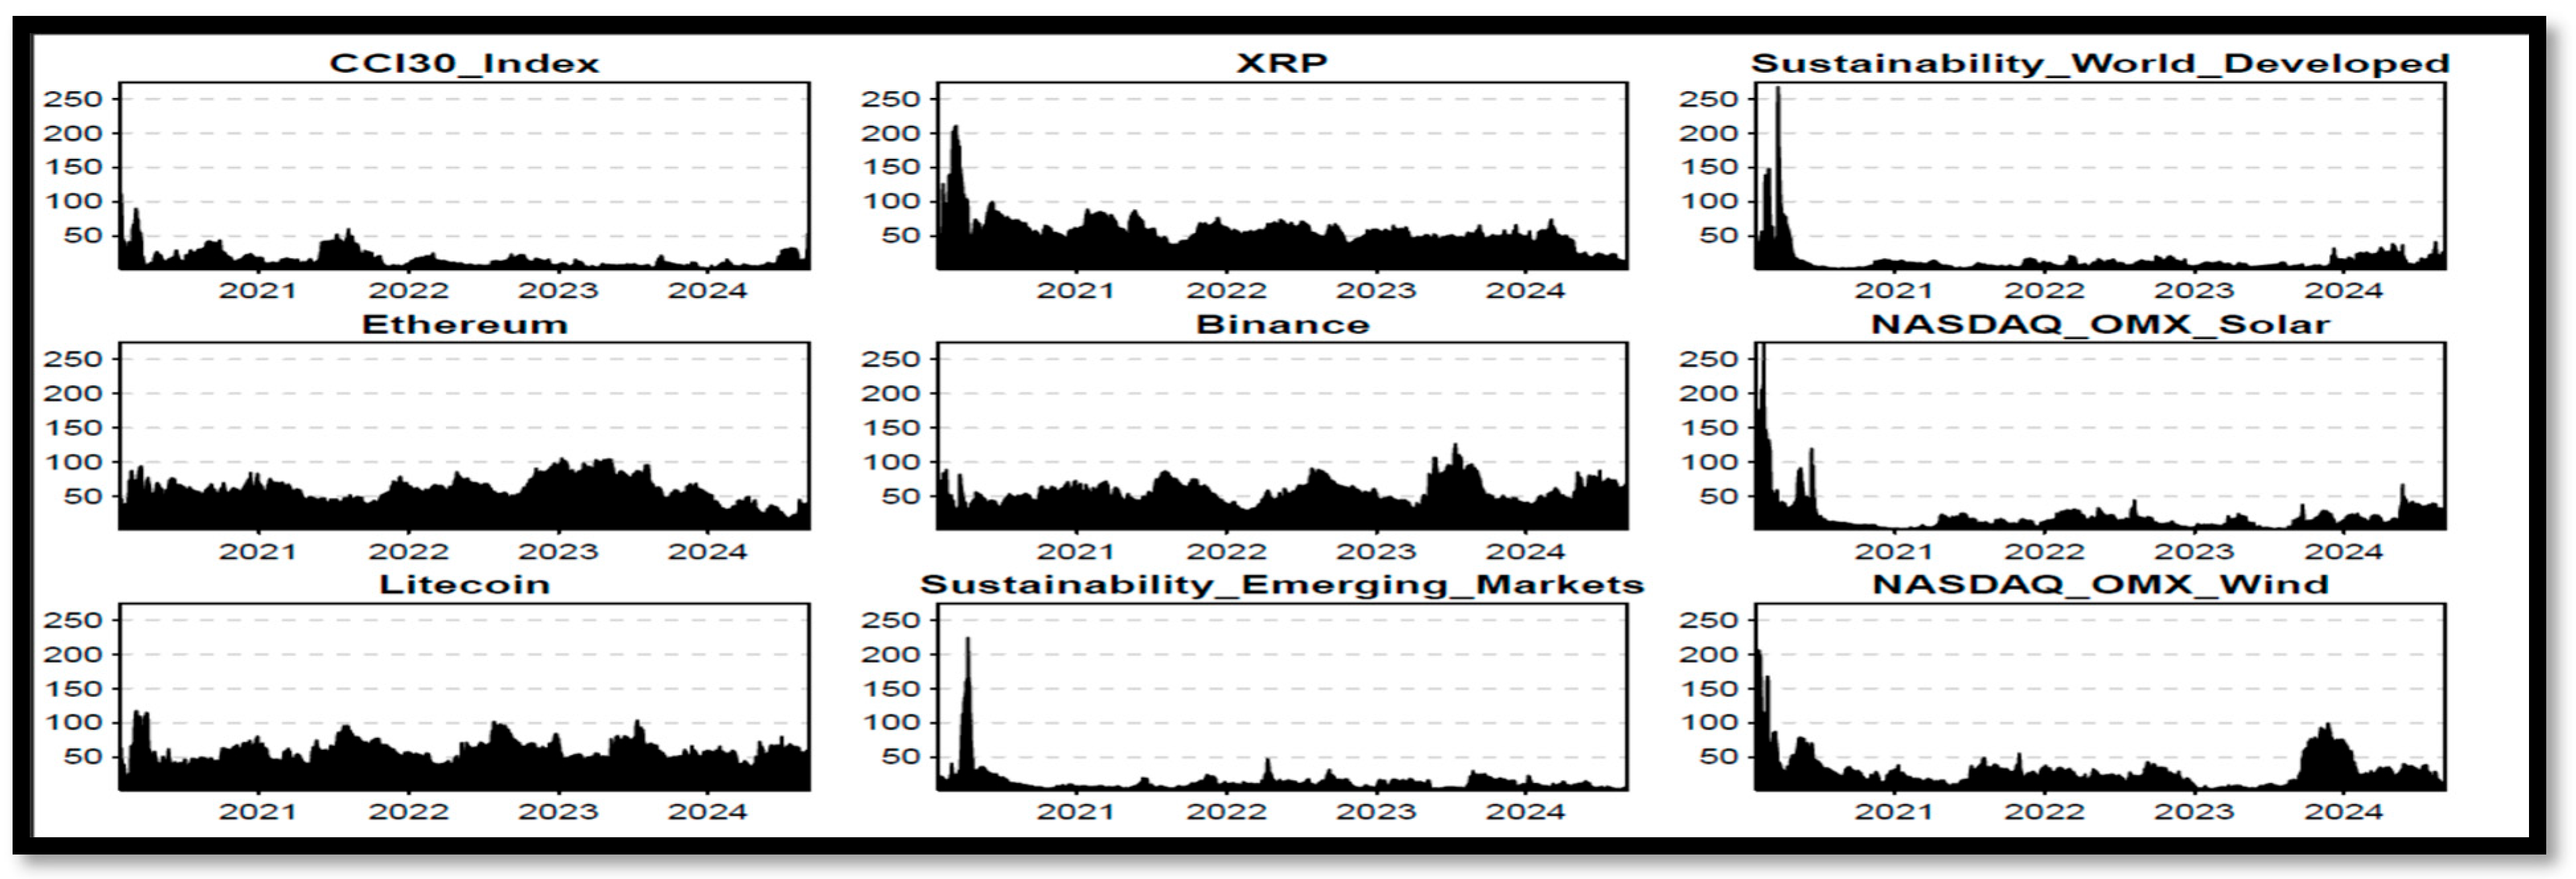
Figure 3 shows a high total connectedness of returns in early 2021; this period likely reflects a time of heightened global financial or economic interconnectedness, possibly due to a major external shock such as the COVID-19 pandemic’s peak effects, where markets were highly interdependent. From late 2021 to 2024, we note a stabilization at low levels of TCI, indicating that the interconnectedness of returns settled into a subdued state. The same result is shown for the TCI of volatilities. Notably, from 2022 to 2024, the connectedness index of volatilities fluctuates with occasional spikes: in 2022 and 2023, likely corresponding to isolated global events such as geopolitical tensions. In 2024, the connectedness of volatilities stabilizes at a slightly lower range, reflecting less systemic influence.
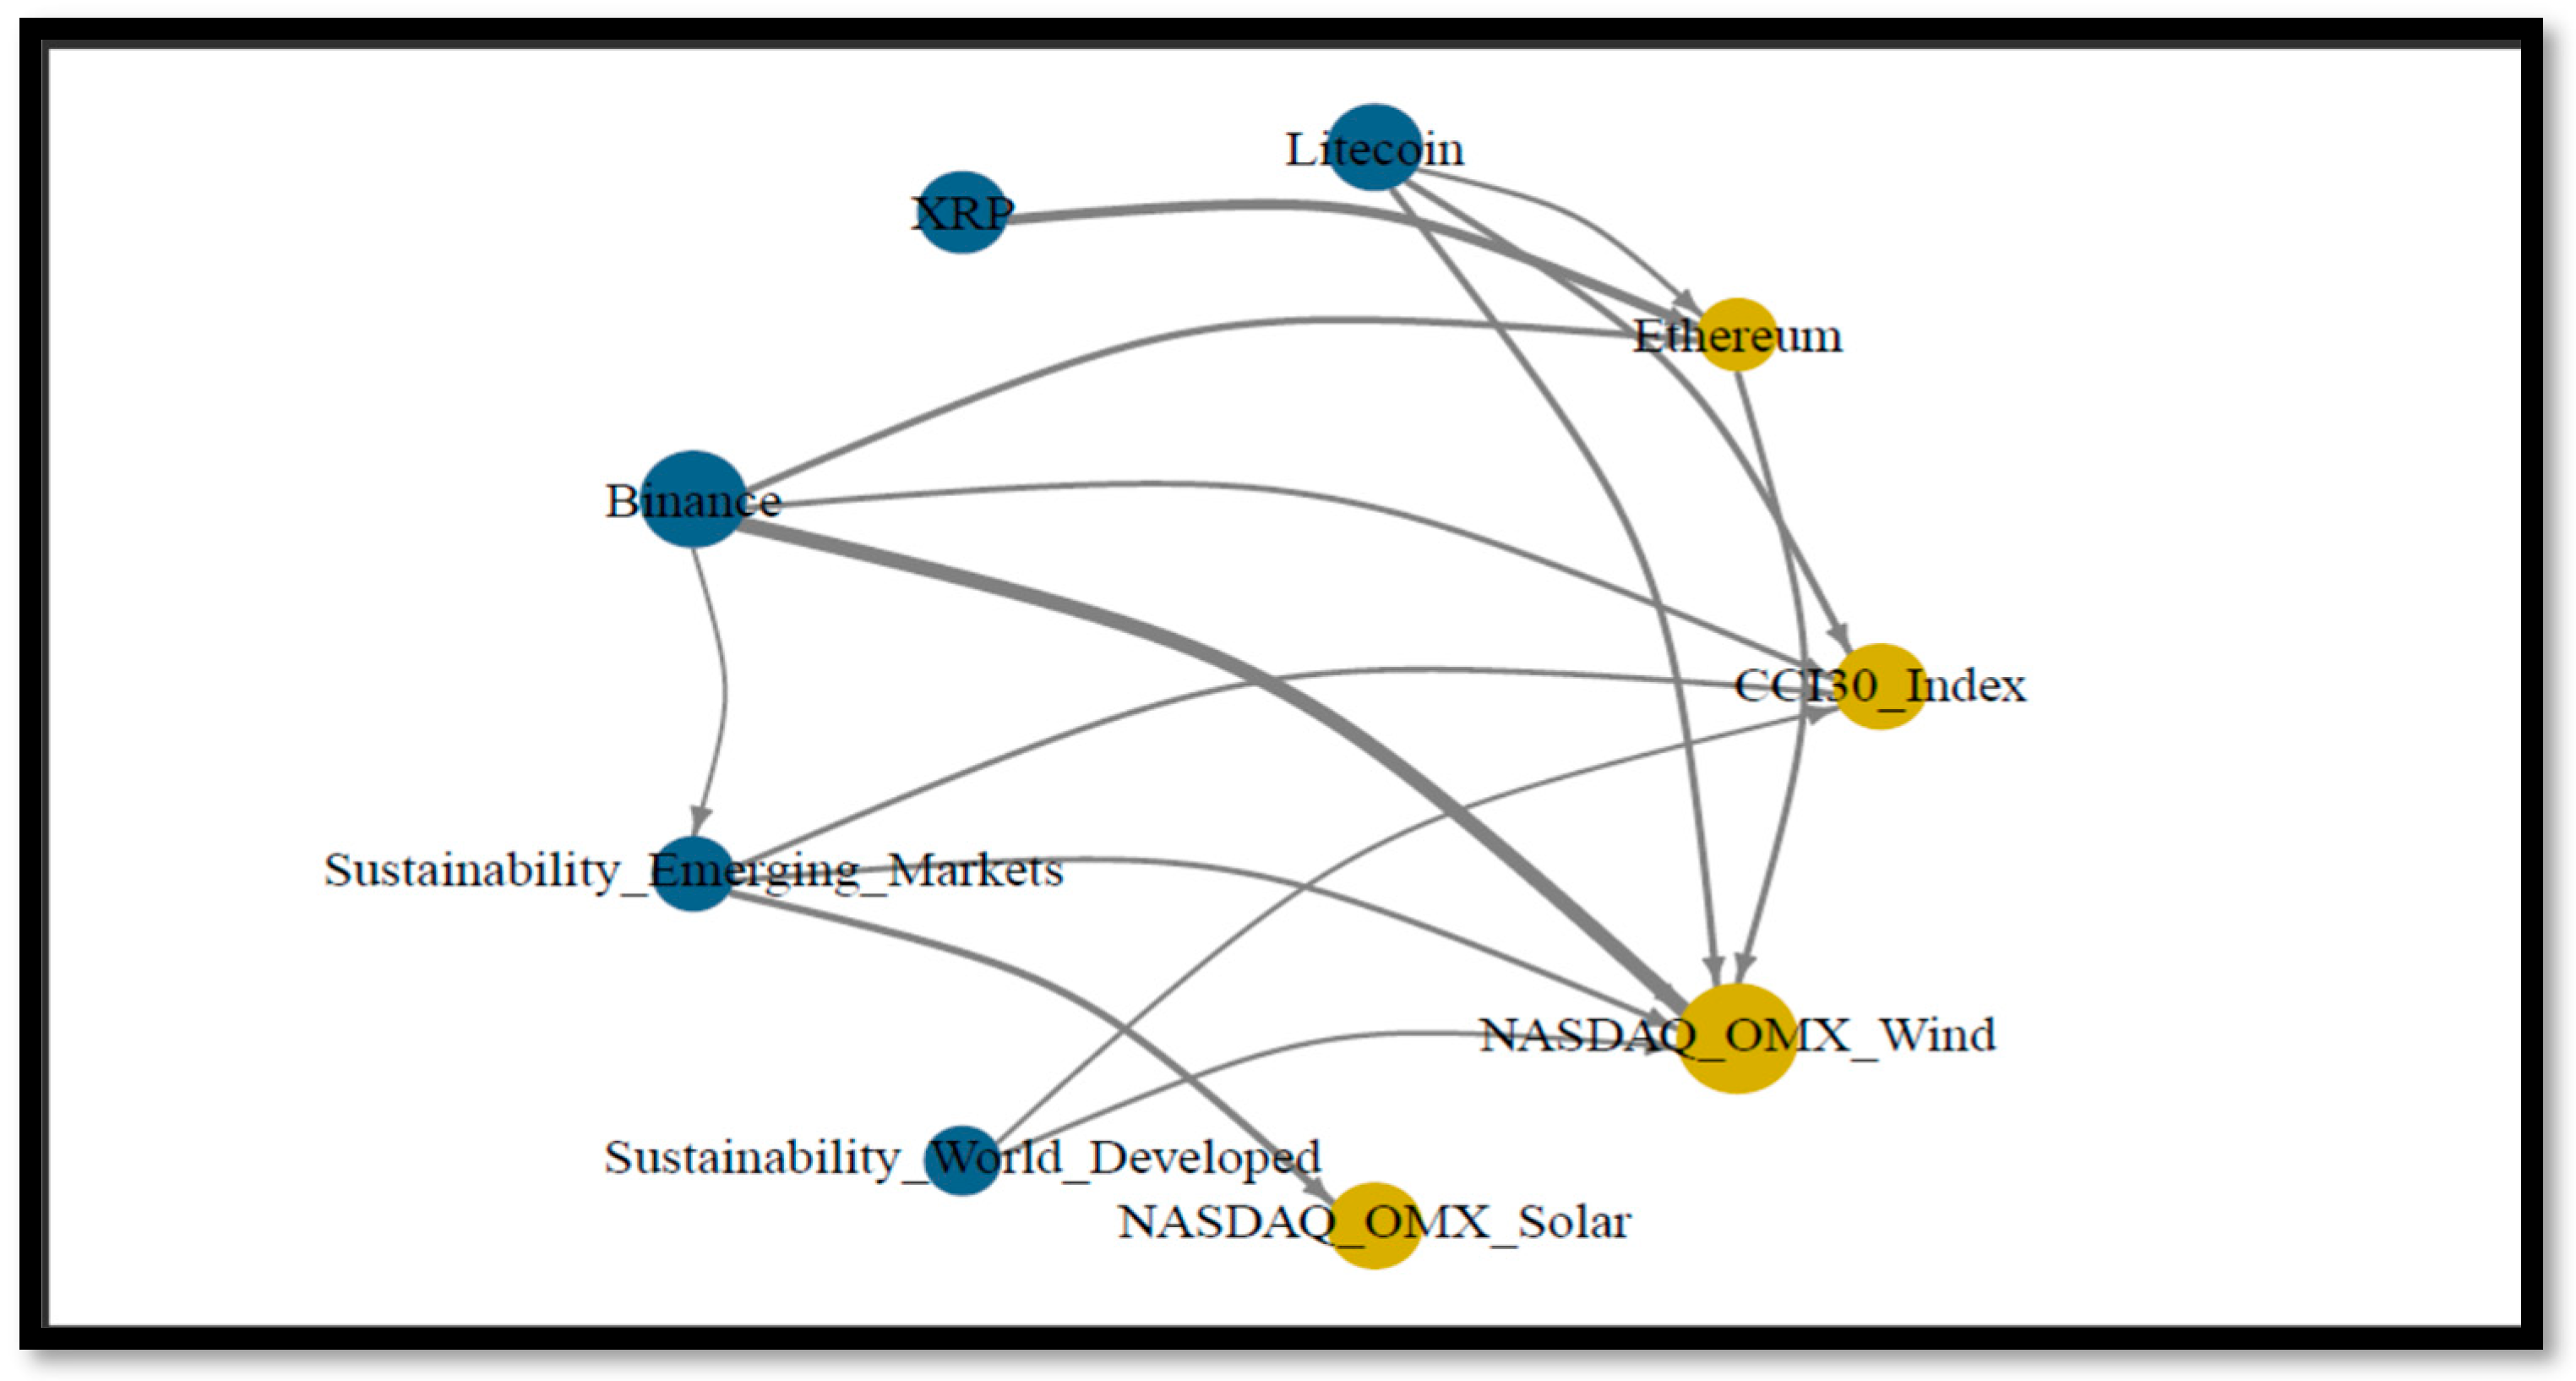
Figure 4 illustrates the interconnectedness of returns, highlighting Binance and Litecoin as the most prominent transmitters. Binance has four outgoing links to Ethereum, CCI30 Index, NASDAQ OMX Wind, and Sustainability Emerging Markets, demonstrating its strong influence in transmitting spillover returns to sustainability indices.
As shown in Figure 5, Sustainability_World_Developed and Sustainability_Emerging_Markets are the main recipients, highlighting their role as key points for absorbing volatility.
Figure 6 illustrates that Litecoin plays a key role as a transmitter, though with fewer outgoing connections, reflecting a moderate impact, with three outgoing connections to CCI30_Index, NASDAQ_OMX_Wind, and Ethereum. XRP and Sustainability_Emerging_Markets are also a moderate transmitter that plays more peripheral roles, with outgoing spillovers. While it is not as influential as Binance or Litecoin, the Sustainability_Emerging_Markets position highlights its role in contributing to the interconnectedness between cryptocurrency indices and sustainability indices, with two outgoing to NASDAQ_OMX_Wind and NASDAQ_OMX_Solar. However, Sustainability_Emerging_Markets plays a dual role as transmitter and receiver of volatilities, indicating its intermediary position in connecting cryptocurrencies and sustainability indices. On the other side, the NASDAQ OMX Wind, CCI30 Index, NASDAQ_OMX_Solar, and Ethereum are the most prominent receivers of returns, with numerous incoming connections from cryptocurrencies like Litecoin and Binance, highlighting their sensitivity to cryptocurrency-driven impacts.
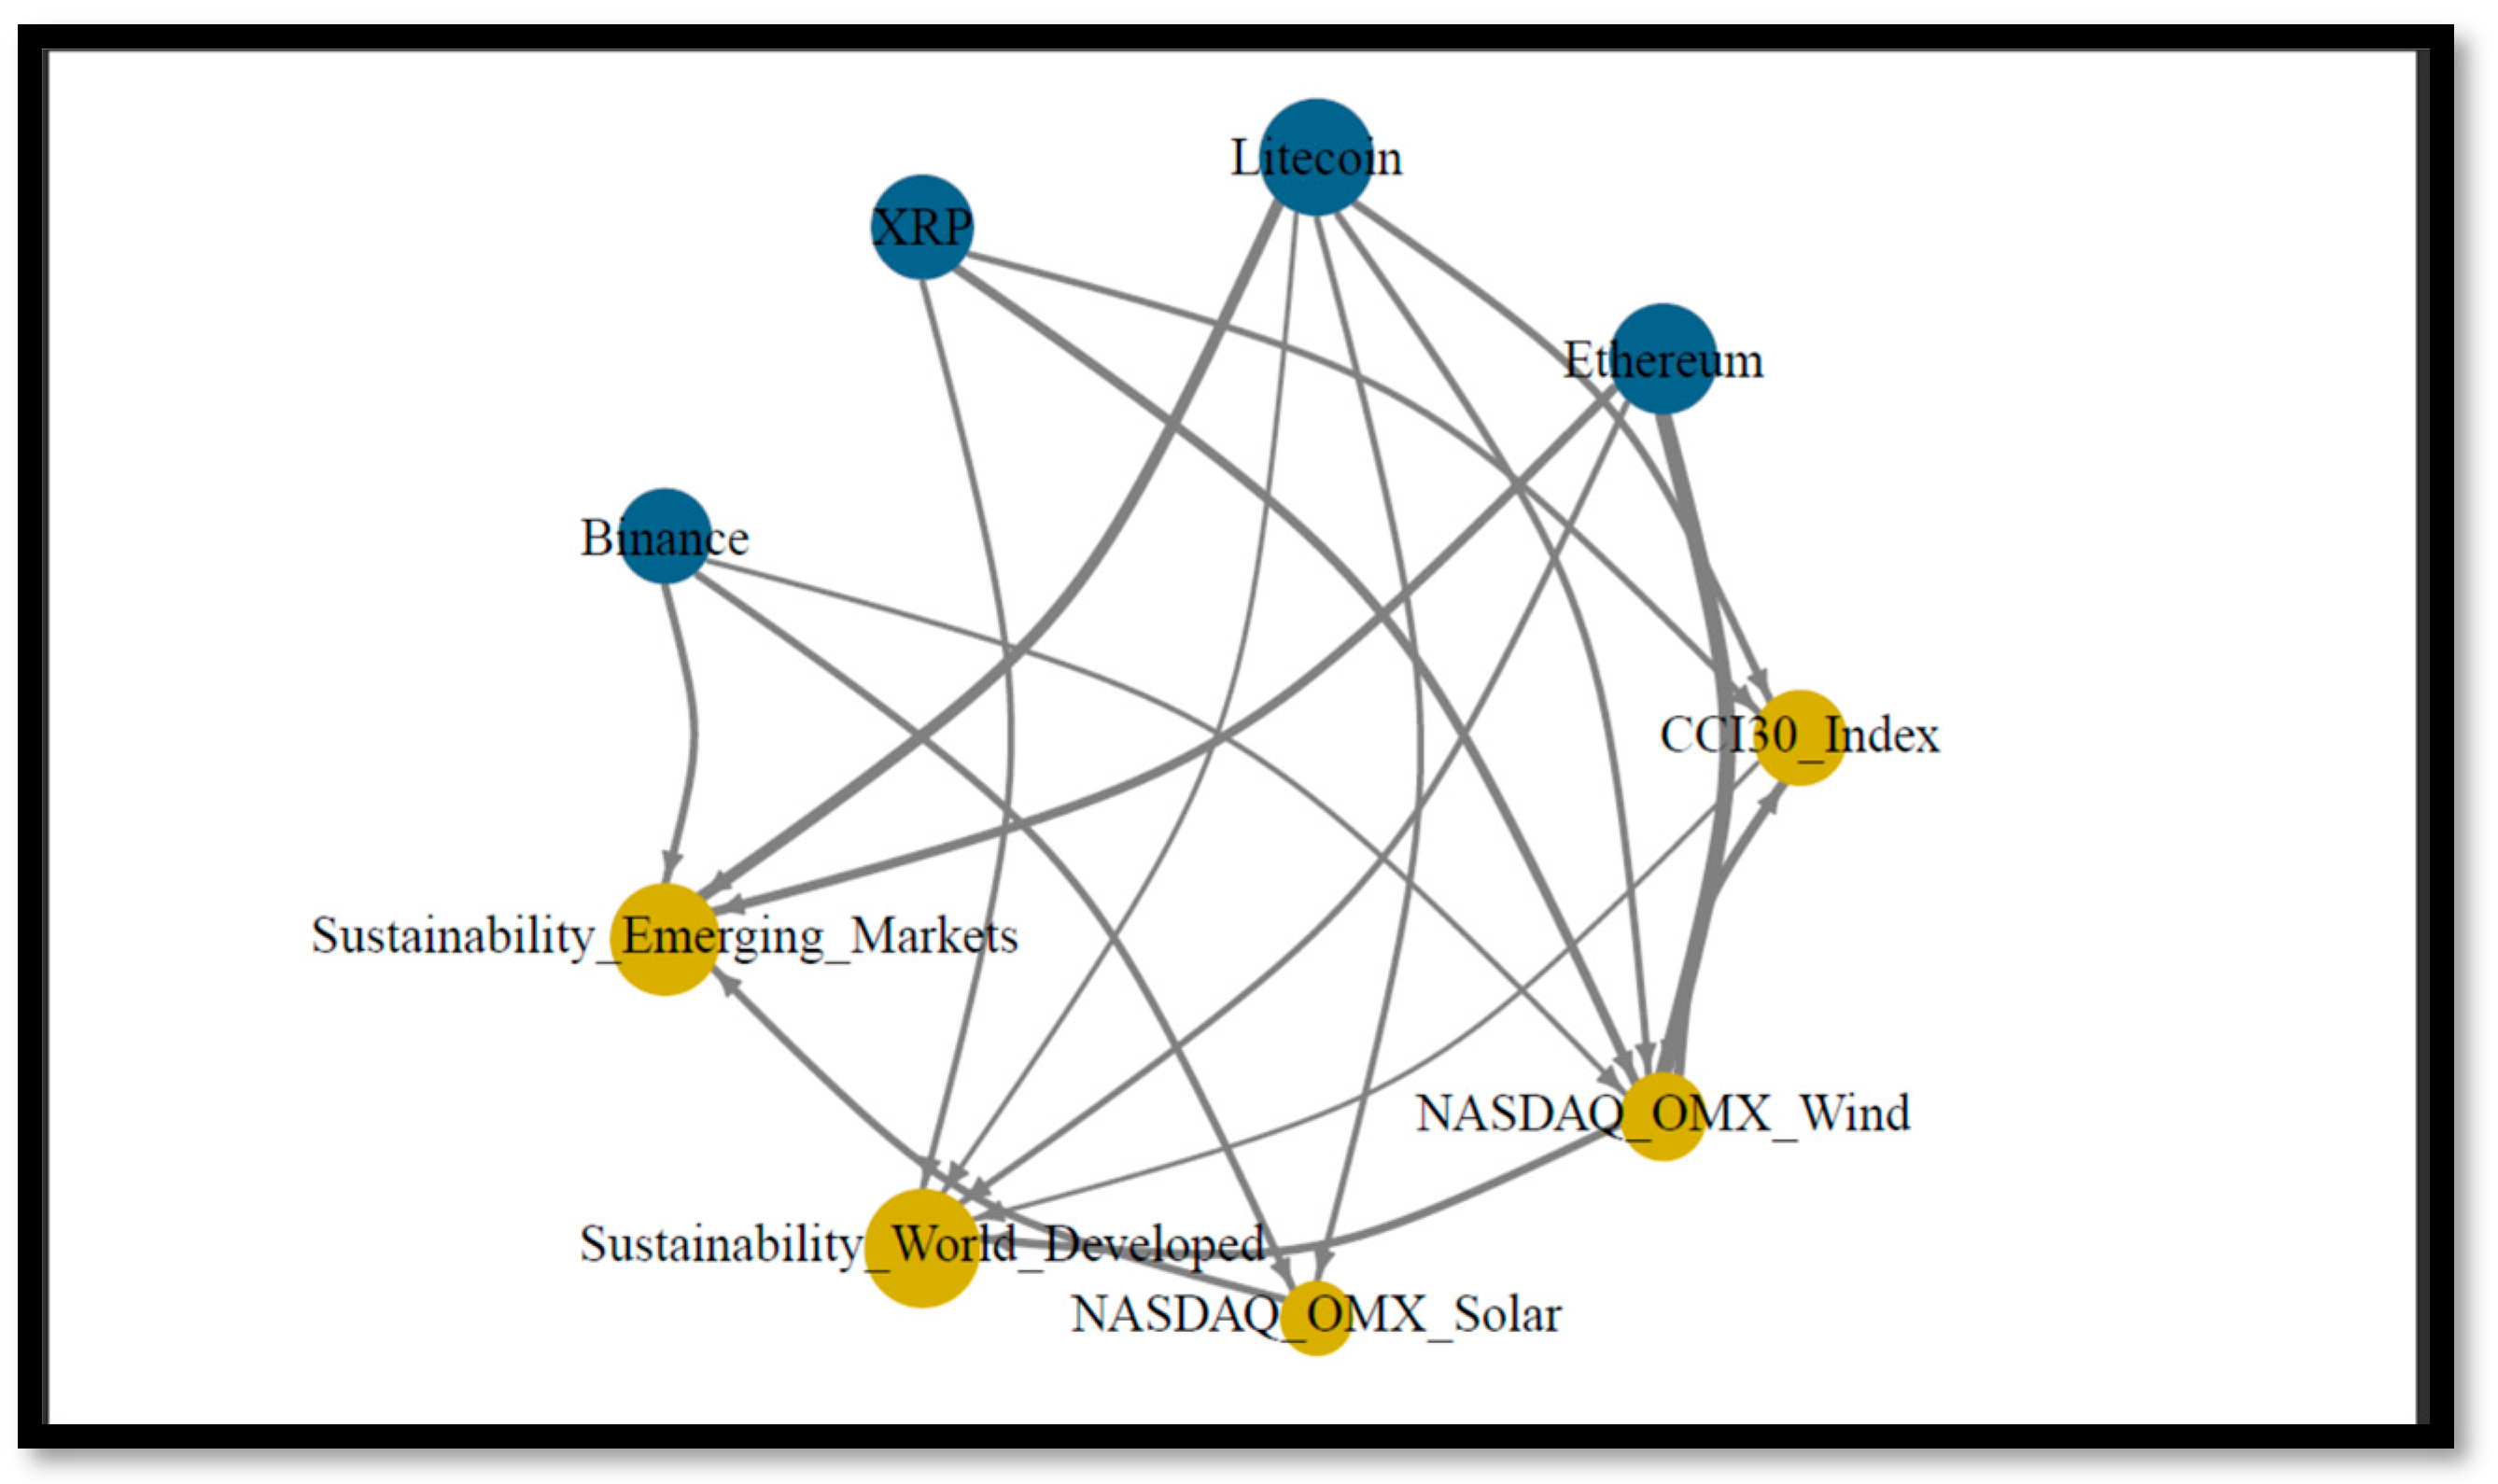
Figure 7 shows that Litecoin is the most significant transmitter of volatility, with the highest number of outgoing connections, highlighting its importance in interactions with both cryptocurrencies and sustainability indices, followed by Ethereum. XRP and Binance also play notable roles as transmitters, though with fewer outgoing connections—each with three connections to sustainability, focused indices, reflecting a moderate influence. However, they are less dominant compared to Litecoin and Ethereum. Nevertheless, the CCI30 Index and NASDAQ_OMX_Solar serve as both transmitters and receivers of volatility, indicating their intermediary position in linking cryptocurrencies and sustainability indices. Meanwhile, Sustainability_World_Developed and Sustainability_Emerging_Markets appear as the most prominent receivers, emphasizing their role as key points of volatility absorption.
The identification of Binance and Litecoin as primary risk transmitters may be related to their high trading volumes, market positions, and sensitivity to major events such as regulatory announcements or security breaches. Investors can reduce systemic risk by lowering exposure to these assets during stressful periods, reallocating to more stable net-receiver assets, and employing dynamic hedging with negatively correlated instruments or sustainable ETFs. For policymakers, close monitoring of spillover dynamics can serve as an early warning system, supported by measures to improve transparency, strengthen liquidity management, and coordinate oversight between cryptocurrency and sustainable finance regulators.
Overall, the sustainability indices act as receivers of volatilities from cryptocurrencies like Litecoin and Ethereum, but they also interact with one another, highlighting the interconnectedness of different sustainability-focused investments and their nexus to digital asset markets.
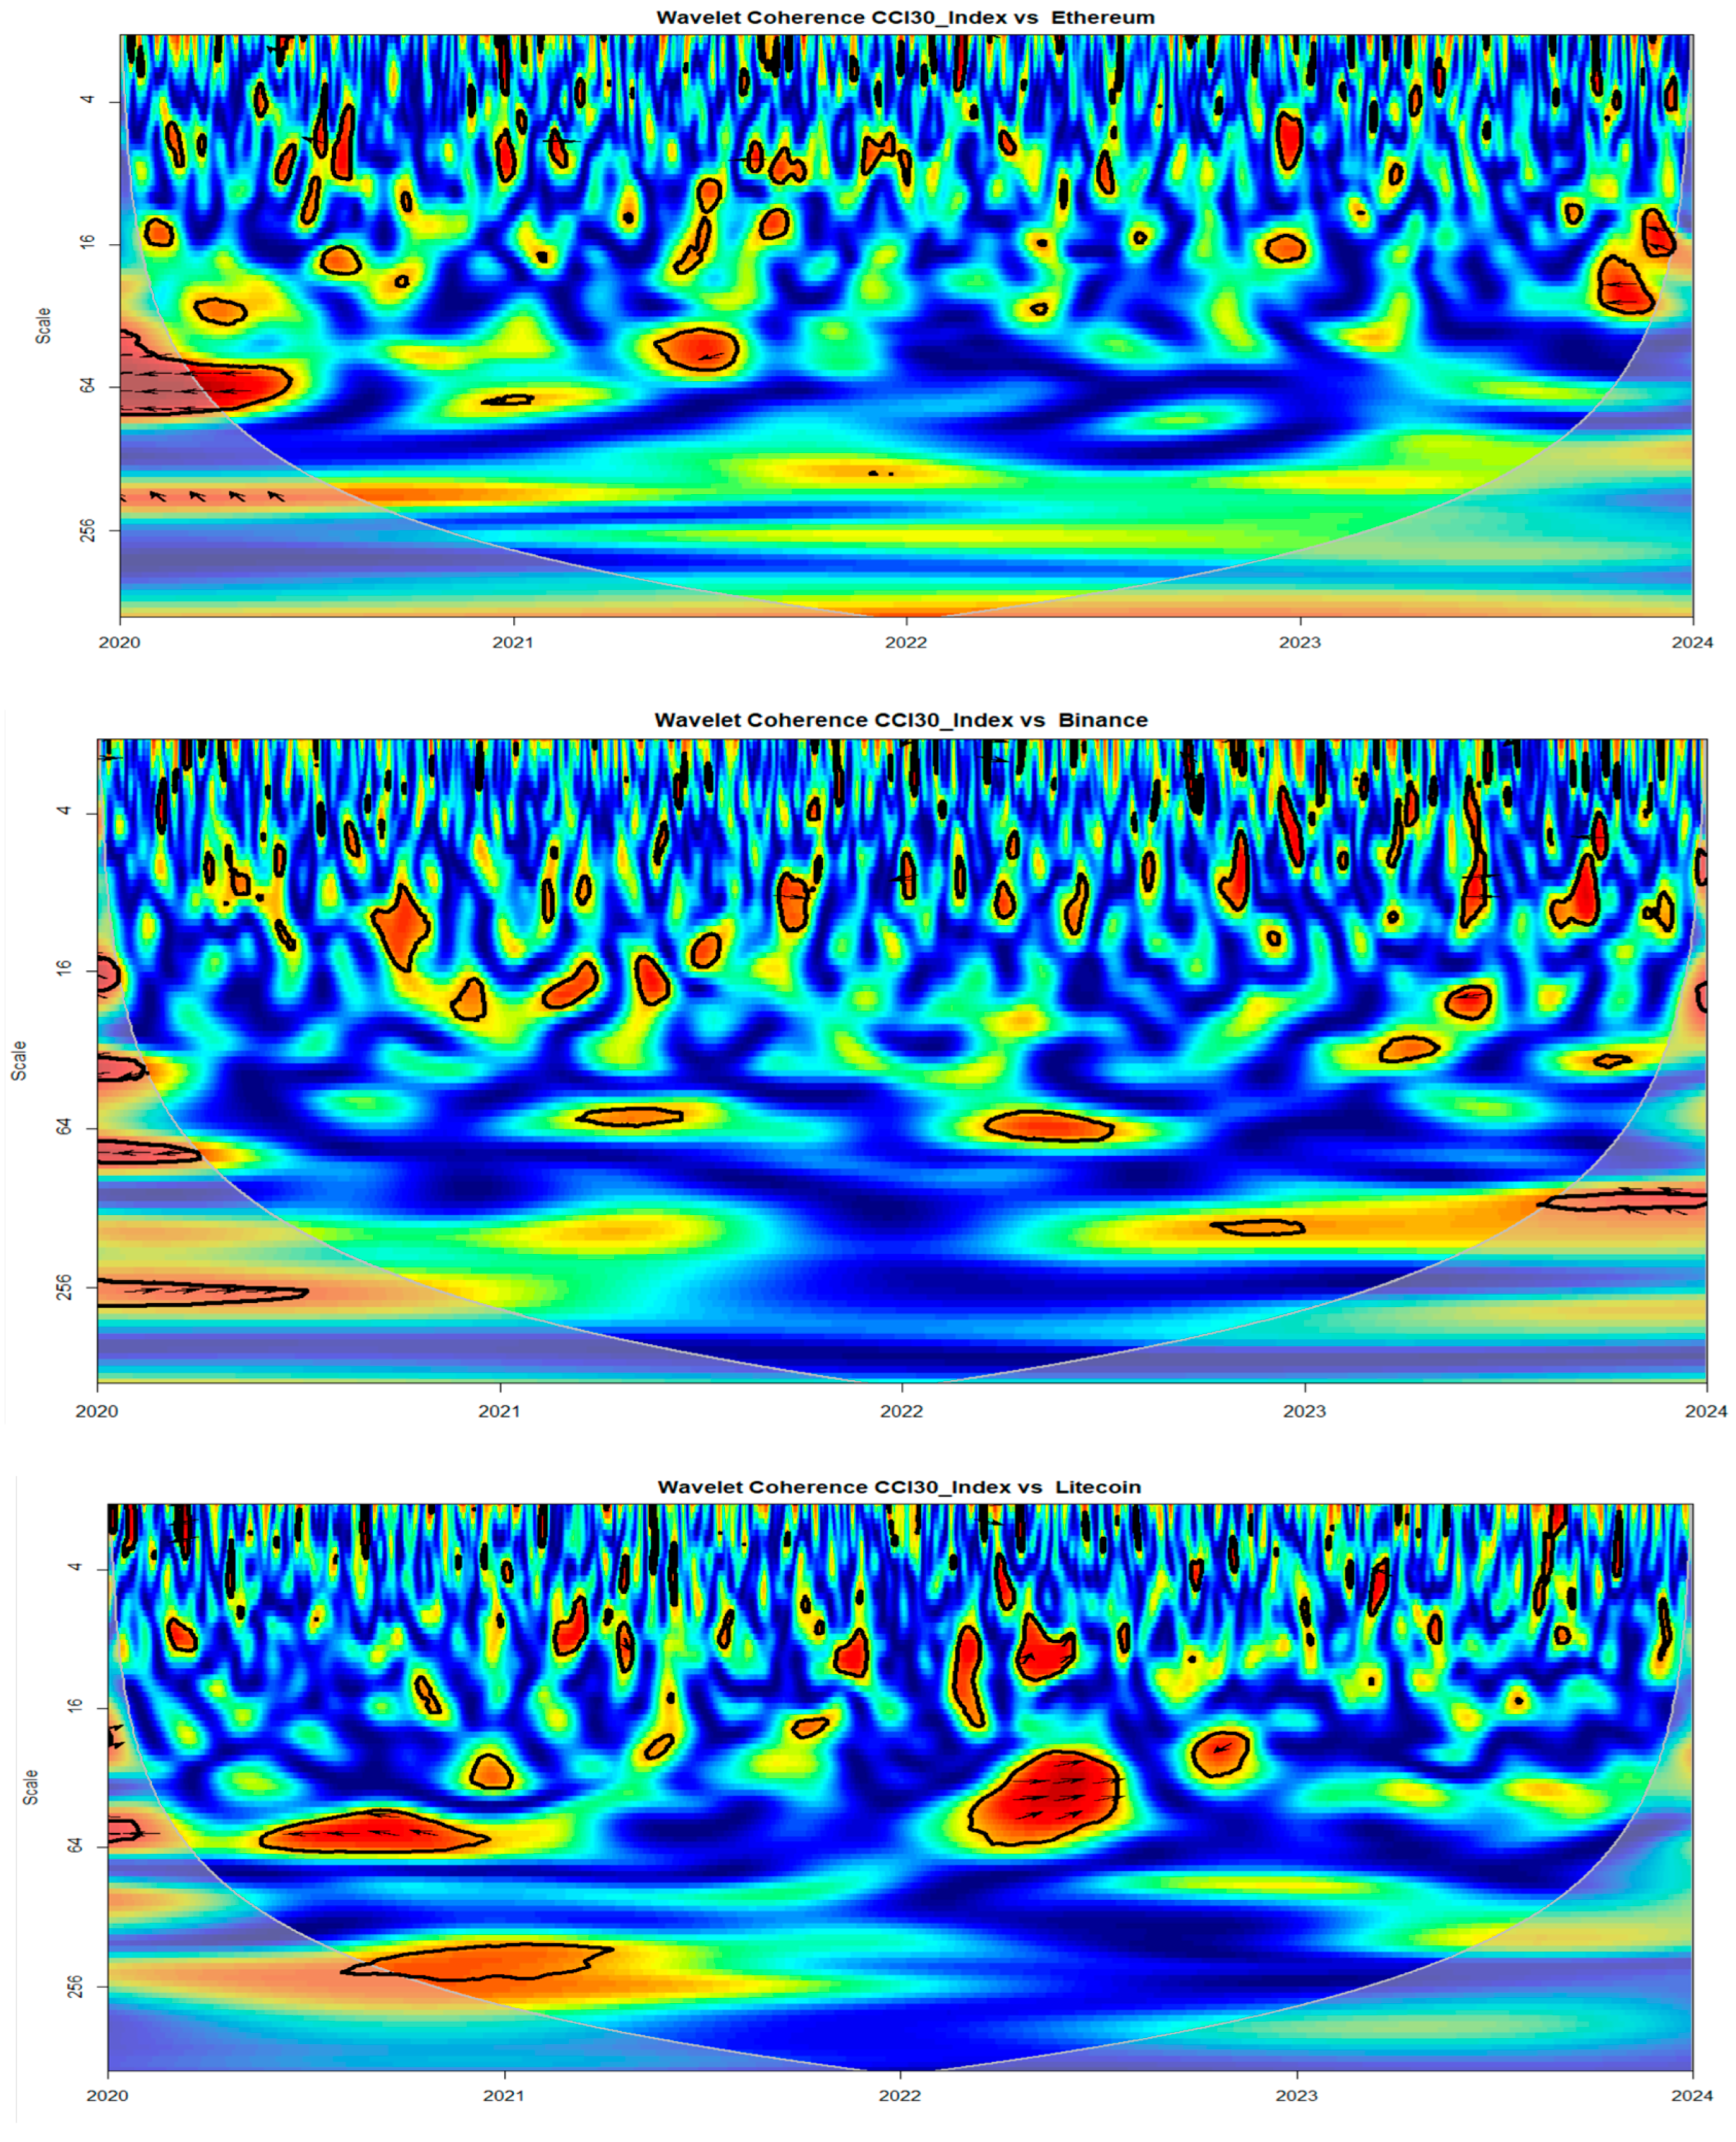
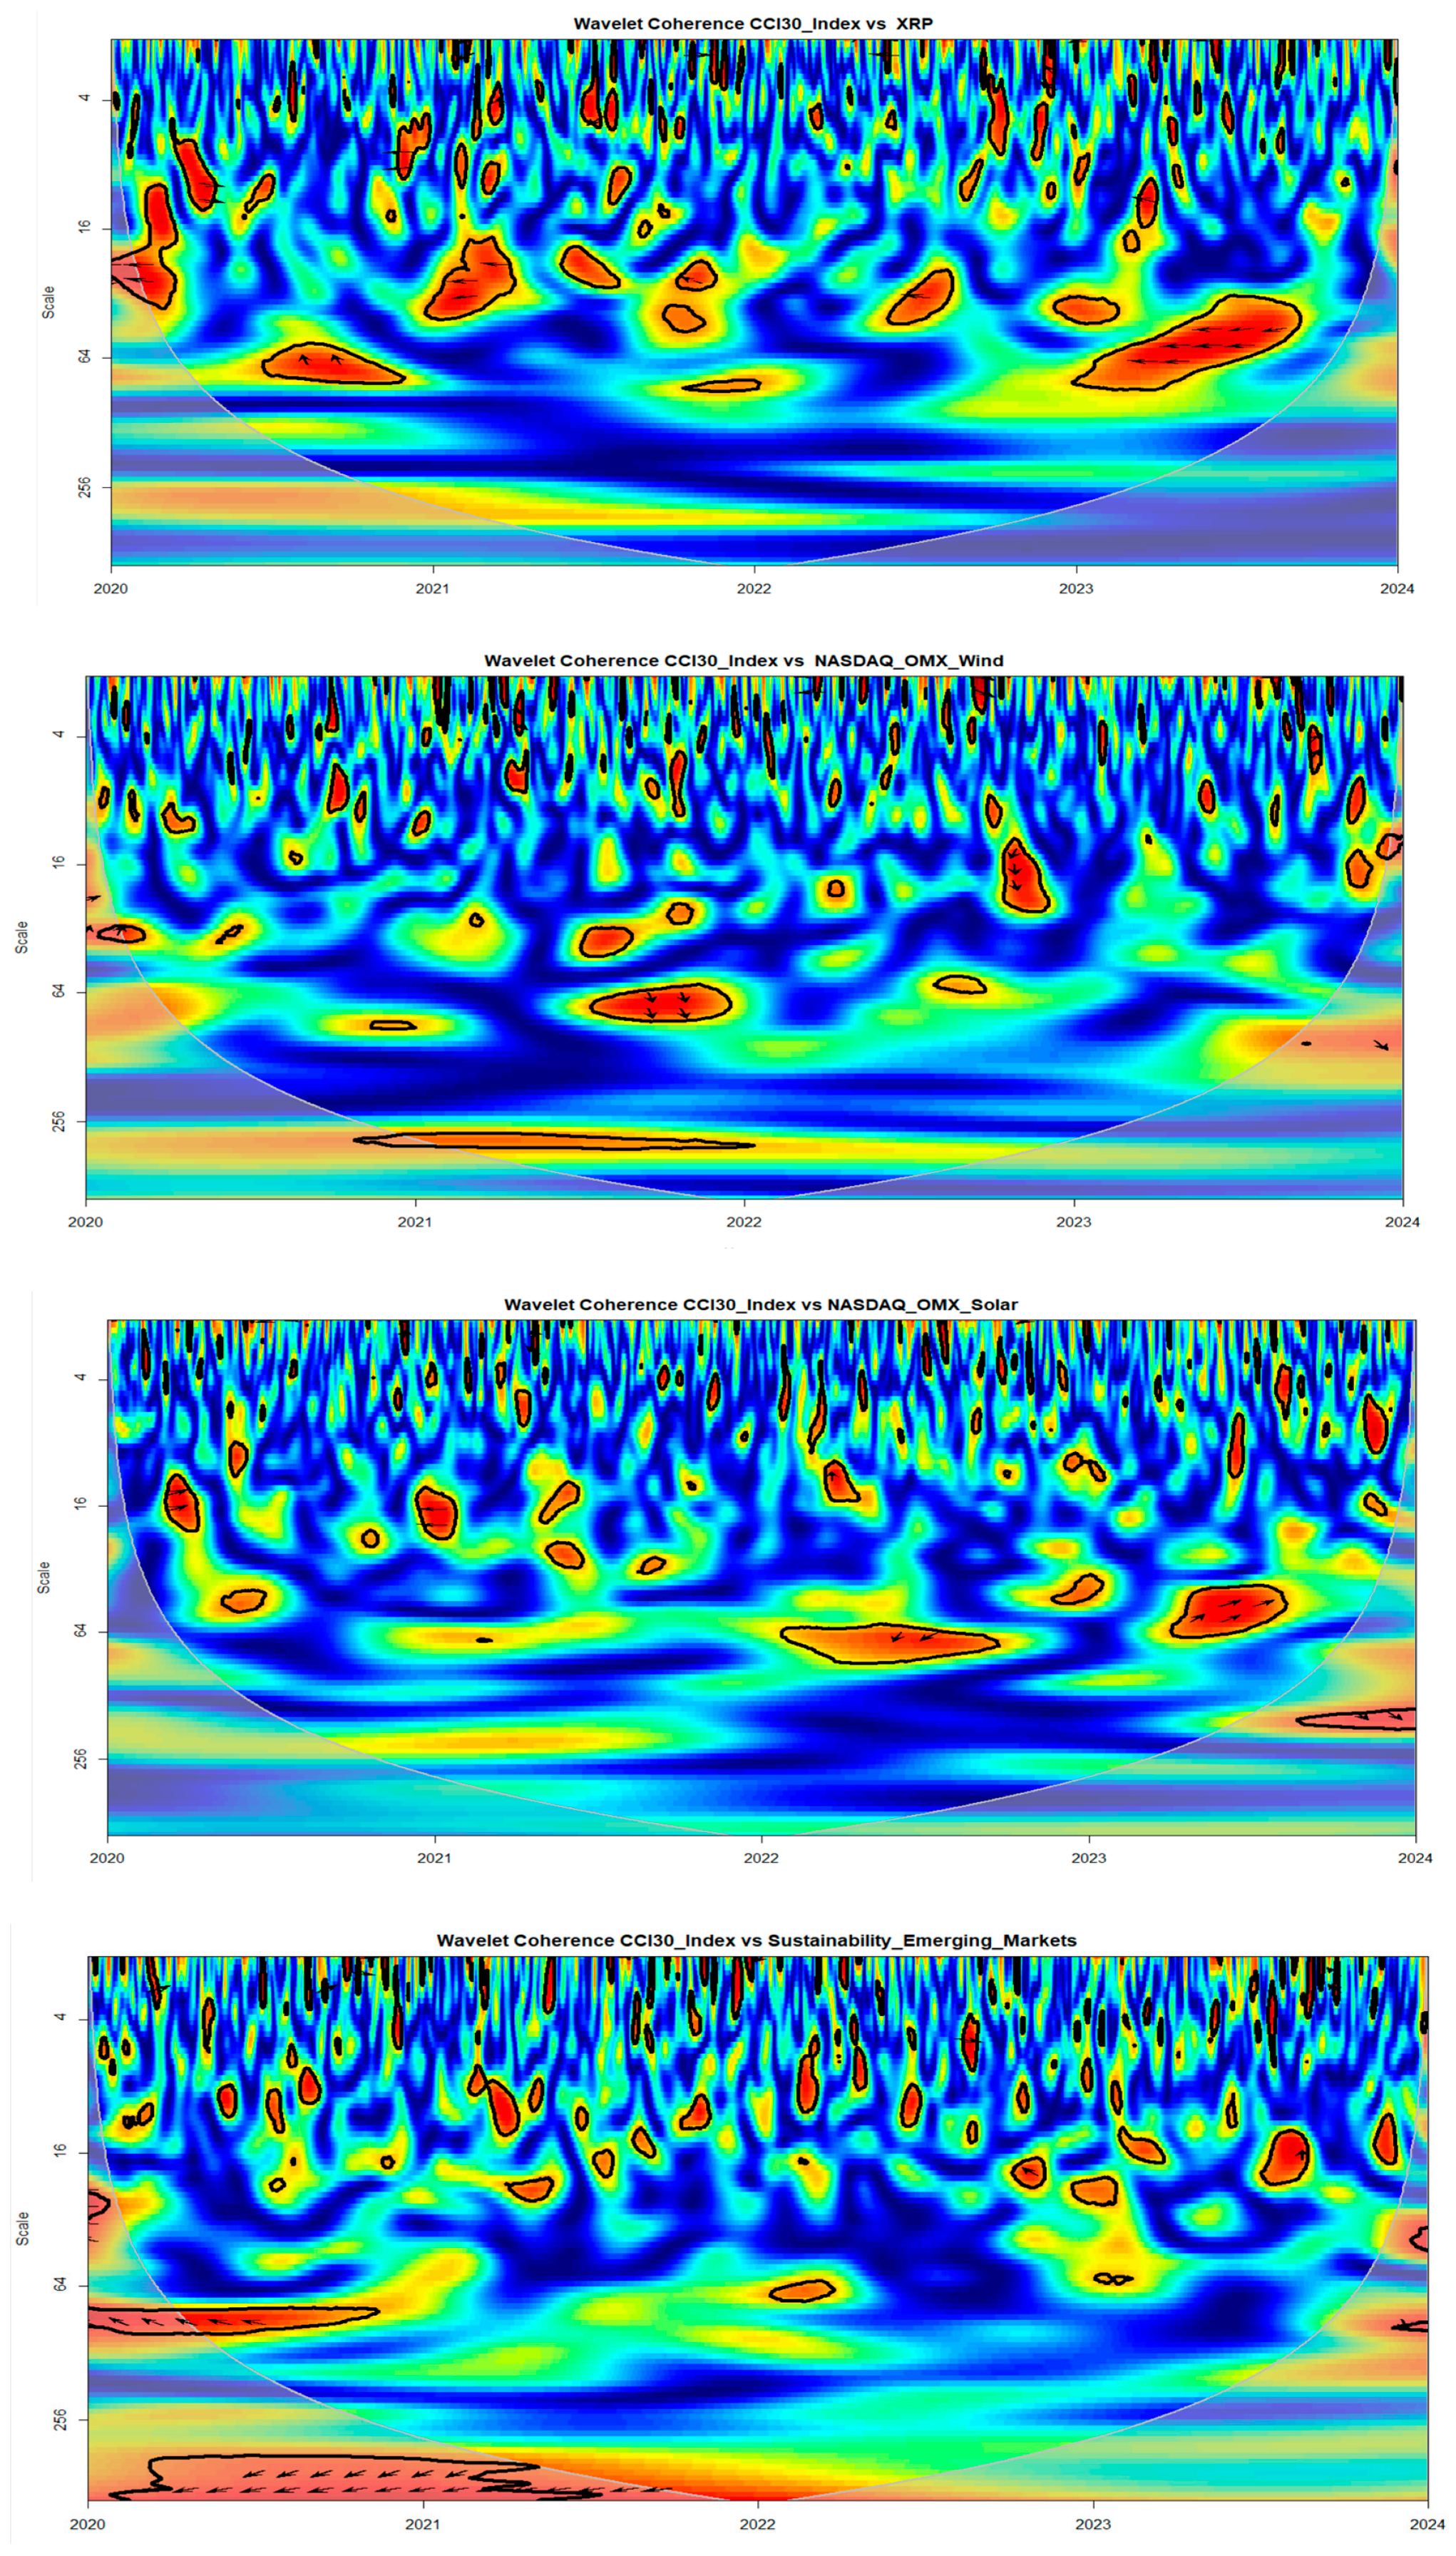
Wavelet coherence analysis between the CCI30 index and various assets exhibits dynamic relationships, reflecting changing market conditions. The result shows periods of high coherence for Ethereum with the CCI30 Index, such as between late 2020 and early 2021. Coherence is also high in 2023, corresponding to the wide cryptocurrency market dependence during this period. Figure 8 shows that in 2024, the long-term trends of the CCI30 index and Ethereum are highly correlated, but their short-term movements are not as closely related. The analysis of the relationship between CCI30 and Binance shows that a strong coherence is pronounced between mid-2021 and late 2022; the same result is shown for the CCI30 index and Litecoin, indicating a strong synchronization between the two markets and an increased systemic risk. A notable synchronization, from mid to late 2021 and 2023, is detected for XRP (Ripple). These results are driven by shared market dynamics, investor sentiment, or macroeconomic factors. Conversely, weak coherence phases are observed, suggesting reduced connectivity and independent behavior, which corresponds to lower systemic risk, such as 2021-2022 for Ethereum, from 2020 to early 2021 and also in 2024 for Binance, from 2020 to early 2021 and late 2022 to 2024 for Litecoin and from 2020 to early 2021 and late 2022 to 2024 for XRP reveal periods of divergence indicate a lack of common external drivers where asset movements were influenced by independent factors like regulatory changes, technological advancements, or industry-specific developments. Cryptocurrency’s low correlation, driven by specific factors like speculative trading and blockchain developments, highlights its potential as a portfolio diversifier during low-coherence periods, helping to reduce volatility.
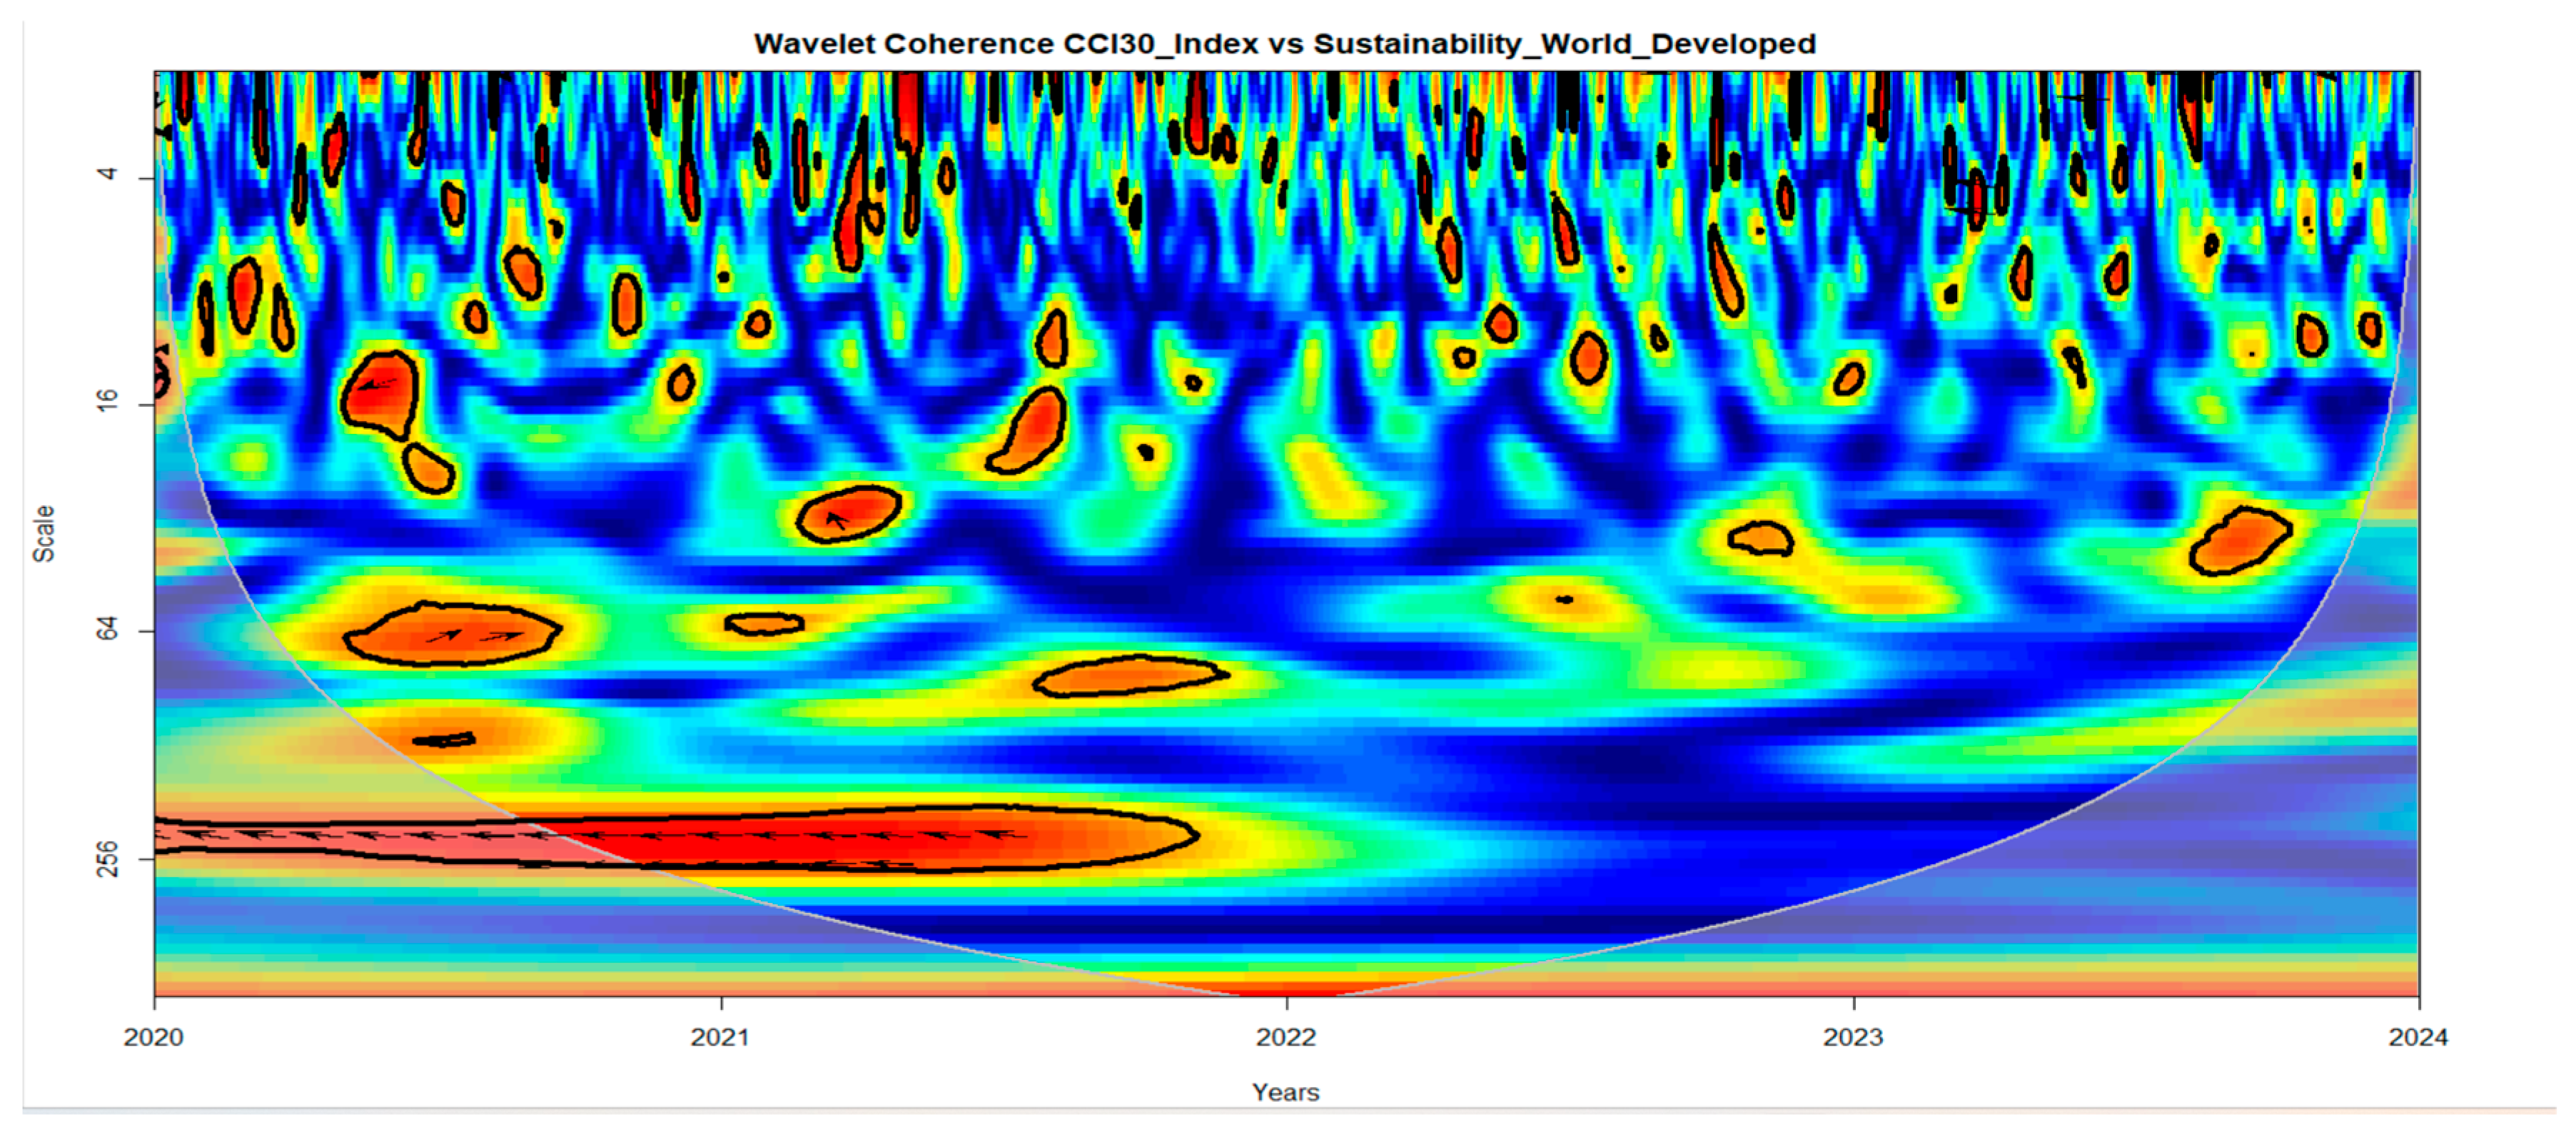
Nevertheless, the coherence between sustainable financial indices and the CCI30 Index illustrates that the dynamic relationship between the CCI30 Crypto Index and the NASDAQ OMX Wind shows a strong coherence that appears prominently in 2022 and 2023, indicating a significant systemic risk during these periods. Conversely, low coherence appears in early 2020 and much of 2024, suggesting minimal systemic interdependence. The same result is for the relationship between the CCI30 and the NASDAQ OMX Solar Indexes, which appear to strengthen during market stress or external shocks, as reflected in 2022 and early 2023. The reduced coherence in 2024 might reflect a divergence in market fundamentals, with the crypto market maturing independently of the sustainable energy sector or responding to crypto-specific developments like regulation or adoption trends. Sustainability Developed Markets strongly ally with the CCI30 index during 2020 and 2021–2022, reflecting synchronized responses to shared market forces. In contrast, with weaker coherence in 2023 and in 2024 near the end of the timeline, the coherence remains predominantly low, indicating weak synchronization between the indices. Moreover, the wavelet coherence analysis reveals a significant relationship between the CCI30 index and Sustainability Emerging Markets. Notably, high coherence is observed in late 2020 and early 2021, indicating a strong correlation and revealing considerable systemic risk in this period. In contrast, low coherence is seen for much of 2022 and late 2023. By 2024, coherence will further diminish, suggesting a weakened relationship and reduced systemic interdependence, highlighting that their respective market drivers have diverged significantly.
Periods of high coherence indicate systemic risk, as synchronized assets amplify the impact of external shocks like economic crises or policy changes. For example, the alignment between the CCI30 Index and Ethereum in late 2020–early 2021, 2023, and Binance mid-2021–late 2022, and between the CCI30 and the NASDAQ OMX Wind and Solar Indexes during 2022–early 2023 reflects heightened vulnerability to market-wide volatility. In contrast, low-coherence periods in 2024 reflect market maturity and reduce systemic risk by enabling independent asset behavior and enhancing portfolio stability.
These findings demonstrate the utility of wavelet coherence analysis in identifying time-frequency localized relationships, providing valuable insights into market dynamics, risk assessment, and the formulation of effective investment strategies.

5. Conclusions

The empirical evidence from this study emphasizes the need for sustainable finance policies that recognize the different roles of cryptocurrencies and sustainability indices in market dynamics. Since major cryptocurrencies like Binance and Litecoin are important transmitters of volatility and spillover returns, while sustainability-focused indexes mainly absorb these shocks, regulators should develop policies to reduce systemic risk from the crypto sector. This could include enforcing environmental performance disclosures and encouraging the adoption of energy-efficient blockchain protocols for cryptocurrencies with significant market influence. Additionally, the observed fluctuations in connectedness over time reveal opportunities to promote portfolio diversification strategies that include green assets and cryptocurrencies, thereby lowering systemic vulnerabilities. Policy frameworks should also support transparent classification and risk monitoring of digital assets that align with sustainability standards, fostering market resilience and advancing environmental goals simultaneously.
This study highlights the significant interconnectedness between green financial markets and cryptocurrencies, emphasizing the need for a robust framework to understand these dynamic relationships. Applying the TVP-VAR model and wavelet-based VaR analysis provides valuable insights into the evolving nature of these markets, particularly during periods of economic stress. Our research highlights the interplay between green financial markets and cryptocurrencies, with cryptocurrencies acting as dominant spillover transmitters and sustainability indices offering diversification benefits. Our findings suggest that integrating green investments with cryptocurrencies can enhance portfolio diversification and risk management strategies. Policymakers and investors are encouraged to consider these dynamics as they navigate the growing intersection of sustainable finance and digital assets. Future research should continue to explore these relationships, particularly in light of ongoing global challenges and the increasing importance of environmental considerations in investment decision making.
It is important to note that the 2020–2024 period was heavily influenced by COVID-19 and geopolitical events, which may limit the generalizability of the findings to more stable market conditions. Future research could examine other crises, such as inflation shocks or technology bubbles, to assess the robustness of green cryptocurrency and sustainable market interactions.

Author Contributions

Y.J.: project administration, formal analysis, visualization, validation, acquisition, supervision, writing, review, and editing. L.S.: conceptualization, investigation, data curation, methodology, software, writing—original draft. All authors have read and agreed to the published version of the manuscript.

Funding

This research received no external funding.

Institutional Review Board Statement

Not applicable.

Informed Consent Statement

Not applicable.

Data Availability Statement

The author declares that data and materials are available.

Conflicts of Interest

The authors declare no conflicts of interest.

References

  1. Ali, S., Naveed, M., Yousaf, I., & Khattak, M. S. (2024). From cryptos to consciousness: Dynamics of return and volatility spillover between green cryptocurrencies and G7 markets. Finance Research Letters, 60, 104899. [Google Scholar] [CrossRef]
  2. Antonakakis, N., Chatziantoniou, I., & Gabauer, D. (2020). Refined measures of dynamic connectedness based on time-varying parameter vector autoregressions. Journal of Risk and Financial Management, 13(4), 84. [Google Scholar] [CrossRef]
  3. Baur, D. G., & Hoang, L. T. (2021). A crypto safe haven against Bitcoin. Finance Research Letters, 38, 101431. [Google Scholar] [CrossRef]
  4. Ben Ameur, H., Ftiti, Z., Louhichi, W., & Yousfi, M. (2024). Do green investments improve portfolio diversification? Evidence from mean conditional value-at-risk optimization. International Review of Financial Analysis, 94(1), 103255. [Google Scholar] [CrossRef]
  5. Bohte, R., & Rossini, L. (2019). Comparing the forecasting of cryptocurrencies by Bayesian time-varying volatility models. Journal of Risk and Financial Management, 12(3), 150. [Google Scholar] [CrossRef]
  6. Bouri, E., Lucey, B., & Roubaud, D. (2020). Cryptocurrencies and the downside risk in equity investments. Finance Research Letters, 33, 101211. [Google Scholar] [CrossRef]
  7. Caferra, R., & Vidal-Tomás, D. (2021). Who was raised from the abyss? A comparison between cryptocurrency and stock market dynamics during the COVID-19 pandemic. Finance Research Letters, 43, 101954. [Google Scholar] [CrossRef]
  8. Cepni, O., Demirer, R., & Rognone, L. (2022). Hedging climate risks with green assets. Economics Letters, 212, 110312. [Google Scholar] [CrossRef]
  9. Chopra, M., & Mehta, C. (2023). Going green: Do green bonds act as a hedge and haven for stock sector risk? Finance Research Letters, 51, 103357. [Google Scholar] [CrossRef]
  10. Conlon, T., & McGee, R. (2020). Safe haven or risky hazard? Bitcoin during the COVID-19 bear market. Finance Research Letters, 35, 101607. [Google Scholar] [CrossRef]
  11. Corbet, S., Hou, Y. (Greg), Hu, Y., & Oxley, L. (2021). Volatility spillovers during market supply shocks: The case of negative oil prices. Resources Policy, 74, 102357. [Google Scholar] [CrossRef]
  12. De Villiers, C., Kuruppu, S., & Dissanayake, D. (2021). A (new) role for business—Promoting the United Nations’ Sustainable Development Goals through the internet-of-things and blockchain technology. Journal of Business Research, 131, 598–609. [Google Scholar] [CrossRef]
  13. Duan, K., Huang, Y., & Mishra, T. (2023). Is Bitcoin more than a diversifier? A pre-and post-COVID-19 analysis. Finance Research Letters, 43, 102016. [Google Scholar] [CrossRef]
  14. Dutta, P., Choi, T.-M., Somani, S., & Butala, R. (2020). Blockchain technology in supply chain operations: Applications, challenges, and research opportunities. Transportation Research Part E: Logistics and Transportation Review, 142, 102067. [Google Scholar] [CrossRef]
  15. Elsayed, A. H., Gozgor, G., & Yarovaya, L. (2022). Volatility and return connectedness of cryptocurrency, gold, and uncertainty: Evidence from the cryptocurrency uncertainty indices. Finance Research Letters, 47, 102732. [Google Scholar] [CrossRef]
  16. Esparcia, C., Escribano, A., & Jareño, F. (2024). Assessing the crypto market stability after the FTX collapse: A study of high-frequency volatility and connectedness. International Review of Financial Analysis, 94, 103287. [Google Scholar] [CrossRef]
  17. Gallersdörfer, U., Klaassen, L., & Stoll, C. (2020). Energy consumption of cryptocurrencies beyond bitcoin. Joule, 4, 1843–1846. [Google Scholar] [CrossRef]
  18. Huang, J., Cao, Y., & Zhong, P. (2022). Searching for a haven from crude oil: Green bond or precious metals? Finance Research Letters, 50, 103303. [Google Scholar] [CrossRef]
  19. Klein, T., Pham Thu, H., & Walther, T. (2018). Bitcoin is not the new gold—A comparison of volatility, correlation, and portfolio performance. International Review of Financial Analysis, 59, 105–116. [Google Scholar] [CrossRef]
  20. Lee, C., Chow, Y., & McIntyre, J. (2021). Litecoin’s technological evolution and efficiency improvements. Journal of Digital Assets and Blockchain Technology, 4(2), 45–59. [Google Scholar]
  21. Li, Z., Xu, Y., & Du, Z. (2025). Valuing financial data: The case of analyst forecasts. Finance Research Letters, 75, 106847. [Google Scholar] [CrossRef]
  22. Mensi, W., Shafiullah, M., Vo, X. V., & Kang, S. H. (2022). Spillovers and connectedness between green bond and stock markets in bearish and bullish market scenarios. Finance Research Letters, 49, 103120. [Google Scholar] [CrossRef]
  23. Mensi, W., Vo, X. V., Ko, H. U., & Kang, S. H. (2023). Frequency spillovers between green bonds, global factors, and the stock market before and during the COVID-19 crisis. Economic Analysis and Policy, 77, 558–580. [Google Scholar] [CrossRef] [PubMed]
  24. Özkan, O., Meo, M. S., & Younus, M. (2024). Unearthing the hedge and safe-haven potential of green investment funds for energy commodities. Energy Economics, 138, 107814. [Google Scholar] [CrossRef]
  25. Patel, R., Gubareva, M., & Chishti, M. Z. (2024). Assessing the connectedness between the cryptocurrency environment attention index and green cryptos, energy cryptos, and green financial assets. Research in International Business and Finance, 70, 102339. [Google Scholar] [CrossRef]
  26. Patel, R., Kumar, S., Bouri, E., & Iqbal, N. (2023). Spillovers between green and dirty cryptocurrencies and socially responsible investments around the war in Ukraine. International Review of Economics & Finance, 87, 143–162. [Google Scholar] [CrossRef]
  27. Pourkermani, K. (2024). VaR calculation by binary response models. Data Science in Finance and Economics, 4(3), 350–361. [Google Scholar] [CrossRef]
  28. Ren, B., & Lucey, B. (2022). A clean, green haven? Examining the relationship between clean energy, clean and dirty cryptocurrencies. Energy Economics, 109, 105951. [Google Scholar] [CrossRef]
  29. Sedlmeir, J., Buhl, H. U., Fridgen, G., & Keller, R. (2020). The energy consumption of blockchain technology: Beyond myth. Business & Information Systems Engineering, 62(6), 599–608. [Google Scholar] [CrossRef]
  30. Smales, L. A. (2019). Bitcoin as a haven: Is it even worth considering? Finance Research Letters, 30, 385–393. [Google Scholar] [CrossRef]
  31. Torrence, C., & Compo, G. P. (1998). A practical guide to Wavelet analysis. Bulletin of the American Meteorological Society, 79, 61–78. [Google Scholar] [CrossRef]
  32. Torrence, C., & Webster, P. J. (1999). Interdecadal changes in the ENSO-monsoon System. Journal of Climate, 12, 2679–2690. [Google Scholar] [CrossRef]
  33. Truby, J. (2018). Decarbonizing Bitcoin: Law and policy choices for reducing the energy consumption of Blockchain technologies and digital currencies. Energy Research & Social Science, 44, 399–410. [Google Scholar] [CrossRef]
  34. Umar, Z., Mokni, K., Manel, Y., & Gubareva, M. (2024). Dynamic spillover between oil price shocks and technology stock indices: A country-level analysis. Research in International Business and Finance, 69, 102231. [Google Scholar] [CrossRef]
  35. Urquhart, A., & Zhang, H. (2019). Is Bitcoin a hedge or haven for currencies? An intraday analysis. International Review of Financial Analysis, 63, 49–57. [Google Scholar] [CrossRef]
  36. Wu, R., & Qin, Z. (2024). Asymmetric volatility spillovers among new energy, ESG, green bond, and carbon markets. Energy, 292, 130504. [Google Scholar] [CrossRef]
  37. Yousaf, I., Arfaoui, N., & Gubareva, M. (2024). Spillovers and hedging effectiveness between oil and US equity sectors: Evidence from the COVID-19 pre- and post-vaccination phases. Research in International Business and Finance, 69, 102204. [Google Scholar] [CrossRef]
  38. Yousaf, I., Nekhili, R., & Gubareva, M. (2021). Linkages between DeFi assets and conventional currencies: Evidence from the COVID-19 pandemic. International Review of Financial Analysis, 81, 102082. [Google Scholar] [CrossRef]
  39. Zeng, H., Huang, Q., Abedin, M. Z., Ahmed, A. D., & Lucey, B. (2025). Connectedness and frequency connection among green bond, cryptocurrency, and green energy-related metals around the COVID-19 outbreak. Research in International Business and Finance, 73, 102547. [Google Scholar] [CrossRef]
  40. Zhang, M., Zhang, C., Li, F., & Liu, Z. (2022). Green finance as an institutional mechanism to direct the belt and road initiative towards sustainability: The case of China. Sustainability, 14(10), 6164. [Google Scholar] [CrossRef]
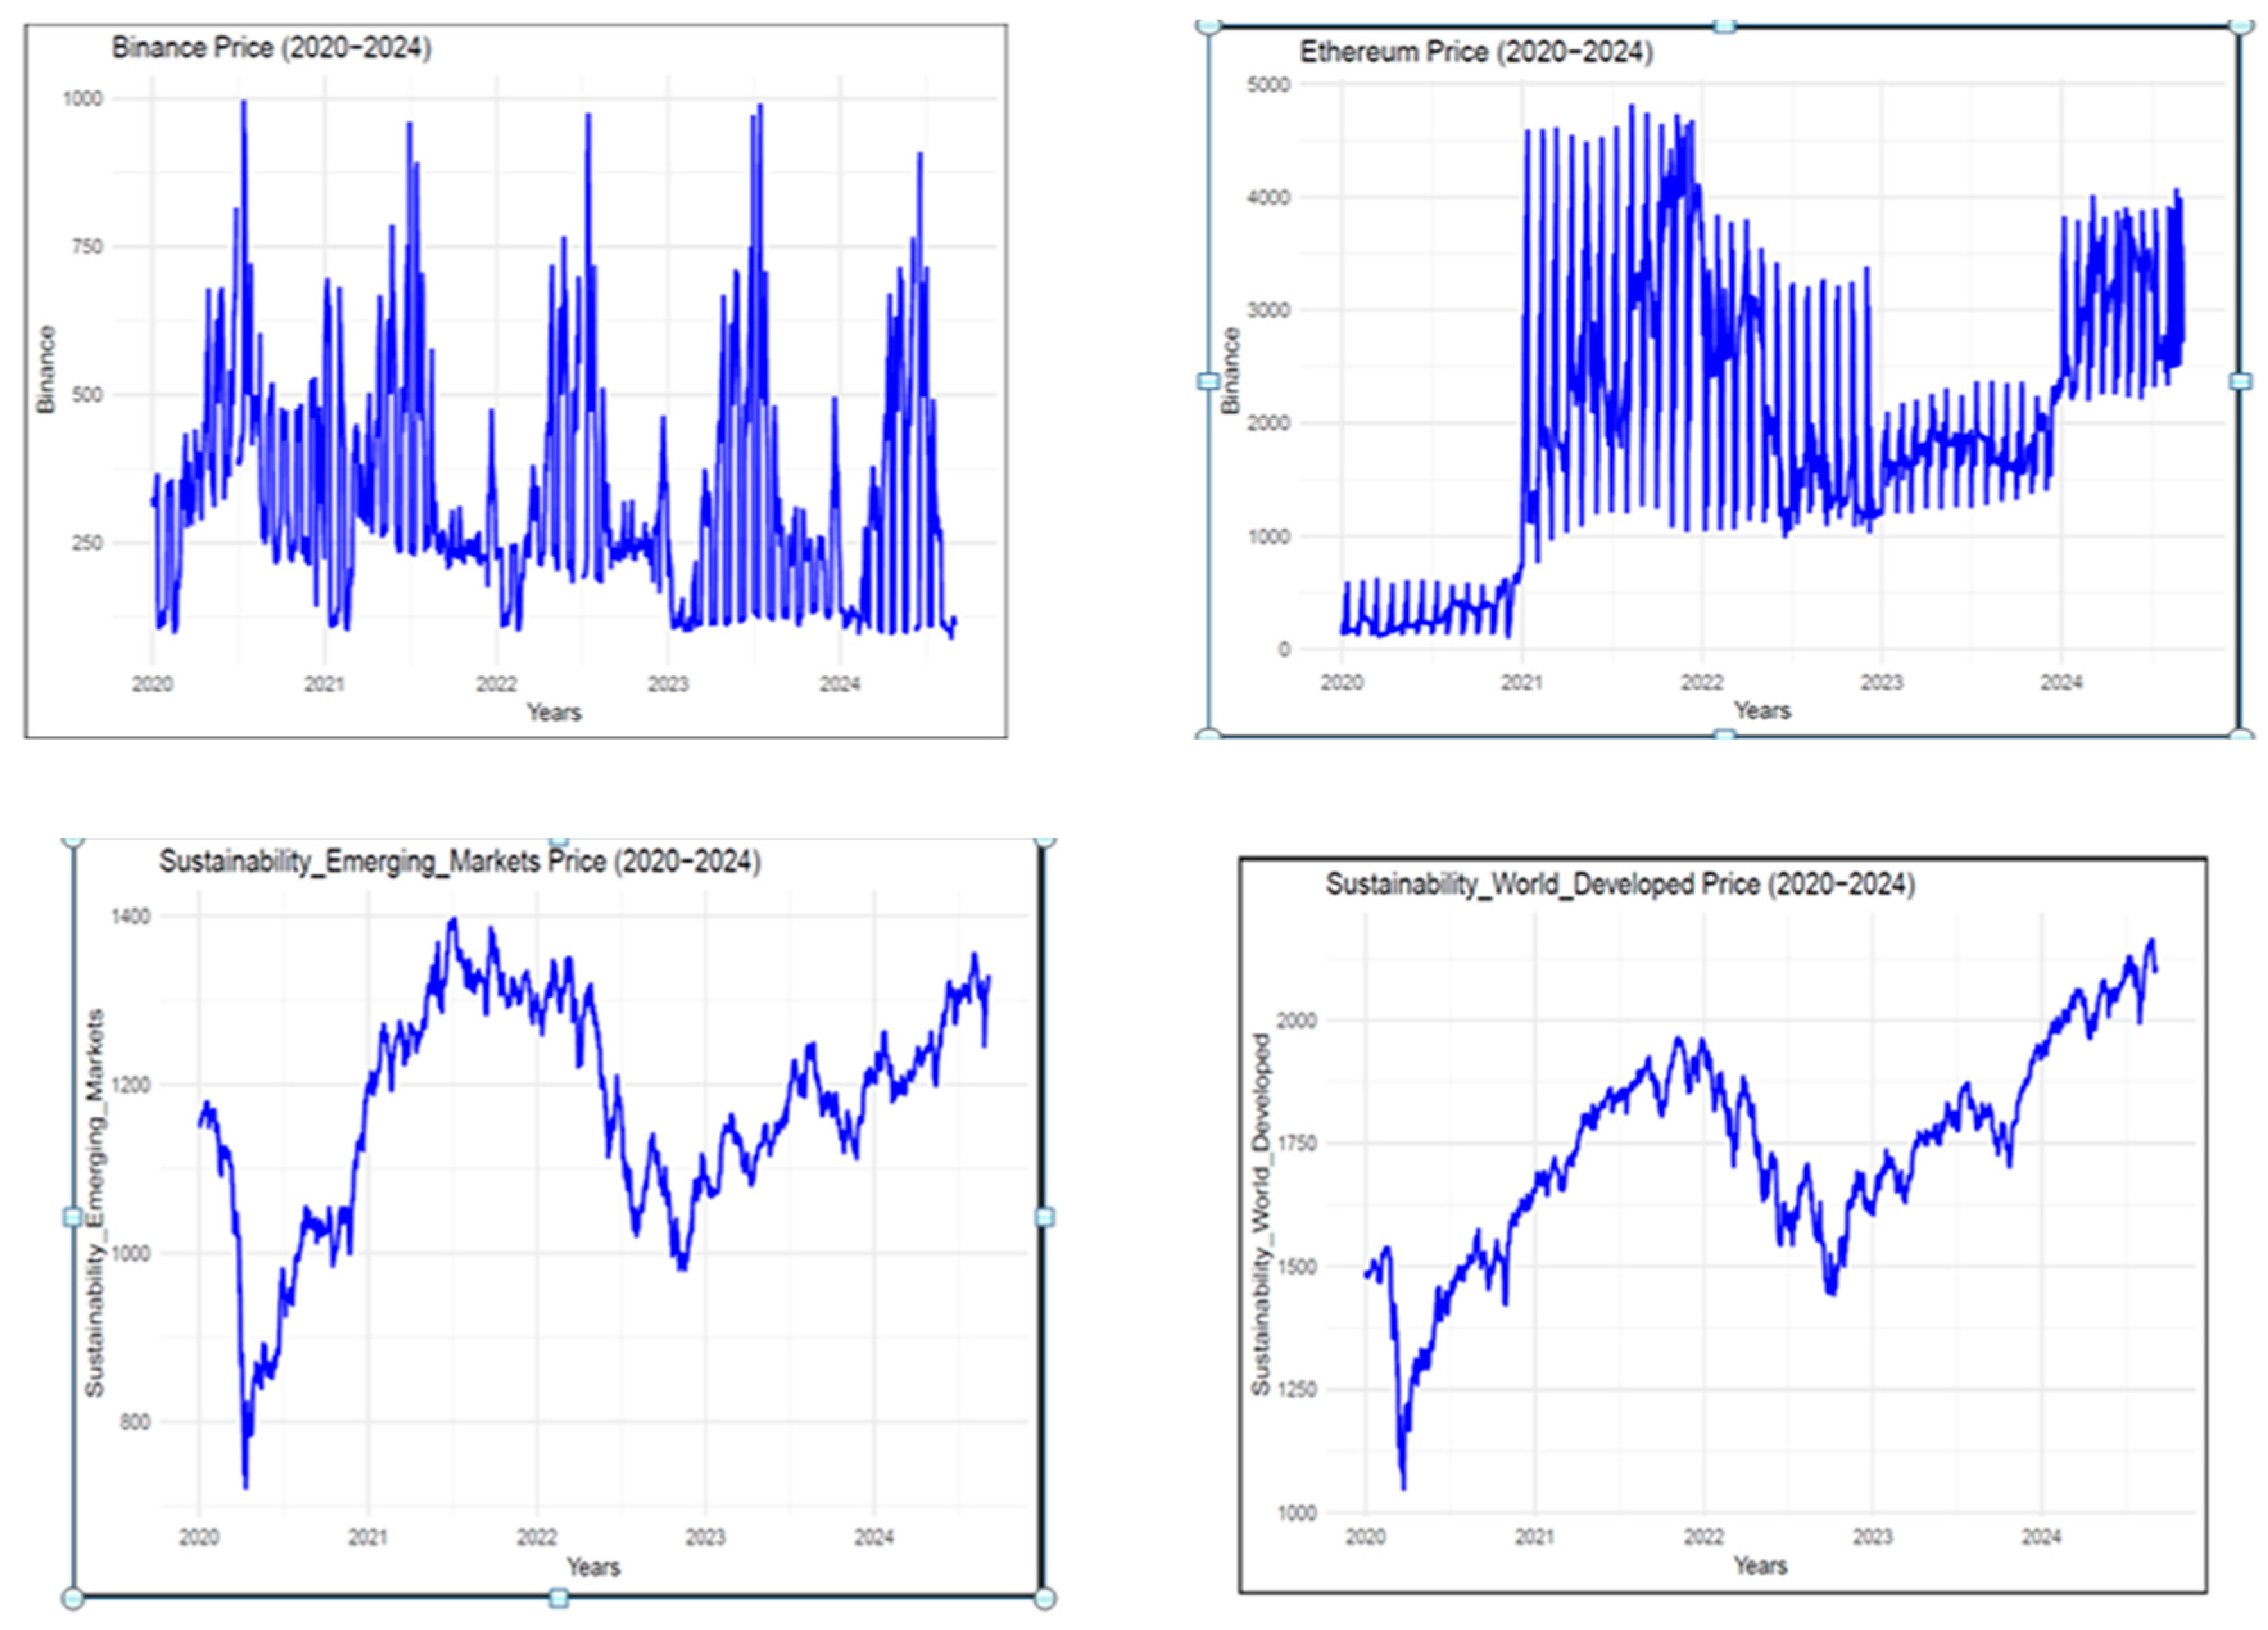
Figure 1. Daily realized prices for each market from July 2020 to September 2024. Notes: This figure illustrates the evolution of prices from July 2020 to September 2024 for nine indices, including Binance, Ethereum, Litecoin, XRP, the CCI30 Index, the Dow Jones Sustainability World Developed Index, the Dow Jones Sustainability Emerging Markets Index, the NASDAQ OMX Wind Index, and the NASDAQ OMX Solar Index.
Jrfm 18 00483 g001aJrfm 18 00483 g001b
Figure 2. Correlation matrix between market pairs.
Jrfm 18 00483 g002
Figure 3. Total connectedness indices (TCI) of returns and volatilities. Notes: This figure illustrates the total connectedness indices (TCIs) for the returns and volatilities of nine indices, including Binance, Ethereum, Litecoin, XRP, the CCI30 Index, the Dow Jones Sustainability World Developed Index, the Dow Jones Sustainability Emerging Markets Index, the NASDAQ OMX Wind Index, and the NASDAQ OMX Solar Index.
Jrfm 18 00483 g003
Figure 4. Total net time-varying connectedness for the returns. Notes: This figure shows the net connectedness of the returns of nine indices, including Binance, Ethereum, Litecoin, XRP, the CCI30 Index, the Dow Jones Sustainability World Developed Index, the Dow Jones Sustainability Emerging Markets Index, the NASDAQ OMX Wind Index, and the NASDAQ OMX Solar Index. A positive value indicates a net transmitter, whereas a negative value indicates a net receiver of spillover.
Jrfm 18 00483 g004
Figure 5. Total net time-varying connectedness of the volatilities. Notes: This figure shows the net connectedness of the returns of nine indices, including Binance, Ethereum, Litecoin, XRP, the CCI30 Index, the Dow Jones Sustainability World Developed Index, the Dow Jones Sustainability Emerging Markets Index, the NASDAQ OMX Wind Index, and the NASDAQ OMX Solar Index. A positive value indicates a net transmitter, whereas a negative value indicates a net receiver of spillover.
Jrfm 18 00483 g005
Figure 6. Connectedness networks of the returns. Notes: This graph illustrates the transitory and persistent return connectedness networks among nine indices from 2020 to 2024. The represented indices include Binance, Ethereum, Litecoin, XRP, the CCI30 Index, the Dow Jones Sustainability Indices for Developed and Emerging Markets, and the NASDAQ OMX Wind and Solar Indices. The arrows indicate the direction of connections between the indices, while the links’ thickness and color (blue and yellow) reflect their intensity. The size of the vertices represents the total “TO” spillovers for each index, highlighting their role and importance in the network dynamics.
Jrfm 18 00483 g006
Figure 7. Connectedness networks of the volatilities. Notes: This graph illustrates the transitory and persistent return connectedness networks among nine indices from 2020 to 2024. The represented indices include Binance, Ethereum, Litecoin, XRP, the CCI30 Index, the Dow Jones Sustainability Indices for Developed and Emerging Markets, and the NASDAQ OMX Wind and Solar Indices. The arrows indicate the direction of connections between the indices, while the links’ thickness and color (blue and yellow) reflect their intensity. The size of the vertices represents the total “TO” spillovers for each index, highlighting their role and importance in the network dynamics.
Jrfm 18 00483 g007
Figure 8. Wavelet coherence between the CCI30 index and various assets from July 2020 to September 2024.
Jrfm 18 00483 g008aJrfm 18 00483 g008bJrfm 18 00483 g008c
Table 1. Descriptive statistics results for the daily data.
MeanSDSkewnessKurtosisJarque-BeraPP
Binance−0.02370.25600.1250−1.22992499.9 227.08  
Ethereum0.00170.22120.0032−1.200149.486 129.57  
Litecoin−0.00010.2011−0.0123−1.19611563.8 190.51  
XRP0.00060.23730.0314−1.1573775.86 213.62  
CCI30 Index9.8653 × 10−50.04130.0020−1.20162678 9.6385  
Sustainability World Developed0.00020.0090−0.0079−1.198938.053 8.5895  
Sustainability Emerging Markets8.4872 × 10−50.00880.0085−1.2013137.28 6.7386  
NASDAQ OMX Wind−4.0162 × 10−50.08030.0148−1.2000280.7 135.35  
NASDAQ OMX Solar0.00070.0214−0.0199−1.1989264.4 9.2039  
Note: ** Significant at the 5% level; *** Significant at the 10% level.
Table 2. Averaged connectedness returns results.
CCI30IndexEthereumLitecoinXRPBinanceSustainability Emerging Markets Sustainability Emerging Developed NASDAQ OMX Solar NASDAQ OMX Wind FROM
CCI30_Index91.040.791.250.731.111.501.151.291.158.96
Ethereum0.6459.212.3631.273.480.841.280.590.3240.79
Litecoin9.461.7963.711.8729.030.911.260.490.4936.29
XRP0.5030.061.8762.622.010.990.910.560.4837.38
Binance0.422.6729.082.3062.790.690.940.620.4937.21
Sustainability Emerging Markets0.860.980.660.831.1692.881.340.710.577.12
Sustainability Developed Markets0.630.941.681.041.001.0892.240.710.677.76
NASDAQ OMX Solar1.571.010.940.920.851.580.8991.520.738.48
NASDAQ OMX Wind1.201.031.250.792.271.241.230.7690.239.77
TO 6.2939.0839.0839.7540.928.838.995.744.89193.77
NET−2.67−1.512.792.373.701.711.23−2.74−4.88CTCI/TCI
NPT2.004.007.006.006.005.005.001.000.0024.22/21.53
Notes: This table presents the average connectedness results for the returns. It includes the contributions “TO” (from) other variables, pairwise spillovers, and total connectedness indices (TCIs).
Table 3. Averaged connectedness volatility results.
CCI30IndexEthereumLitecoinXRPBinanceSustainability Emerging Markets Sustainability Developed MarketsNASDAQ OMX Solar NASDAQ OMX Wind FROM
CCI30_Index76.361.833.663.832.362.502.002.275.1923.64
Ethereum1.2951.445.8424.677.461.151.751.804.6048.56
Litecoin1.016.0053.896.8026.600.910.961.812.0246.11
XRP1.6023.625.7152.625.341.791.912.115.3047.38
Binance1.317.4527.715.5651.131.481.101.682.6048.87
Sustainability Emerging Markets2.044.324.941.964.0974.871.863.712.2125.13
Sustainability Developed Markets3.533.912.604.082.432.0273.113.774.5526.89
NASDAQ OMX Solar3.162.733.972.024.211.142.4776.933.3623.07
NASDAQ OMX Wind1.8010.064.458.504.332.501.742.7563.8736.13
TO15.7559.9158.8957.4156.8213.4813.7919.9029.84325.78
NET−7.8911.3512.7710.037.95−11.65−13.10−3.17−6.29CTCI/TCI
NPT2.006.006.007.006.003.000.003.003.0040.72/36.20
Notes: This table presents the average connectedness results for the volatilities. It includes the contributions “TO” (from) other variables, pairwise spillovers, and total connectedness indices (TCIs).
Disclaimer/Publisher’s Note: The statements, opinions and data contained in all publications are solely those of the individual author(s) and contributor(s) and not of MDPI and/or the editor(s). MDPI and/or the editor(s) disclaim responsibility for any injury to people or property resulting from any ideas, methods, instructions or products referred to in the content.