Abstract
This study evaluates the performance of U.S. data center Exchange-Traded Funds (ETFs) relative to major equity and technology benchmarks, using monthly returns from January 2000 through December 2024, with particular emphasis on the COVID-19 period and the subsequent post-vaccine era. Data center ETFs have not provided better risk-adjusted returns even though they are often advertised as access points to the digital economy. Digital infrastructure demand increased through the pandemic but did not improve the performance of these funds which stayed weak across both traditional and conditional multi-factor asset pricing models. These ETFs struggle with asset selection and market timing proficiency, which leads to relatively poor performance results during volatile market conditions. The downside risks linked to these funds tend to match or exceed the downside risks of broader indices like the S&P 1500 Information Technology Index. Although these investments are based on strong thematic narratives, they do not achieve returns that align with investor expectations.
1. Introduction
The digital economy’s exponential growth has made data centers indispensable for technological development because they enable progress in cloud computing and both artificial intelligence (AI) and the Internet of Things (IoT). Specialized Exchange-Traded Funds (ETFs) are becoming more popular with investors interested in gaining access to the fast-expanding digital infrastructure sector. The Global X Data Center & Digital Infrastructure ETF (DTCR) alongside the Pacer Benchmark Data & Infrastructure Real Estate SCTR ETF (SRVR) delivers diversified investment opportunities into data center Real Estate Investment Trusts (REITs) as well as technology firms that support digital operations (U.S. News & World Report, 2024).
The increasing popularity of thematic investments masks a crucial lack of conclusive evidence about whether data center ETFs provide their promised superior performance. Investors are told that these funds match digital transformation trends, yet research rarely evaluates their risk-adjusted returns or verifies if performance justifies investor interest. Standard performance metrics fail to recognize the unique volatility characteristics and cross-sector risks inherent to data center ETFs which operate at the juncture of real estate and fast-changing technology markets (Malhotra, 2023). The growing integration of AI technologies into financial markets has made the environment more intricate by increasing requirements for advanced data processing capabilities while simultaneously raising the risk of technological obsolescence (Kiriha & Motoo, 2013).
This research fills an important void by delivering an extensive performance evaluation of data center ETFs in the United States that accounts for risk adjustment. Our analysis involves the use of multiple performance metrics such as Sharpe, Sortino, and Omega ratios to evaluate if these funds deliver returns that match their risk levels. We establish meaningful benchmarks by evaluating their performance against broad equity indices as well as technology-focused indices like the NASDAQ-100 and S&P 1500 Information Technology Indices.
The study investigates whether ETF portfolio managers demonstrate expertise in managing the intricate relationship between real estate assets that generate income and fast-growing technology companies. The push for digitization combined with growing demand for data infrastructure makes it crucial to examine ETF performance during different market conditions, especially through the COVID-19 pandemic and subsequent economic recovery period.
The explosive growth in the number and size of data center ETFs demonstrates why this study is particularly important. The count of data center ETFs expanded from three beginnings in January 2000 to reach 180 by December 2024 with a total market capitalization beyond $314 billion according to Morningstar Direct. The dramatic rise indicates both strong investor interest and the increasing role of digital infrastructure in defining upcoming economic conditions.
The research provides fresh perspectives on data center ETF dynamics which will support investors with their decision-making processes and portfolio construction while also guiding future ETF product development. The resulting insights will help individual investors who want thematic exposure while supporting institutional portfolio managers with sector allocation assessments and enabling fund designers to improve ETF structures to achieve superior risk-adjusted results.
The study is structured as follows: Section 2 presents an overview of prior studies on ETF performance. Section 3 digs into the data set used in this investigation. Section 4 discusses different methods for assessing performance. Section 4 also provides an overview of empirical results. Finally, Section 5 provides a summary and conclusion regarding our work.
2. Previous Studies
Exchange-traded funds (ETFs) have been the subject of empirical inquiry for close to three decades. Seminal studies document their liquidity advantages, low tracking error, and ability to crowd out actively managed alternatives (Ang et al., 2006; Blitz & Huij, 2012). The follow-on literature, meanwhile, establishes that the average factor and broad-based ETF struggles to beat naïve benchmarks after accounting for fees and trading frictions (Blitz & Vidojevic, 2021). In other words, ETFs are approximately as efficient as the theory would lead one to expect. This line of work offers only limited insight into the burgeoning universe of thematic funds that seek to capture narrow economic segments.
Sector-level analyses begin to fill this void. Malhotra and Marino (2024) show that U.S. healthcare ETFs provide little diversification value to portfolios already exposed to large home-country equity positions, whereas Malhotra and Napoleon (2024) find that diversified emerging-market ETFs deliver only modest alpha and downside protection relative to global equity funds. In both cases, the underlying economic rationale for the theme does not translate into risk-adjusted outperformance when conventional risk factors are controlled for.
Technology-focused funds hold a special place in the thematic pantheon but have attracted surprisingly little systematic attention. Malhotra (2023) fills part of this gap by examining U.S. technology mutual funds and ETFs vis-à-vis sector benchmarks over 2010–2021. The author finds that technology mutual funds outperform both ETFs and the NASDAQ-100 in absolute and risk-adjusted terms, but that a conditional model reveals little market-timing or security-selection skill for either product.
The present study advances the argument in several other ways as well. For one, it treats the technology sector not as a monolith, but as a constellation of distinct sub-segments. Semiconductors, cybersecurity, and cloud infrastructure providers all feature prominently in portfolio positions of technology funds, but so do an array of specialized “data centers.” The digital economy disaggregates itself into narrower silos, and these data havens represent one of the more recent entries into this process.
To our knowledge, no published research dissects the performance of ETFs that are explicitly on data-center real estate and operators, despite a sector role as the backbone of cloud computing, AI, and IoT. This omission is more striking because data centers have been styled in the popular press as “picks-and-shovels” for the ongoing digital gold rush, and because the absence of prior empirical work means that a growing segment of thematic ETFs lacks a simple risk-adjustment benchmark. We redress this gap in three ways.
First, we focus on data-center ETFs rather than the broader technology cohort, which permits a cleaner test of whether investors are compensated for bearing the idiosyncratic hybrid risks that sit at the intersection of real estate-like cash flows and the otherwise rapid hardware obsolescence of technology-related investments. Second, we use a 25-year sample period that includes the dot-com crash of the early 2000s, the Global Financial Crisis, and the COVID-19 pandemic, as opposed to earlier ETF studies largely limited to the 2010s. Third, we combine traditional Sharpe, Sortino, and Omega ratios with a Fama and French (1993, 2015) five-factor plus momentum model, conditional alpha estimates à la Ferson and Schadt (1996), and Treynor and Mazuy (1966) market-timing tests. Our multi-layered performance framework allows us to see whether any observed outperformance withstands the inclusion of time-varying factor loadings and extreme downside tail risk.
This study builds on prior work in technology and thematic investing by providing an empirical analysis of data center ETFs as a focused digital infrastructure theme. It examines whether these ETFs deliver superior risk-adjusted returns relative to both the technology sector and broad equity benchmarks. The analysis also considers changing market conditions to evaluate whether ETF managers demonstrate consistent skill across different economic environments.
3. Data
We analyzed the performance of data center exchange traded funds (ETFs) based on monthly return data obtained from Morningstar Direct. In January 2000, we had only three data center ETFs, and the number of ETFs increased to 180 by December 2024. All ETFs included in the sample are actively managed. As of December 2024, the average turnover ratio of these funds was 87.13%. The average annual adjusted expense ratio was 0.52% of the average ETF in December 2024. Historical trends show that the average expense ratio has increased from 0.35% in 2006 to 0.52% in 2024. The average turnover ratio has increased from 27.34% in 2000 to 75.66% in 2024. Total assets under management (AUM) for the sample of U.S. data center ETFs was $314 billion as of December 2024. The average size of the ETF in the sample was $1.6 billion in December 2024. Average AUMs have continued to increase, with active ETFs seeing an increase in average assets from $22 billion in 2022 to $24 billion in 2024. Figure 1 shows the growth in the number of data center exchange traded funds since January 2000.
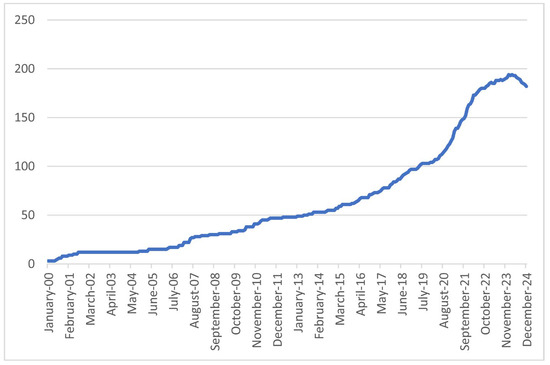
Figure 1.
Number of Data Center Exchange Traded Funds (January 2000–December 2024).
We evaluate the performance of U.S. Data Center ETF returns by comparing them to three major benchmarks: The S&P 1500 Information Technology Index along with the NASDAQ Composite Index and the Russell 3000 Equally Weighted Index to understand performance differences between specialized funds and broader market plus sector-specific indices. This comparison relies on three separate benchmarks because each one serves a different purpose. The S&P 1500 Information Technology Index measures technology company performance which includes many firms focusing on digital infrastructure similar to data center ETFs. This index allows us to examine the strengths and weaknesses of data center ETFs in comparison to other sector investments.
The NASDAQ Composite Index, which contains many innovative and high growth companies, serves as an additional reference point. NASDAQ serves as a performance benchmark for data center ETFs because the companies within these ETFs function in the rapidly changing digital and cloud-based economy which mirrors the drivers shaping NASDAQ’s performance. The Russell 3000 Equally Weighted Index serves as a representation for the wider U.S. stock market by providing balanced exposure across different company sizes and industry sectors. Analyzing data center ETFs against this broad benchmark reveals if the concentrated investment strategy improves or reduces overall performance.
Examining these three benchmarks allows us to understand how data center ETFs perform both separately and within the general investment market. The applied method enables us to assess if these ETFs offer unique risk-return characteristics attractive to investors interested in both technological growth opportunities along with real asset investment.
The data on monthly returns was used to calculate mean returns and standard deviations as well as average returns per unit of risk. Table 1 shows the monthly rate of return averages for Data Center ETFs and indices with data spanning January 2000 through December 2024.

Table 1.
Summary statistics of monthly rates of returns (January 2000 to December 2024).
Data Center ETFs produced a mean monthly return of 0.65 percent over the sample period of January 2000 to December 2024, much lower than the S&P 1500 IT Index (0.91 percent) and the Russell 3000 (0.86 percent), but only slightly below the NASDAQ Composite (0.72 percent). At 5.08 percent, Data Center ETFs also showed the lowest standard deviation among all four indices, suggesting reduced volatility. Data Center ETFs had a return per unit of risk of 0.13 when adjusted for risk, on par with the S&P 1500 IT Index but significantly higher than NASDAQ (0.11) and somewhat lower than the Russell 3000 (0.14).
Though Data Center ETFs still fell short of the benchmarks in absolute terms, yielding 0.88 percent monthly against 2.16 percent for the S&P 1500 IT Index and 1.60 percent for the NASDAQ, all assets saw greater mean returns over the COVID-19 and post-vaccination period (2020–2024). Curiously, Data Center ETF volatility rose to 5.73 percent yet stayed the lowest among the group. The return-to-risk ratio rose to 0.15, which, although still behind the benchmarks, suggests better performance in volatile conditions.
These results imply that although Data Center ETFs provide somewhat lower returns, they make up for it with lower volatility. Their performance has been more consistent, even during times of market instability, which can attract investors looking for exposure to digital infrastructure with more modest risk. The relatively constant return-to-risk ratio throughout time emphasizes the defensive character of the industry in relation to more general market fluctuations.
4. Methodology and Empirical Analysis
To evaluate risk-adjusted performance, we employed the Sharpe ratio (Sharpe, 1966), Sortino ratio (Sortino & van der Meer, 1991), and Omega ratio (Keating & Shadwick, 2002). In addition, factor models are often used in investment research as structured analytical tools. These models reveal sensitivities to various drivers such as market trends, economic conditions, and sector-specific attributes, offering deeper insight into the underlying sources of investment performance.
Furthermore, we also use the Fama-French five-factor model reinforced with a momentum factor to evaluate the performance of data center ETFs. By including market risk, size, value, profitability, and investment factors with momentum—a well-documented return anomaly especially significant for technology-oriented companies—this extended model provides a complete framework for accounting for cross-sectional variation in returns. In the case of data center ETFs, including the momentum (MOM) aspect is very pertinent. Many of the underlying businesses in these ETFs—including those connected to cloud computing, artificial intelligence infrastructure, and cybersecurity—show significant momentum qualities motivated by technology adoption cycles and investor mood. Overlooking the momentum impact could skew the alpha calculation and overlook a well-documented asset pricing oddity.
Equation (1) presents the five-factor plus momentum model. This model is calculated using monthly returns. Equation (1) presents the five-factor plus momentum model. This model is calculated using monthly returns.
where Ri,t = the percentage return for firm i in month t.
Rf,t = the yield on US Treasury bill month t.
Rm,t = the return on CRSP value-weighted index for month t.
The variable is the market risk factor and represents the excess return of the overall market and accounts for the general risk associated with investing in the stock market
SMBt (Small minus Big) = The SMB factor measures the historical performance difference between small-cap stocks and large-cap stocks. It is calculated as the return of a portfolio of small-cap stocks minus the return of a portfolio of large-cap stocks. A positive SMB suggests that small-cap stocks have outperformed large-cap stocks.
HMLt (High minus Low) = The HML factor represents the historical performance difference between value stocks and growth stocks. It is calculated as the return of a portfolio of value stocks (those with a low price-to-book ratio) minus the return of a portfolio of growth stocks (those with a high price-to-book ratio). A positive HML indicates that value stocks have outperformed growth stocks.
RMW (Robust minus Weak) = This factor measures the historical performance difference between profitable and unprofitable companies. It is calculated as the return of a portfolio of profitable companies minus the return of a portfolio of unprofitable companies. A positive RMW suggests that profitable companies have outperformed unprofitable companies.
CMA (Conservative minus Aggressive) = The CMA factor represents the historical performance difference between conservative (low investment) and aggressive (high investment) companies. It is calculated as the return of a portfolio of conservative companies minus the return of a portfolio of aggressive companies. A positive CMA indicates that conservative companies have outperformed aggressive companies.
MOM (Momentum) = momentum captures the persistence of relative performance of an asset. Momentum refers to the tendency of strong-performing assets to continue rising, while poor performers tend to keep underperforming.
εi,t = an error term.
4.1. Robustness Check
We checked the robustness of our findings by including conditional alphas and market-timing and selectivity evaluations of U.S. data center exchange traded funds in our analysis. We perform supplementary evaluations to strengthen our conclusions and confirm their stability across different methodological approaches and scenarios.
Conditional Factor Models: The performance assessment of managed funds represents a fundamental focus within investment research fields. Investors have commonly relied on traditional metrics like the Sharpe ratio and Jensen’s (1968) alpha to evaluate risk-adjusted returns. These approaches generally presume unchanging risk exposures but do not accommodate financial markets’ changing characteristics. These measures might create distortions because they overlook time-dependent changes in risk and risk premiums.
In response to these identified limitations Ferson and Schadt (1996) developed a conditional performance evaluation framework that uses time-varying information. Their framework expands the Jensen’s (1968) alpha model by incorporating a vector of delayed public information variables which results in a more precise calculation of conditional alpha. The proposed change substitutes unconditional betas with time-varying conditional betas and expected returns to create a dynamic view of fund performance. The researchers discovered that adding lagged interest rates and dividend yields to performance models improves predictive power and helps investors foresee future market conditions due to their known relationship with stock returns.
Ferson and Schadt (1996) introduced a conditional method that uses common financial measures like the three-month Treasury bill rate (TR3M), the term structure slope (SLOPE) which calculates yield differences between 30-year Treasury bonds and three-month Treasury bills, the corporate bond market quality spread (QS) obtained from Moody’s BAA- and AAA-rated corporate bond yield differences, and the dividend yield of the S&P 500 Index. By implementing a one-month lag on these variables researchers can better capture temporal dynamics which strengthens performance assessment robustness.
The following equation presents the resulting conditional models, where Zj,t−1 represents the demeaned value of the unconditional elements:
Market Timing and Selectivity: Selectivity refers to a fund manager’s capacity to pinpoint assets which will produce better than average future returns. Market timing demonstrates how a manager adjusts their portfolio based on predictions about upcoming market shifts and asset price changes. These two concepts play essential roles in assessing managerial performance while multiple important studies have investigated these aspects. Seminal studies by Treynor and Mazuy (1966), Kon and Jen (1978), Henriksson and Merton (1981), and Lee and Rahman (1990) analyzed mutual fund managers’ market timing skills and asset selectivity abilities.
Treynor and Mazuy (1966) developed a new method that added a quadratic term to CAPM for market timing evaluation. This modification created a means to evaluate whether managers could effectively adapt their portfolio holdings according to expected market movements.
This study uses the following foundational model, introduced by Treynor and Mazuy (1966) to augments the CAPM or market model with a quadratic component to capture market timing and selectivity:
The coefficient β2 provides insight into the manager’s ability to accurately predict market performance by examining the relationship between the portfolio return and the market return in a non-linear manner. A positive and statistically significant β2 indicates superior market timing skills, suggesting that the manager can effectively anticipate market movements. Conversely, a negative and statistically significant β2 suggests poor market timing abilities. A negative value for β2 indicates that the fund manager lacks market timing abilities. On the other hand, α represents selectivity, which refers to the manager’s skill in selecting individual securities that outperform the market.
4.2. Analysis of the Downside Risk of Monthly Returns
Value at Risk (VaR) and Expected Shortfall (ES) are two risk measures commonly used in finance to assess potential losses in an investment portfolio under adverse market conditions. Both measures provide insights into the potential downside risks associated with a data center ETF, thus aiding in the evaluation of ETF’s robustness.
VaR is a statistical measure used to estimate the maximum potential loss that an investment portfolio may incur over a specified time horizon at a certain confidence level. For ETFs, VaR can be employed to understand the potential downside risk associated with the fund’s investments. A lower VaR indicates that the fund is less exposed to extreme losses, while a higher VaR suggests higher potential losses during adverse market conditions. By comparing the VaR of different ETFs, investors can evaluate which funds demonstrate stronger risk management and performance stability. This analysis helps identify ETFs better equipped to handle market volatility and potential losses, enabling more informed investment decisions.
ES, also known as conditional VAR (CVaR), extends beyond VaR by providing information about the expected magnitude of losses that exceed the VaR threshold. ES measures the average loss that can be expected when losses exceed the VaR threshold. Like VaR, ES helps investors understand the potential downside risk of an ETF. An ETF with a lower ES implies that the losses incurred beyond the VaR threshold are less severe on average, indicating better risk management and more robust performance.
4.3. Empirical Analysis
Table 2 compares U.S. Data Center ETF returns with the S&P 1500 Information Technology Index, NASDAQ Composite Index, and Russell 3000 Equally Weighted Index over two periods: January 2000–December 2024 and March 2020–December 2024 (COVID-19 and post-vaccination).
Table 2.
Correlation Matrix of Monthly Returns (January 2000–December 2024).
From January 2000 to March 2024, the Data Center ETFs demonstrated strong positive correlations with each of the three benchmarks. Data Center ETFs show their strongest correlation with the Russell 3000 Index at 0.93 while the NASDAQ Composite follows with 0.87 and the S&P 1500 Information Technology Index at 0.83. Data center ETFs offer precise exposure to digital infrastructure yet maintain strong connections to general market movements specifically within broad-based and tech-focused indices. Data center ETFs show similar performance patterns to a broad spectrum of U.S. equities based on their robust relationship with the Russell 3000 Index despite their specialization in a particular sector.
The period between 2020 and 2024 saw these correlations grow stronger during the pandemic and the subsequent vaccine and recovery phase. Data center ETFs’ correlations rose to 0.93 with the S&P 1500 IT Index and 0.94 with the NASDAQ. The relationship between data center ETFs and the Russell 3000 maintained a consistent correlation of 0.94. The strengthening correlations indicate digital infrastructure’s growing importance in the economy because remote work, cloud computing and e-commerce expanded rapidly during this period. Data center ETFs began to show greater alignment with major indices that were also experiencing gains from this transition.
The correlation analysis tells us that while Data center ETFs deliver targeted investment in an essential modern economic area, their returns move in tandem with the wider equity market patterns. The alignment between data center ETFs and broader market indices becomes particularly strong during technological advancements and market rebounds as seen in the time of COVID-19. Investors who seek portfolio diversification should understand that data center ETFs reflect the trends of the wider market and technology sector more than their specialized designation implies.
Table 3 summarizes the risk-adjusted performance of Data Center ETFs versus the S&P 1500 Information Technology Index, NASDAQ Composite, and Russell 3000 Index for two periods: January 2000–December 2024 (full sample) and March 2020–December 2024 (COVID-19 and post-vaccination).
Table 3.
Summary of Risk-adjusted performance (January 2000 to December 2024).
Data Center ETFs demonstrate modest risk-adjusted returns during the period with Sharpe and Sortino ratios of 0.10 and 0.14, respectively, which fall marginally below benchmark indices. The S&P 1500 Information Technology Index demonstrates marginally better performance with Sharpe and Sortino ratios of 0.11 and 0.16, respectively. Data Center ETFs display an Omega ratio of 1.30 which shows that their gains exceed losses but remain below benchmark ratios.
The performance dynamics show a notable change during the turbulent times starting from March 2020 onwards. The Omega ratios for all investment vehicles improved significantly to levels above 9, which indicates their strong potential for positive returns compared to their risks of losses. The Russell 3000 Index achieves the highest Omega ratio at 10.40 compared to other indices. Data Center ETFs show significant improvement with their Omega rating of 9.11 but continue to perform below broad market benchmarks. The Sharpe and Sortino ratios increased across all indexes during this sub-period, yet Data Center ETFs showed the lowest absolute performance with a Sharpe ratio of 0.12 and a Sortino ratio of 0.17. The S&P 1500 Information Technology Index reaches a Sharpe ratio of 0.30 and a Sortino ratio of 0.52.
During COVID-19 crisis periods Data Center ETFs show favorable upward potential but lag behind broader market benchmarks and technology-focused indexes in terms of risk-adjusted performance efficiency. Investors and portfolio managers should understand from this analysis that although Data Center ETFs support digital infrastructure growth themes, they may not provide enough risk-adjusted returns to warrant their use instead of traditional diversified indices.
To shed more light on the performance behavior over the COVID-19 period, we calculated a rolling 12-month Sharpe ratio based on monthly excess returns. The resulting time series is shown in the right-hand panel of Figure 2. It allows us to take a closer look at how risk-adjusted performance of Data Center ETFs developed over the course of the pre-crash period, during the shock event, and in the recovery phase.
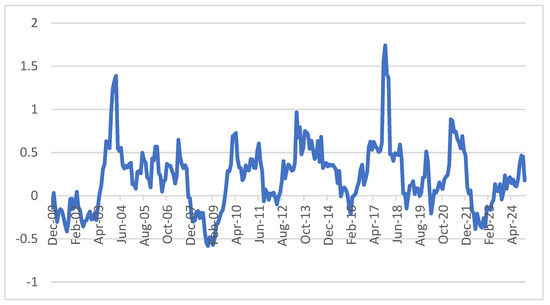
Figure 2.
Tweleve Month Rolling Sharpe Ratio of Data Center ETFs.
For completeness, we note again that January and February 2020 were classified as the pre-crash period and February–April 2020 as the shock period. We can see that the rolling Sharpe ratio began to deteriorate quite markedly from March 2020, as returns fell into negative territory and volatility picked up sharply. It subsequently increased as the market rebounded, but it continued to be more volatile and generally lower than in the pre-crisis period over the course of 2020.
This is in line with the overall finding that Data Center ETFs did not offer a stable risk-adjusted performance during the most difficult market conditions. Despite the thematic relevance of the digital infrastructure boom during the pandemic, the funds did not manage to consistently turn it into an edge in terms of excess returns on a risk-adjusted basis.
The rolling Sharpe result is thus yet another piece of evidence against the resilience of Data Center ETFs during market crises and a reason to approach them with caution in portfolio construction, in particular in core positions.
Table 4 displays net monthly alpha findings for U.S. Data Center Exchange-Traded Funds (ETFs) across two separate time frames, January 2000 to December 2024 and March 2020 to December 2024, based on the augmented Fama-French five-factor model with momentum. The study shows that Data Center ETFs delivered lower risk-adjusted returns during both periods analyzed.
Table 4.
Net Monthly Alpha of Data Center ETFs (January 2000–December 2024).
The calculated alpha over the whole data period (2000–2024) is −0.05 percent and statistically insignificant, implying that the ETFs did not produce excess returns above what would be anticipated from their exposure to shared risk elements. But during the COVID and post-vaccination period (2020–2024), the alpha drops more significantly to −0.41 percent and is statistically significant at the one percent level. This suggests a marked and consistent underperformance of Data Center ETFs in comparison to the benchmark model during the recent market environment, which could indicate sector-specific issues or a failure to take advantage of more general market trends during a time of increased volatility and digital transformation.
From 0.90 in the complete sample to 0.97 in the post-2020 period, the modified R2 shows a significant increase, implying that the factor model accounts for more return variation during this more recent time frame. In both times, the market risk premium (Mkt-RF) is quite important, suggesting considerable movement with market returns. Reflecting a tendency toward smaller-capitalization companies, size exposure (SMB) is positive and statistically significant. Implying underexposure or contrarian behavior relative to momentum trends, the momentum factor (MOM) is especially negative and statistically significant across the full sample period of 2000 to 2024 at −0.10. Strangely, this impact vanishes in the post-2020 era when momentum exposure turns unimportant.
Though RMW turns quite negative throughout the COVID and post-vaccination period, implying a negative association with the profitability premium during that time, profitability (RMW) and investment (CMA) are not statistically significant in most situations.
Overall, the findings show that although Data Center ETFs closely match overall market and size variables, they have found it difficult to provide consistent alpha—especially lately, which suggests possible inefficiencies or structural limits in this thematic area.
Table 5 presents a comparative analysis of the net monthly alphas for Data Center Exchange-Traded Funds (ETFs) and three broad market indices—the S&P 1500 Information Technology Index, NASDAQ Composite Index, and Russell 3000 Index—employing the Fama-French five-factor model with an additional momentum factor. The evaluation covers two distinct periods: January 2000 to December 2024, and a focused subperiod from March 2020 to December 2024.
Table 5.
Net Monthly Alphas for Data Center ETFs and Benchmarks (January 2000–December 2024).
Though not statistically significant, Data Center ETFs produced a slightly negative alpha of −0.05 percent for the whole sample period, suggesting no significant excess return beyond what is accounted for by usual risk variables. By contrast, at the 5 percent significance level, the S&P 1500 Information Technology Index produced a statistically significant positive alpha of 0.37 percent per month, suggesting that actively investing in the larger technology sector offered better risk-adjusted returns compared to Data Center ETFs. The NASDAQ Composite Index showed a lesser but notable positive alpha of 0.17 percent (notable at the 10 percent level), whereas the Russell 3000 Index showed a low and statistically unimportant alpha of 0.03 percent.
During the period from March 2020 to December 2024, which includes the COVID and post-vaccination era, the difference became more apparent. Data Center ETFs exhibited a statistically significant negative alpha of −0.41 percent per month at the 1 percent significance level. This significant underperformance compared to the model benchmarks implies that Data Center ETFs could not convert thematic growth into better risk-adjusted returns during this time given the increasing need for digital infrastructure. In contrast, the S&P 1500 Information Technology Index kept outperforming with an alpha of 0.55 percent (notable at the 5 percent threshold), so stressing the robustness and alpha-generating capacity of the larger tech sector. While the Russell 3000 Index fell somewhat with a negative and a statistically inconsequential alpha of −0.18 percent, the NASDAQ Composite Index recorded a positive but statistically insignificant alpha of 0.22 percent.
Table 5 shows that, particularly during the recent period affected by the pandemic, Data Center ETFs performed less strongly compared to broader market and technology benchmarks. The findings cast doubt on the sector’s efficiency in capturing the returns linked with its underlying growth story and imply that more exposure to other technology indexes could have provided investors with a better alpha throughout the research period.
Additionally, to verify the reliability of our findings, we evaluate the performance of data center exchange-traded funds (ETFs) against a more specific benchmark, the NASDAQ 100 Technology Index. The data for the NASDAQ 100 Technology Index is accessible as of February 2010. The results confirm that while Data Center ETFs offer lower downside risk, their risk-adjusted returns trail those of more technology-focused benchmarks, reinforcing the robustness of our findings and addressing concerns about benchmark selection. Appendix A of this paper shows a comparative analysis of the results of data center ETFs and NASDAQ 100 Tech Index.
4.4. Empirical Analysis of Conditional Alpha
Table 6 shows the net monthly alphas of data center ETFs as approximated by a conditional five-factor plus momentum model, a more sophisticated form of the Fama-French-Carhart framework adjusted for time-varying exposures.
Table 6.
Conditional Net Monthly Alphas of Data Center ETFs.
Data center ETFs had a conditional alpha of 0.02 from January 2000 to December 2024, indicating they roughly broke even in generating excess returns after adjusting for market and style factors. This modest size and lack of statistical significance suggest that these ETFs neither greatly excelled nor underperformed their risk-adjusted expectations across the whole economic cycle.
But during the COVID-19 and post-vaccination period (March 2020 to January 2024), the conditional alpha flips dramatically negative at −0.40, and this number is statistically significant at the 1 percent level. This result suggests that, during a period of increased market volatility and fast technological changes, data center ETFs underperformed their dynamic risk-adjusted benchmarks. After adjusting for time-varying factor loadings, investors in these ETFs did not enjoy better returns even with the heightened digitalization trends during the epidemic, which presumably helped the data center sector.
The notable shift to a negative alpha underscores the necessity for adjusting conditional exposures during periods of market turbulence. This outcome may indicate inefficiencies in ETF construction or suboptimal investor timing, suggesting that fund managers either assumed excessive risk that diminished returns or missed opportunities available in this phase.
Table 1 through Table 6’s combined data shows a striking picture about the performance of data center ETFs. Data center ETFs have failed to provide consistent, risk-adjusted alpha, especially during times when such outperformance might have been expected, despite their attractiveness as thematic investments matched with the digital transformation narrative. This underperformance presents problems for both retail investors and portfolio managers, especially about how well these funds capture the whole value of the data center ecosystem.
4.5. Analysis of Empirical Results of Market Timing and Security Selection Ability
Table 7 evaluates two important features of data center ETF performance: the fund manager’s stock-picking ability (αs) and market-timing skill (β2) using the Treynor and Mazuy (1966) approach the model gauges whether fund returns show convexity in relation to market fluctuations, therefore indicating the capacity to modify exposure depending on expected changes in the direction of the market.
Table 7.
Summary of Selectivity and Timing Metrics (Treynor & Mazuy, 1966).
Over the full sample period from January 2000 to December 2024, the selectivity coefficient (αs) is estimated at 0.09, though this value is not statistically significant (t = 0.73). This suggests that data center ETFs did not exhibit meaningful stock selection ability across the long term, echoing the earlier findings from Table 4, Table 5 and Table 6 where alpha estimates were flat or negative. In essence, the ETF portfolios tracked broad market patterns without consistently adding value through superior asset selection.
The market-timing coefficient (β2), however, is −0.01 and statistically significant (t = −2.93), pointing to a lack of effective market-timing. A negative and significant β2 implies that, rather than adjusting exposure advantageously in anticipation of market movements, the ETFs tended to shift in the wrong direction—either increasing risk before downturns or becoming defensive during rallies. This result is especially concerning for investors who expect dynamic reallocation within such funds during volatile periods.
During the more turbulent COVID-19 and post-vaccination period (March 2020 to December 2024), the selectivity coefficient drops to −0.44, and it becomes statistically significant at the 5 percent level (t = −2.01). This deterioration indicates a marked decline in stock-picking ability during a period of rapid technological acceleration, policy intervention, and market uncertainty, precisely the type of environment where skilled management might be expected to shine. The market-timing coefficient remains negative at −0.01, though it is no longer statistically significant (t = −1.29), suggesting no evidence of effective timing during this critical phase either.
Taken together, the Treynor and Mazuy model results reinforce prior findings: data center ETFs exhibit neither meaningful selectivity nor successful market timing, particularly when these capabilities would be most beneficial to investors. This raises broader concerns about the passive structure of these funds and their inability to adapt to rapidly evolving market conditions. For long-term investors, these findings may call for a more nuanced allocation strategy that blends thematic exposure with active oversight or sector rotation capabilities.
When one considers the risk estimations in Table 8, the flaws in selectivity and market timing emphasized in Table 7 have even more significance.
Table 8.
Value at Risk and Conditional Value at Risk (95% Confidence Interval) for Data Center ETFs and Key Market Indexes.
Table 8 shows that relative to benchmark indexes, the Value at Risk (VaR) and Conditional Value at Risk (CVaR) at the 95 percent confidence level clearly show possible negative side risk for data center ETFs.
The VaR for data center ETFs is specifically −9.03 percent, meaning that investors might anticipate losing at least 9.03 percent of their capital in a normal worst-case month. Though this is rather less than the equivalent numbers for the S&P 1500 Information Technology Index (−11.27 percent) and NASDAQ Composite Index (−10.14 percent), it is still rather significant and not significantly safer. Furthermore, considering the predicted loss in the poorest 5 percent of months, the CVaR for data center ETFs is −11.92 percent. Once more, this number indicates a significant tail risk even if it is only somewhat higher than the −15.70 percent CVaR for the S&P 1500 Information Technology Index.
When considered with Table 7, the story gets more alarming. Data center ETFs not only expose investors to significant downside risk but also fail to show ability in stock selection or market timing. Stated differently, these funds provide little upside potential—as seen by consistently negative or negligible alphas—while nevertheless exposing investors to losses either comparable to, or only slightly less than, those of their larger technological counterparts.
From a portfolio building perspective, the results imply that although data center ETFs might have a specialized function in capturing long-term structural trends, they should not be taken for granted to offer reduced risk or improved returns without more diversification or active management.
5. Summary and Conclusions
The findings from this study raise important questions about the investment case for data center ETFs. While these funds offer convenient exposure to a rapidly expanding digital infrastructure sector, the empirical results tell a more cautionary story. Across multiple performance dimensions—whether measured by traditional risk-return metrics, multi-factor alphas, or downside risk assessments—data center ETFs consistently fall short of delivering superior, risk-adjusted outcomes. Even during the pandemic and post-vaccination years, a period marked by heightened demand for cloud computing and data services, these ETFs underperformed both on an absolute and conditional basis.
Perhaps more concerning is their demonstrated lack of adaptability. The Treynor and Mazuy analysis reveals no evidence of successful market-timing or stock selection. Instead, these ETFs appear to ride the market’s waves passively, missing opportunities to protect capital or enhance gains when it matters most. Moreover, the Value at Risk and Conditional Value at Risk figures suggest that investors are not shielded from significant losses—despite the perception of data centers as essential and resilient assets.
These findings carry several practical implications. For individual investors, the results highlight the need to look beyond thematic appeal and critically evaluate whether an ETF is delivering true value after accounting for risk. For institutional portfolio managers, data center ETFs may serve better as satellite holdings than as core allocations, given their performance limitations and high market sensitivity. And for fund designers, the results point to a potential gap in the market: there may be room for actively managed strategies or smart beta approaches that can more effectively harness the structural growth of the data economy while mitigating downside exposure.
In the end, the promise of thematic investing must be weighed against empirical realities. Data center ETFs, while compelling in concept, have yet to demonstrate that they can consistently reward investors for the risks they take.
Author Contributions
Conceptualization, D.K.M. and I.K.; methodology, D.K.M. and I.K.; software, D.K.M., I.K., F.R.; validation, D.K.M., I.K., F.R.; formal analysis, D.K.M., I.K., F.R.; data curation, D.K.M., I.K., F.R.; writing—original draft preparation, D.K.M., I.K., F.R.; writing—review and editing, D.K.M., I.K., F.R.; supervision, D.K.M.; project administration, D.K.M. All authors have read and agreed to the published version of the manuscript.
Funding
This research received no external funding.
Institutional Review Board Statement
Not applicable.
Informed Consent Statement
Not applicable.
Data Availability Statement
The original contributions presented in this study are included in the article. Further inquiries can be directed to the corresponding author.
Conflicts of Interest
The authors declare no conflict of interest.
Appendix A. Robustness Check Using Targeted Sector Benchmarks
We compare the performance of Data Center ETFs to a more targeted benchmark, the NASDAQ 100 Tech Index, over two sub-periods: February 2010 to December 2024 and March 2020 to December 2024. Table A1 shows that the NASDAQ 100 Tech Index outperformed Data Center ETFs in both return and return per unit of risk over both periods.
Table A1.
Monthly Return Statistics: Data Center ETFs & NASDAQ 100 Tech (2010–2024).
Table A1.
Monthly Return Statistics: Data Center ETFs & NASDAQ 100 Tech (2010–2024).
| Data Center Exchange Traded Funds | NASDAQ Tech 100 | |
|---|---|---|
| February 2010 to December 2024 | ||
| Mean | 0.87 | 1.55 |
| Standard Deviation | 4.37 | 5.81 |
| Return per unit of risk | 0.20 | 0.27 |
| March 2020 to December 2024 (COVID and Post Vaccination Period) | ||
| Mean | 0.88 | 1.51 |
| Standard Deviation | 5.73 | 7.04 |
| Return per unit of risk | 0.15 | 0.21 |
Table A2 confirms this outperformance in terms of Sharpe, Sortino, and Omega ratios. The NASDAQ 100 Tech Index consistently delivered higher risk-adjusted returns.
Table A2.
Risk-Adjusted Performance of Data Center ETFs & NASDAQ 100 (2010–2024).
Table A2.
Risk-Adjusted Performance of Data Center ETFs & NASDAQ 100 (2010–2024).
| Sharpe Ratio | Sortino Ratio | Omega Ratio | |
|---|---|---|---|
| Data Center ETFs | |||
| February 2010 to December 2024 | 0.18 | 0.27 | 1.60 |
| March 2020 to December 2024 | 0.11 | 0.17 | 9.11 |
| NASDAQ 100 Tech Index | |||
| February 2010 to December 2024 | 0.25 | 0.41 | 1.88 |
| March 2020 to December 2024 | 0.19 | 0.30 | 10.02 |
Five-factor plus momentum alphas in Table A3 are significantly negative (–0.20%) for Data Center ETFs over the full period, whereas the NASDAQ 100 Tech Index has a small but positive alpha (0.31%). Neither ETF nor benchmark alphas are statistically significant in the COVID and post-vaccination period.
Table A3.
Net monthly alphas for Data Center ETFs and NASDAQ 100 Tech Index (February 2010 to December 2024).
Table A3.
Net monthly alphas for Data Center ETFs and NASDAQ 100 Tech Index (February 2010 to December 2024).
| Data Center Exchange Traded Funds | NASDAQ 100 Tech Index | |
|---|---|---|
| February 2010 to December 2024 | −0.20 *** | 0.31 * |
| March 2020 to December 2024 | 3.25 | 0.28 |
*** statistically significant at 1% significance level, * statistically significant at 10% significance level.
These results confirm that Data Center ETFs have reduced downside risk, but their risk-adjusted returns are lower than those of benchmarks that concentrate more on technology. This strengthens our conclusions and attests to the robustness of our findings.
References
- Ang, A., Asness, C. W. J., & Chen, J. (2006). Do exchange traded funds add value? Journal of Finance, 61(4), 1979–2018. [Google Scholar]
- Blitz, D., & Huij, J. (2012). Evaluating the performance of global emerging markets equity exchange-traded funds. Emerging Markets Review, 13, 149–158. [Google Scholar] [CrossRef]
- Blitz, D., & Vidojevic, M. (2021). The performance of exchange-traded funds. Journal of Alternative Investments, 23(3), 81–99. [Google Scholar] [CrossRef]
- Fama, E. F., & French, K. R. (1993). Common risk factors in the returns on stocks and bonds. Journal of Financial Economics, 33(1), 3–56. [Google Scholar] [CrossRef]
- Fama, E. F., & French, K. R. (2015). A five-factor asset pricing model. Journal of Financial Economics, 116(1), 1–22. [Google Scholar] [CrossRef]
- Ferson, W. E., & Schadt, R. (1996). Measuring fund strategy and performance in changing economic conditions. Journal of Finance, 51(2), 425–462. [Google Scholar] [CrossRef]
- Henriksson, R., & Merton, R. (1981). On Market Timing and Investment Performance. II. Statistical Procedures for Evaluating Forecasting Skills. The Journal of Business, 54, 513–33. [Google Scholar] [CrossRef]
- Jensen, M. (1968). The performance of mutual funds in the period 1945–1964. Journal of Finance, 23(2), 389–416. [Google Scholar] [CrossRef]
- Keating, C., & Shadwick, W. F. (2002). A universal performance measure. Journal of Performance Measurement, 6(3), 59–84. [Google Scholar]
- Kiriha, Y., & Motoo, N. (2013). Survey on Data Center Networking Technologies. IEICE Transactions on Communications, E96-B, 713–721. [Google Scholar] [CrossRef]
- Kon, S., & Jen, F. (1978). Estimation of Time Varying Systematic Risk and Performance for Mutual Fund Portfolios: An Application of Switching Regression. The Journal of Finance, 33, 457–475. [Google Scholar] [CrossRef]
- Lee, C. F., & Rahman, S. (1990). Market Timing, Selectivity, and Mutual Fund Performance: An Empirical Investigation. Journal of Business, 63(2), 261–278. [Google Scholar] [CrossRef]
- Malhotra, D. (2023). Market timing, selectivity, and performance of technology exchange-traded funds and mutual funds. The Journal of Beta Investment Strategies, 14(1), 42–58. [Google Scholar] [CrossRef]
- Malhotra, D., & Marino, M. (2024). Analyzing the performance and diversification benefits of healthcare exchange-traded funds. Journal of Beta Investment Strategies, 15(2), 85–102. [Google Scholar] [CrossRef]
- Malhotra, D., & Napoleon, G. (2024). Diversified emerging market exchange-traded funds and the search for positive alpha. Journal of Beta Investment Strategies, 15(2), 33–52. [Google Scholar] [CrossRef]
- Sharpe, W. F. (1966). Capital asset prices: A theory of market equilibrium under conditions of risk. Journal of Finance, 19(3), 425–442. [Google Scholar] [CrossRef]
- Sortino, F. A., & van der Meer, R. (1991). Downside risk. Journal of Portfolio Management, 17(4), 27–31. [Google Scholar] [CrossRef]
- Treynor, J. L., & Mazuy, W. F. (1966). Can Mutual Funds Outguess the Market? Harvard Business Review, 44(4), 131–136. [Google Scholar]
Disclaimer/Publisher’s Note: The statements, opinions and data contained in all publications are solely those of the individual author(s) and contributor(s) and not of MDPI and/or the editor(s). MDPI and/or the editor(s) disclaim responsibility for any injury to people or property resulting from any ideas, methods, instructions or products referred to in the content. |
© 2025 by the authors. Licensee MDPI, Basel, Switzerland. This article is an open access article distributed under the terms and conditions of the Creative Commons Attribution (CC BY) license (https://creativecommons.org/licenses/by/4.0/).