4.1. Descriptive Statistics
Descriptive statistical analysis was conducted based on the 620 valid questionnaires collected. This analysis included respondents’ background information as well as details about the companies they work for. Variables examined included gender, age, education level, years of work experience, income, type of enterprise, nature of enterprise ownership, enterprise size, year of establishment, position, department, and company location.
In the sample, male participants account for 67.4%, while female participants comprise 32.6%. Regarding age distribution, the largest group falls within the 36–45 age range, representing 35.3%, followed by those aged 46–55, who account for 26.3%. Combined, these two groups constitute most of the sample. Participants aged 26–35 make up 24.7%, while those aged 18–26 and 56 or above represent smaller proportions, at 4.0% and 9.7%, respectively. In terms of educational background, 46.8% of participants hold an associate’s or bachelor’s degree, while 44.0% have a postgraduate degree or higher. This suggests that the sample is generally well-educated, with the majority holding at least a bachelor’s degree. Only 9.2% of respondents have a high school education or lower. With respect to work experience, the most common range is 6–8 years, accounting for 28.4% of the sample, followed closely by 9–15 years at 27.4%. Participants with less than 1 year and 1–2 years of experience represent 3.4% and 8.9%, respectively. Regarding monthly income, the highest proportion of participants earn between CNY 5001 and CNY 7000, representing 38.4%, followed by those earning CNY 7001–CNY 10,000, at 26.0%. Participants earning more than CNY 10,000 account for 12.3%, while only 7.6% report earnings below CNY 3001. The distribution of company-related characteristics is presented in
Table 1.
Table 1 shows that most sampled firms are from the construction and education industries, accounting for 17.9% and 14.8%, respectively. The manufacturing and software/information sectors also represent significant portions of the sample, at 10.8% and 12.3%. In terms of company ownership, private enterprises constitute the largest group at 40.97%, followed by foreign-invested enterprises at 25.6%. State-owned enterprises account for 13.1%, while joint ventures and other types of enterprises represent 14.2% and 6.1%, respectively. Regarding company size, the largest proportion of respondents work in firms with 100–499 employees (38.7%), followed by those in firms with 500–999 employees (36.5%). Companies with fewer than 100 employees account for 7.3%, while those with more than 1000 employees represent 17.6%. As for the years of establishment, firms that have been in operation for 11–20 years make up the largest share at 44.2%. Companies established 6–10 years ago account for 29.7%; those with over 21 years of operation represent 17.4%, and firms established within the past 5 years make up 8.7%.
The mean values of all measurement items range from 3.5 to 4.1, while the standard deviations range from 1.032 to 1.345. The absolute values of skewness fell between 0.034 and 0.224, and the absolute values of kurtosis ranged from 1.035 to 1.333. These values are within the acceptable thresholds, with skewness less than 3 and kurtosis less than 8, as suggested by (
Kline, 2016). These results indicate that the data distribution is normal, and the assumptions of normality are met for subsequent statistical analyses.
4.4. Hypothesis Testing
In the structural equation analysis, the Structural Equation Modeling (SEM) technique was employed using SmartPLS 4.0 to test the research hypotheses (
C. M. Wu & Chen, 2018). The evaluation of the model’s statistical significance was based on the path coefficient (β), T-statistic (t), and
p-value (p) (
Cohen, 2013). In addition, the coefficient of determination (R
2) and effect size (f
2) were used to assess the explanatory power and practical significance of the model, respectively.
The coefficient of determination (R
2) is used to assess the predictive power of the structural model, with values ranging from 0 to 1. Higher R
2 values indicate stronger predictive ability. As shown in
Table 4, the R
2 value for organizational strategic intuition (OSI), an endogenous variable in the model, is 0.194, suggesting that 19.4% of the variance in OSI is explained by the model. The R
2 value for digital leadership (DL) is 0.227, indicating that the model accounts for 22.7% of the variance in DL. Finally, the R
2 value for firm performance (FP) is 0.283, meaning that 28.3% of the variance in FP is explained by the model. These values point out that the model has moderate predictive power across the key endogenous variables.
The effect size (f
2) is an important index used to evaluate the extent to which an independent variable contributes to the explanation of a dependent variable within Structural Equation Modeling (SEM). It helps to assess the relative influence of exogenous variables on endogenous latent variables. According to Cohen’s criteria, an f
2 value greater than 0.02 is considered sufficient to indicate a meaningful effect size (
Hult et al., 2018). As displayed in
Table 5, all f
2 values in the model exceed the 0.02 threshold, indicating that the exogenous variables have a satisfactory explanatory effect on their respective endogenous variables. The effect size (f
2) is an important index used to evaluate the extent to which an independent variable contributes to the explanation of a dependent variable within Structural Equation Modeling (SEM). It helps to assess the relative influence of exogenous variables on endogenous latent variables. According to Cohen’s criteria, an f
2 value greater than 0.02 is considered sufficient to indicate a meaningful effect size (
Hult et al., 2018). As displayed in
Table 4, all f
2 values in the model exceed the 0.02 threshold, indicating that the exogenous variables have a satisfactory explanatory effect on their respective endogenous variables.
These R2 measures signify that the model accounts for variation of 19.4% in organizational strategic intuition (OSI), 22.7% in digital leadership (DL), and 28.3% in enterprise performance (FP). While the measures represent a moderate extent of explanatory power, they are acceptable in exploratory research and behavioral studies, particularly in dynamic organizational settings with multi-dimensional platforms and outside forces that cannot be fully controlled. In addition, the primary purpose of the current study is exploratory verification and theory building, not prediction accuracy. As such, a comparatively moderate R2 will not invalidate the model.
While the R2 values are not strong, both the reliability and validity of the measurement model are satisfactory, and the effect sizes affirm the explanatory model of the theoretical model. This level of reliability is to be anticipated in complicated behavioral research and substantiates the conceptual model used in the current study. These R2 values show that the model accounts for 19.4% variance in organizational strategic intuition (OSI), 22.7% variance in digital leadership (DL), and 28.3% variance in enterprise performance (FP). Though these values reflect a moderate explanatory power, they are tolerable in exploratory and behavioral studies, particularly in intricate organizational settings with multi-dimensional structures and environmental factors that could not be totally controlled. Moreover, the overall purpose of the present research is theoretical construction and exploratory validation rather than predictive fit. Thus, a comparatively modest R2 would not change the model’s validity.
Despite low R2 values, the measurement model’s reliability and validity are strong, and effect sizes validate the explanatory structure of the theoretical model. The expectation in complex behavior research is congruent with this, and it validates the conceptual model of this study.
To evaluate the relationships between the constructs in the model, a path coefficient analysis was conducted using the bootstrap resampling technique, as recommended by
Preacher and Hayes (
2008). The bootstrap procedure was performed with a sample size of 5000 and a 95% confidence interval. As depicted in
Table 6, the results support a significant positive relationship between digital transformation capability (DTC) and firm performance (FP), with a path coefficient of β = 0.283 and a
p-value less than 0.05. This indicates that DTC has a strong positive impact on FP.
The results indicate that all examined paths are statistically significant at the 5% significance level, with
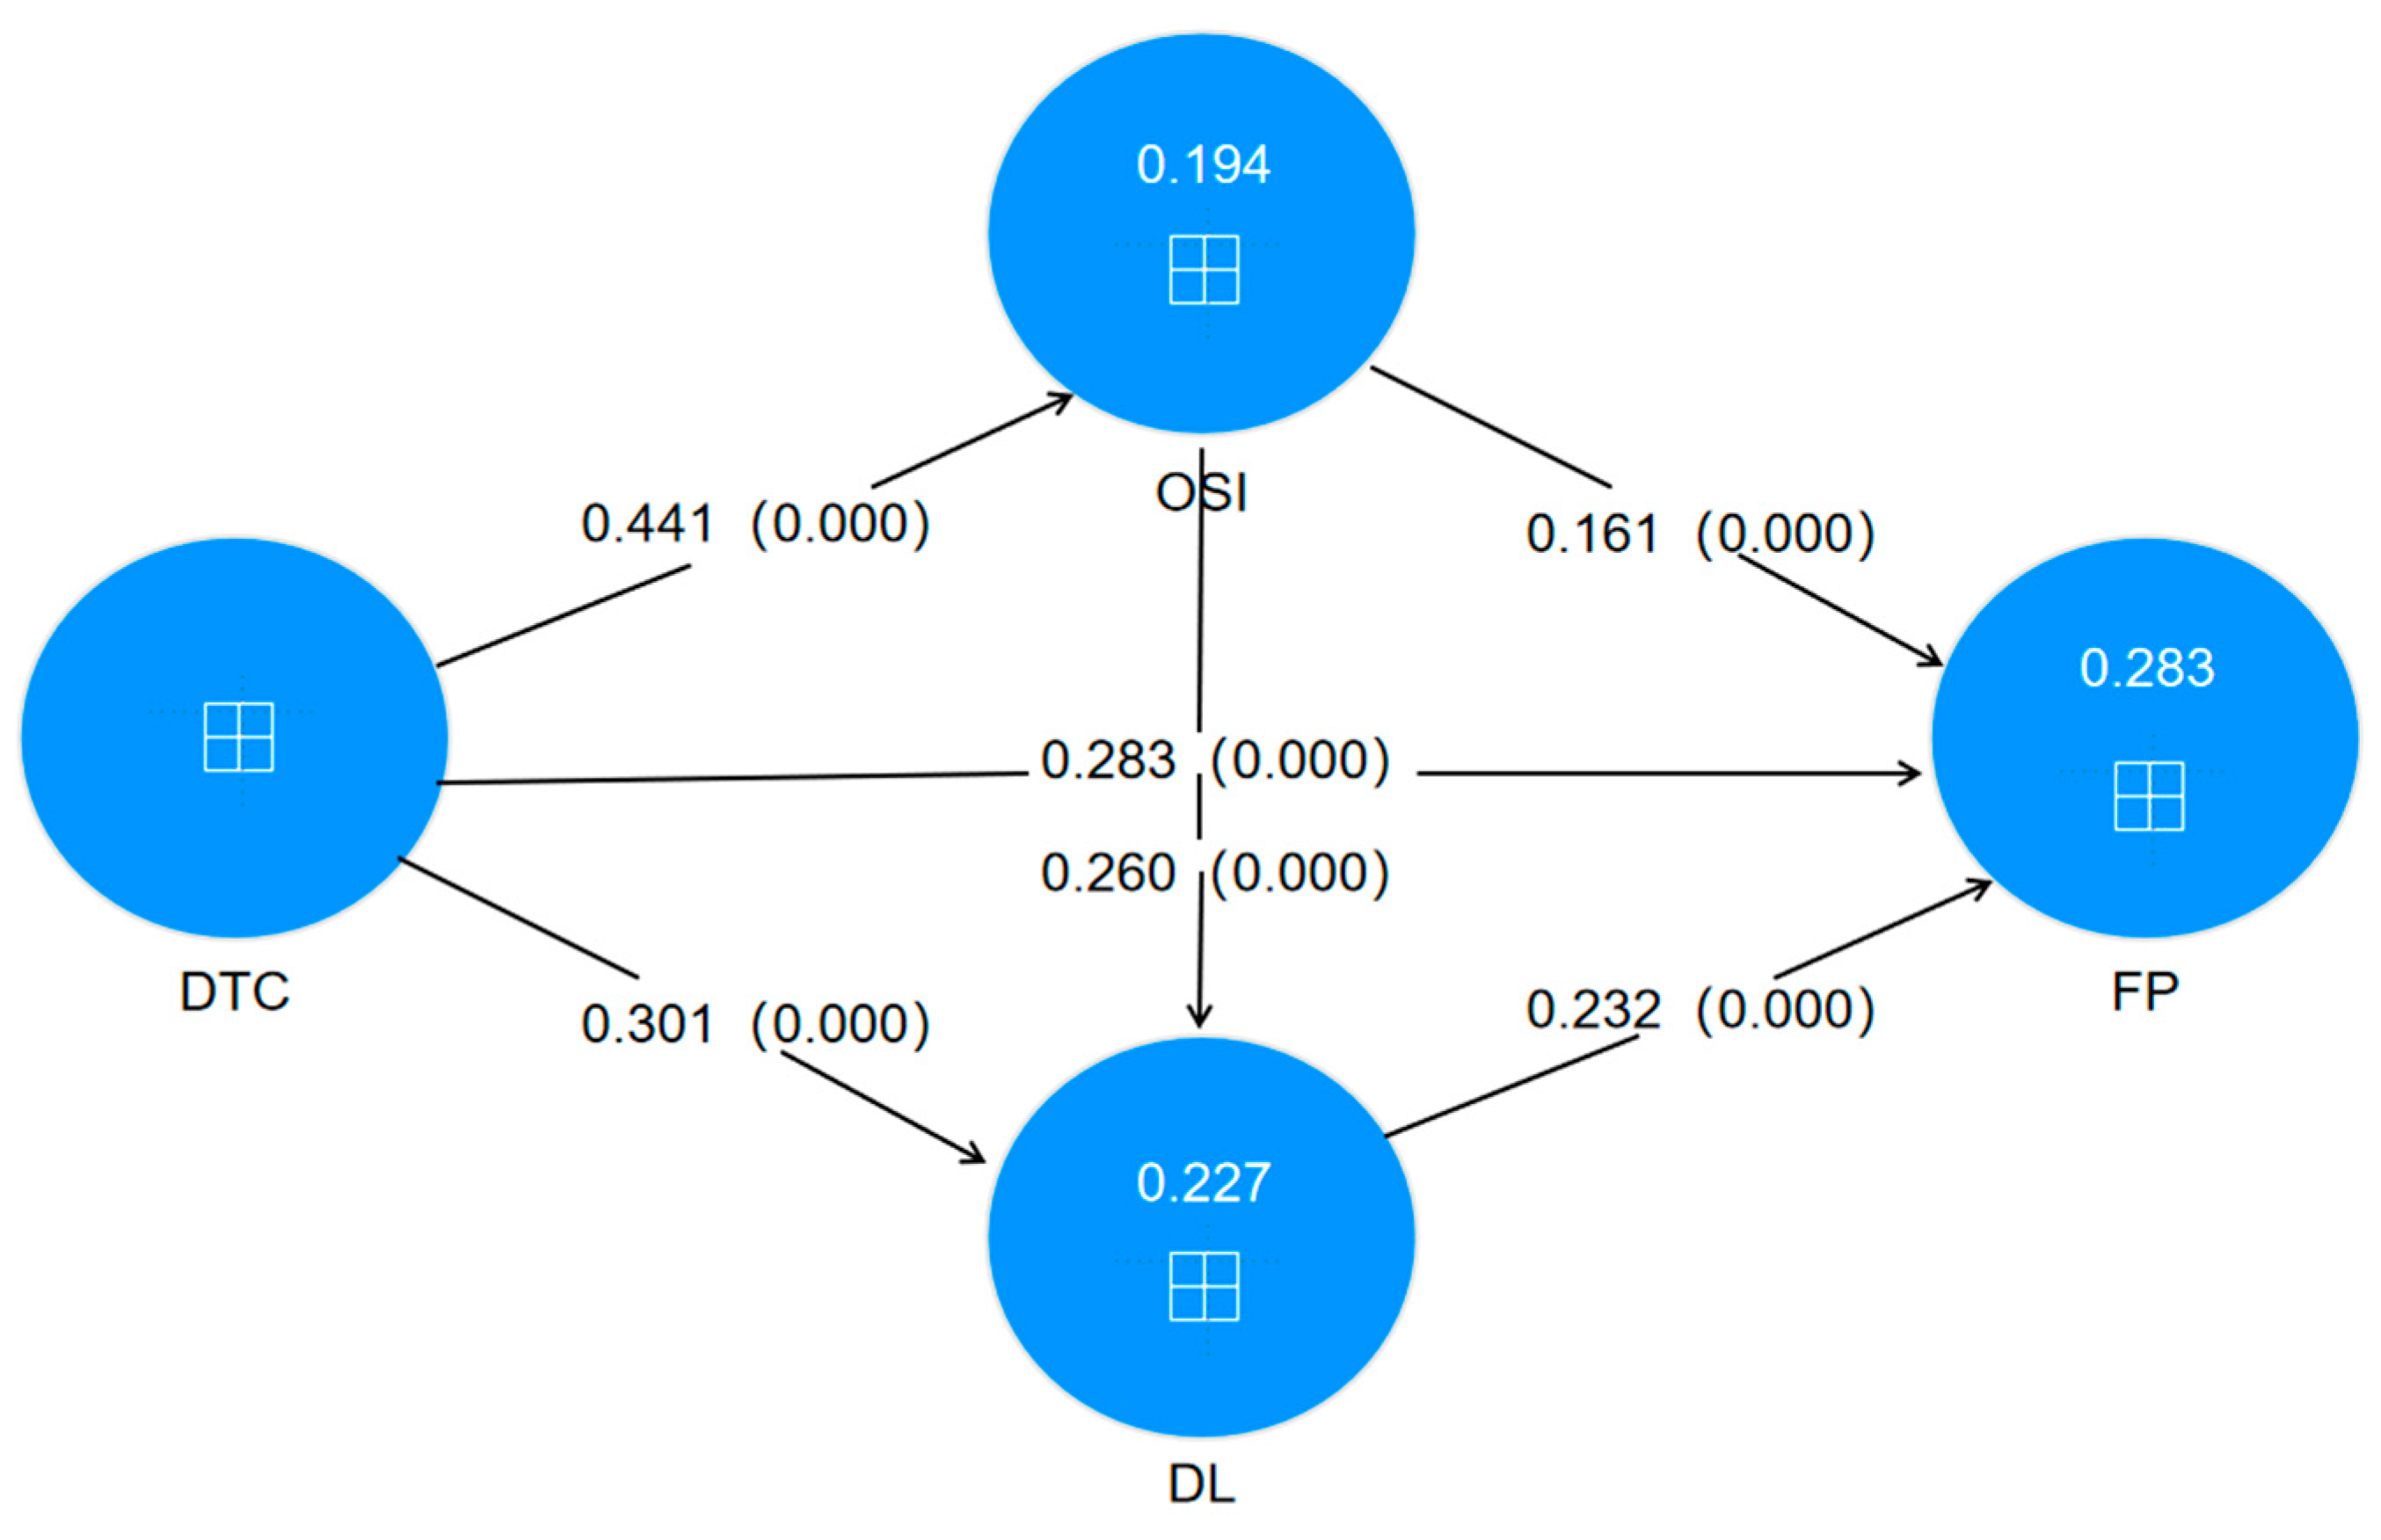
p-values less than 0.05, thereby confirming the validity of the proposed hypotheses. Specifically, digital transformation capability (DTC) has a significant positive effect on firm performance (FP), providing empirical support for Hypothesis H1. The structural equation model output illustrating the results of hypothesis testing is presented in
Figure 1.
To test the mediating effects in this research, the procedure proposed by
Preacher and Hayes (
2008) was followed. According to this approach, a statistically significant mediating effect is present if the confidence interval between the lower bound (BootLLCI) and the upper bound (BootULCI) does not include zero. As shown in
Table 7, the analysis results support the presence of several significant mediating effects. For the path DTC → OSI → FP, the mediating effect of Organizational Strategic Intuition (OSI) is 0.071, with a
p-value less than 0.05. The 97.5% bias-corrected confidence interval is [0.036, 0.109], which does not include zero, indicating a statistically significant mediating effect. Therefore, Hypothesis H2 is supported.
For the path DTC → DL → FP, the mediating effect of digital leadership (DL) is 0.070, also with a p-value less than 0.05. The 97.5% bias-corrected confidence interval is [0.042, 0.104], which excludes zero, confirming the significance of the mediating effect. Thus, Hypothesis H3 is supported. For the chain mediation path DTC → OSI → DL → FP, the mediating effect involving both OSI and DL is 0.027, with a p-value below 0.05. The 97.5% bias-corrected confidence interval is [0.016, 0.042], which does not include zero, indicating a significant chain mediating effect. Therefore, Hypothesis H4 is supported.
Among the direct and indirect paths of the analysis, the direct impact of digital transformation capability (DTC) on firm performance (FP) is the most significant (β = 0.283, t = 6.641, p < 0.001), which has extremely strong statistical significance. It indicates that in the current digital economy environment, the ability of digital transformation remains a key variable driving the improvement in firm performance.
Meanwhile, digital transformation capability (DTC) also indirectly affects firm performance (FP) through two mediating paths: namely, the path through organizational strategic intuition (OSI) (β = 0.071) and the path through digital leadership (DL) (β = 0.070). Although the coefficients of these two paths are slightly lower than those of the direct path, they still have statistical significance. It is worth noting that the chain mediation of DTC→OSI→DL→FP has a path coefficient of β = 0.027, which also meets the significance standard. The existence of this chain effect indicates that digital transformation capability (DTC) enhances an organization’s strategic intuition (OSI), thereby promoting digital leadership (DL) and ultimately leading to an improvement in firm performance (FP). This confirms the cascading transmission mechanism among potential constructs and expands the understanding of the role of mediating variables.
The research evidence shows digital transformation capability leads to enhanced performance results for high-tech enterprises located in China’s Yangtze River Delta, and this finding matches earlier studies (
Ma et al., 2023;
Pan et al., 2021;
Sousa-Zomer et al., 2020;
Wei & Zong, 2021). Within China’s high-tech industry, digital transformation capability stands as a vital dynamic capability that helps organizations adjust and create innovative solutions in a digital world. Enterprises can meet external environmental changes efficiently through this capability, which also enables resource integration and strategic modification. The combined impact of these functions leads to better firm performance while enabling organizations to establish lasting competitive advantages in dynamic market environments.
The research demonstrates partial mediation functions of organizational strategic intuition, together with digital leadership, between digital transformation capability and firm performance. Dynamic capability theory demonstrates that digital transformation capability functions as a fundamental enabler for enterprises to adjust to complicated and ever-changing market conditions. Firm performance improves significantly through resource integration and strategic adjustment facilitated by this capability (
Teece, 2007). Previous research (
Songkajorn et al., 2022) has identified that organizational strategic intuition equips managers with rapid identification skills for market opportunities and risks, which leads to better decision-making processes and improved firm performance. This research confirms our understanding because it shows that developing strategic intuition through digital transformation capabilities leads to better performance outcomes. The upper echelons theory asserts that organizational strategies depend on the cognitive abilities and decision-making skills of top leaders whose actions then affect firm performance (
Hambrick & Mason, 1984). Leaders in digital environments require strong digital awareness and strategic decision-making capacity to successfully manage digital transformation. This research confirms previous research (
Dewi & Sjabadhyni, 2021;
Mihardjo et al., 2019), which demonstrates that firms gain better resource allocation capabilities and stronger competitive positions through digital leadership enhancement, leading to better performance outcomes in complex environments. Digital transformation capabilities enhance leadership abilities in data-based decision-making and strategic execution, alongside innovation management and digital leadership, leading to better firm performance.
Importantly, this research has identified a cascading effect between organizational strategic intuition and digital leadership. The improvement in digital transformation ability can enhance the organizational strategic intuition of enterprises and enable managers to have stronger market insight and strategic judgment. Organizational strategic intuition further strengthens digital leadership and enables managers to make and implement more forward-looking decisions in the process of digital transformation. Digital leadership translates organizational strategic intuition into digital innovation and changes at the enterprise level, which together contribute to the improvement in sustainable firm performance.


