Abstract
This study examines the role of supervisory frameworks in shaping the risk management behavior of Greece’s four systemic banks during the period of 2015–2024. It explores how regulatory reforms under Capital Requirements Regulation II, Basel III, and European Central Bank oversight influenced capital adequacy, asset quality, and liquidity metrics. Employing a quantitative methodology, this study analyzes secondary data from Pillar III disclosures, annual financial reports, and supervisory statements. Key risk indicators (capital adequacy ratio, non-performing exposure ratio, liquidity coverage ratio, and risk-weighted assets) are evaluated in conjunction with regulatory interventions, such as International Financial Reporting Standards 9 transitional relief, the Hercules Asset Protection Scheme, and European Central Bank liquidity measures. The findings reveal that enhanced supervision contributed to improved resilience and regulatory compliance. International Financial Reporting Standards 9 transitional arrangements were pivotal in maintaining capital thresholds during stress periods. Supervisory flexibility and extraordinary European Central Bank support measures helped banks absorb shocks and improve risk governance. Differences across banks highlight the impact of institutional strategy on regulatory performance. This study offers a rare longitudinal assessment of supervisory influence on bank risk behavior in a high-volatility Eurozone context. Covering an entire decade (2015–2024), it uniquely links institutional strategies with evolving regulatory frameworks, including crisis-specific interventions such as International Financial Reporting Standards 9 relief and asset protection schemes. The results provide insights for policymakers and regulators on how targeted supervisory interventions and transitional mechanisms can enhance banking sector resilience during protracted crises.
1. Introduction
The stability of the banking system is a fundamental prerequisite for the smooth functioning of the economy and the prevention of crises with systemic consequences. Banking supervision, especially within a unified European framework, plays a critical role in ensuring the resilience of financial institutions and the effective management of the risks they undertake. Following the global financial crisis of 2008 and the subsequent Greek debt crisis, the need to strengthen the supervisory framework and align it with the evolving demands of the market became apparent (Hardouvelis & Vayanos, 2023).
This study focuses on the role of supervision in managing risks by the four systemic banks in Greece from 2015 to 2024. It examines how the institutional and regulatory frameworks, with an emphasis on Regulation (EU) 575/2013 (CRR) and its amendment by Capital Requirements Regulation II (CRR II), have influenced the risk-taking behavior of these banks. Particular attention is given to the period of the COVID-19 pandemic, during which exceptional measures were taken to relax supervisory oversight to enhance liquidity and the resilience of the banks against external shocks.
The research necessity arises from the fact that, while there is extensive literature on regulatory authorities and risks in the banking sector, the relationship between supervision, efficiency, and risk management—particularly at the national level and through a comparative analysis of real-time data—has not been sufficiently studied. The case of Greece is of particular interest, as the four systemic banks operate in an environment marked by high historical risk, intense supervision, and successive crises (fiscal and pandemic).
The study analyzes the institutional and regulatory framework governing the supervision of credit institutions, identifying any gaps or overlaps resulting from the alignment of the Capital Requirements Regulation II (CRR II) with Basel III standards and the accompanying legislation, such as Capital Requirements Directive V and Regulation 575/2013. It incorporates a ten-year time series (2015–2024) of key risk indicators for the four systemic Greek banks, evaluating indicators such as capital adequacy (total capital), asset quality (non-performing exposure ratio), liquidity (liquidity coverage ratio), and risk-weighted assets (RWAs). The study examines the supervisory tools applied during this period, including Targeted Longer-Term Refinancing Operations (TLTRO III), the relaxation of supervisory measures, and the “Hercules” plans, and assesses how these tools contributed to improving the banks’ indicators and achieving supervisory limits, enabling them to function effectively and address the crisis induced by the COVID-19 pandemic. It utilizes the most recent supervisory data, including Pillar 3 disclosures, along with the financial statements of the banks under study, to assess whether enhanced supervision serves to deter or enable the risk-taking behavior of the banks. The study compares the total supervisory requirements (total capital requirement [OCR]) with the actual performance of the four banks annually, investigating cases where the banks exceeded or fell short of regulatory limits, and analyzes the consequences of these variations in terms of cost of capital and balance sheet management strategies. Finally, it evaluates the role of the supervisory framework in mitigating the effects of the COVID-19 crisis on the Greek financial sector, focusing on the capital and regulatory relief measures adopted by the Single Supervisory Mechanism (SSM) and the European Central Bank (ECB), such as the temporary relaxation of Pillar 2 requirements.
Through this multi-faceted approach, the study aims to contribute to the literature on the effectiveness of European banking supervision, highlighting both the strengths and areas for revision in CRR II, particularly in high-uncertainty environments and macroeconomic disruptions. Specifically, the study will fill a significant gap in the literature concerning the “post-crisis” evolution of Greek banking supervision and will provide practical directions for improving the SSM-CRR II framework in prolonged crisis environments.
While previous studies have examined specific supervisory actions, such as enforcement measures, little is known about the effectiveness of broader efforts by supervisory authorities to promote healthy risk management practices. The significance of this research lies in exploring the efforts of supervisory authorities to assist financial institutions in ensuring their stability and smooth functioning.
This paper contributes to the literature on bank risk behavior by engaging with foundational works that explore how regulatory frameworks and uncertainty influence risk-taking. Acharya and Steffen (2020) argue that regulatory relaxation during crises can lead to increased moral hazard, while Laeven and Levine (2009) show how uncertainty shapes the risk preferences of financial institutions. These theoretical perspectives help interpret the heterogeneity in capital, liquidity, and asset quality responses across the four systemic banks studied.
In addition to the national focus, the analysis is enriched by engaging with comparative studies on banking crises and risk behavior. Alnabulsi et al. (2023) emphasizes that bank-specific variables are often more influential than macroeconomic factors in determining non-performing loan levels. Incorporating this perspective highlights the strategic role of internal governance, even within crisis-driven environments. Moreover, recent European findings on the impact of pandemic-era regulatory interventions such as capital buffer relief and payment moratoria (ESRB, 2022) offer valuable parallels to the Greek case. These studies confirm that supervisory flexibility played a key role in supporting balance sheet resilience across the Eurozone periphery.
2. Institutional and Policy Background
The stability of the Greek banking sector has been repeatedly tested over the past decade due to a series of interconnected crises—sovereign debt turmoil, persistent non-performing loans, and, more recently, the COVID-19 pandemic. In response, Greek authorities, in collaboration with European institutions, implemented a series of institutional reforms and targeted financial interventions to safeguard systemic stability and restore investor confidence.
This chapter outlines the key policy mechanisms and institutional actors that played a central role in this effort. It reviews the evolution and impact of the Hellenic Financial Stability Fund (HFSF), the Hercules asset protection schemes designed to offload non-performing loans, and the extraordinary measures introduced by the European Central Bank during the pandemic. Together, these elements form the backbone of Greece’s recent financial sector stabilization strategy.
2.1. The Hellenic Financial Stability Fund
The Hellenic Financial Stability Fund (HFSF) was established on 21 July 2010, under Law 3864/2010, as a legal entity governed by private law with administrative and financial independence. Its sole mission is to safeguard the stability of the Greek banking system. Since 2011, the HFSF has allocated approximately EUR 46 billion to recapitalize banks, acting as a “safety net” for deposits and ensuring the continued flow of credit to the real economy.
The year 2021 marked a pivotal shift in the Fund’s role—from a passive rescue mechanism to an active strategic shareholder. It participated with EUR 395 million in the capital increases of Piraeus Bank and Alpha Bank and, for the first time, supported a non-systemic bank (Attica Bank), while also exercising enhanced oversight in corporate governance.
Law 4941/2022 reformed the Fund’s statutory framework, merging the two-tier structure (“General Council—Executive Board”) into a unified Board of Directors. Its lifespan was extended until 31 December 2025, to allow for the orderly completion of its bank divestment program.
The first divestment actions took place in autumn 2023. On 9 October 2023, the HFSF sold its 1.4% stake in Eurobank (52 million shares) for EUR 93.7 million, marking the full exit of the state from this systemic bank. Subsequently, on 13 November 2023, it disposed of its entire 8.9781% stake in Alpha Bank to UniCredit through a competitive process. A few days later, between 12 and 16 November 2023, it launched a combined Greek and international offering to sell 20% of the National Bank of Greece, raising a total of EUR 1.07 billion. The offering was oversubscribed by nearly eight times, indicating a significantly improved investment climate.
2.2. The “Hercules” Asset Protection Schemes
According to Hadjiemmanuil (2024), despite more favorable macroeconomic conditions emerging from 2017 onwards, the massive stock of non-performing loans (NPLs) continued to hinder the recovery of the credit system. Rather than establishing an asset management company to resolve the issue, the Ministry of Finance launched the Hellenic Asset Protection Scheme, known as the “Hercules” scheme.
Modeled on Italy’s Garanzia Cartolarizzazione Sofferenze (GACS) scheme, Hercules provides for the transfer of NPL portfolios to private securitization vehicles. These vehicles purchase the loans from banks using funds raised by issuing notes to investors. In this way, the NPLs are removed from the banks’ balance sheets and are managed by licensed loan servicing companies.
The Greek state offers credit enhancement in the form of a guarantee on the repayment of the senior (i.e., safer) tranches of the notes issued by these securitization vehicles, in exchange for a market-based fee. Following extensive consultations with the European Commission (DG Competition) to ensure the scheme’s compliance with EU state aid rules, the relevant enabling law was passed in December 2019.
During the first phase of the Hercules scheme, all four systemic banks made use of the program to securitize NPLs with a total gross book value of EUR 31.3 billion.
The second phase, Hercules II, launched in April 2021, is still ongoing. Thanks to the scheme, as well as the write-off or restructuring of certain loans, by the end of June 2023, the total stock of NPLs (including those generated during or after the COVID-19 crisis) had been reduced to EUR 12.7 billion—an 88.1% decline from its March 2016 peak. The NPL ratio relative to total loans also dropped to 8.6%.
It is worth noting that Hercules is not administered by banking authorities but rather by the Ministry of Finance, and is inherently a special, time-limited intervention designed to address the legacy problems of the Greek banking sector.
2.3. The COVID-19 Pandemic and ECB Supervisory Measures
The COVID-19 pandemic, beyond being a major public health and social crisis, also caused significant disruptions in the global economy and financial markets. Uncertainty, production shutdowns, and consumption restrictions placed pressure on household and business incomes, thereby heightening financial risk. In response, supervisory authorities had to intervene swiftly, implementing a broad array of measures to safeguard financial stability.
According to Gortsos (2020b), the pandemic prompted the European Central Bank (ECB) to adopt unprecedented support measures for the banking sector. Across Europe, favorable conditions for loan repayments were introduced based on guidelines from the European Banking Authority (EBA), ensuring that payment moratoria would not automatically trigger the reclassification of loans as non-performing (Quaglia & Verdun, 2023).
At the same time, the ECB relaxed capital requirement rules, allowing banks to temporarily operate below the capital conservation buffer and maintain lower liquidity coverage ratios (LCRs). Banks were also permitted to fulfill part of their Pillar II requirements with Additional Tier 1 (AT1) and Tier 2 capital instruments (Gortsos, 2020a).
The ECB’s interventions primarily aimed to strengthen liquidity, support credit provision to the real economy, and prevent disruptions in sovereign debt markets. As Claeys (2020) notes, the ECB introduced the following measures.
- -
- 12 March 2020—First Monetary Policy Package:
- ○
- Relaxation of terms for targeted longer-term refinancing operations (TLTROs), offering an interest rate 25 basis points below the deposit facility rate to banks that maintained lending to the real economy.
- ○
- Launch of additional longer-term refinancing operations (LTROs).
- ○
- An increase of EUR 120 billion in the Asset Purchase Programme (APP) until the end of the year.
- ○
- Supervisory flexibility allowing banks to operate below regulatory capital and liquidity buffers. According to Alpha Services and Holdings’ 2021 Annual Report, this included leeway to dip below both the capital conservation buffer (CCB) and the countercyclical capital buffer (CCyB).
- ○
- Early implementation of amendments related to the Capital Requirements Directive V (CRD V), originally planned for January 2021, which allowed Pillar 2 Requirements (P2R) to be met not only with Common Equity Tier 1 (CET1) but also with AT1 (up to 18.75%) and Tier 2 instruments (up to 25%).
- -
- The ECB also issued a recommendation for banks to limit dividend distributions and share buybacks to preserve capital adequacy. As announced in the ECB press release from 23 July 2021, this recommendation remained in force until 30 September 2021. It also advised caution in granting variable remuneration, taking into account future risks and economic outlooks.
- -
- 15 March 2020—Dollar Liquidity Provision: The ECB announced its intention to provide US dollar liquidity to Eurozone banks via swap lines with the US Federal Reserve.
- -
- 18 March 2020—Pandemic Emergency Purchase Programme (PEPP): In an emergency Governing Council meeting, the ECB introduced a EUR 750 billion Pandemic Emergency Purchase Programme (PEPP), valid through the end of 2020. The program featured flexible asset allocation and suspension of issuer limits and included Greek government bonds through a special waiver. It also expanded the Corporate Sector Purchase Programme (CSPP) to include additional instruments, such as commercial paper. The Council also declared its readiness to expand or modify the program as needed.
- -
- 20 March 2020—Swap Lines with Other Central Banks: The ECB established euro swap lines with the Danish central bank and later extended them to the Croatian and Bulgarian central banks. It also increased the frequency of US dollar swap operations from weekly to daily.
- -
- 7 April 2020—Collateral Easing: The ECB eased collateral requirements, including a 20% reduction in valuation haircuts.
- -
- 15 April 2020—Support for Macroprudential Policies: The ECB expressed support for the macroprudential measures taken by national supervisory authorities and emphasized the need for flexibility in capital requirement frameworks.
- -
- 22 April 2020—Suspension of Credit Rating Downgrades in Collateral Framework: To avoid procyclical effects, the ECB announced that it would freeze the eligibility of credit ratings as of April 7 in its collateral framework, aiming to stabilize markets and ensure continued bank access to liquidity.
- -
- 30 April 2020—Further Easing of TLTROs and Introduction of PELTROs: The ECB cut TLTRO interest rates by an additional 25 basis points, allowing rates as low as −1% for the June 2020–June 2021 period. It also introduced a new facility—Pandemic Emergency Longer-Term Refinancing Operations (PELTROs)—to support banks facing difficulties accessing TLTROs due to their lending profiles or operational constraints.
In summary, the policy measures described above—ranging from the Hercules Asset Protection Scheme to IFRS 9 transitional relief and ECB pandemic interventions—collectively shaped the regulatory landscape faced by Greek banks. These measures directly influenced the evolution of key prudential indicators such as capital adequacy (CAR), asset quality (NPE ratio), and liquidity (LCR). Understanding how these tools evolved from 2015–2024 provides critical context for the subsequent empirical analysis, which examines whether and how banks internalized regulatory changes and adjusted their risk profiles accordingly.
2.4. Recapitalization Cycles and Structural Reforms in the Greek Banking Sector
To complete the institutional background, this section outlines the recapitalization phases and structural transformations that shaped the Greek banking sector during the past decade. Capital injections were primarily directed to systemic banks. According to Hardouvelis and Vayanos (2023), the 2012–2013 period marked the first complete recapitalization cycle, during which the four systemic groups—Alpha, Eurobank, National Bank, and Piraeus—restored their solvency. The majority of the remaining institutions were either closed or absorbed. A hybrid public–private financing model was designed to limit immediate fiscal impact and incentivize private investors through option rights and enhanced governance participation above a 10% shareholding threshold. This model led to EUR 25.5 billion in public injections and EUR 3.1 billion in private funding, which, combined with smaller bank consolidations, resulted in a highly concentrated banking sector: Five banks held 94% of assets, the highest concentration in the EU.
The second recapitalization round in spring 2014, amounting to EUR 8.3 billion and fully private, signaled a near-return of investor confidence and enabled Eurobank to reestablish a majority private shareholding. However, structural weaknesses remained, including CET1 ratio reliance on deferred tax assets (DTAs). The introduction of the DTA-to-deferred tax credits (DTC) mechanism, guaranteed by the State, was a regulatory innovation that preserved capital quality while increasing potential correlation between sovereign and banking risk.
The third recapitalization (in late 2015) took place under adverse macroeconomic conditions, drastically diluting prior private and public investments. Nonetheless, ownership structures shifted towards a more privatized shareholder base, reflecting the gradual transfer of supervisory responsibility from the State to market forces.
Overall, the three recapitalization phases from 2013–2015 radically transformed the banking sector, establishing an oligopolistic structure with enhanced capital adequacy but increased reliance on non-organic capital sources (e.g., DTCs). This example illustrates how regulatory interventions—especially Basel capital quality requirements—can lead to innovative legislative responses, albeit with significant risk implications for both banks and the public sector.
The successive recapitalizations, along with the transition to the Eurozone’s Single Supervisory Mechanism, reshaped Greece’s institutional banking landscape. At the forefront of the new system are the following.
- The Hellenic Financial Stability Fund (HFSF), which, as both shareholder and overseer, seeks to preserve the value of public investments;
- The intergovernmental EFSF/ESM institutions, which financed the EUR 50 billion recapitalization and resolution package;
- The European Commission’s DG Competition, which monitors compliance with State aid law;
- The Single Supervisory Mechanism (SSM), which, since 2014, has exercised direct microprudential oversight over systemic Eurozone banks.
The HFSF’s strategic role was institutionalized via the 2013 Relationship Framework Agreements (RFAs) and reinforced by Law 4340/2015, introducing strict fit-and-proper criteria for board members and mandating the HFSF’s institutional presence in corporate governance structures. This framework aims to achieve the following.
- Limit political interference in bank management;
- Align governance practices with SSM requirements;
- Strengthen accountability towards private and institutional investors.
However, demanding independence and international experience criteria excludes many domestic executives, creating a paradox: Depoliticization is achieved but possibly at the cost of leveraging local expertise. Ultimately, this new multi-layered supervisory architecture—comprising the HFSF, EFSF/ESM, DG COMP, and SSM—introduced a system where Greek banks’ corporate governance is shaped less by national regulation than by supranational compliance and supervisory discipline, highlighting the interdependence between fiscal and banking stability under the Economic and Monetary Union (Hardouvelis & Vayanos, 2023).
3. Research Methodology and Analytical Framework
3.1. Research Methodology
The findings of this study are primarily based on quantitative research, following a quantitative approach that employs secondary data, which are both discrete and measurable. These data are sourced from published financial statements, supervisory reports, and banking analyses. The focus of the analysis is the relationship between supervision and risk management in Greece’s four systemic banks in the period from 2015–2024.
Regarding supervision, this study examines the measures implemented by regulatory authorities between 2015 and 2024 to address global economic crises. Attention centers on the Greek sovereign debt crisis and the adoption of these supervisory measures by the four systemic banks, assessing their effectiveness in mitigating the crisis and the impact of the Memoranda of Understanding on the banks studied. The timeframe includes the COVID-19 pandemic and the post-pandemic environment. This investigation considers the impact of Basel III regulatory measures on managing the financial crisis triggered by the pandemic and evaluates their effectiveness.
The core of the study is risk management. This aspect is explored through the analysis of four regulatory ratios under the CRR framework: the capital adequacy ratio (CAR), the non-performing exposure (NPE) ratio, the liquidity coverage ratio (LCR), and risk-weighted assets (RWAs). These ratios were selected based on their prominence in the literature as core metrics of bank stability and supervisory compliance (Tamimi, 2021; Anggraini, 2022). CAR captures solvency, NPE assesses asset quality, LCR evaluates short-term liquidity resilience, and RWAs serve as the denominator in capital calculations—thus, all four are essential for understanding bank risk behavior under regulatory pressure.
According to Tamimi (2021), risk management is now a cornerstone of international banking practice. Its prominence grew significantly following successive financial upheavals, especially the 2008 global financial crisis, which revived scholarly focus on the field. In banking, the objective is not risk avoidance but active risk management. The modern risk management framework raises critical discussions on its definition, structure, and integration with internal control systems and the broader institutional supervisory architecture. Responding to historically insufficient oversight, regulators have adopted numerous regulatory initiatives, requiring banks to invest in integrated infrastructure and data systems to build robust risk management frameworks aligned with supervisory demands.
3.2. Research Design
This quantitative study is based on ratio analysis and supervisory developments recorded over the past decade. The use of secondary data facilitates reliable and longitudinal comparisons of variables related to profitability, leverage, and risk management. Moreover, the research incorporates a qualitative dimension, as the data are examined within the existing literature, particularly regarding trends over time and institutional responses by the banks. It addresses essential questions such as the following.
- Why does a given risk indicator—such as CAR or NPE ratio—in year t differ from its value in year t − 1 or t + 1?
- What are the possible explanations for the sharp trends observed in the data?
- Which actions did each bank undertake that correspond to changes in each ratio?
- Which regulations influenced each ratio’s trajectory, and how did the bank comply?
These research questions guide the explanatory approach adopted in the study, allowing for the identification of potential causal mechanisms behind observed movements in key indicators.
The research adopts an explanatory approach aimed at identifying and interpreting the relationships between two or more variables that influence a specific phenomenon, with a particular emphasis on the capital adequacy ratio. Financial ratios are employed to compare the interrelations between regulatory parameters and their effectiveness. This methodology is typically supported by quantitative techniques applicable to experimental and field-research settings.
4. Data Framework: Sources, Sample Design, and Key Indicators
4.1. Study Period: Regulatory Milestones and Sectoral Developments (2015–2024)
The period from 2015–2024 was selected because it encompasses a series of pivotal developments affecting the domestic banking sector. First, this period marked the full implementation of the Basel III/CRR II framework, which redefined regulatory capital and liquidity requirements. Second, it witnessed major structural reforms, such as the Hercules NPL resolution mechanism and the full lifting of capital controls, which reshaped the operational environment for banks. Third, two European-wide stress test cycles (2018 and 2021) occurred, enabling a comparative assessment of sector resilience. Additionally, this timeframe spans the third recapitalization of Greek banks through the formal conclusion of the domestic sovereign debt crisis, including pre- and post-COVID-19 phases. Therefore, this period offers a coherent and comprehensive backdrop for analyzing developments in capital adequacy, risk management, and regulatory compliance.
4.2. Sample Selection: The Role of Greece’s Four Systemic Banks
The study focuses on the four systemic Greek banks: Alpha Bank, Piraeus Bank, Eurobank, and National Bank of Greece. These institutions were selected due to their critical role in capital restructuring, regulatory redesign, and corporate governance reforms that shaped the modern Greek banking sector (Bekiaris, 2021). They hold over 90% of total banking assets in Greece, are directly supervised by the ECB, and were in continuous operation throughout the study period. Moreover, these systemic banking groups—Piraeus, Alpha, National Bank, and Eurobank—have historically demonstrated leadership in emerging markets and expertise in M&A strategies within both the domestic and international financial sectors (Liapis et al., 2018).
4.3. Data Sources and Documentation Strategy
In the context of a scientifically robust study, the selection and hierarchical structuring of information sources are critical methodological elements. The research strategy relies on six complementary categories of sources, each serving a distinct role in capturing both the regulatory and empirical dimensions of the phenomenon under investigation.
The first pillar is the body of secondary academic literature published in peer-reviewed journals. These articles provide original empirical analysis and theoretical syntheses, having passed the rigors of double-blind review. This ensures methodological rigor, reproducibility, and comparability with international examples.
The second pillar consists of the official websites of the credit institutions themselves, offering primary corporate data, including historical evolution, financial statements, and investor presentations. These sources carry institutional weight and are subject to legal accountability toward shareholders and supervisory authorities. Notably, the collection of numerical data is primarily based on each bank’s Pillar III disclosures as of the reporting date of 31 December of each year.
The third pillar involves the websites of regulatory authorities and international organizations (e.g., Bank of Greece, ECB/SSM, BIS, ESRB), which publish regulatory texts, statistical bulletins, and technical reporting standards. Their authoritative nature renders their data comparable and consistent across jurisdictions.
Supplementary to the above are policy papers and think tank reports, which bridge the gap between theoretical discourse and regulatory practice by providing impact assessments under a framework of methodological transparency.
The fifth component includes specialized academic textbooks and monographs, which provide the conceptual and theoretical foundation necessary for formulating research hypotheses and establishing a coherent analytical framework.
Finally, published statistical time series and technical manuals (such as the BIS Basel Accord handbooks and ECB stress testing guides) ensure terminological consistency and methodological standardization.
The parallel use of these six categories allows for data triangulation: Primary bank data are cross-verified with supervisory authority statistics, while international literature findings are assessed for their relevance and applicability in the Greek context. This triangulated approach ensures accuracy, validity, and high scientific reliability across both quantitative and qualitative findings—an essential requirement for producing well-substantiated, theoretically grounded, and practically valuable research output.
4.4. Key Variables and Risk Indicators Under Analysis
The variables selected aim to capture the following dimensions.
- -
- Capital adequacy and resilience: The capital adequacy ratio (CAR) is selected to measure the overall solvency of a credit institution at a given reporting date. Studying this ratio aligns with the objectives of the present work, as it reflects the institution’s capacity to operate within the supervisory thresholds set by regulatory authorities.
- -
- Credit risk: Two key indicators are analyzed.
- ○
- The non-performing exposure (NPE) ratio, which illustrates the quality of a credit institution’s asset base. This metric is particularly relevant to the current study, as banks’ key actions during the COVID-19 crisis focused on reducing non-performing exposures, either through regulatory tools or strategic initiatives.
- ○
- Risk-weighted assets (RWAs), which constitute the denominator of the CAR ratio. These assets are critical because a high volume of RWAs can negatively affect capital adequacy by lowering the CAR, potentially rendering a bank’s capital insufficient.
- -
- Liquidity risk: The liquidity coverage ratio (LCR) is used to measure liquidity adequacy. Although some of the banks initially reported LCRs below the regulatory minimum, the study of this metric is important, especially considering the regulatory forbearance during the pandemic, which allowed banks to temporarily maintain LCRs below standard thresholds.
- -
- Supervisory interventions and regulatory changes: The most important supervisory measure analyzed is the overall capital requirements (OCR) ratio, derived from Basel I minimum standards, SREP requirements, and macroprudential buffers. As OCR values are largely defined by supervisory authorities, their comparison to CAR values provides insight into each bank’s compliance and resilience under regulatory stress.
4.5. Analytical Approach and Comparative Techniques
The study adopts a multi-level analytical approach, structured around the following four key dimensions.
- (i)
- Bank-level trend analysis: To examine trends at the individual bank level, the method of horizontal analysis is employed. According to Anggraini (2022), horizontal analysis involves comparing financial statements across multiple consecutive periods. This technique tracks changes and fluctuations in financial elements over time, thus revealing the institution’s financial trajectory. When interpreted through the lens of risk management, horizontal analysis maps the dynamic evolution of critical indicators and links them to the prevailing regulatory requirements. The goal is to present the progression of selected indicators for each bank and assess the impact of supervisory measures on their risk management practices, specifically how each bank internalized regulatory changes and how these changes influenced performance. Horizontal trends, therefore, serve as a valuable tool for evaluating both the adaptation pace of each bank and the sector-wide convergence toward regulatory best practices.
- (ii)
- Comparative analysis of capital adequacy indicators: This involves examining the capital adequacy requirements per year—broken down into their components (e.g., TSCR, capital buffers)—and comparing them with each bank’s capital adequacy ratio (CAR) and overall capital requirements (OCRs). The objective is to determine whether supervisory authorities calibrated their capital demands in alignment with each bank’s financial capacity and the broader macroeconomic conditions. This ensures that institutions have a realistic pathway toward meeting capital goals and maintaining operational viability.
- (iii)
- Assessment of banks’ strategic actions toward regulatory alignment: This dimension outlines the main measures undertaken by banks to align their capital and risk metrics with supervisory expectations. These actions were the result of both internal strategic planning and regulatory guidance. The analysis focuses on the years 2020 and 2021—the height of the COVID-19 crisis—and highlights the regulatory forbearance measures, policy decisions, and supervisory tools implemented to support the sector. The aim is to rationalize the observed shifts in key indicators and show how these contributed to the stabilization and recovery of the Greek banking system.
- (iv)
- Comparative analysis under IFRS 9 transitional arrangements: This involves a comparison between CAR values with and without the application of the IFRS 9 transitional arrangements, juxtaposed against OCR levels. The aim is to evaluate whether these transitional measures effectively supported the banks in meeting their regulatory capital requirements during the observed period.
By integrating these four analytical layers, the study offers a coherent, evidence-based evaluation of how regulatory frameworks—particularly Basel III/IV, the EBA guidelines, and the CRR II regulations—shaped both the evolutionary trajectory and the structural risk management strategies of the four systemic Greek banks.
4.6. Research Gap, Contributions, and Limitations
While the literature on financial supervision and bank risk management is extensive, significant gaps remain, particularly in the empirical analysis of how national banking systems, such as Greece’s, have implemented and adapted to evolving regulatory frameworks under conditions of systemic stress.
Existing studies largely emphasize European or global perspectives, often neglecting the unique institutional challenges and macroeconomic volatility characterizing the Greek banking sector. Moreover, the COVID-19 crisis prompted extraordinary supervisory interventions, yet their practical impact on bank resilience, liquidity, and regulatory compliance remains underexplored. The transition from CRR II to CRR III has further introduced complex regulatory demands, with current academic work offering limited applied insights on implementation outcomes.
This study contributes to the field by providing a structured, data-driven assessment of how Greece’s four systemic banks responded to supervisory pressures, particularly from 2015 to 2024. Through comparative analysis of capital adequacy, credit and liquidity risk indicators, and institutional responses, it highlights the interdependence between regulation and banking sector stability. The findings also offer practical implications for improving supervisory effectiveness and enhancing risk governance in similar high-volatility banking environments.
Nonetheless, the study is subject to certain limitations. The reliance on secondary data may introduce inconsistencies due to differences in reporting standards or limited disclosure, especially regarding Pillar II requirements. The small sample size (n = 4 banks) limits statistical generalizability, and overlapping external shocks (e.g., geopolitical events) complicate attribution of outcomes solely to regulatory changes. Additionally, while financial ratios offer standardized insights, they may overlook qualitative aspects such as governance culture and internal control maturity.
To address these challenges, the study employs data triangulation across regulatory and institutional sources, integrates sensitivity analysis, and explicitly considers exogenous factors in its interpretation of results. While acknowledging these limitations, the research offers a reliable, empirically grounded contribution to the understanding of regulatory impact on systemic banking performance within the Eurozone periphery.
5. Empirical and Comparative Analysis of Greek Systemic Banks (2015–2024)
5.1. Bank-Level Analysis
This section presents the quantitative analysis of the four major Greek systemic banks (Alpha Bank, Eurobank, National Bank of Greece, and Piraeus Bank) over the period from 2015–2024. The presentation is structured in two parts: First, the evolution of the key financial ratios for each bank is examined (horizontal analysis), alongside the potential causes of their changes based on the published Pillar III disclosures for each institution. Emphasis is placed on regulatory provisions issued by supervisory authorities and how these influenced the four studied metrics (excluding the overall capital requirement [OCR]).
Subsequently, in the next section, the impact of regulatory capital adequacy measures is analyzed, specifically the implementation of IFRS 9 transitional provisions and how these contributed to the achievement of capital adequacy by the four banks in cases where it was otherwise unattainable.
Figure 1 illustrates the evolution of NPE ratios across the four systemic Greek banks over ten years. All institutions show a substantial decline in NPE levels, particularly after 2020, driven by the implementation of the Hercules Asset Protection Scheme (HAPS), IFRS 9 transitional relief, and intensified supervisory oversight. The convergence trend suggests broad-based asset quality improvement, albeit with different rates of progress among banks.
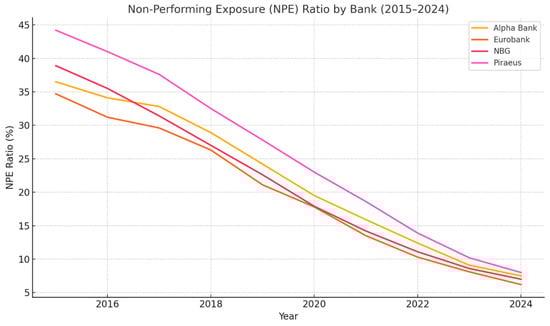
Figure 1.
Non-performing exposure (NPE) ratio by bank (2015–2024). Source: Chart created by authors.
Banks maintained liquidity coverage ratio (LCR) levels well above the 100% regulatory threshold, demonstrating strong short-term liquidity buffers (Figure 2).

Figure 2.
Liquidity coverage ratio (LCR)—all banks (2015–2024). Source: Chart created by authors.
Post-2020, a significant increase in LCRs is observed, primarily due to access to ECB’s TLTRO III funding and temporary liquidity waivers. Eurobank and NBG consistently exhibited higher liquidity resilience, while Piraeus Bank showed the most substantial improvement, indicating effective use of central bank support mechanisms.
Also, as Figure 3 illustrates, the evolution of risk-weighted assets (RWAs) across all four systemic banks steady declines from 2015 to 2024, reflecting effective de-risking strategies, disposal of non-core assets, and enhanced internal risk models. Eurobank and Piraeus Bank show the sharpest declines, aligning with aggressive balance sheet optimization, while NBG retains a relatively higher RWA base due to its legacy exposures and slower asset offloading.
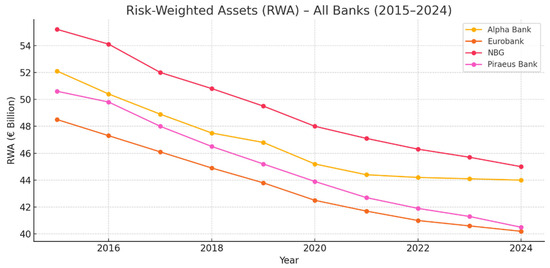
Figure 3.
Risk-weighted assets (RWAs)—all banks (2015–2024). Source: Chart created by authors.
5.1.1. Piraeus Bank
Table 1 below presents data on five key financial metrics for Piraeus Bank over the period from 2015–2024. Notably, according to the 2017 Pillar III disclosures, although the liquidity coverage ratio (LCR) is calculated monthly in compliance with Regulation (EU) No. 575/2013, Piraeus Bank reported that the LCR does not constitute a meaningful indicator of liquidity risk for institutions that relied on emergency liquidity assistance (ELA). As a result, LCR figures are not reported for the years 2017 and earlier.

Table 1.
Key metrics for Piraeus Bank, 2015–2024.
- (i)
- Capital Adequacy Ratio (CAR)
Following relatively high CAR levels in 2015 and 2016, the ratio declined in 2017 by 1.90 percentage points year-over-year, reaching a decade low of 13.65% in 2018—marginally above the regulatory minimum. According to the 2018 Pillar III disclosures, Piraeus Bank initiated a series of strategic interventions to stabilize its capital base, optimize risk structure, and align with supervisory expectations. These interventions included the following.
- Progress in implementing the 2018 Restructuring Plan, with emphasis on capital efficiency and compliance;
- Enhanced capital allocation efficiency, including active management of risk-weighted assets (RWAs) and incorporation of updated capital cost metrics into risk pricing models;
- Strengthening supervisory credibility through redesign of Pillar III disclosures, LGD model enhancements, expanded stress testing, and application of advanced risk quantification techniques;
- Divestment from non-core operations via the sale of five subsidiaries in Greece and southeast Europe, resulting in notable RWA reductions;
- Significant reduction of non-performing exposures (NPEs) through two major transactions involving EUR 1.8 billion of secured and unsecured distressed asset portfolios.
From 2019 onward, CAR showed a consistent upward trend, attributed in part to improved RWA management.
- (ii)
- Non-Performing Exposure (NPE) Ratio
The NPE ratio increased by 5.3 percentage points from 2015 to 2017, peaking at 56%. From that point onward, a sustained reduction began. Between 2017 and 2020, the ratio declined by 9.7 percentage points, followed by the sharpest drop of the decade in 2021, when the ratio fell by 32.8 percentage points. Key developments from the 2021 Pillar III disclosures include the following.
- February 2021: Application to include the Vega securitizations under the Hellenic Asset Protection Scheme (HAPS), securing government guarantees for senior bonds totaling ~EUR 1.4 billion.
- 1 March 2021: Agreement with Intrum AB for the sale of mezzanine (30%) and junior (50% +1 share) tranches of the EUR 4.9 billion Vega portfolio.
- 16 March 2021: Approval of the “Sunrise Plan” by the Board of Directors, targeting an EUR 19 billion NPE reduction through securitizations (Phoenix, Vega, Sunrise I–II) and asset sales, alongside EUR 3 billion in capital enhancement measures and operational streamlining.
- 15 June 2021: Agreement with Intrum AB (49%) and Serengeti Asset Management LP (2%) for Sunrise I (EUR 7.2 billion GBV); the deal closed on 20 September 2021.
- July–August 2021: Completion of Phoenix and Vega securitizations and in-kind distribution of shares in Phoenix Vega Mezz Ltd. to shareholders.
- November–December 2021: Finalization of Sunrise II transaction (EUR 2.6 billion GBV) with the same investors. Piraeus retained 5% of junior/mezzanine tranches and 100% of senior (EUR 1.2 billion).
These actions brought the NPE ratio into the single digits in 2022 (6.8%) and down to 2.6% in 2024.
- (iii)
- Liquidity Coverage Ratio (LCR)
Piraeus Bank’s LCR saw a sharp rise from 2018 to 2019 (+58%) and again from 2019 to 2020 (+56%). A pivotal development was the full exit from the ELA mechanism in July 2018. This milestone marked the beginning of a steady upward trajectory in LCR performance, supported by the following.
- Improved market access and liquidity conditions;
- Strengthened balance sheet metrics and accumulation of high-quality liquid assets (HQLAs);
- Restored compliance with Basel III liquidity standards (LCR and NSFR) by year-end 2019, as reported in the 2019 Pillar III disclosures;
- Positive effects from balance sheet deleveraging, the return of customer deposits, enhanced interbank market access, and successful Tier 2 bond issuance (June 2019).
Despite the macroeconomic disruptions of 2020, the bank’s liquidity position remained resilient. Continued LCR growth was supported by the following.
- A diversified and stable deposit base;
- Adequate, high-quality collateral buffers;
- Timely issuance of additional Tier II instruments;
- Public sector support (EC, ECB, Greek government) during the COVID-19 crisis.
By the end of 2020, the LCR had reached 175%, well above regulatory thresholds. Private and corporate deposits also grew, rising to EUR 49.1 billion from EUR 43.8 billion in 2019.
From 2020 to 2023, the LCR maintained a positive trajectory, peaking at 241% in 2023, followed by a modest decline to 219% in 2024. Nevertheless, the ratio remained well above regulatory minimums, underscoring the bank’s robust liquidity position.
- (iv)
- Regulatory Capital Requirements vs. CAR
Piraeus Bank showed the narrowest margin between CAR and OCR, especially after 2020 (Figure 4). This trend highlights the bank’s historically weaker capital base and higher regulatory scrutiny. While it remained above the OCR threshold, its reliance on capital support and regulatory forbearance was more pronounced.
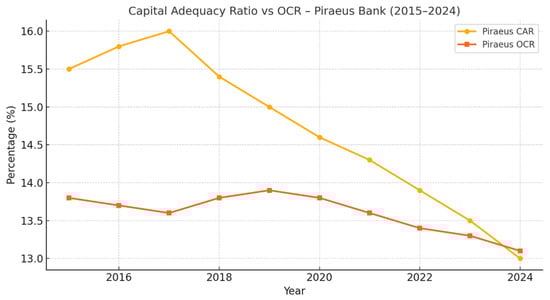
Figure 4.
Piraeus Bank–capital adequacy ratio vs. OCR (2015–2024). Source: Chart created by authors.
5.1.2. Alpha Bank
Table 2 below presents the evolution of five key financial indicators for Alpha Bank over the period from 2015–2024. While the liquidity coverage ratio (LCR) is a core regulatory metric, the 2018 Pillar III report notes that it does not fully capture the liquidity risks faced by Greek banks during systemic crises. In response, Alpha Bank submits detailed liquidity data monthly—on both a solo and consolidated basis—to the Single Supervisory Mechanism (SSM).
Table 2.
Key financial metrics for Alpha Bank, 2015–2024.
Capital adequacy ratio (CAR) fluctuated between 16.1% in 2021 and 18.4% in both 2017 and 2020. These figures reflect the impact of IFRS 9 transitional arrangements and the incorporation of annual net profits.
- (i)
- Capital Strengthening Initiatives
According to the 2021 Pillar III disclosures, Alpha Bank undertook two major initiatives to enhance its capital base.
- Issuance of Tier 2 Subordinated Bonds:
- ○
- In 2020, the Bank issued an EUR 500 million 10-year Tier 2 bond with a 4.25% coupon, callable after five years.
- ○
- In 2021, a second EUR 500 million bond was issued with a 5.5% coupon, 10.25-year maturity, and a call option between the fifth and fifth-quarter years.
Both instruments were listed on the Luxembourg Stock Exchange, thereby broadening the Bank’s investor base and providing a substantial capital buffer above regulatory requirements.
- (ii)
- Reduction in Non-Performing Exposures (NPEs)
A significant improvement in Alpha Bank’s asset quality was achieved through its flagship risk-reduction program, Project Galaxy, which included the following.
- An EUR 10.8 billion securitization under the Hellenic Asset Protection Scheme (HAPS), with EUR 3.8 billion in senior tranches guaranteed by the Greek government.
- Transfer of the Bank’s NPE servicing platform to Cepal Hellas, which assumed responsibility for managing EUR 29 billion in distressed assets.
Key milestones in NPE reduction include the following.
- 2019–2020: The NPE ratio declined from 44.8% to 26.0% (a reduction of 18.8 percentage points), following the transfer of the internal servicing unit to Cepal Hellas. The agreement was signed on 30 November 2020, and the carve-out was completed on 1 December 2020. The restructuring also entailed enhancements in credit governance and internal controls.
- 2020–2021: A further reduction from 26.0% to 13.1% (−12.9 percentage points) was achieved through the completion of the ARIES program—a comprehensive initiative encompassing 15 restructuring and de-risking projects. Key components included the transfer of additional servicing platforms (e.g., Arotron, Qualco, Genesys) to Cepal Hellas, as well as concurrent securitizations (Galaxy and Cosmos) and reclassification of several distressed portfolios (Orbit, Sky, Riviera) as “held for sale.”
- (iii)
- Liquidity Coverage Ratio (LCR) Enhancements
Alpha Bank’s liquidity position strengthened considerably over the study period.
- 2019–2020: The LCR rose from 86.13% to 112.00%, underpinned by the following.
- ○
- Growth in the customer deposit base to EUR 43.8 billion;
- ○
- An EUR 841 million increase in high-quality liquid assets (HQLAs), bolstered by the 2020 Tier 2 bond issuance;
- ○
- Temporary relaxation of collateral eligibility criteria within the Eurosystem framework.
- 2020–2021: The LCR increased further to 170.00%, supported by the following.
- ○
- An additional EUR 3.1 billion in client deposits;
- ○
- New issuances of EUR 0.5 billion in Tier 2 hybrids and EUR 0.9 billion in senior preferred instruments;
- ○
- Targeted borrowing of EUR 1.1 billion under the ECB’s TLTRO III facility.
- (iv)
- Risk-Weighted Assets (RWAs)
Alpha Bank’s RWAs declined steadily from EUR 52 billion in 2015 to EUR 45 billion by 2020, indicating a controlled deleveraging strategy and a more conservative risk profile. A sharper drop to EUR 32 billion was recorded in 2021, primarily due to the Galaxy and Cosmos securitizations and the carve-out of Cepal. Post-2021, RWAs stabilized, closing at EUR 29.7 billion in 2024—reflecting improved asset quality and reduced capital intensity.
The following Table 3 compares Alpha Bank’s CAR with its overall capital requirement (OCR) from 2017 to 2024, including all Pillar I and Pillar II elements, as well as capital buffers. Table 3 illustrates a sharp increase in OCR from 2017 to 2019, relative stabilization during the pandemic period (2020–2021), and a renewed upward trend from 2022 onward—coinciding with Alpha Bank’s return to profitability and improved risk profile.
Table 3.
Comparison of capital adequacy ratio (CAR) and overall capital requirement (OCR), 2017–2024.
Alpha Bank maintained its capital adequacy ratio (CAR) above the regulatory threshold (OCR) throughout the period (Figure 5). However, the declining trend in CAR after 2020 suggests growing capital pressure, likely driven by the acceleration of NPE clean-up operations and limited profitability. The narrowing gap post-COVID reflects the gradual phasing out of supervisory reliefs.
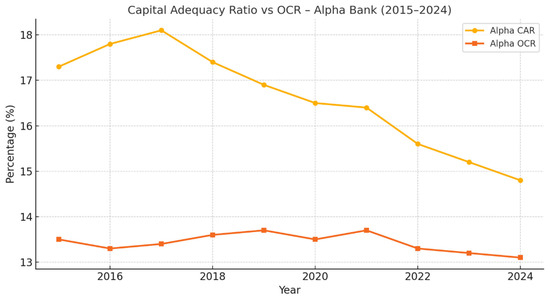
Figure 5.
Alpha Bank–capital adequacy ratio vs. OCR (2015–2024). Source: Chart created by authors.
Alpha Bank’s post-crisis recovery is characterized by a multi-faceted strategy: substantial capital reinforcement via Tier 2 issuances, aggressive NPE reduction through securitizations and servicing carve-outs, sustained improvements in liquidity, and disciplined RWA management. Throughout the period, the Bank consistently maintained its CAR above regulatory thresholds—often by significant margins—affirming the effectiveness of its strategic direction and robust risk governance framework.
5.1.3. National Bank of Greece (NBG)
Table 4 presents five key financial indicators for the National Bank of Greece (NBG) over the period from 2015–2024. According to the Group’s Pillar III disclosures for the consolidated financial statements from 2015–2018, the liquidity coverage ratio (LCR) was not considered fully representative of the Group’s liquidity position due to the prevailing crisis conditions in Greece at the time.
Table 4.
Key financial metrics for the National Bank of Greece, 2015–2024.
- (i)
- Capital Adequacy Ratio (CAR)
NBG’s CAR increased markedly from 14.60% in 2015 to 16.30% in 2016, primarily due to a substantial reduction in risk-weighted assets (RWAs), which fell from EUR 61.8 billion to EUR 41.1 billion. While the CAR experienced a slight decline during the pandemic—falling from 16.90% in 2019 to 16.65% in 2020, despite an EUR 0.74 billion decrease in RWAs—it subsequently recovered, reaching 17.51% in 2021 and peaking at 20.89% in 2024. The most significant year-on-year increase occurred between 2022 and 2023 (+2.50 percentage points).
All reported CAR values incorporate net profits and reflect transitional provisions under IFRS 9. Notably, without the IFRS 9 adjustments, the 2020 CAR would have been 13.76%, falling below the regulatory threshold of 14%. A more detailed breakdown of the impact of transitional versus fully loaded CAR figures is provided in the subsequent chapter.
- (ii)
- Reduction in Non-Performing Exposure (NPE) Ratio
NBG achieved a substantial and sustained decline in its NPE ratio across the review period, with the following key turning points documented in the Group’s Pillar III disclosures and financial reports.
- 2018–2019 (−9.8 percentage points): The NPE ratio decreased from 41.10% to 31.30%, driven by an EUR 4.7 billion reduction in non-performing exposures—EUR 0.5 billion above the SSM’s annual target. This was achieved through targeted debt restructurings, partial write-offs, improved cure rates, and lower re-default rates. In Q4 2019 alone, NPEs declined by an additional EUR 0.8 billion, of which EUR 0.5 billion was achieved organically. By year-end, NPE balances stood at EUR 10.6 billion, EUR 11 billion lower than in 2016. NBG also launched securitization transactions exceeding EUR 6 billion (covering approximately two-thirds of remaining NPEs) and executed early portfolio sales under projects Symbol, Mirror, Leo, and Icon, as well as in Romania and Cyprus. Importantly, COVID-19-related forbearance did not materially elevate credit risk, with flexible days-past-due frameworks supporting further NPE reductions.
- 2019–2020 (−17.7 percentage points): This was the most substantial annual decline since the onset of the financial crisis, with NPEs falling by EUR 6.5 billion, exceeding the previous year’s EUR 4.9 billion reduction. This achievement occurred without any legal restructuring such as a hive-down. The following two main factors contributed.
- Frontier securitization: An EUR 6+ billion NPE portfolio was classified as “held for sale” and derecognized in Q4 2020, materially reducing credit risk and RWA without significant capital depletion;
- Net negative organic flow: Even under pandemic conditions, NBG’s cure rates and restructured accounts outpaced new defaults, resulting in negative organic NPE formation—a testament to improved credit management and effective early-warning mechanisms.
Q4 2020 alone witnessed an EUR 5.8 billion quarter-on-quarter reduction in NPEs, largely attributable to the Frontier transaction, highlighting the effectiveness of asset derecognition under the Hercules guarantee scheme. Overall, NBG’s balanced approach—integrating securitizations, disposals, and internal remediation—facilitated rapid convergence toward EU asset quality standards.
- (iii)
- Liquidity Coverage Ratio (LCR)
NBG’s liquidity position improved substantially over the period, with the LCR more than doubling from 128.86% in 2018 to 261.92% in 2024.
- 2018–2019 (+42.84 percentage points): The LCR rose to 171.70% by end-2019, underpinned by stable deposit inflows, long-term funding diversification, and reduced reliance on Eurosystem financing (only EUR 2.25 billion in TLTRO III exposure). Liquidity was further supported by an EUR 0.4 billion Tier 2 bond issuance and a decrease in repo transactions, which increased the pool of unencumbered assets. Funding costs declined by 8 basis points (to an average of 41 bps), and total liquidity reserves reached EUR 12.4 billion—including EUR 8 billion in Greek sovereign bonds and EUR 3.1 billion in cash and interbank placements.
- 2020–2021 (+50.65 percentage points): Despite pandemic-related pressures, the LCR surged to 252.85% in 2021. This was driven by deposit growth (up to EUR 51.9 billion), including EUR 1.3 billion in net inflows from retail savers in Q4 2021. The Bank further tapped low-cost ECB liquidity under TLTRO III and utilized repos with international financial institutions, backed by high-grade collateral (Greek and EU sovereign bonds, Treasury bills, and covered bonds). These developments enhanced the Bank’s liquidity buffers while maintaining capital efficiency and regulatory compliance.
- (iv)
- Risk-Weighted Assets (RWAs)
NBG’s RWAs declined significantly in 2016 and continued this downward trend through 2018. From 2018 to 2024, RWAs remained relatively stable with only marginal fluctuations, reflecting disciplined credit risk management and a strategic shift toward lower-risk assets.
Throughout the entire period, the Bank maintained CAR levels above the regulatory minimum, often with significant buffers, indicating a prudent capital management approach (Figure 6). NBG maintained one of the highest CAR levels among systemic banks, consistently exceeding its OCR by a safe margin. This performance is attributed to reduced RWAs, deleveraging from non-core assets, and improved internal capital generation. The slight decline in CAR in later years signals normalization of capital planning post-pandemic.

Figure 6.
National Bank of Greece (NBG)–capital adequacy ratio vs. OCR (2015–2024). Source: Chart created by authors.
The National Bank of Greece demonstrated sustained financial strengthening over the 2015–2024 period through a combination of capital reinforcement, aggressive NPE reduction (via both securitizations and internal restructuring), enhanced liquidity, and stable RWA control. Importantly, the Bank consistently maintained CAR levels above regulatory thresholds, highlighting the resilience of its strategic initiatives and risk governance framework even amid significant macroeconomic and health-related disruptions.
5.1.4. Eurobank
Table 5 below presents five key financial metrics for Eurobank over the period from 2015–2024. As noted in the institution’s Pillar III disclosures, the liquidity coverage ratio (LCR) reported between 2015 and 2018 may not fully reflect the Bank’s liquidity position due to the prevailing systemic stress in the Greek financial system.
Table 5.
Key financial indicators for Eurobank, 2015–2024.
- (i)
- Capital Adequacy Ratio (CAR)
Eurobank’s CAR increased from 17.40% in 2015 to a peak of 19.20% in 2019, despite a temporary decline to 16.70% in 2018. During the COVID-19 pandemic (2020–2021), CAR remained relatively stable around 16%, before rebounding post-crisis to 19.50% in 2024—its highest level over the decade. The Bank’s capital strength was preserved despite temporary earnings pressures and restructuring costs associated with its NPE reduction strategy.
- (ii)
- Non-Performing Exposure (NPE) Ratio
Following 2016, Eurobank’s NPE ratio declined steadily, with two major periods of accelerated reduction.
- 2018–2019 (−21.1 percentage points): In November 2018, Eurobank launched a comprehensive transformation plan structured around the following two strategic pillars.
- Merger with Grivalia Properties: This transaction bolstered the Bank’s capital base and liquidity buffer.
- Accelerated NPE Reduction:
- ▪
- Under Project Pillar, EUR 2 billion of mortgage exposures were securitized into senior, mezzanine, and junior tranches. Eurobank sold 95% of the subordinated tranches to an international investor, effectively derecognizing these exposures.
- ▪
- The larger Project Cairo involved the securitization of EUR 7.5 billion in non-performing loans. The senior tranches benefited from state guarantees under the Hercules Asset Protection Scheme (HAPS).
- ▪
- In parallel, Eurobank executed a legal hive-down, separating its performing banking operations from its non-performing exposures, in preparation for a strategic partnership with FPS, later rebranded as DoValue.
- ▪
- In 2019, the Bank divested a majority stake in FPS and sold a 20% interest in Cairo’s mezzanine tranches, retaining only EUR 1.06 billion in senior notes and minimal exposure to subordinated tranches.
These actions reduced the NPE ratio from 37.0% in 2018 to 15.9% by end-2019, positioning the Bank for a further drop to single-digit levels by 2021. The Grivalia integration and advanced servicing architecture laid the foundation for sustained profitability and normalized operations.
- 2020–2021 (−7.2 percentage points): Eurobank launched Project Mexico, targeting a further reduction of legacy NPEs. Through Mexico Finance DAC, EUR 5.2 billion of NPEs (net book value: EUR 3.2 billion) were securitized into three tranches (senior, mezzanine, and junior). Initially retained on the Bank’s balance sheet, the tranches were incorporated under the Hercules II scheme, enabling derecognition.
- In June 2021, shareholders approved a capital reduction in kind, allowing 95% of the mezzanine and junior tranches to be distributed to Eurobank Holdings.
- Regulatory approvals (ECB and Greek Ministry of Finance) followed in August, and the distribution was finalized in September.
- Eurobank Holdings recognized a fair value gain and gained control of the SPV. A letter of intent to sell the distributed securities to DoValue was signed, subject to final shareholder and regulatory conditions. These were met in December 2021, concluding the sale and transfer of portfolio servicing responsibilities to DoValue (2022).
These comprehensive and well-executed initiatives—combined with the support of the Hercules schemes—facilitated one of the most significant NPE reductions in the Greek banking sector, particularly during a period of heightened economic uncertainty.
- (iii)
- Liquidity Coverage Ratio (LCR)
Eurobank’s liquidity position improved markedly from 2019 onwards, with the LCR increasing by 76.4 percentage points between 2019 and 2022 despite COVID-19-related disruptions.
- 2020: Eurobank made extensive use of the ECB’s TLTRO III program, increasing its borrowing from EUR 1.9 billion to EUR 8 billion. In parallel, customer deposits grew by EUR 2.4 billion. ECB emergency collateral frameworks further strengthened liquidity buffers, contributing to an LCR increase to 117.43%.
- 2021: The Bank expanded ECB funding to EUR 11.8 billion and attracted an additional EUR 5.9 billion in deposits. Two EUR 500 million senior preferred bond issuances (May and September) boosted the Bank’s high-quality liquid asset (HQLA) reserves. Part of the surplus liquidity was tactically invested in non-HQLA instruments (e.g., AAA-rated CLOs and high-yield bonds) to enhance returns in the prevailing low-rate environment.
Between 2020 and 2022, Eurobank benefited from coordinated regulatory measures by the SSM and ECB—including forbearance regimes, flexible prudential buffers, and targeted MREL issuances. Deposits increased by EUR 2.4 billion in 2020, EUR 5.9 billion in 2021, and EUR 4 billion in 2022. This resulted in significant improvements in liquidity resilience, HQLA levels, and funding diversification.
- (iv)
- Risk-Weighted Assets (RWAs)
From 2020–2021, Eurobank’s RWA declined primarily due to the offloading of NPEs through securitizations, which also contributed to modest improvements in capital ratios. From 2022 onwards, RWAs increased again as balance sheet activity recovered and lending volumes expanded. The following Table 6 compares Eurobank’s CAR with the overall capital requirements (OCRs) from 2017 to 2024. Throughout the entire period, the Bank’s CAR consistently exceeded the minimum regulatory thresholds.
Table 6.
Eurobank’s capital adequacy ratio vs. regulatory requirements, 2017–2024.
Notably, the temporary regulatory relief offered from 2020–2021 (OCR increase of only 0.01 percentage points) allowed Eurobank to maintain adequate capital buffers even as earnings and balance sheet dynamics were challenged by the pandemic. This outcome underscores the effectiveness of the Bank’s risk and capital management frameworks.
Eurobank demonstrated consistent capital strength with a stable CAR–OCR differential (Figure 7). The Bank’s early de-risking efforts and operational efficiency allowed it to preserve capital buffers despite broader market stress. Its relatively lower OCR reflects a conservative risk profile and positive SREP assessments.
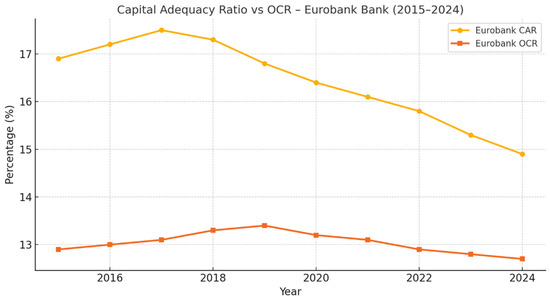
Figure 7.
Eurobank–capital adequacy ratio vs. OCR (2015–2024). Source: Chart created by authors.
Over the 2015–2024 period, Eurobank significantly strengthened its financial position through the following.
- A robust capital base, with CAR consistently above regulatory requirements;
- Rapid NPE reduction via two strategically structured securitization programs (Pillar and Mexico);
- Enhanced liquidity through active use of ECB programs, bond issuances, and deposit growth.
These outcomes reflect strong risk governance, strategic foresight, and operational resilience, positioning Eurobank among the leading Greek financial institutions in terms of post-crisis recovery and alignment with European banking standards.
5.2. Comparative Summary Across Banks
This section undertakes a comparative evaluation of the effect of IFRS9 implementation on the capital adequacy ratio (CAR). Effective 1 January 2018, IFRS 9 introduced transitional arrangements designed to reinforce regulatory capital buffers. By allowing phased recognition of credit loss provisions, the standard helped banks meet supervisory CAR thresholds during the transition.
For each institution, the following three metrics are calculated annually.
- CAR_IFRS9: CAR incorporating IFRS 9 transitional relief;
- CAR_NO-IFRS9: CAR without IFRS 9 transitional measures;
- OCR: Overall capital requirement (supervisory threshold).
Figure 8 illustrates the evolution of the capital adequacy ratio (CAR) and the overall capital requirement (OCR) for Alpha Bank, Eurobank, National Bank of Greece (NBG), and Piraeus Bank from 2015 to 2024.

Figure 8.
CAR vs. OCR comparison—all Greek systemic banks (2015–2024). Source: Chart created by authors.
All banks consistently maintained CAR levels above their respective OCR thresholds, confirming regulatory compliance. NBG shows the strongest capital buffer throughout the period, while Piraeus Bank maintains the narrowest gap between CAR and OCR, reflecting its relatively weaker capital position and higher supervisory pressure.
Post-2020, all institutions experienced gradual capital erosion, narrowing the gap with OCR—highlighting the impact of pandemic-related provisioning, balance sheet adjustments, and the rollback of temporary regulatory reliefs. The visual comparison underlines both the resilience and the differentiated supervisory trajectories of each institution.
5.2.1. Piraeus Bank
From 2018–2021, fully loaded CAR_NO-IFRS9 fell short of OCR (by 0.7–3.0 pp), implying regulatory compliance was contingent upon transitional relief. Starting in 2022, CAR_NO-IFRS9 consistently exceeded OCR—a sign of structural recovery via capital increase or RWA reduction (Table 7). The narrowing gap—between CAR_IFRS9 and CAR_NO-IFRS9—reflects both phasing-out of transitional support and improved asset quality. Meanwhile, rising OCR (due to normalization post-pandemic and RWA shifts) was outpaced by stronger capital accumulation. By 2024, Piraeus Bank had evolved from reliance on accounting relief to a position of robust capital strength, enhancing its resilience to economic shocks.
Table 7.
Piraeus Bank: CAR_IFRS9 and CAR_NO-IFRS9 vs. OCR (2018–2024).
5.2.2. Alpha Bank
Alpha Bank demonstrated consistent capital resilience. Except for a minor shortfall in 2021 (−0.20 pp), CAR_NO-IFRS9 remained above OCR. Post-2021, strong capital generation—through profit retention and NPE reduction—widened margins substantially (Table 8). By 2024, CAR_IFRS9 had reached 21.9% with complete phasing-out of transitional benefit, indicating capital strength is not accounting-driven. CAR_improvement outstripped OCR increases (from 12.88% to 14.67%), providing a wide regulatory buffer.
Table 8.
Alpha Bank: CAR_IFRS9 and CAR_NO-IFRS9 vs. OCR (2018–2024).
5.2.3. National Bank of Greece (NBG)
NBG transitioned from marginal compliance to robust capital levels. CAR_NO-IFRS9 exceeded OCR only from 2021 onward, driven by NPE reductions to single-digit ratios (Table 9). Gradual elimination of IFRS transitional benefit and the widening gap to OCR validate structural strengthening, underpinned by profitability, improved asset quality, and calibrated RWA management. By 2024, NBG had built a secure capital buffer, reducing supervisory risk.
Table 9.
NBG: CAR_IFRS9 and CAR_NO-IFRS9 vs. OCR (2018–2024).
5.2.4. Eurobank
Eurobank maintained CAR_NO-IFRS9 consistently above OCR. The transitional benefit eroded by 2023 and 2024 as CAR_IFRS9 converged with the fully loaded ratio (Table 10). OCR rose ~2.3 pp from 2018–2024, but Eurobank’s CAR growth outpaced it. The result was a trajectory from modest excess capital to substantial resilience, independent of transitional relief.
Table 10.
Eurobank: CAR_IFRS9 and CAR_NO-IFRS9 vs. OCR (2018–2024).
6. Quantitative Assessment of Supervisory Interventions Amid the COVID-19 Pandemic
This section examines the key supervisory instruments employed by the four systemic banks, their operational implementation, their role in mitigating the economic impact of COVID-19, and an evaluative assessment of their effectiveness.
6.1. Primary Supervisory Measures by Bank
In comparing the interventions across banks, it becomes clear that all institutions benefited from IFRS 9 transitional arrangements and ECB liquidity support, while the extent and sequencing of securitizations varied significantly (Table 11). Piraeus relied more heavily on public guarantees (HAPS), whereas Eurobank was an early mover in NPE reduction. These differences underscore the role of internal strategy and timing in shaping regulatory outcomes.
Table 11.
Primary supervisory measures by bank.
6.2. Supervisory Effectiveness: Composite Assessment
To quantify regulatory effectiveness, a “supervision impact” (SI) score (scale 1–5) is assigned to each measure. The grading scale for supervisory impact is inspired by the ECB/SSM and EBA SREP methodologies, which define a 1–4 scoring framework covering risk categories (business model, capital, liquidity), combining quantitative risk-level and qualitative risk-control assessments to derive an aggregate supervisory score. The highest applicable score is assigned, provided the measure’s effect is sustained for at least 12 months.
- (i)
- Origin and Interpretation of the Supervision Impact (SI) Scores
The supervision impact (SI) score was developed as a composite metric to quantify the relative effectiveness of supervisory interventions across the four systemic banks. The score is derived from the ECB/SSM and EBA SREP methodologies, which use a scoring scale to evaluate risk categories like capital adequacy, liquidity, and business model performance.
Each supervisory tool (e.g., IFRS 9 transitional relief, TLTRO access, OCR adjustment, Hercules participation) was evaluated on a scale of 1 to 5 based on the following three criteria.
- Impact on capital adequacy or liquidity indicators: This criterion assesses how significantly the measure improved the capital and liquidity positions of the bank.
- Sustainability of the measure’s effect: This evaluates whether the impact of the intervention was temporary or sustained over a longer period.
- Degree of bank dependence on the measure: This criterion measures the bank’s reliance on the specific intervention, where greater dependence indicates a higher score.
The scoring scale for the SI score is as follows.
5: Represents a structural shift in the bank’s business model or supervisory performance. This indicates a significant and lasting change to the bank’s capital structure or risk profile.
4: Reflects a critical improvement in capital or liquidity, enabling the bank to meet regulatory compliance.
3: Denotes a significant improvement without altering the bank’s strategic risk profile.
2: Represents a marginal improvement, which, while statistically significant, had limited operational impact.
1: Reflects negligible impact, where the intervention did not have a significant effect on the bank’s supervisory performance.
Each score is assigned based on the specific characteristics of the intervention. For example, Hercules I and II (HAPS) received the highest score of 5 because it facilitated a major derecognition of NPEs and provided substantial capital relief, resulting in a structural shift in the bank’s credit risk profile.
The total supervision impact (SI) score across all evaluated instruments is 20 out of 30, yielding a composite effectiveness score of 66.67% (Table 12). This result suggests that the regulatory measures adopted during the COVID-19 crisis were moderately effective in stabilizing the capital and liquidity positions of systemic Greek banks. While these interventions delivered tangible improvements—particularly in reducing non-performing exposures (NPEs) and enhancing liquidity—they fell short of triggering structural transformations in supervisory and business model frameworks.
Table 12.
SI Scoring by supervisory tool.
The remaining 33.33% of stabilization was achieved primarily through internal bank-driven initiatives, including capital increases, asset sales, and operational cost reductions. This outcome highlights the complementary relationship between external regulatory support and internal strategic responses. The relative speed and intensity of the COVID-19 shock, especially in contrast to the more gradual evolution of the 2008 financial crisis, likely influenced the regulatory approach. Supervisory authorities focused on credit risk containment using established instruments, such as transitional IFRS 9 provisions and LCR flexibility, rather than deploying novel or transformative tools. As a result, while the framework was effective in the short term, its long-term structural impact remained constrained.
The supervision impact score (SIS) quantifies the extent to which each bank’s prudential improvement during the COVID-19 era was driven by supervisory actions versus internal strategic decisions. Alpha Bank and Piraeus Bank showed the highest supervision dependence, while Eurobank demonstrated more internally driven resilience.
- (ii)
- Conclusion: Synthesis of Key Findings from Bank Comparison
The comparison of supervisory measures across the four systemic Greek banks highlights several key insights. First, all banks benefited significantly from IFRS 9 transitional relief and ECB liquidity support. However, the extent and sequencing of securitizations varied, with Piraeus Bank heavily relying on public guarantees through the Hercules Asset Protection Scheme (HAPS), while Eurobank took an early lead in reducing non-performing exposures (NPEs).
Furthermore, the supervision impact (SI) scores reveal that, while the interventions were moderately effective in stabilizing the banks’ capital and liquidity positions during the pandemic, they did not result in structural changes to their business models. Measures such as HAPS and TLTRO III had the most substantial impact, with HAPS achieving the highest score of 5, signifying a structural shift in credit risk profiles.
Overall, the regulatory framework was effective in the short term, but had limited long-term transformative effects. The analysis also suggests that the relative dependence on regulatory support varied across banks, with Alpha Bank and Piraeus Bank showing higher reliance on external measures, while Eurobank demonstrated more resilience through internal strategies.
This evaluation underscores the complementary role of internal strategies and external regulatory support, particularly in times of crisis. While supervisory interventions played a key role in stabilizing banks during the COVID-19 pandemic, their long-term effectiveness in reshaping the business and supervisory models remains constrained by the nature of the measures deployed.
Figure 9 quantifies the extent to which each bank’s prudential improvement during the COVID-19 era was driven by supervisory actions versus internal strategic decisions. A higher SIS indicates stronger reliance on regulatory support mechanisms. Alpha Bank and Piraeus Bank show the highest supervision dependence, while Eurobank demonstrates more internally driven resilience.

Figure 9.
Supervision impact score (SIS) by bank (2020–2024). Source: Chart created by authors.
7. Conclusions and Discussion
This study explored how Greece’s four systemic banks responded to supervisory challenges during a decade shaped by post-crisis restructuring and pandemic-induced volatility. Using regulatory disclosures and financial data from 2015–2024, the analysis revealed that enhanced supervision under CRR II and CRR III significantly contributed to improved capital adequacy, liquidity buffers, and NPE reduction.
The application of key supervisory tools—such as the Hercules asset protection schemes, IFRS 9 transitional relief, and TLTRO III—played a pivotal role in safeguarding the financial system during the COVID-19 crisis. However, the composite supervision impact score of 66.67% suggests that these measures, while effective in stabilizing key metrics, did not fundamentally transform the structural risk profile of Greek banks. The remaining one-third of resilience gains derived from internal strategic actions such as capital increases, NPE securitizations, and cost rationalization.
Among the four banks, performance varied significantly. Piraeus and Alpha Bank showed higher dependence on supervisory reliefs, while Eurobank displayed greater self-driven capital resilience. This heterogeneity highlights the critical role of internal governance, strategic planning, and operational flexibility in achieving regulatory compliance.
The ECB’s SSM adopted a forward-looking supervisory stance, emphasizing real-time adjustment of Pillar II requirements, targeted governance reforms, and the incorporation of emerging risks—such as climate risk and cyber threats. Nevertheless, long-term concerns remain regarding the durability of deferred tax credit-based capital structures and the systemic overreliance on temporary regulatory forbearance.
The Greek experience offers valuable insights for supervisory frameworks across other emerging Eurozone banking systems, particularly those characterized by structural vulnerabilities, high public debt, or exposure to external shocks. The combination of targeted supervisory relief (e.g., IFRS 9 transitional measures), state-backed securitization schemes (Hercules I and II), and ECB liquidity support demonstrates a flexible, yet rules-based supervisory approach. Countries such as Portugal, Cyprus, and Slovenia may benefit from adopting similar hybrid strategies, balancing macroprudential discipline with tailored interventions to support banking resilience during prolonged crises.
Policy implications include the need for enhanced coordination between supervisory flexibility and structural reform agendas, particularly in high-volatility jurisdictions. Additionally, the experience of Greece offers valuable lessons for tailoring transitional measures and liquidity support tools in other peripheral Eurozone banking systems.
Overall, the findings confirm that supervisory adaptability—including transitional mechanisms like IFRS 9 relief and HAPS—was pivotal in supporting capital stability and enabling prudent risk behavior. Policy makers should consider formalizing such flexibility within future crisis-preparedness frameworks to ensure resilience without compromising prudential standards.
Future research could expand the scope to include comparative analyses with other southern European countries, investigate the impact of ESG risk integration in supervision, or examine the long-term effectiveness of supervisory-induced business model adjustments.
Author Contributions
Conceptualization, G.D., P.L. and S.R.; methodology, G.D., P.L. and S.R.; software, G.D., P.L. and S.R.; validation, G.D., P.L. and S.R.; formal analysis, G.D., P.L. and S.R.; investigation, G.D., P.L. and S.R.; resources, G.D., P.L. and S.R.; data curation, G.D., P.L. and S.R.; writing—original draft preparation, G.D., P.L. and S.R.; writing—review and editing, G.D., P.L. and S.R.; visualization, G.D., P.L. and S.R. All authors have read and agreed to the published version of the manuscript.
Funding
This research received no external funding.
Institutional Review Board Statement
Not applicable.
Informed Consent Statement
Not applicable.
Data Availability Statement
The raw data supporting the conclusions of this article will be made available by the authors on request.
Conflicts of Interest
The authors declare no conflict of interest.
References
- Acharya, V. V., & Steffen, S. (2020). The risk of being a fallen angel and the corporation dash in the midst of COVID. The Review of Corporate Finance Studies, 9(3), 430–471. [Google Scholar] [CrossRef] [PubMed]
- Alnabulsi, K., Kozarevic, E., & Hakimi, A. (2023). Non-performing loans as a driver of banking distress: A systematic literature review. Commodities, 2(2), 111–130. [Google Scholar] [CrossRef]
- Anggraini, N. T. (2022). Analysis of financial statements based on financial ratio and vertical-horizontal method in PT Unilever, Tbk, 2016–2017 period. Journal of Social Science, 3(1), 171–176. [Google Scholar] [CrossRef]
- Bekiaris, M. (2021). Board structure and firm performance: An empirical study of Greek systemic banks. Journal of Accounting and Taxation, 13(2), 110–121. [Google Scholar]
- Claeys, G. (2020). The European Central Bank in the COVID-19 crisis: Whatever it takes, within its mandate (No. 2020/09). Bruegel Policy Contribution. [Google Scholar]
- DoValue. (2022). Annual report. Available online: https://dovaluegreece.gr/sites/gr/files/2023-06/RES%2031.12.2022.pdf (accessed on 7 July 2025).
- ESRB. (2022). Policy measures in response to the COVID-19 pandemic. Database updated 29 September 2022. European Systemic Risk Board. Available online: https://www.esrb.europa.eu/mppa/covid-19-policy-measures/html/index.en.html (accessed on 7 July 2025).
- Gortsos, C. V. (2020a). European central banking law. The role of the European Central Bank and National Central Banks under European law. Palgrave MacMillan. [Google Scholar]
- Gortsos, C. V. (2020b). The response of the European Central Bank to the current pandemic crisis: Monetary policy and prudential banking supervision decisions. European Company and Financial Law Review, 17(3–4), 231–256. [Google Scholar] [CrossRef]
- Hadjiemmanuil, C. (2024). Bank failure management in Greece: Legal framework and role of the Bank of Greece. Working Paper Series No. 168. European Banking Institute. Available online: https://papers.ssrn.com/sol3/papers.cfm?abstract_id=4784351 (accessed on 7 July 2025).
- Hardouvelis, G., & Vayanos, D. (2023). The Greek economic crisis and the banks. GreeSE—Hellenic observatory papers on Greece and Southeast Europe 180. Hellenic Observatory, LSE. [Google Scholar]
- Laeven, L., & Levine, R. (2009). Bank governance, regulation and risk-taking. Journal of Financial Economics, 93(2), 259–275. [Google Scholar] [CrossRef]
- Liapis, K. J., Trigas, S. J., & Patsis, P. A. (2018). Financial and spatial analysis of the Greek systemic banks before and during the financial crisis. In The political economy of development in southeastern Europe (pp. 109–126). Springer. [Google Scholar]
- Quaglia, L., & Verdun, A. (2023). The European Central Bank, the single supervisory mechanism and the COVID-19 related economic crisis: A neofunctionalist analysis. Journal of European Integration, 45(1), 139–156. [Google Scholar] [CrossRef]
- Tamimi, O. (2021). The role of internal audit in risk management from the perspective of risk managers in the banking sector. Australasian Accounting, Business and Finance Journal, 15(2), 114–129. [Google Scholar] [CrossRef]
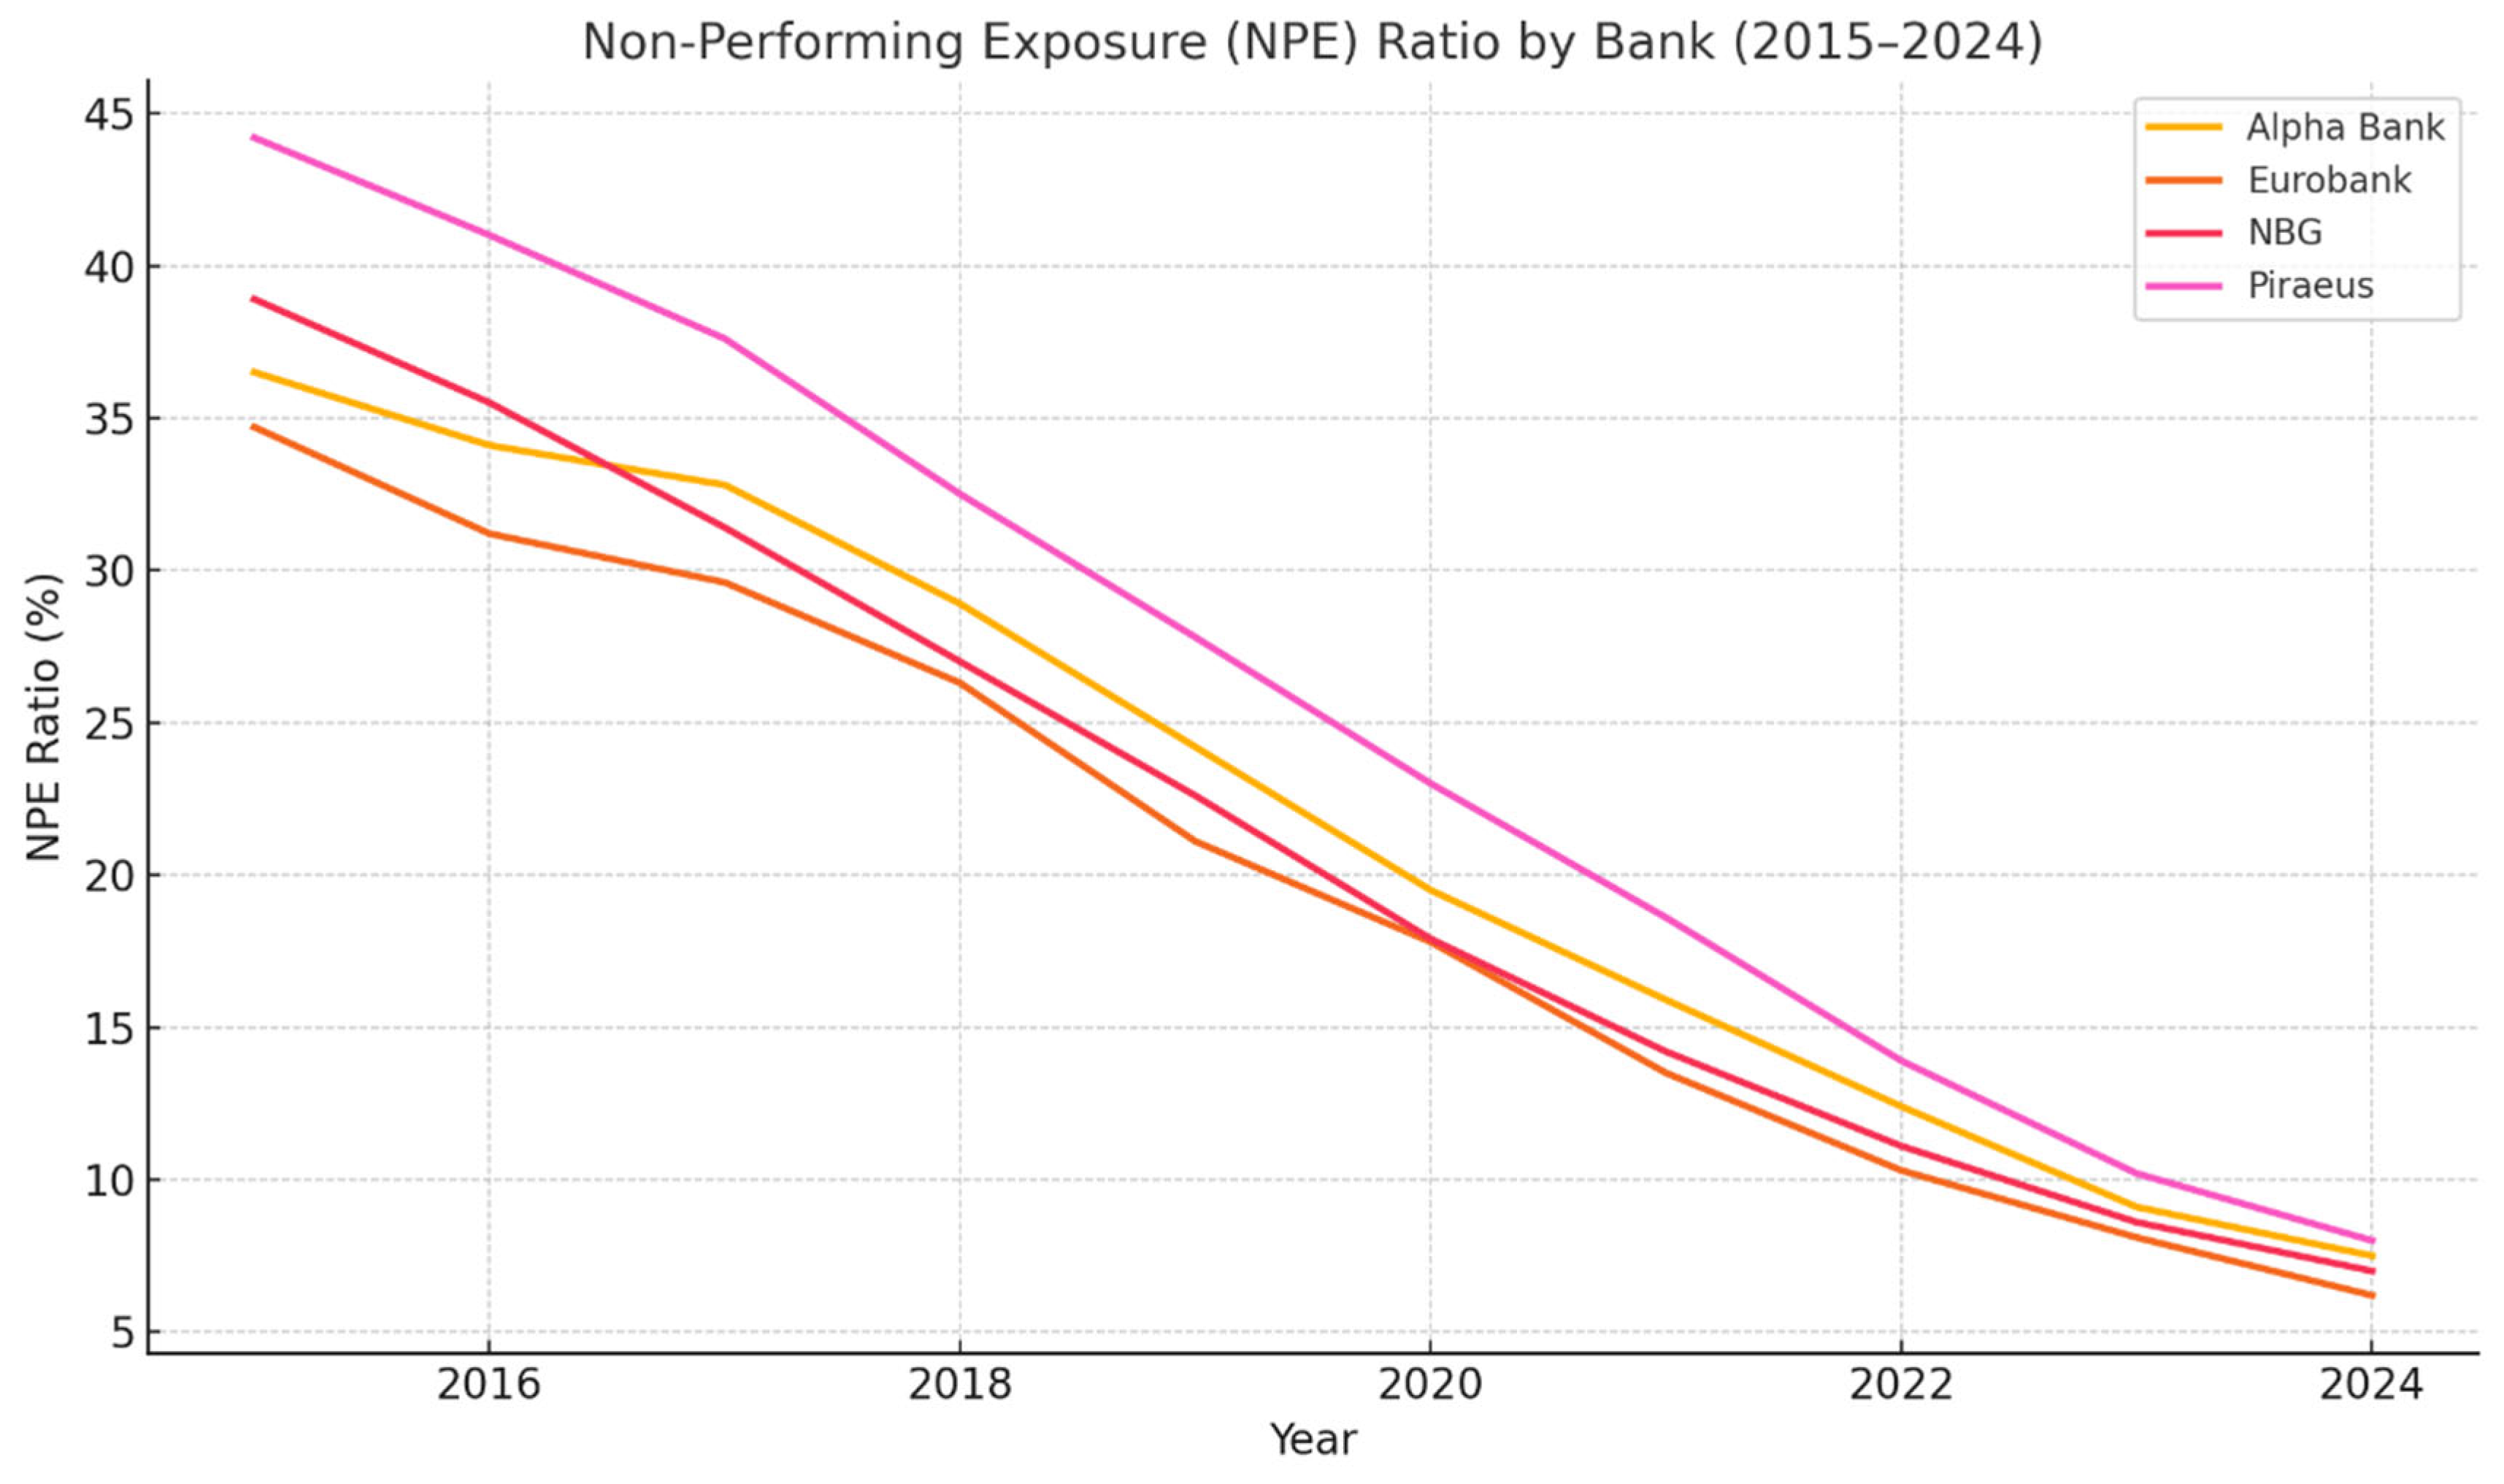
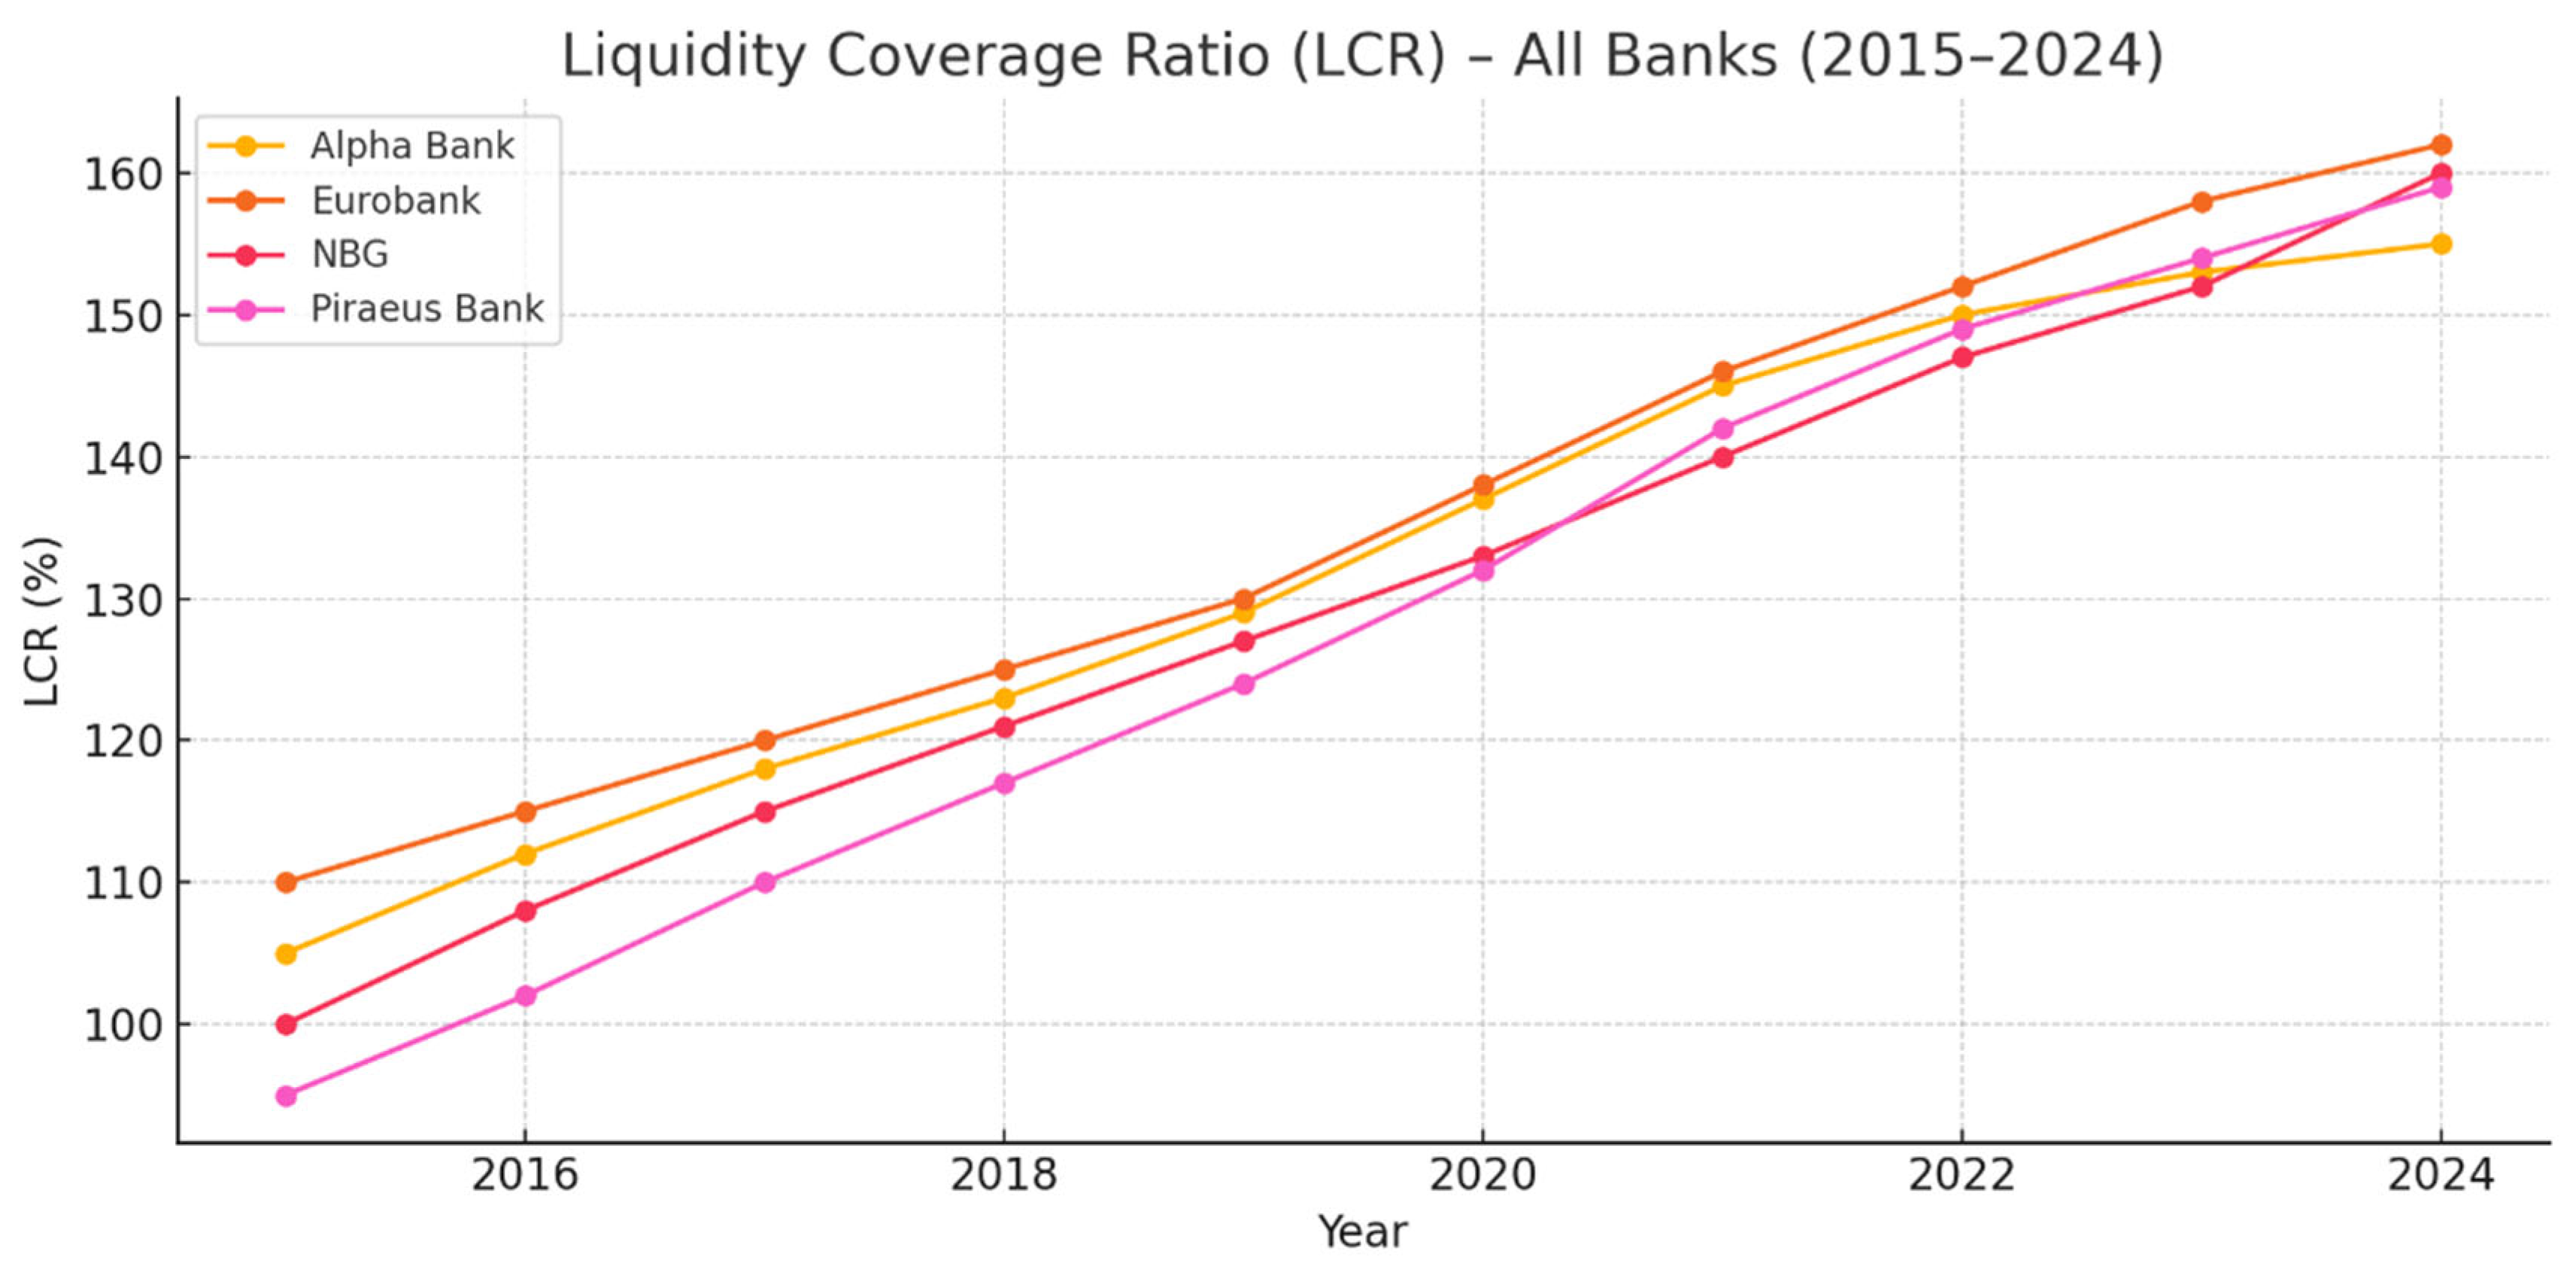
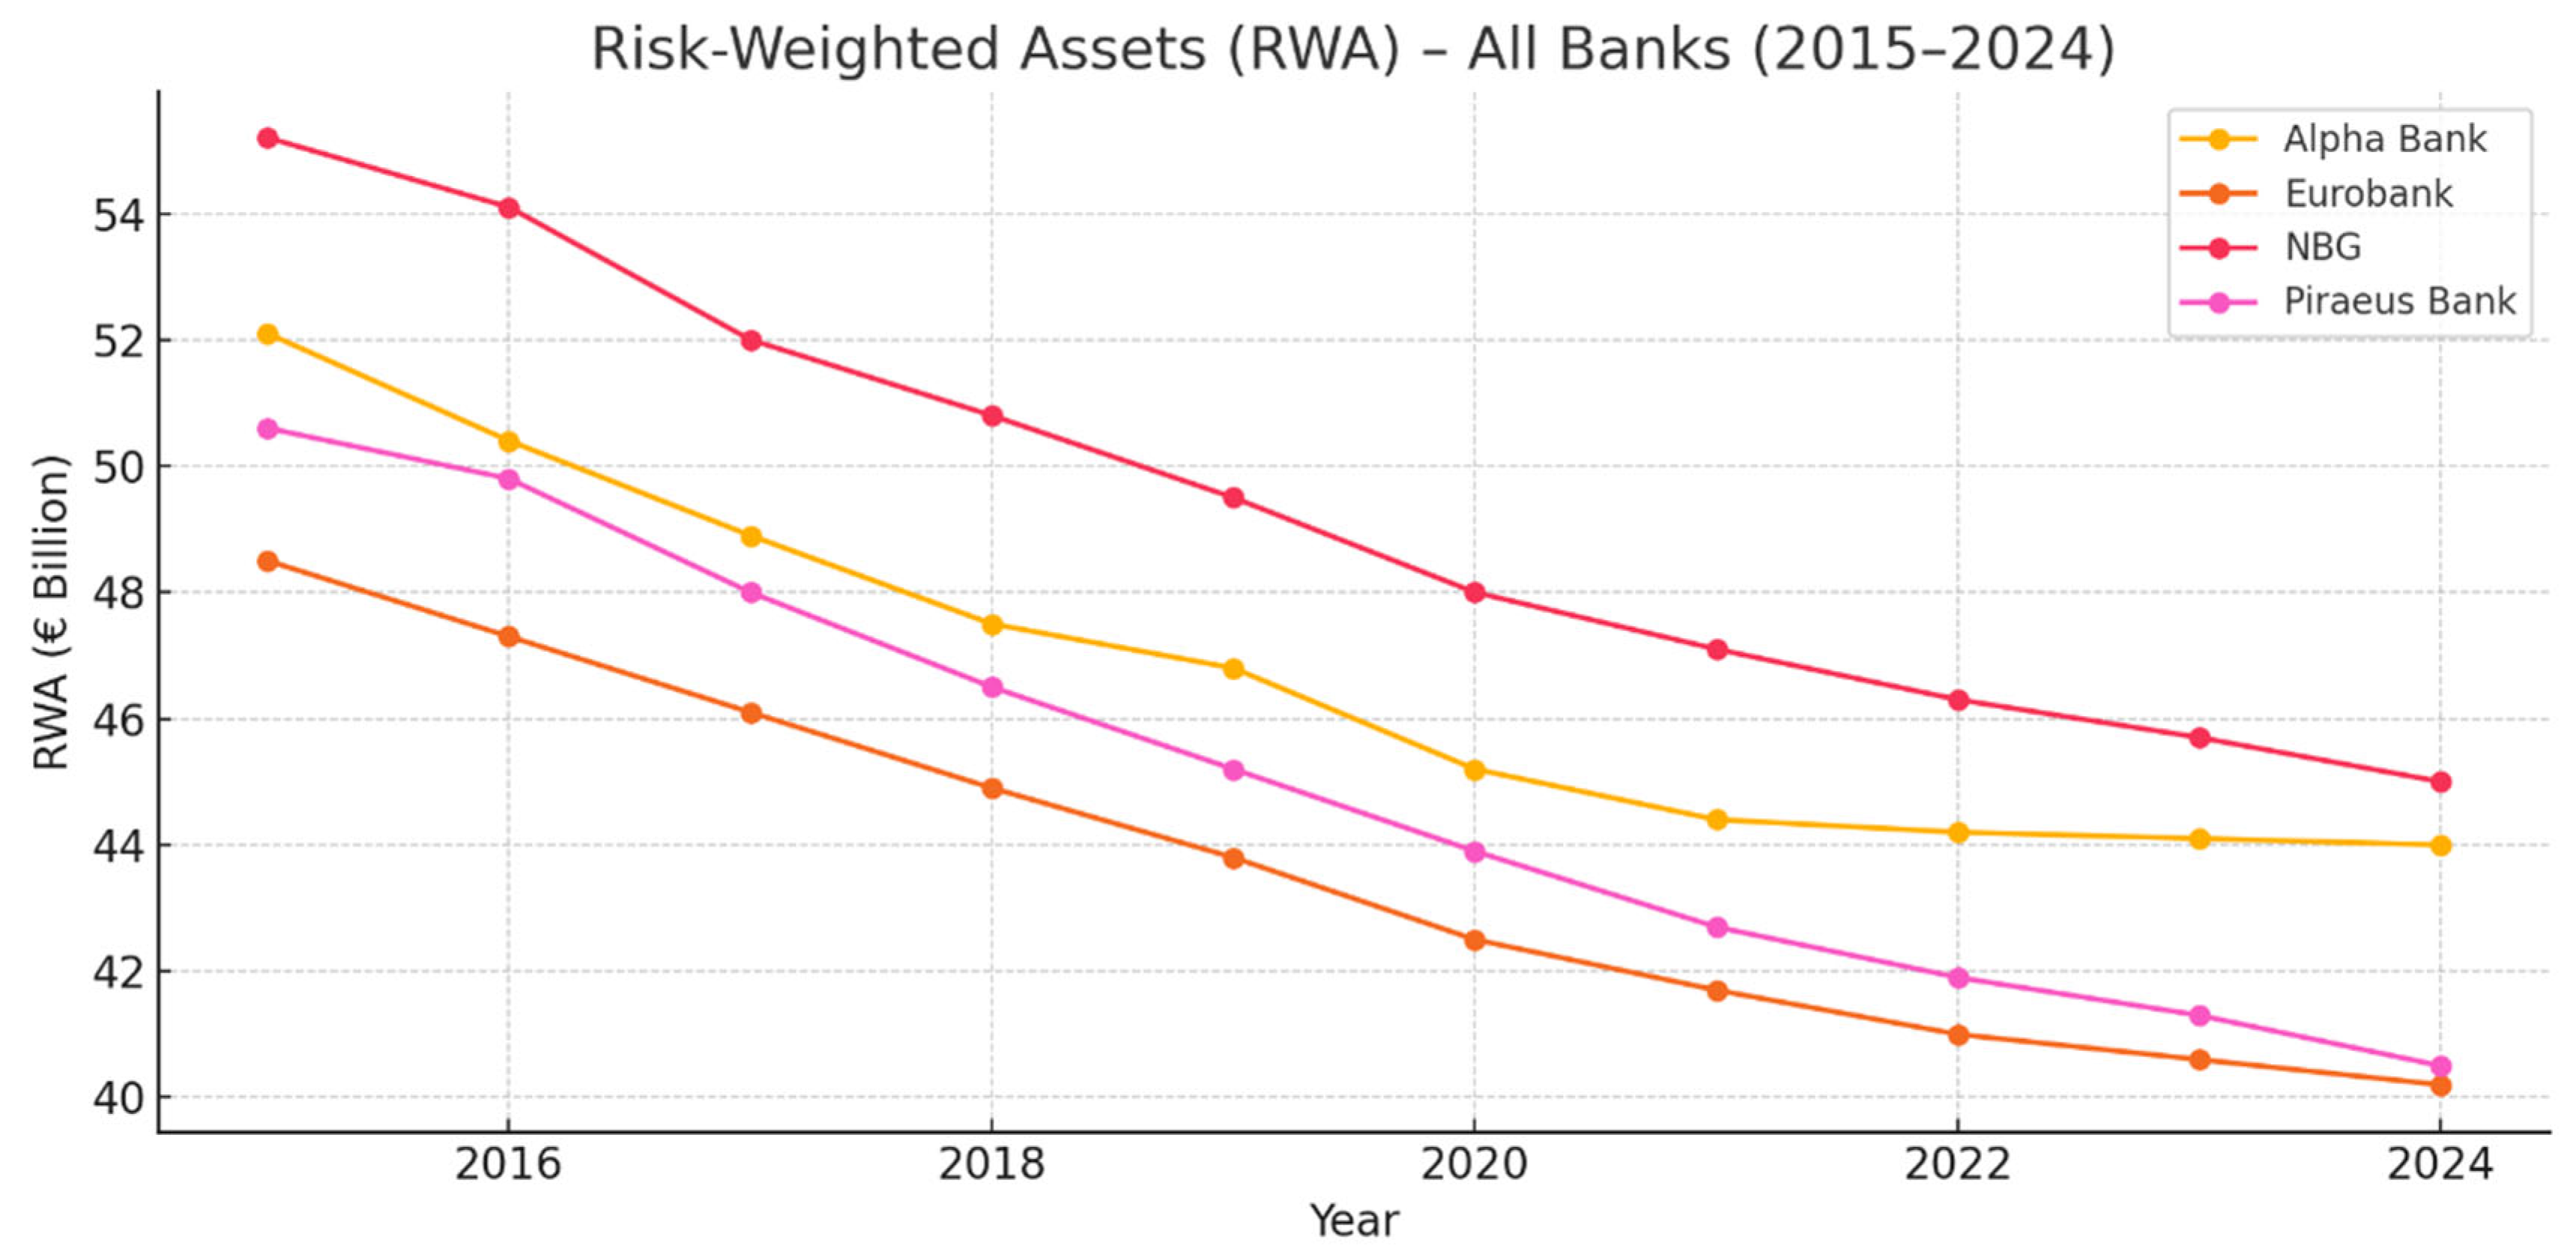
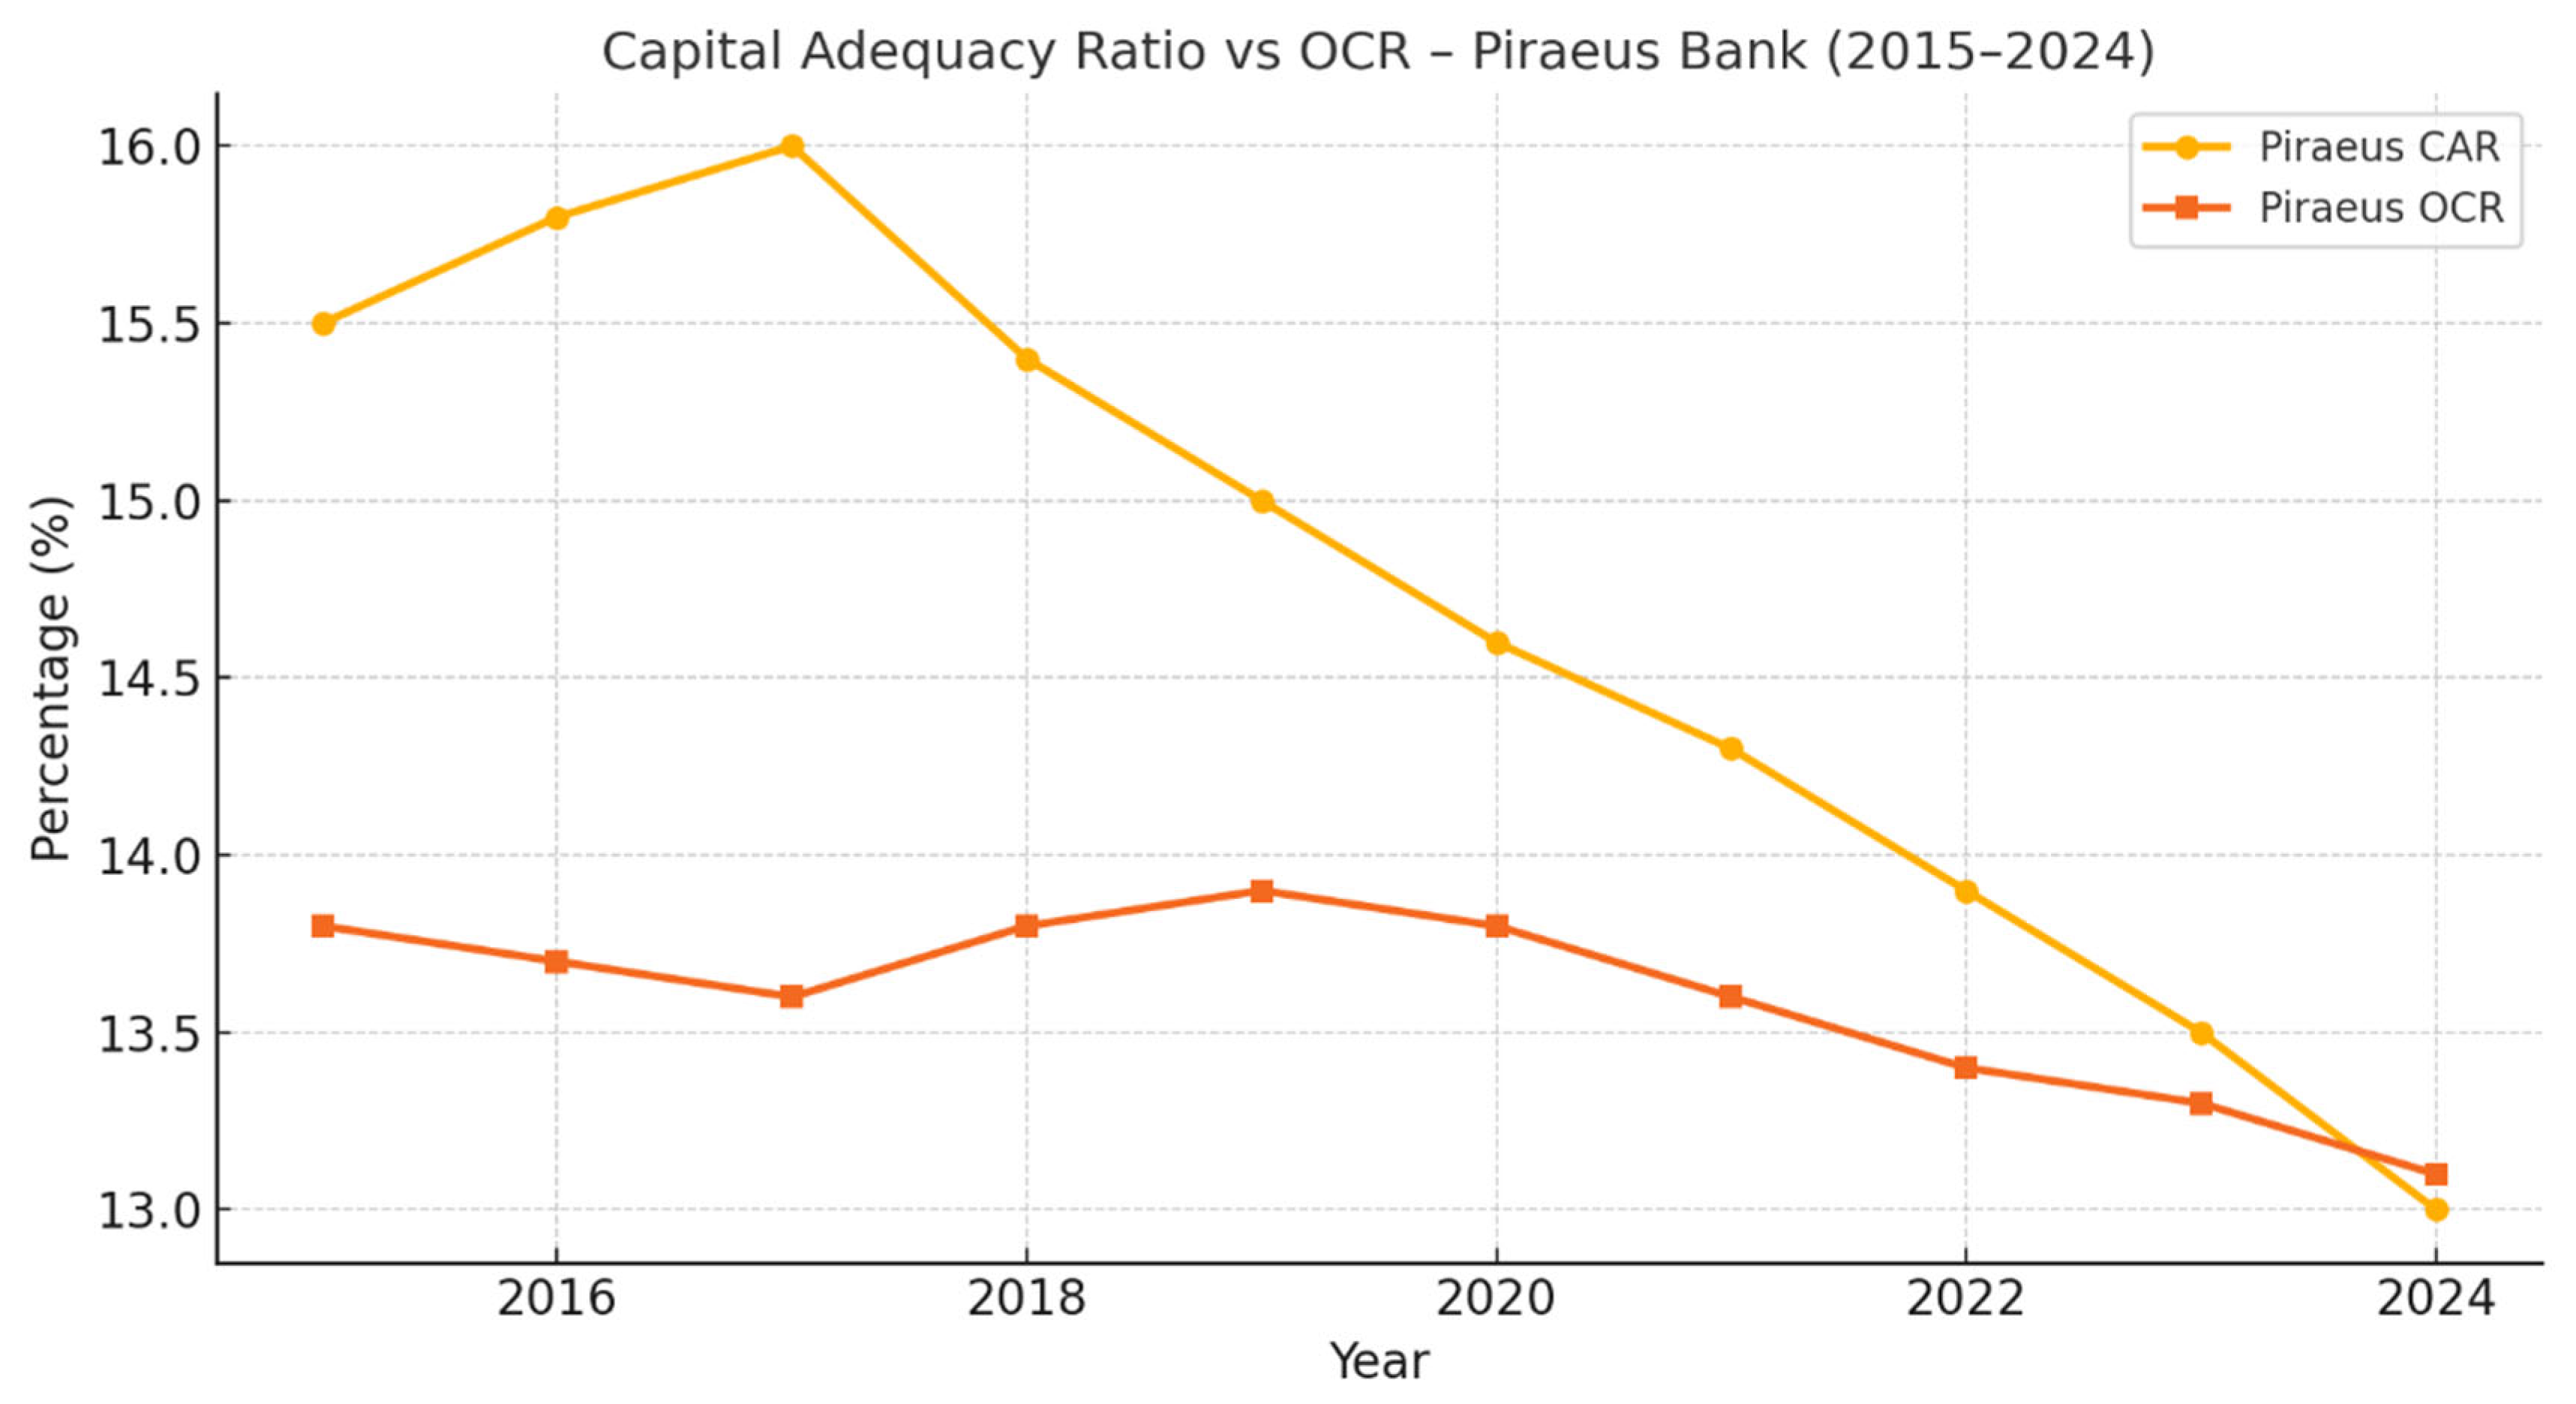
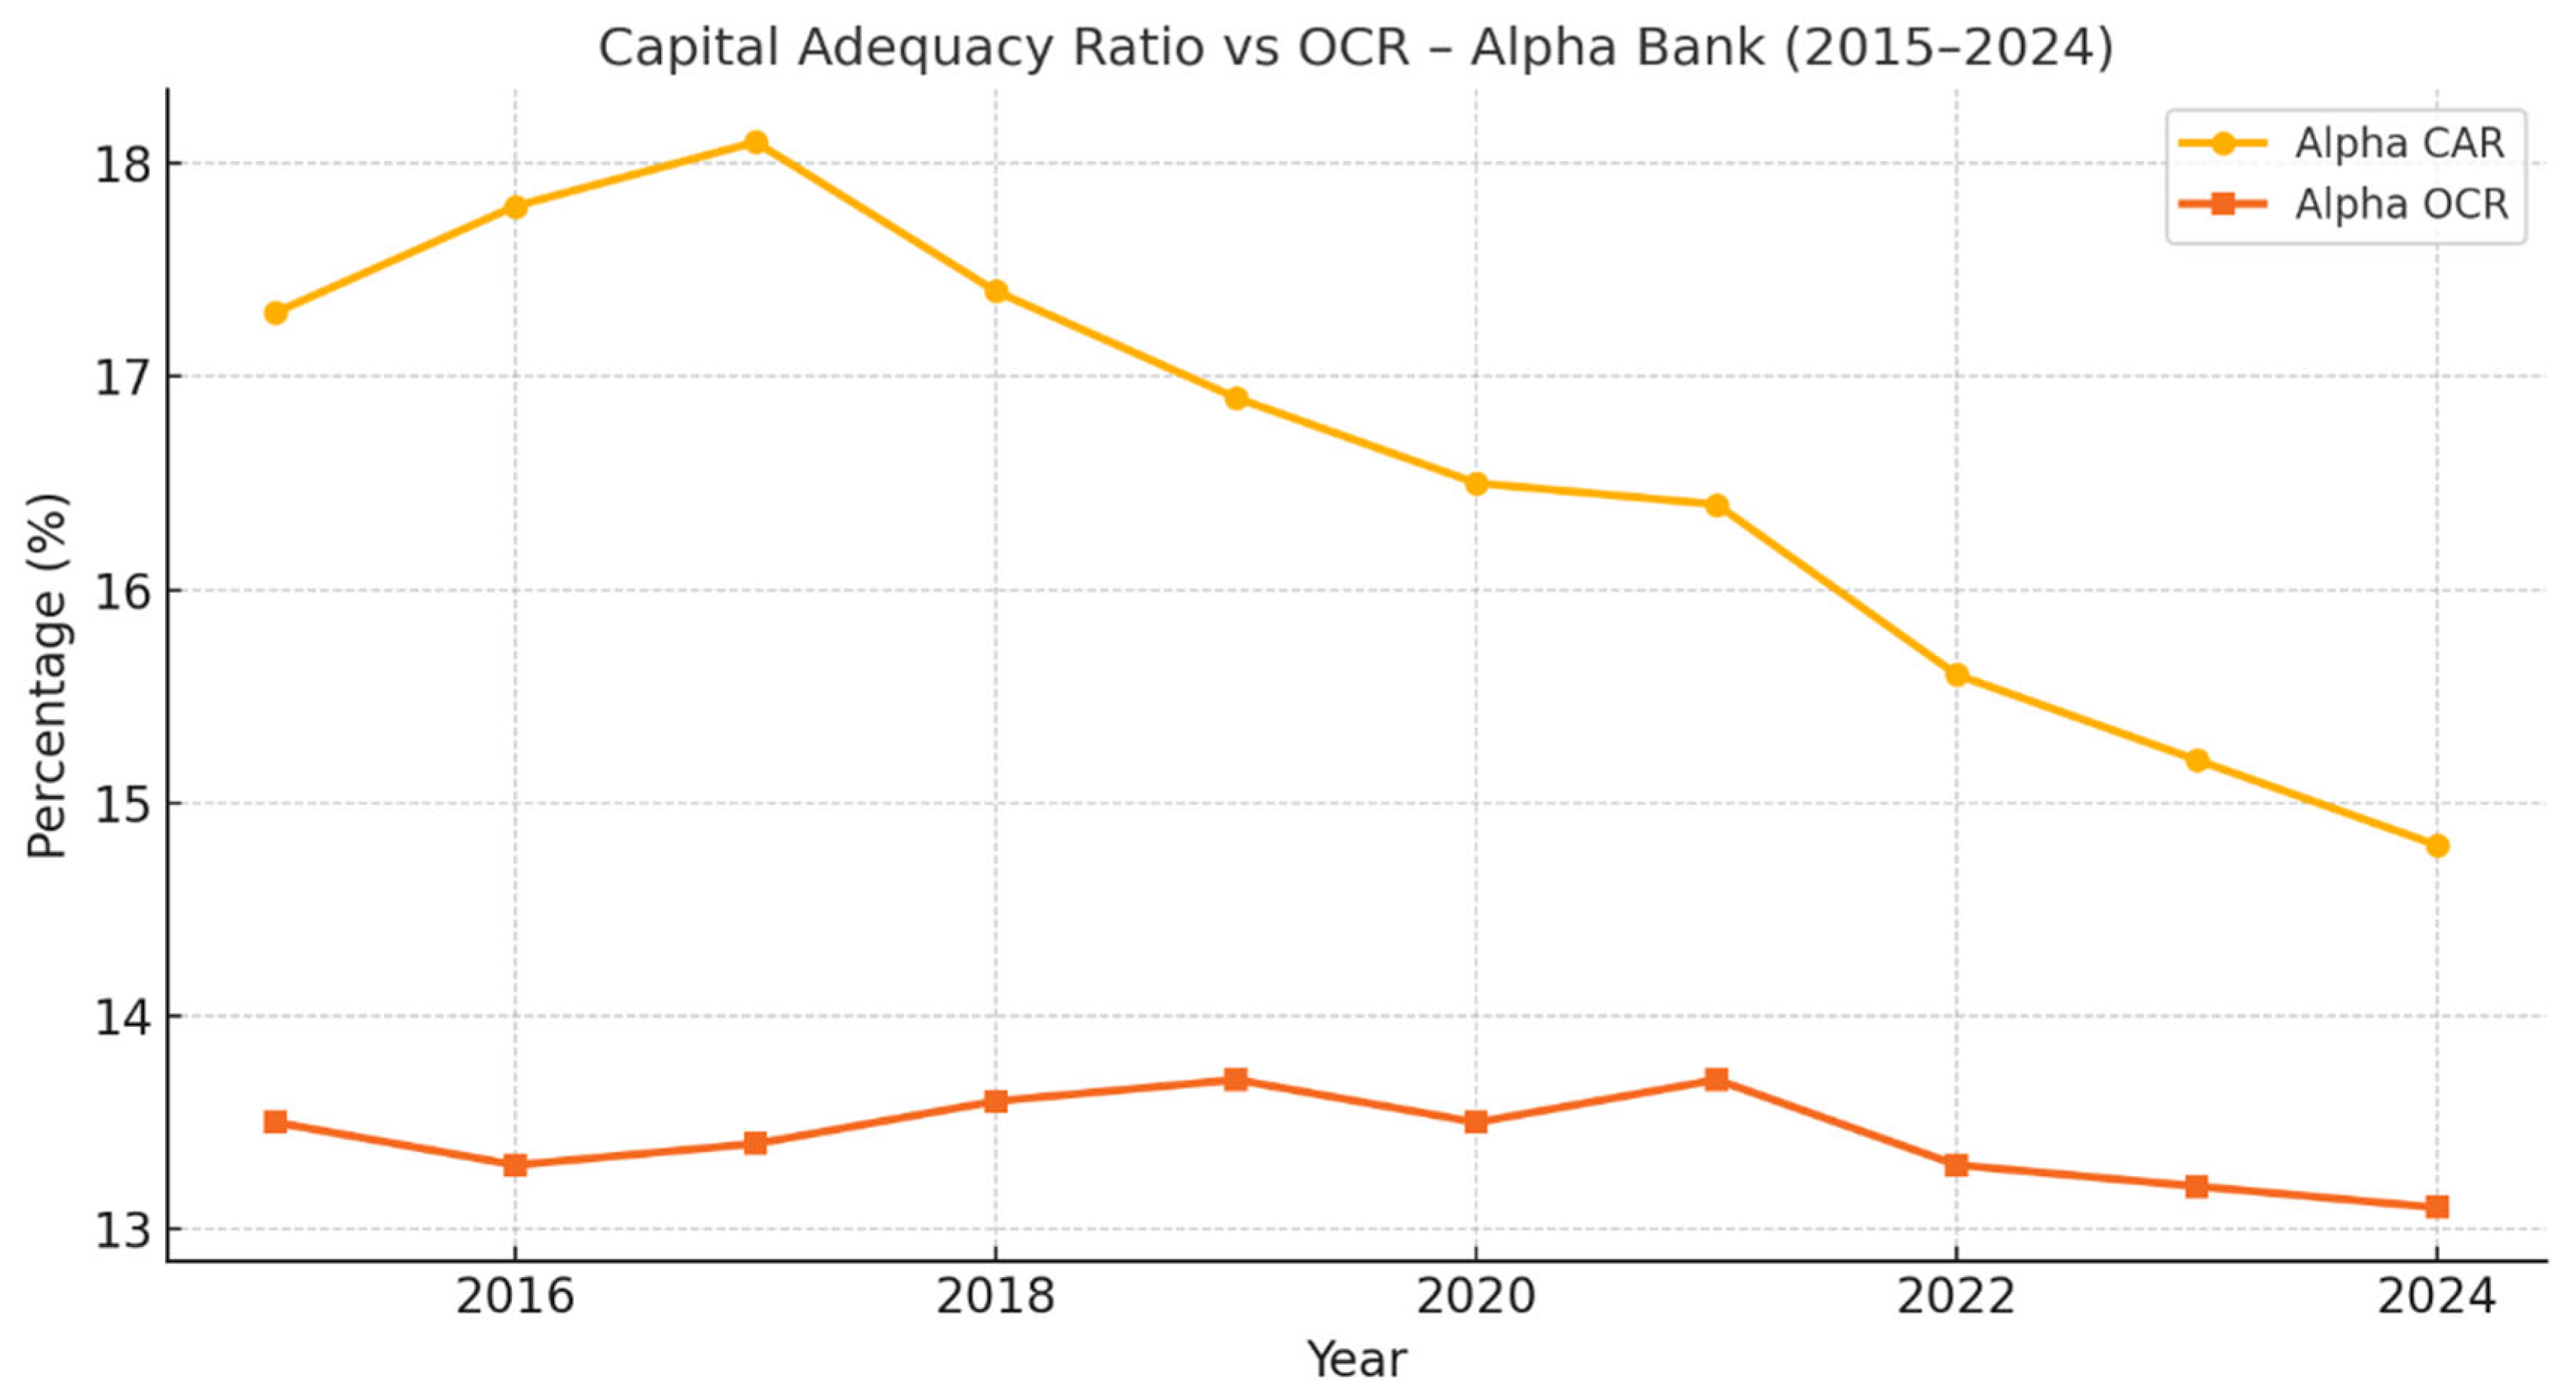
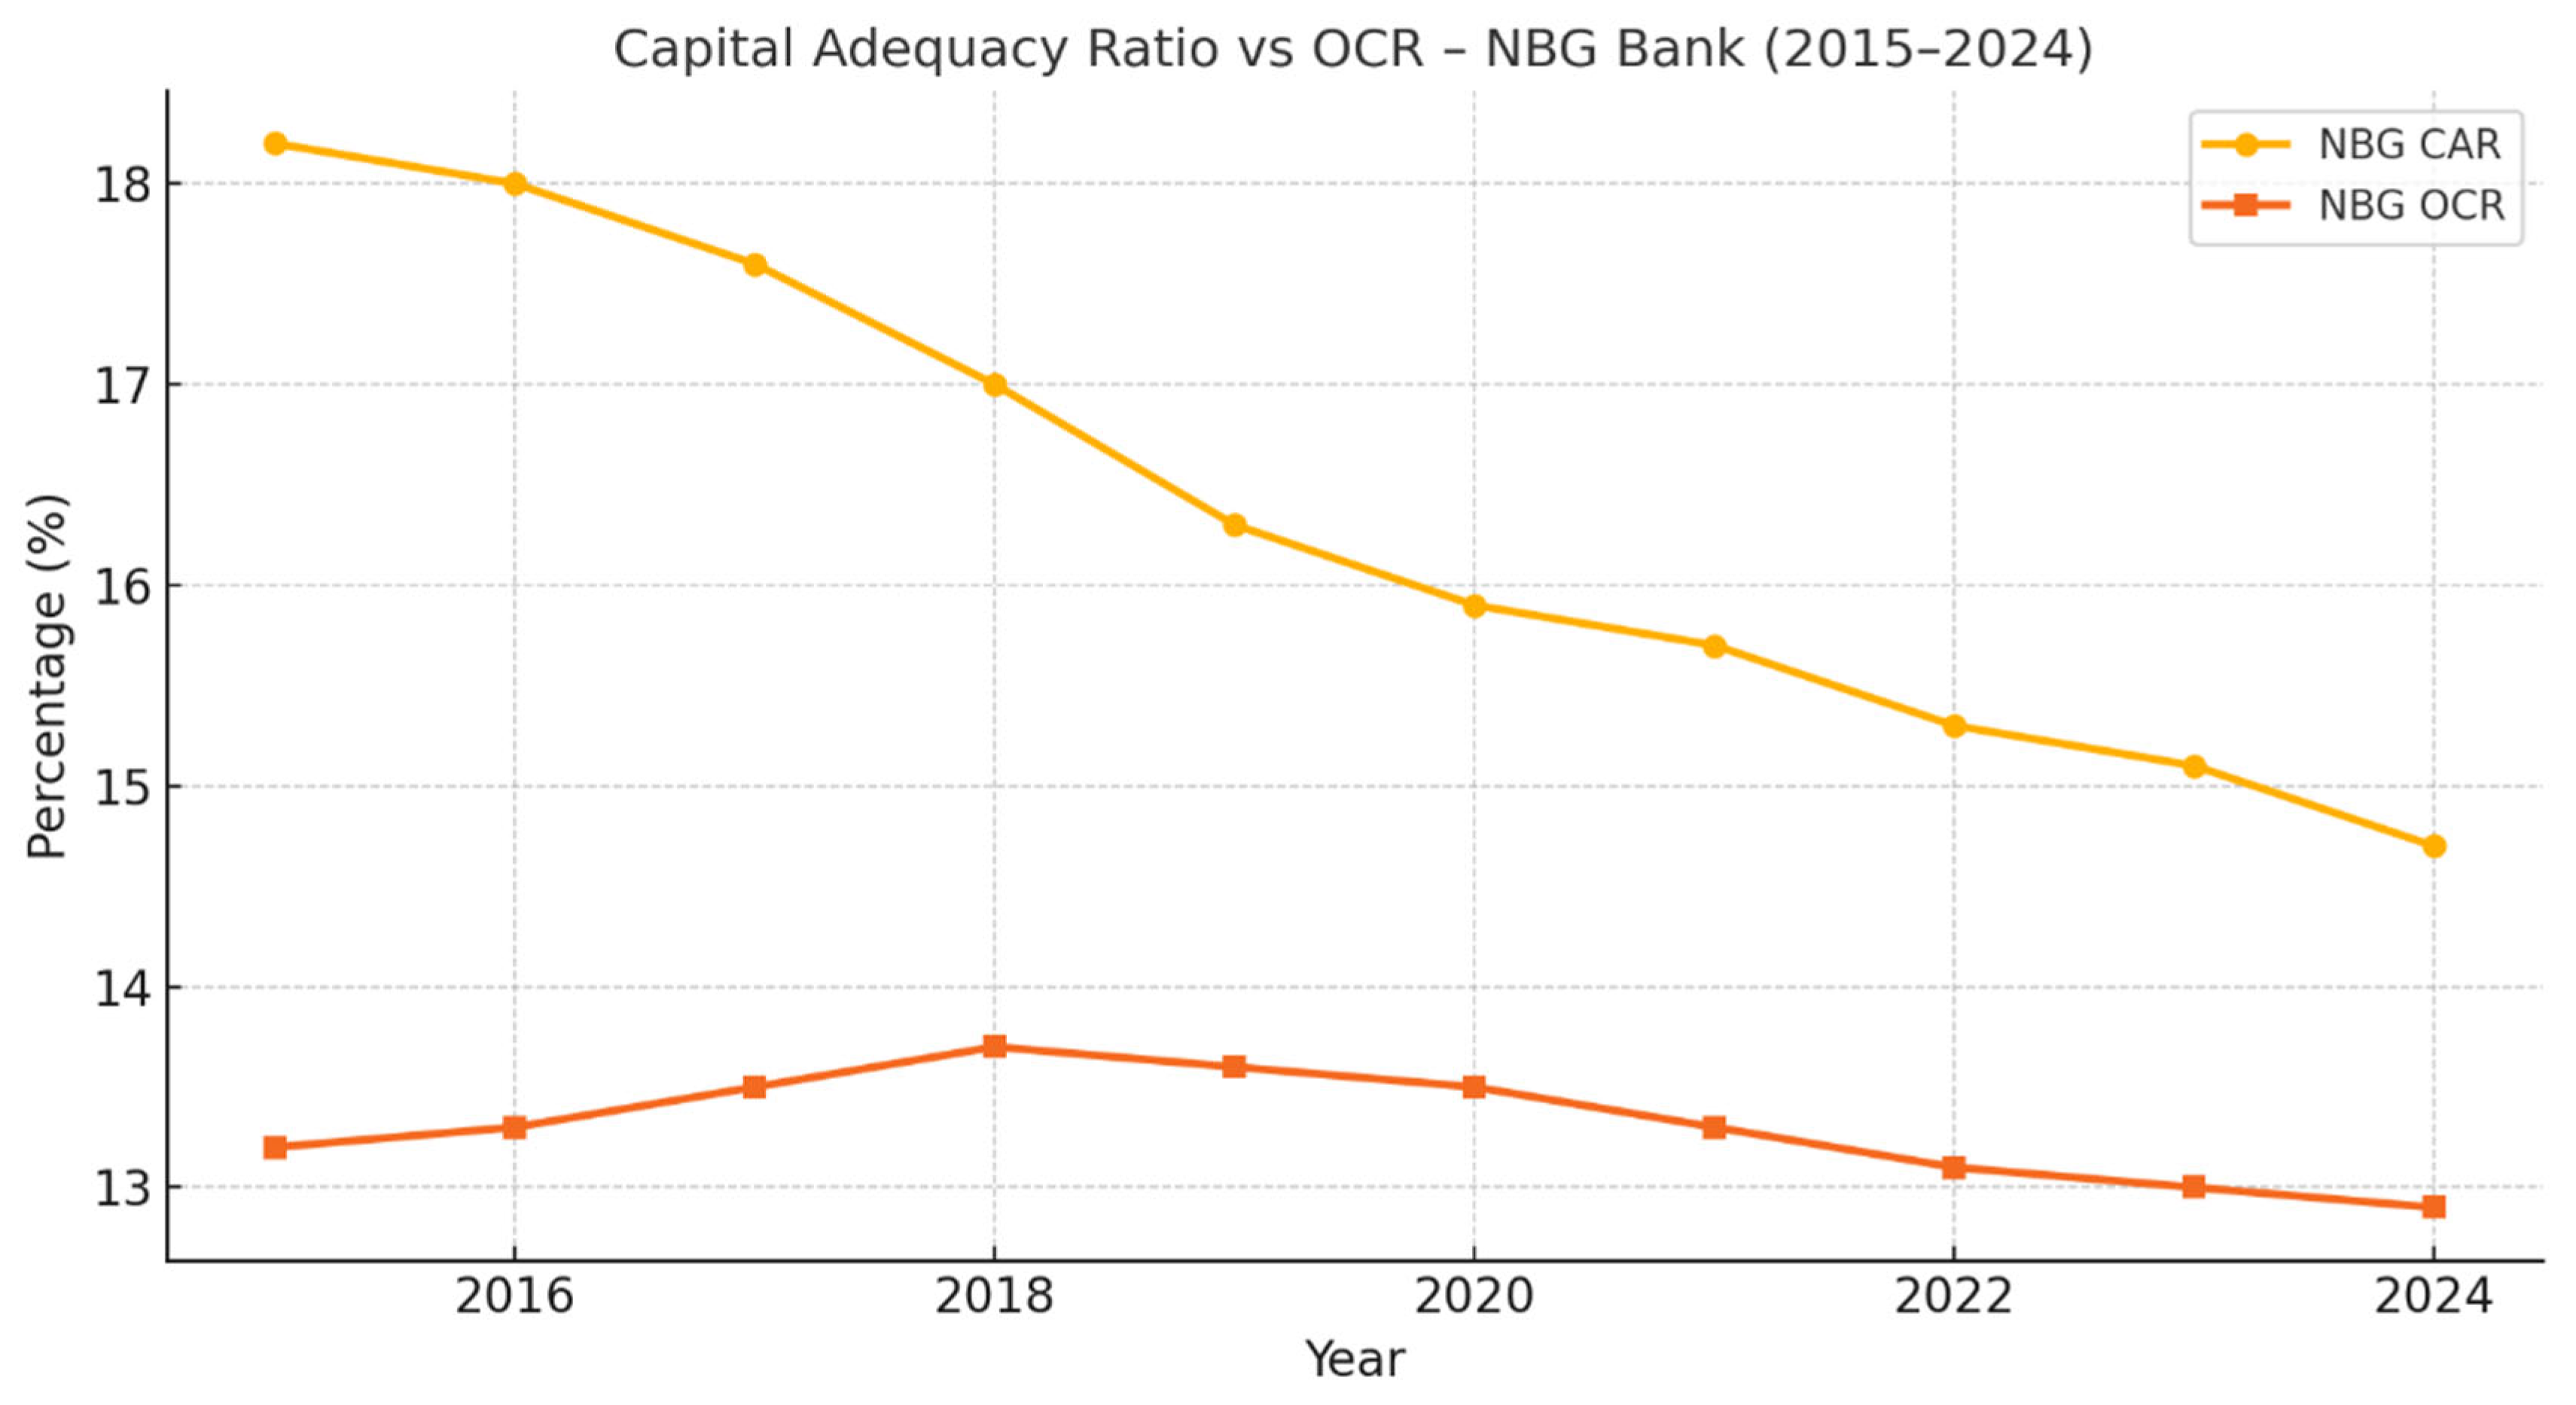
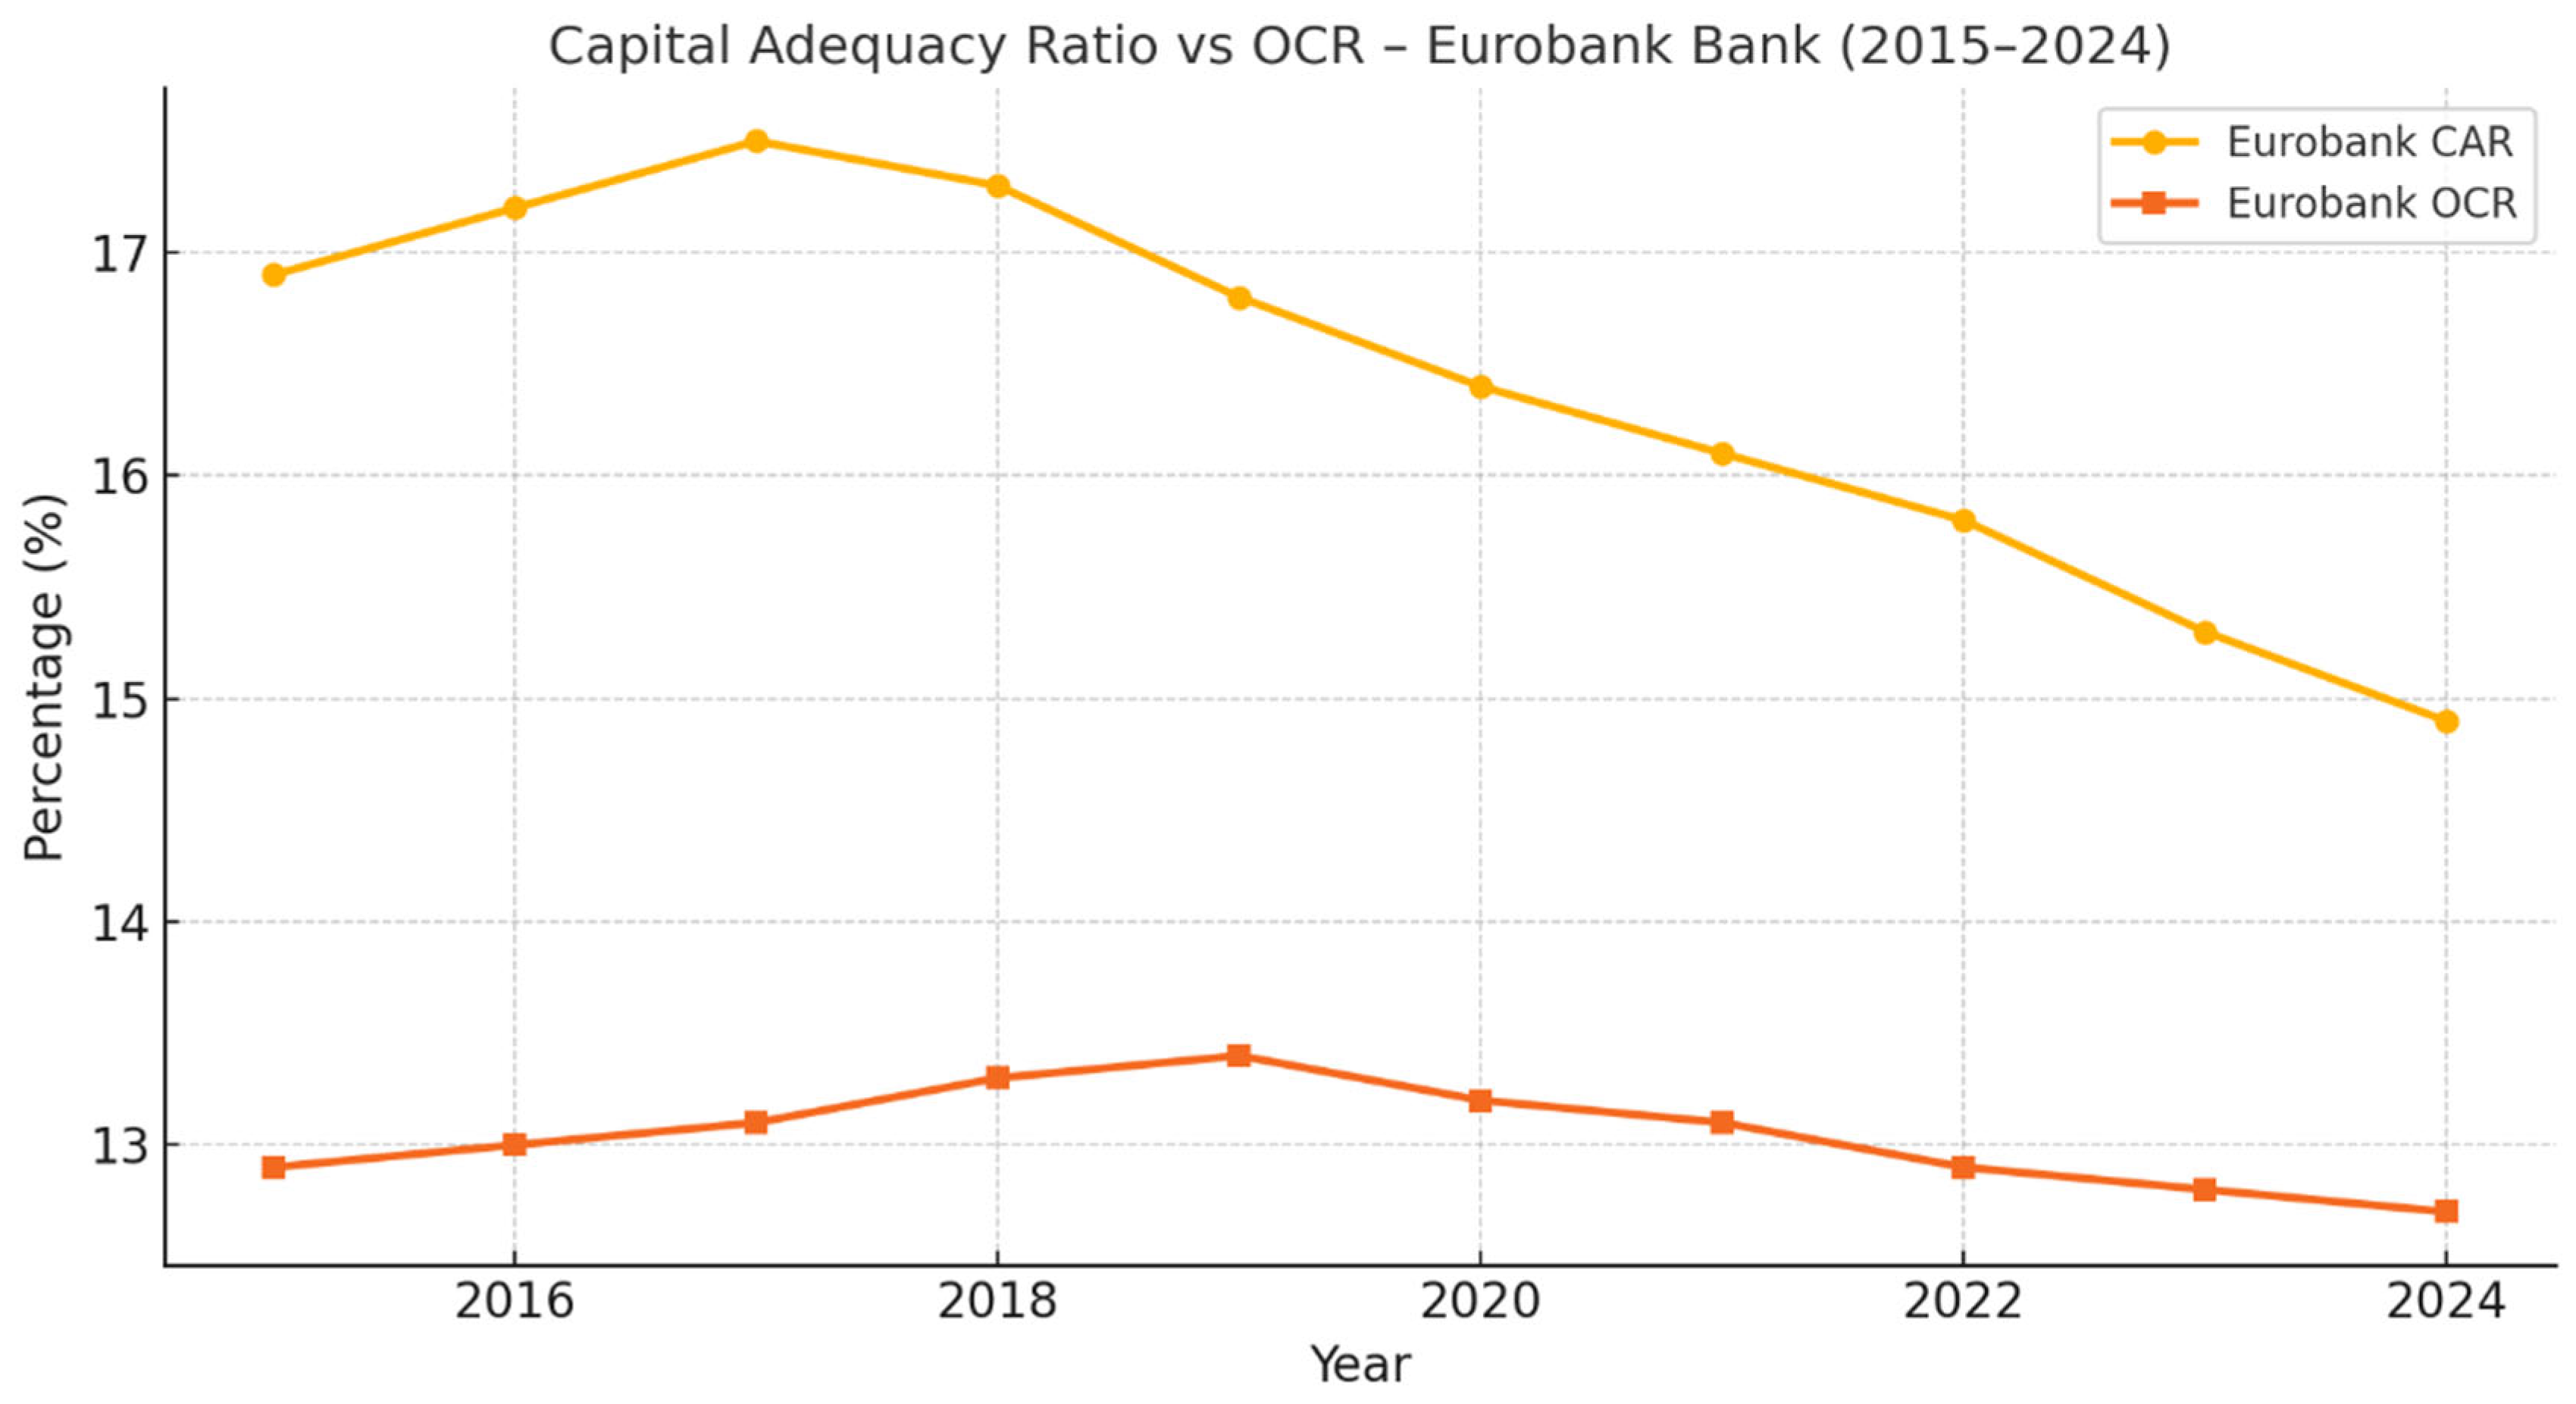
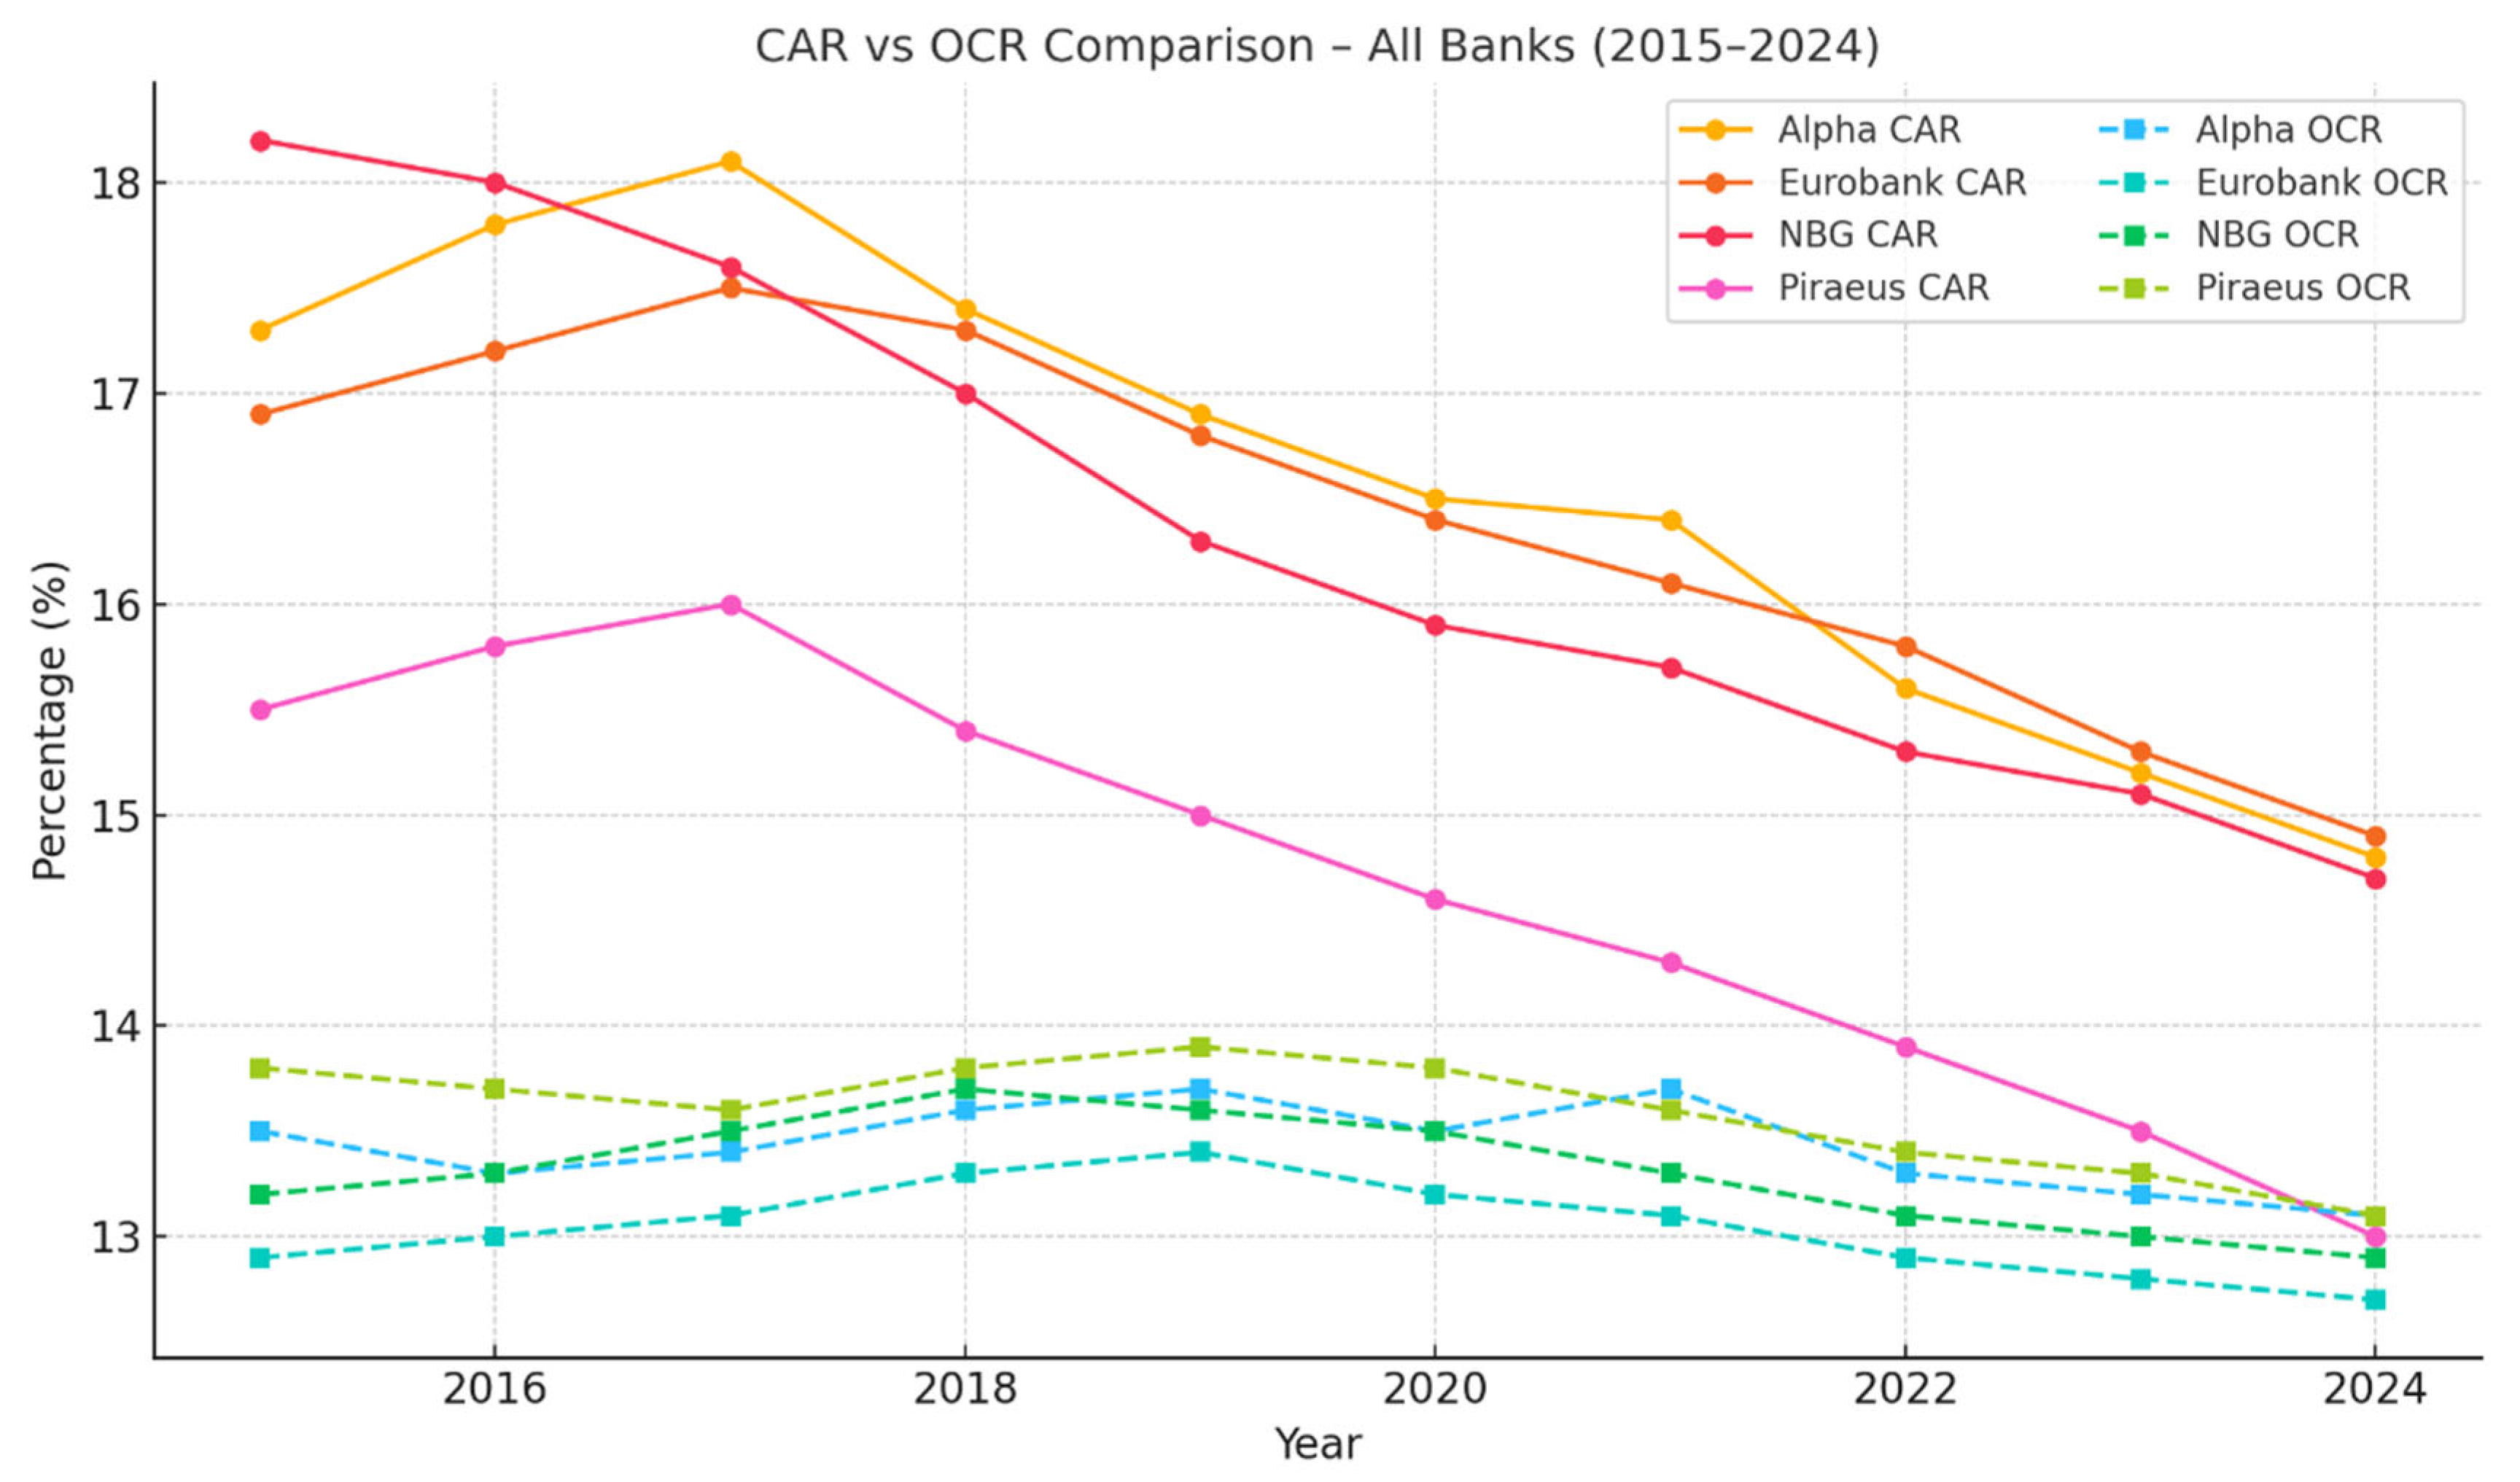
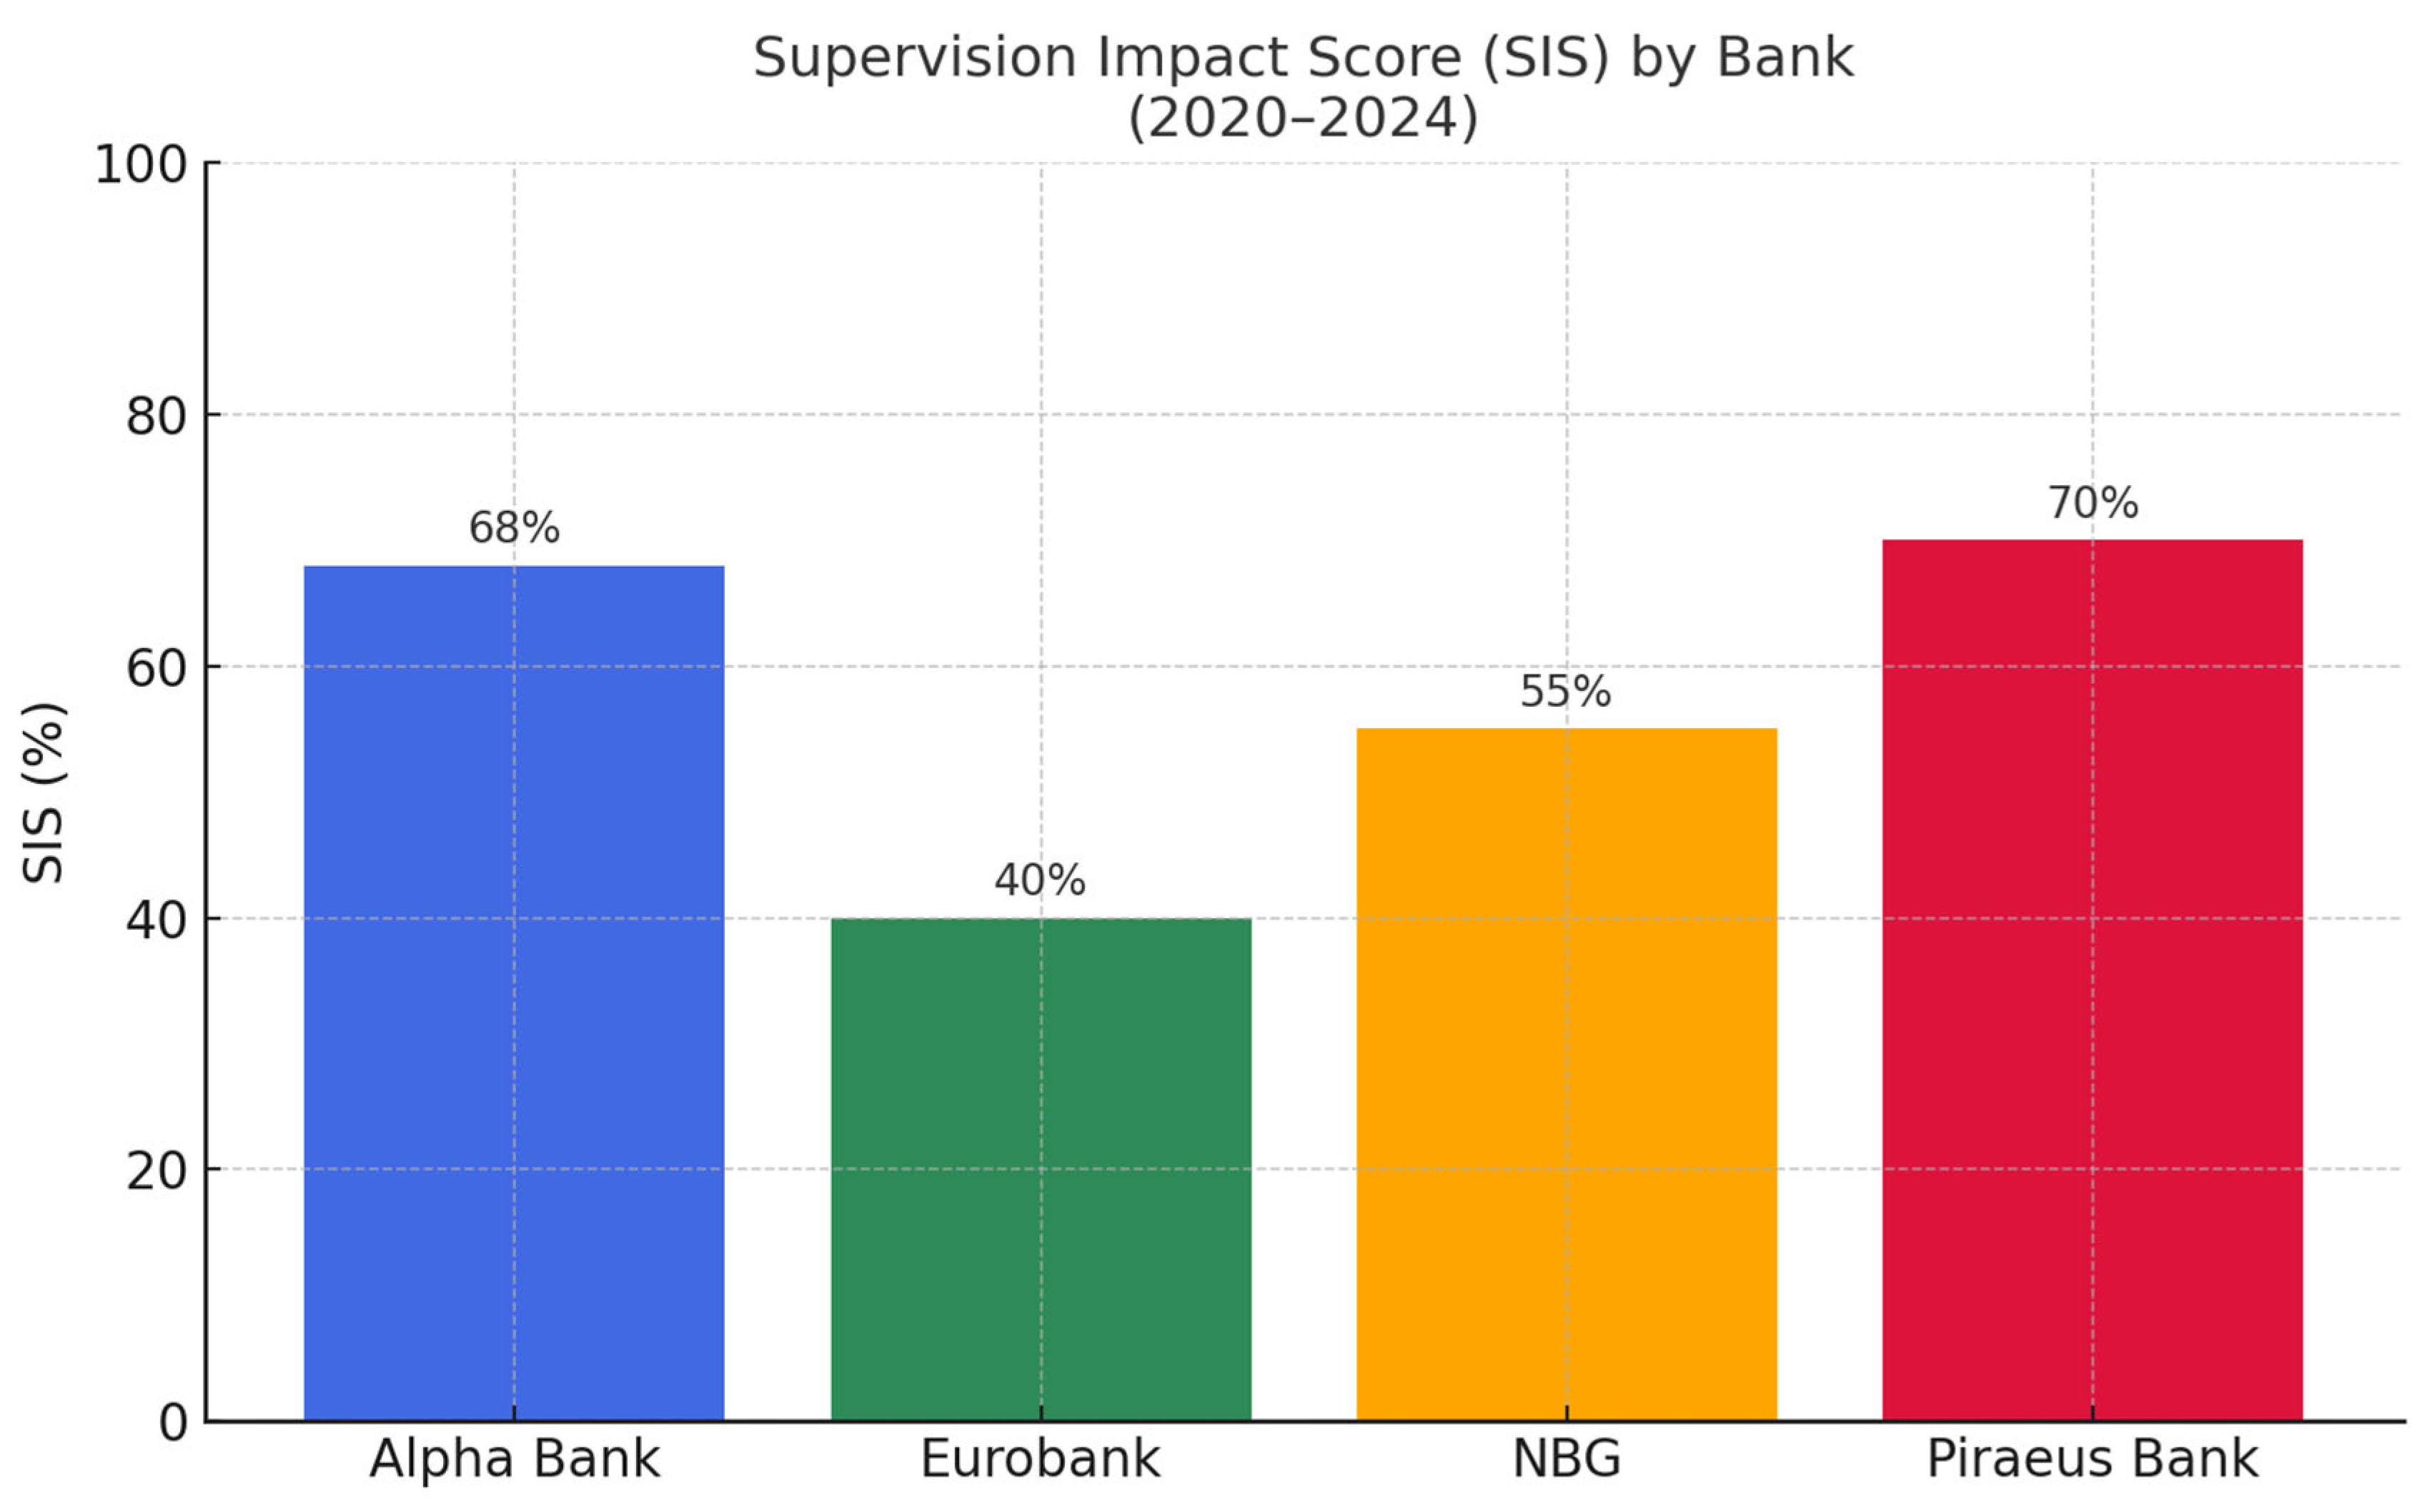
Disclaimer/Publisher’s Note: The statements, opinions and data contained in all publications are solely those of the individual author(s) and contributor(s) and not of MDPI and/or the editor(s). MDPI and/or the editor(s) disclaim responsibility for any injury to people or property resulting from any ideas, methods, instructions or products referred to in the content. |
© 2025 by the authors. Licensee MDPI, Basel, Switzerland. This article is an open access article distributed under the terms and conditions of the Creative Commons Attribution (CC BY) license (https://creativecommons.org/licenses/by/4.0/).