
Innovation over ESG Performance? The Trade-Offs of STEM Leadership in Top Sustainable Firms


Abstract
1. Introduction
2. Literature Review and Hypothesis Development
2.1. STEM-Educated CEO
2.2. Sustainalytics’ ESG Performance
2.3. Theoretical Framework and Hypothesis Development
3. Research Methodology
3.1. Sample Selection
3.2. Variable Definition and Measurement
3.3. Model Specification
4. Findings and Discussions
4.1. Descriptive Statistics and Correlation Analysis
4.2. Baseline Regression Analysis
4.3. Robustness Test
4.4. Additional Analysis
4.4.1. Early-Adopter Countries
4.4.2. Developed and Developing Countries
4.4.3. CEO’s Gender
5. Conclusions
Author Contributions
Funding
Institutional Review Board Statement
Informed Consent Statement
Data Availability Statement
Conflicts of Interest
References
- Aabo, T., & Cristina, I. (2022). Do female CEOs matter for ESG scores? Global Finance Journal, 56, 100722. [Google Scholar]
- Adomako, S., & Tran, M. D. (2022). Environmental collaboration, responsible innovation, and firm performance: The moderating role of stakeholder pressure. Business Strategy and the Environment, 31(4), 1695–1704. [Google Scholar] [CrossRef]
- Aguilera, R. V., Aragón-Correa, J. A., Marano, V., & Tashman, P. A. (2021). The corporate governance of environmental sustainability: A review and proposal for more integrated research. Journal of Management, 47(6), 1468–1497. [Google Scholar] [CrossRef]
- Alderman, J., Forsyth, J., Griffy-Brown, C., & Walton, R. C. (2022). The benefits of hiring a STEM CEO: Decision making under innovation and real options. Technology in Society, 71, 102064. [Google Scholar] [CrossRef]
- Aryani, Y. A., Santoso, A., Gantyowati, E., Setiawan, D., & Susanto, K. P. (2025). Does educational background of chief executive officers influence impression management? Cogent Business and Management, 12(1), 2442094. [Google Scholar] [CrossRef]
- BBC. (2023, November 15). How “ESG” came to mean everything and nothing. BBC. Available online: https://www.bbc.com/worklife/article/20231114-how-esg-came-to-mean-everything-and-nothing (accessed on 3 June 2025).
- Borralho, J. M., Hernández-Linares, R., Gallardo-Vázquez, D., & Choban de Sousa Paiva, I. (2022). Environmental, social and governance disclosure’s impacts on earnings management: Family versus non-family firms. Journal of Cleaner Production, 379, 134603. [Google Scholar] [CrossRef]
- Cahyono, S., Ardianto, A., & Nasih, M. (2024). Breaking barriers: CEOs STEM educational background and corporate climate change disclosure. International Journal of Accounting and Information Management, 32(4), 651–684. [Google Scholar] [CrossRef]
- Charlin, V., Cifuentes, A., & Alfaro, J. (2022). ESG ratings: An industry in need of a major overhaul. Journal of Sustainable Finance and Investment, 14(1), 1037–1055. [Google Scholar] [CrossRef]
- Chen, C.-D., Su, C.-H., & Chen, M.-H. (2022). Understanding how ESG-focused airlines reduce the impact of the COVID-19 pandemic on stock returns. Journal of Air Transport Management, 102, 102229. [Google Scholar] [CrossRef]
- Daugaard, D., & Ding, A. (2022). Global Drivers for ESG Performance: The Body of Knowledge. Sustainability, 14(4), 2322. [Google Scholar] [CrossRef]
- De Silva, L. G. R. V., & Banda, Y. K. W. (2022). Impact of CEO characteristics on capital structure: Evidence from a frontier market. Asian Journal of Business and Accounting, 15(1), 71–101. [Google Scholar] [CrossRef]
- Eccles, R. G., & Serafeim, G. (2013). The performance frontier: Innovating for a sustainable strategy. Harvard Business Review, 91(5). Available online: https://hbr.org/2013/05/the-performance-frontier-innovating-for-a-sustainable-strategy (accessed on 10 April 2025).
- E-Vahdati, S., & Binesh, F. (2022). The impact of CEO’s attributes on R&D intensity and ESG practices. Revista Espanola de Financiacion y Contabilidad, 51(3), 326–349. [Google Scholar] [CrossRef]
- Garcia-Blandon, J., Argilés-Bosch, J. M., & Ravenda, D. (2019). Exploring the relationship between CEO characteristics and performance. Journal of Business Economics and Management, 20(6), 1064–1082. [Google Scholar] [CrossRef]
- Hambrick, D. C., & Mason, P. A. (1984). Upper echelons: The organization as a reflection of its top managers. Academy of Management Review, 9(2), 193–206. [Google Scholar] [CrossRef]
- Harymawan, I., Putra, F. K. G., Fianto, B. A., & Wan Ismail, W. A. (2021). Financially distressed firms: Environmental, social, and governance reporting in indonesia. Sustainability, 13(18), 10156. [Google Scholar] [CrossRef]
- Harymawan, I., Rahayu, N. K., Kamarudin, K. A., Wan Ismail, W. A., & Ratri, M. C. (2023). CEO busyness and investment efficiency: Evidence from Indonesia. Journal of Financial Reporting and Accounting. ahead-of-print. [Google Scholar] [CrossRef]
- Heckman, J. J. (1979). Sample selection bias as a specification error. Econometrica, 47(1), 153–161. [Google Scholar] [CrossRef]
- Hrazdil, K., Mahmoudian, F., & Nazari, J. A. (2021). Executive personality and sustainability: Do extraverted chief executive officers improve corporate social responsibility? Corporate Social Responsibility and Environmental Management, 28(6), 1564–1578. [Google Scholar] [CrossRef]
- Hsieh, T. S., Kim, J. B., Wang, R. R., & Wang, Z. (2022). Educate to innovate: STEM directors and corporate innovation. Journal of Business Research, 138, 229–238. [Google Scholar] [CrossRef]
- Iamandi, I. E., Constantin, L. G., Munteanu, S. M., & Cernat-Gruici, B. (2019). Mapping the ESG behavior of European companies. A holistic Kohonen approach. Sustainability, 11(12), 3276. [Google Scholar] [CrossRef]
- Jaggia, S., & Thosar, S. (2021). CEO management style: Does educational background play a role? Managerial Finance, 47(10), 1465–1485. [Google Scholar] [CrossRef]
- Jaggia, S., & Thosar, S. (2024). Internal versus external CEO hires: Key differences. Managerial Finance, 50(11), 1920–1933. [Google Scholar] [CrossRef]
- Jámbor, A., & Zanócz, A. (2023). The diversity of environmental, social, and governance aspects in sustainability: A systematic literature review. Sustainability, 15(18), 13958. [Google Scholar] [CrossRef]
- Justina, D., & Lantara, I. W. N. (2023). Governance mechanism to improve sustainability report quality: The impact on information risk and stock market participation. International Journal of Quality and Reliability Management, 41(5), 1253–1269. [Google Scholar] [CrossRef]
- Khan, M. (2019). Corporate Governance, ESG, and Stock Returns around the World. Financial Analysts Journal, 75(4), 103–123. [Google Scholar] [CrossRef]
- Khandelwal, V., Sharma, P., & Chotia, V. (2023). ESG disclosure and firm performance: An asset-pricing approach. Risks, 11(6), 112. [Google Scholar] [CrossRef]
- Kind, F. L., Zeppenfeld, J., & Lueg, R. (2023). The impact of chief executive officer narcissism on environmental, social, and governance reporting. Business Strategy and the Environment, 32(7), 4448–4466. [Google Scholar] [CrossRef]
- Kiron, D., Kruschwitz, N., Haanaes, K., Reeves, M., & Goh, E. (2013). The innovation bottom line. MIT Sloan Management Review. Available online: https://sloanreview.mit.edu/projects/the-innovation-bottom-line/ (accessed on 3 June 2025).
- Kong, D., Liu, B., & Zhu, L. (2023). Stem CEOs and firm digitalization. Finance Research Letters, 58, 104573. [Google Scholar] [CrossRef]
- KPMG. (2024). The move to mandatory reporting: Executive summary. 139728-G (pp. 1–19). Available online: https://kpmg.com/xx/en/our-insights/esg/the-move-to-mandatory-reporting.html (accessed on 3 June 2025).
- Kutzschbach, J., Peetz, I., Tanikulova, P., & Willers, K. (2020). How CEO’ s education impacts CSR performance—An empirical analysis of publicly listed companies in Germany. Management Studies, 10(3), 50–63. [Google Scholar]
- Lazareva, E. (2022). Do CEO Behavior biases and personal traits influence ESG performance? The evidence from emerging capital market of Russia. Journal of Corporate Finance Research, 16(4), 72–92. [Google Scholar] [CrossRef]
- Li, Z., & Jia, J. (2022). Effect of mandatory sustainability disclosure announcements: Cross-country evidence. Pacific Accounting Review, 34(1), 127–155. [Google Scholar] [CrossRef]
- Liu, Y., Zhang, F., & Zhang, H. (2023). CEO foreign experience and corporate environmental, social, and governance (ESG) performance. Business Strategy and the Environment, 33(4), 3331–3355. [Google Scholar] [CrossRef]
- Lozano, R. (2015). A holistic perspective on corporate sustainability drivers. Corporate Social Responsibility and Environmental Management, 22(1), 32–44. [Google Scholar] [CrossRef]
- Madison, N., & Schiehll, E. (2021). The Effect of Financial Materiality on ESG Performance Assessment. Sustainability, 13(7), 3652. [Google Scholar] [CrossRef]
- Mandas, M., Lahmar, O., Piras, L., & De Lisa, R. (2023). ESG in the financial industry: What matters for rating analysts? Research in International Business and Finance, 66, 102045. [Google Scholar] [CrossRef]
- Martínez-Martínez, V., Ortiz-Revilla, J., Brasca Merlin, A., Sammaritano, M., Molina, R., López, M., & Greca, I. M. (2024). Sustainability education in geomatics students: Nature of STEM through meteorology and ecology of fire. Sustainability, 16(24), 11208. [Google Scholar] [CrossRef]
- Minh Ha, N., Ha, T. T. M., & Vuong, P. M. (2021). The effect of CEO characteristics on financial leverage: Findings from listed companies in Vietnam. Cogent Business and Management, 8(1), 2002129. [Google Scholar] [CrossRef]
- Mohammad, W. M. W., & Wasiuzzaman, S. (2021). Environmental, Social and Governance (ESG) disclosure, competitive advantage and performance of firms in Malaysia. Cleaner Environmental Systems, 2, 100015. [Google Scholar] [CrossRef]
- Mooneeapen, O., Abhayawansa, S., & Mamode Khan, N. (2022). The influence of the country governance environment on corporate environmental, social and governance (ESG) performance. Sustainability Accounting, Management and Policy Journal, 13(4), 953–985. [Google Scholar] [CrossRef]
- Naaman, C., & Sun, L. (2022). CEO power and R&D investment. Accounting Research Journal, 35(2), 160–177. [Google Scholar] [CrossRef]
- Nawaz, T. (2022). What’s in an education? Implications of CEO education for financial inclusion. International Journal of Finance and Economics, 27(3), 3741–3753. [Google Scholar] [CrossRef]
- Octavio, M. F. R., Setiawan, D., Aryani, Y. A., & Arifin, T. (2025). Corporate governance as a driver: Enhancing ESG performance in ASEAN companies. Business Strategy and Development, 8(12), e70104. [Google Scholar] [CrossRef]
- Paramayuda, A. A. R., Hashim, U. J., & Harymawan, I. (2025). STEM CEOs and tax avoidance: Evidence from top sustainable companies. Journal of Financial Reporting and Accounting. ahead-of-print. [Google Scholar] [CrossRef]
- Pulino, S. C., Ciaburri, M., Magnanelli, B. S., & Nasta, L. (2022). Does ESG disclosure influence firm performance? Sustainability, 14(13), 7595. [Google Scholar] [CrossRef]
- Putra, A. A., & Setiawan, D. (2024). Do CEO characteristics affect earnings management? Corporate Governance, 24(5), 1137–1155. [Google Scholar] [CrossRef]
- Reifman, A., & Garrett, K. (2010). Winsorize. In Encyclopedia of research design. SAGE Publications, Inc. [Google Scholar] [CrossRef]
- Rizki, A., Ningsih, S., Ekasari, W. F., Putri, F. V., Aini, S. N., & Nowland, J. (2024). The impact of STEM CEO on investment efficiency: Evidence from Indonesia. Cogent Business and Management, 11(1), 2429800. [Google Scholar] [CrossRef]
- Rodríguez-Becerra, J., & Pernaa, J. (2023). Editorial: Computational science and STEM education. Frontiers in Education, 8, 1130133. [Google Scholar] [CrossRef]
- Roos, J. (2015). Build STEM skills, but Don’t neglect the humanities. Harvard Business Review. Available online: https://hbr.org/2015/06/build-stem-skills-but-dont-neglect-the-humanities (accessed on 24 May 2025).
- Saha, R., Kabir, M. N., & Chowdhury, A. H. (2023). The impact of CEO attributes on sustainability performance: Evidence from an emerging economy. Accounting Research Journal, 36(6), 539–557. [Google Scholar] [CrossRef]
- Setiawan, D., Harymawan, I., Adhariani, D., Pratama, F. A. F., & Santoso, A. (2024). Does the leverage of a company differ when led by a CEO from a reputable university? Journal of Open Innovation: Technology, Market, and Complexity, 10(2), 100310. [Google Scholar] [CrossRef]
- Shao, D., Zhao, S., Wang, S., & Jiang, H. (2020). Impact of ceos’ academic work experience on firms’ innovation output and performance: Evidence from chinese listed companies. Sustainability, 12(18), 7442. [Google Scholar] [CrossRef]
- Shu, Y., Zhuang, X., Ying, R., & Xu, G. (2024). Formal institutional pressure and the integration of corporate environmental and financial performance: Empirical evidence from listed companies in heavily polluting industries in China. Sustainability, 16(6), 2471. [Google Scholar] [CrossRef]
- Siepel, J., Camerani, R., & Masucci, M. (2021). Skills combinations and firm performance. Small Business Economics, 56(4), 1425–1447. [Google Scholar] [CrossRef]
- S&P Global. (2023). Studying the STEM education gap among CEOs globally. Available online: https://www.spglobal.com/en/research-insights/special-reports/studying-the-stem-education-gap-among-ceos-globally (accessed on 24 May 2025).
- Truant, E., Borlatto, E., Crocco, E., & Bhatia, M. (2023). ESG performance and technological change: Current state-of-the-art, development and future directions. Journal of Cleaner Production, 429, 139493. [Google Scholar] [CrossRef]
- Visnjic, I., Monteiro, F., & Tushman, M. (2025). Sustainability as a business-model transformation. Harvard Business Review. Available online: https://hbr.org/2025/05/sustainability-as-a-business-model-transformation (accessed on 10 April 2025).
- Wagner, A., & Fischer-kreer, D. (2024). The role of CEO regulatory focus in increasing or reducing corporate carbon emissions. Business Strategy and the Environment, 33(2), 1051–1065. [Google Scholar] [CrossRef]
- Wagner, M. (2010). Corporate social performance and innovation with high social benefits: A quantitative analysis. Journal of Business Ethics, 94(4), 581–594. [Google Scholar] [CrossRef]
- Walter, I. (2020). Sense and nonsense in ESG ratings. Journal of Law, Finance, and Accounting, 5(2), 307–336. [Google Scholar] [CrossRef]
- White, A. L. (2015). Why sustainability ratings matter. MIT Sloan Management Review. Available online: https://sloanreview.mit.edu/article/why-sustainability-ratings-matter/ (accessed on 10 April 2025).
- World Economic Forum. (2023). Here’s why we must not lose sight of the importance of ESG, despite the recent backlash. Available online: https://www.weforum.org/stories/2023/01/the-importance-of-esg-sustainable-future-davos-2023/ (accessed on 3 June 2025).
- Xu, J., Liu, F., & Shang, Y. (2021). R&D investment, ESG performance and green innovation performance: Evidence from China. Kybernetes, 50(3), 737–756. [Google Scholar] [CrossRef]
- Xu, L. (2024). CEO greed and corporate tax avoidance. Journal of Strategy and Management, 17(1), 41–58. [Google Scholar] [CrossRef]
- Xu, Z., & Hou, J. (2021). Effects of ceo overseas experience on corporate social responsibility: Evidence from chinese manufacturing listed companies. Sustainability, 13(10), 5335. [Google Scholar] [CrossRef]
- Yang, F., & Li, X. (2023). Corporate financialization, ESG performance and sustainability development: Evidence from Chinese-listed companies. Sustainability, 15(4), 2978. [Google Scholar] [CrossRef]
- Yao, L. (2023). Discussion of busy CEO and financial statement footnotes readability: Evidence from Indonesia. Asian Review of Accounting, 32(4), 549–553. [Google Scholar] [CrossRef]
- Yi, Y., Chen, Y., & He, X. (2021). CEO leadership, strategic decision comprehensiveness, and firm performance: The moderating role of tmt cognitive conflict. Management and Organization Review, 18, 131–166. [Google Scholar] [CrossRef]
- Zaman, U., Nawaz, S., & Nadeem, R. D. (2020). Navigating innovation success through projects. Role of CEO transformational leadership, project management best practices, and project management technology quotient. Journal of Open Innovation: Technology, Market, and Complexity, 6(4), 168. [Google Scholar] [CrossRef]
- Zhang, X., Zhao, Q., Li, W., & Yu, W. (2023). Top management teams’ foreign experience, environmental regulation, and firms’ green innovation. Business Ethics, the Environment and Responsibility, 32(2), 819–835. [Google Scholar] [CrossRef]
- Zioło, M., Bąk, I., & Spoz, A. (2023). Incorporating ESG risk in companies’ business models: State of research and energy sector case studies. Energies, 16(4), 1809. [Google Scholar] [CrossRef]
- Zizka, L., McGunagle, D. M., & Clark, P. J. (2021). Sustainability in science, technology, engineering and mathematics (STEM) programs: Authentic engagement through a community-based approach. Journal of Cleaner Production, 279, 123715. [Google Scholar] [CrossRef]

| Description | Total |
|---|---|
| Top-rated Listed companies rated by Sustainalytics in 2022 | 2045 observations |
| Less: | |
| Missing data: STEM | 520 observations |
| Missing data: CEOAGE | 228 observations |
| Missing data: FSIZE | 65 observations |
| Missing data: BSIZE | 85 observations |
| Missing data: FAGE | 30 observations |
| Missing data: ROA | 27 observations |
| Missing data: LIQUIDITY | 51 observations |
| Final Sample | 1039 observations |
| Panel A: Data Tabulation of STEM CEO across industry | |||||||
| Industry | non-STEM | STEM | Total | ||||
| N | % | N | % | N | % | ||
| 1 | Precious Metals | 1 | 17% | 5 | 83% | 6 | 100% |
| 2 | Homebuilders | 1 | 20% | 4 | 80% | 5 | 100% |
| 3 | Semiconductors | 7 | 23% | 24 | 77% | 31 | 100% |
| 4 | Technology Hardware | 43 | 39% | 68 | 61% | 111 | 100% |
| 5 | Paper and Forestry | 2 | 40% | 3 | 60% | 5 | 100% |
| 6 | Software and Services | 54 | 46% | 63 | 54% | 117 | 100% |
| 7 | Machinery | 9 | 47% | 10 | 53% | 19 | 100% |
| 8 | Utilities | 9 | 50% | 9 | 50% | 18 | 100% |
| 9 | Chemicals | 7 | 50% | 7 | 50% | 14 | 100% |
| 10 | Electrical Equipment | 7 | 50% | 7 | 50% | 14 | 100% |
| 11 | Construction and Engineering | 2 | 50% | 2 | 50% | 4 | 100% |
| 12 | Oil and Gas Producers | 1 | 50% | 1 | 50% | 2 | 100% |
| 13 | Containers and Packaging | 9 | 53% | 8 | 47% | 17 | 100% |
| 14 | Traders and Distributors | 9 | 53% | 8 | 47% | 17 | 100% |
| 15 | Pharmaceuticals | 19 | 54% | 16 | 46% | 35 | 100% |
| 16 | Building Products | 7 | 58% | 5 | 42% | 12 | 100% |
| 17 | Healthcare | 29 | 63% | 17 | 37% | 46 | 100% |
| 18 | Auto Components | 19 | 63% | 11 | 37% | 30 | 100% |
| 19 | Energy Services | 2 | 67% | 1 | 33% | 3 | 100% |
| 20 | Real Estate | 78 | 68% | 36 | 32% | 114 | 100% |
| 21 | Food Retailers | 11 | 69% | 5 | 31% | 16 | 100% |
| 22 | Telecommunication Services | 12 | 75% | 4 | 25% | 16 | 100% |
| 23 | Consumer Durables | 33 | 80% | 8 | 20% | 41 | 100% |
| 24 | Commercial Services | 57 | 81% | 13 | 19% | 70 | 100% |
| 25 | Transportation | 18 | 82% | 4 | 18% | 22 | 100% |
| 26 | Media | 50 | 83% | 10 | 17% | 60 | 100% |
| 27 | Textiles and Apparel | 30 | 83% | 6 | 17% | 36 | 100% |
| 28 | Consumer Services | 21 | 84% | 4 | 16% | 25 | 100% |
| 29 | Retailing | 76 | 85% | 13 | 15% | 89 | 100% |
| 30 | Transportation Infrastructure | 11 | 85% | 2 | 15% | 13 | 100% |
| 31 | Food Products | 8 | 89% | 1 | 11% | 9 | 100% |
| 32 | Diversified Financials | 18 | 90% | 2 | 10% | 20 | 100% |
| 33 | Automobiles | 4 | 100% | 0 | 0% | 4 | 100% |
| 34 | Household Products | 3 | 100% | 0 | 0% | 3 | 100% |
| 35 | Insurance | 3 | 100% | 0 | 0% | 3 | 100% |
| 36 | Refiners and Pipelines | 2 | 100% | 0 | 0% | 2 | 100% |
| 37 | Pharmaceuticals | 3 | 100% | 0 | 0% | 3 | 100% |
| Total | 675 | 64% | 377 | 36% | 1052 | 100% | |
| Panel B: Data Tabulation of Risk category across continent | |||||||
| Continent | Risk Category | ||||||
| Negligible Risk | Low Risk | Total | |||||
| N | % | N | % | N | % | ||
| America | 37 | 8% | 454 | 92% | 491 | 100% | |
| Asia | 12 | 9% | 128 | 91% | 140 | 100% | |
| Africa | 2 | 67% | 1 | 33% | 3 | 100% | |
| Europe | 45 | 12% | 334 | 88% | 379 | 100% | |
| Oceania | 4 | 15% | 22 | 85% | 26 | 100% | |
| Total | 100 | 10% | 939 | 90% | 1039 | 100% | |
| Variable | Definition | Measurement | Source |
|---|---|---|---|
| Independent Variable | |||
| ESG Rating | RISK_SCORE | ESG Risk Rating Score then multiplied it with (−1) | Sustainalytics |
| Dependent Variable | |||
| STEM CEOs | STEM | Dummy variable of CEOs’ educational background set to 1 if CEOs obtained one or more degree from STEM major and 0 otherwise. | Annual report and Companies website |
| Control Variables | |||
| CEOs’ age | CEOAGE | Natural logarithm of CEOs’ AGE | Annual report and Companies website |
| Board Size | BSIZE | Natural logarithm of number of Board in the firm | Bloomberg |
| Firm age | FAGE | Natural logarithm of firm age calculated from the point of the company’s initial public offering | Bloomberg |
| Firm size | FSIZE | Natural logarithm of total assets | Bloomberg |
| Return of assets | ROA | Ratio of EBIT to total assets | Bloomberg |
| Liquidity ratio | LIQUIDITY | Ratio of current assets to current liabilities | Bloomberg |
| Gross Domestic Product | GDP | Natural logarithm of Gross Domestic Product | World Bank |
| Variable | Mean | Standard Deviation | Minimum | Median | Maximum |
|---|---|---|---|---|---|
| RISK_SCORE | 15.065 | 3.367 | 4.300 | 15.500 | 20.000 |
| STEM | 0.357 | 0.479 | 0.000 | 0.000 | 1.000 |
| CEOAGE | 4.030 | 0.132 | 3.367 | 4.043 | 4.500 |
| BSIZE | 20.565 | 10.298 | 2.000 | 19.000 | 111.000 |
| FAGE | 2.812 | 1.000 | 0.000 | 3.045 | 4.804 |
| FSIZE | 14.938 | 2.820 | 6.987 | 15.232 | 21.882 |
| ROA | 0.216 | 1.937 | −2.780 | 0.070 | 59.404 |
| LIQUIDITY | 3.408 | 48.992 | 0.000 | 0.677 | 1564.748 |
| GDP | 15.343 | 1.621 | 8.704 | 15.220 | 17.053 |
| Variables | [1] | [2] | [3] | [4] | [5] | |
|---|---|---|---|---|---|---|
| [1] | RISK_SCORE | 1.000 | ||||
| [2] | STEM | −0.052 * | 1.000 | |||
| (0.097) | ||||||
| [3] | CEOAGE | 0.028 | 0.031 | 1.000 | ||
| (0.372) | (0.311) | |||||
| [4] | BSIZE | −0.139 *** | −0.017 | 0.107 *** | 1.000 | |
| (0.000) | (0.586) | (0.001) | ||||
| [5] | FAGE | 0.111 *** | 0.031 | 0.133 *** | 0.124 *** | 1.000 |
| (0.000) | (0.316) | (0.000) | (0.000) | |||
| [6] | FSIZE | 0.056 * | −0.005 | −0.041 | −0.138 *** | 0.003 |
| (0.072) | (0.865) | (0.190) | (0.000) | (0.928) | ||
| [7] | ROA | −0.044 | −0.010 | 0.036 | −0.011 | −0.055 * |
| (0.160) | (0.748) | (0.248) | (0.713) | (0.076) | ||
| [8] | LIQUIDITY | 0.059 * | −0.025 | −0.016 | 0.005 | −0.016 |
| (0.058) | (0.412) | (0.612) | (0.883) | (0.609) | ||
| [9] | GDP | −0.101 *** | −0.066 ** | 0.100 *** | 0.254 *** | 0.065 ** |
| (0.001) | (0.033) | (0.001) | (0.000) | (0.035) | ||
| Variables | [6] | [7] | [8] | [9] | ||
| [6] | FSIZE | 1.000 | ||||
| [7] | ROA | −0.053 * | 1.000 | |||
| (0.090) | ||||||
| [8] | LIQUIDITY | 0.016 | −0.004 | 1.000 | ||
| (0.603) | (0.898) | |||||
| [9] | GDP | −0.508 *** | −0.004 | 0.024 | 1.000 | |
| (0.000) | (0.907) | (0.443) | ||||
| Variables | MEAN | Coeff | t-Value | |
|---|---|---|---|---|
| STEM CEO | Non-STEM CEO | |||
| RISK_SCORE | −15.298 | −14.936 | −0.362 * | −1.662 |
| CEOAGE | 4.037 | 4.026 | 0.011 | 1.280 |
| BSIZE | 20.332 | 20.695 | −0.363 | −0.544 |
| FAGE | 2.854 | 2.789 | 0.065 | 1.004 |
| FSIZE | 14.918 | 14.949 | −0.031 | −0.170 |
| ROA | 0.190 | 0.231 | −0.040 | −0.322 |
| LIQUIDITY | 1.733 | 4.338 | −2.605 | −0.821 |
| GDP | 15.199 | 15.423 | −0.224 ** | −2.139 |
| Variables | (1) | (2) | (3) |
|---|---|---|---|
| RISK_SCORE | RISK_SCORE | RISK_SCORE | |
| STEM | −0.362 * | −0.451 ** | −0.361 * |
| (−1.71) | (−2.14) | (−1.70) | |
| CEOAGE | 0.963 | 0.829 | |
| (1.20) | (1.03) | ||
| BSIZE | −0.046 *** | −0.048 *** | |
| (−4.09) | (−4.13) | ||
| FAGE | 0.438 *** | 0.330 *** | |
| (4.49) | (3.32) | ||
| FSIZE | −0.013 | −0.050 | |
| (−0.33) | (−1.02) | ||
| ROA | −0.071 *** | −0.062 *** | |
| (−4.79) | (−3.85) | ||
| LIQUIDITY | 0.004 *** | 0.004 *** | |
| (6.92) | (5.20) | ||
| GDP | −0.186 ** | −0.532 ** | |
| (−2.45) | (−2.32) | ||
| Constanta | −14.936 *** | −16.024 *** | −9.524 * |
| (−110.73) | (−4.69) | (−1.91) | |
| Industry FE | No | No | Yes |
| Country FE | No | No | Yes |
| R2 | 0.003 | 0.052 | 0.153 |
| Adjusted R2 | 0.002 | 0.045 | 0.106 |
| N | 1039 | 1039 | 1039 |
| Variables | RISK_SCORE | |
|---|---|---|
| (1) | (2) | |
| Fixed-Effect | Random-Effect | |
| STEM | −0.347 | −0.451 ** |
| (−1.587) | (−2.108) | |
| CEOAGE | 0.957 | 0.963 |
| (1.220) | (1.225) | |
| BSIZE | −0.042 *** | −0.046 *** |
| (−4.038) | (−4.412) | |
| FAGE | 0.391 *** | 0.438 *** |
| (3.707) | (4.213) | |
| FSIZE | −0.041 | −0.013 |
| (−0.953) | (−0.310) | |
| ROA | −0.064 | −0.071 |
| (−1.218) | (−1.340) | |
| LIQUIDITY | 0.003 | 0.004 ** |
| (1.595) | (2.061) | |
| GDP | −0.131 * | −0.186 ** |
| (−1.703) | (−2.466) | |
| Constanta | −16.416 *** | −16.024 *** |
| (−4.826) | (−4.705) | |
| N | 1039 | |
| chi2(8) | 20.33 | |
| Prob>chi2 | 0.0092 | |
| Panel A: CEM Observation Sample | ||
| Non-STEM | STEM | |
| All | 668 | 371 |
| Matched | 667 | 370 |
| Unmatched | 1 | 1 |
| Panel B: CEM Regression | ||
| (1) | ||
| Variables | RISK_SCORE | |
| STEM | −0.358 * | |
| (−1.69) | ||
| CEOAGE | 0.830 | |
| (1.03) | ||
| BSIZE | −0.049 *** | |
| (−4.18) | ||
| FAGE | 0.349 *** | |
| (3.50) | ||
| FSIZE | −0.050 | |
| (−1.02) | ||
| ROA | −0.412 | |
| (−1.49) | ||
| LIQUIDITY | −0.023 ** | |
| (−2.22) | ||
| GDP | −0.525 ** | |
| (−2.31) | ||
| Constanta | −9.463 * | |
| (−1.92) | ||
| Industry FE | Yes | |
| Country FE | Yes | |
| R2 | 0.153 | |
| Adjusted R2 | 0.106 | |
| N | 1037 | |
| Variables | (1) | (2) |
|---|---|---|
| STEM | RISK_SCORE | |
| IND_STEM | 0.514 * | |
| (1.707) | ||
| STEM | −0.358 * | |
| (−1.694) | ||
| MILLS | 3.032 | |
| (0.500) | ||
| CEOAGE | 0.381 | 1.632 |
| (1.176) | (0.892) | |
| BSIZE | 0.002 | −0.045 *** |
| (0.369) | (−3.237) | |
| FAGE | 0.059 | 0.448 |
| (1.332) | (1.608) | |
| FSIZE | −0.007 | −0.066 |
| (−0.373) | (−1.144) | |
| ROA | −0.018 | −0.102 |
| (−1.288) | (−1.248) | |
| LIQUIDITY | −0.001 | 0.001 |
| (−0.716) | (0.111) | |
| GDP | −0.015 | −0.552 ** |
| (−0.129) | (−2.387) | |
| Constanta | −1.901 | −13.536 |
| (−0.818) | (−1.093) | |
| Industry FE | Yes | Yes |
| Country FE | Yes | Yes |
| Pseudo R2 | 0.071 | |
| R2 | 0.148 | |
| N | 1039 | 1039 |
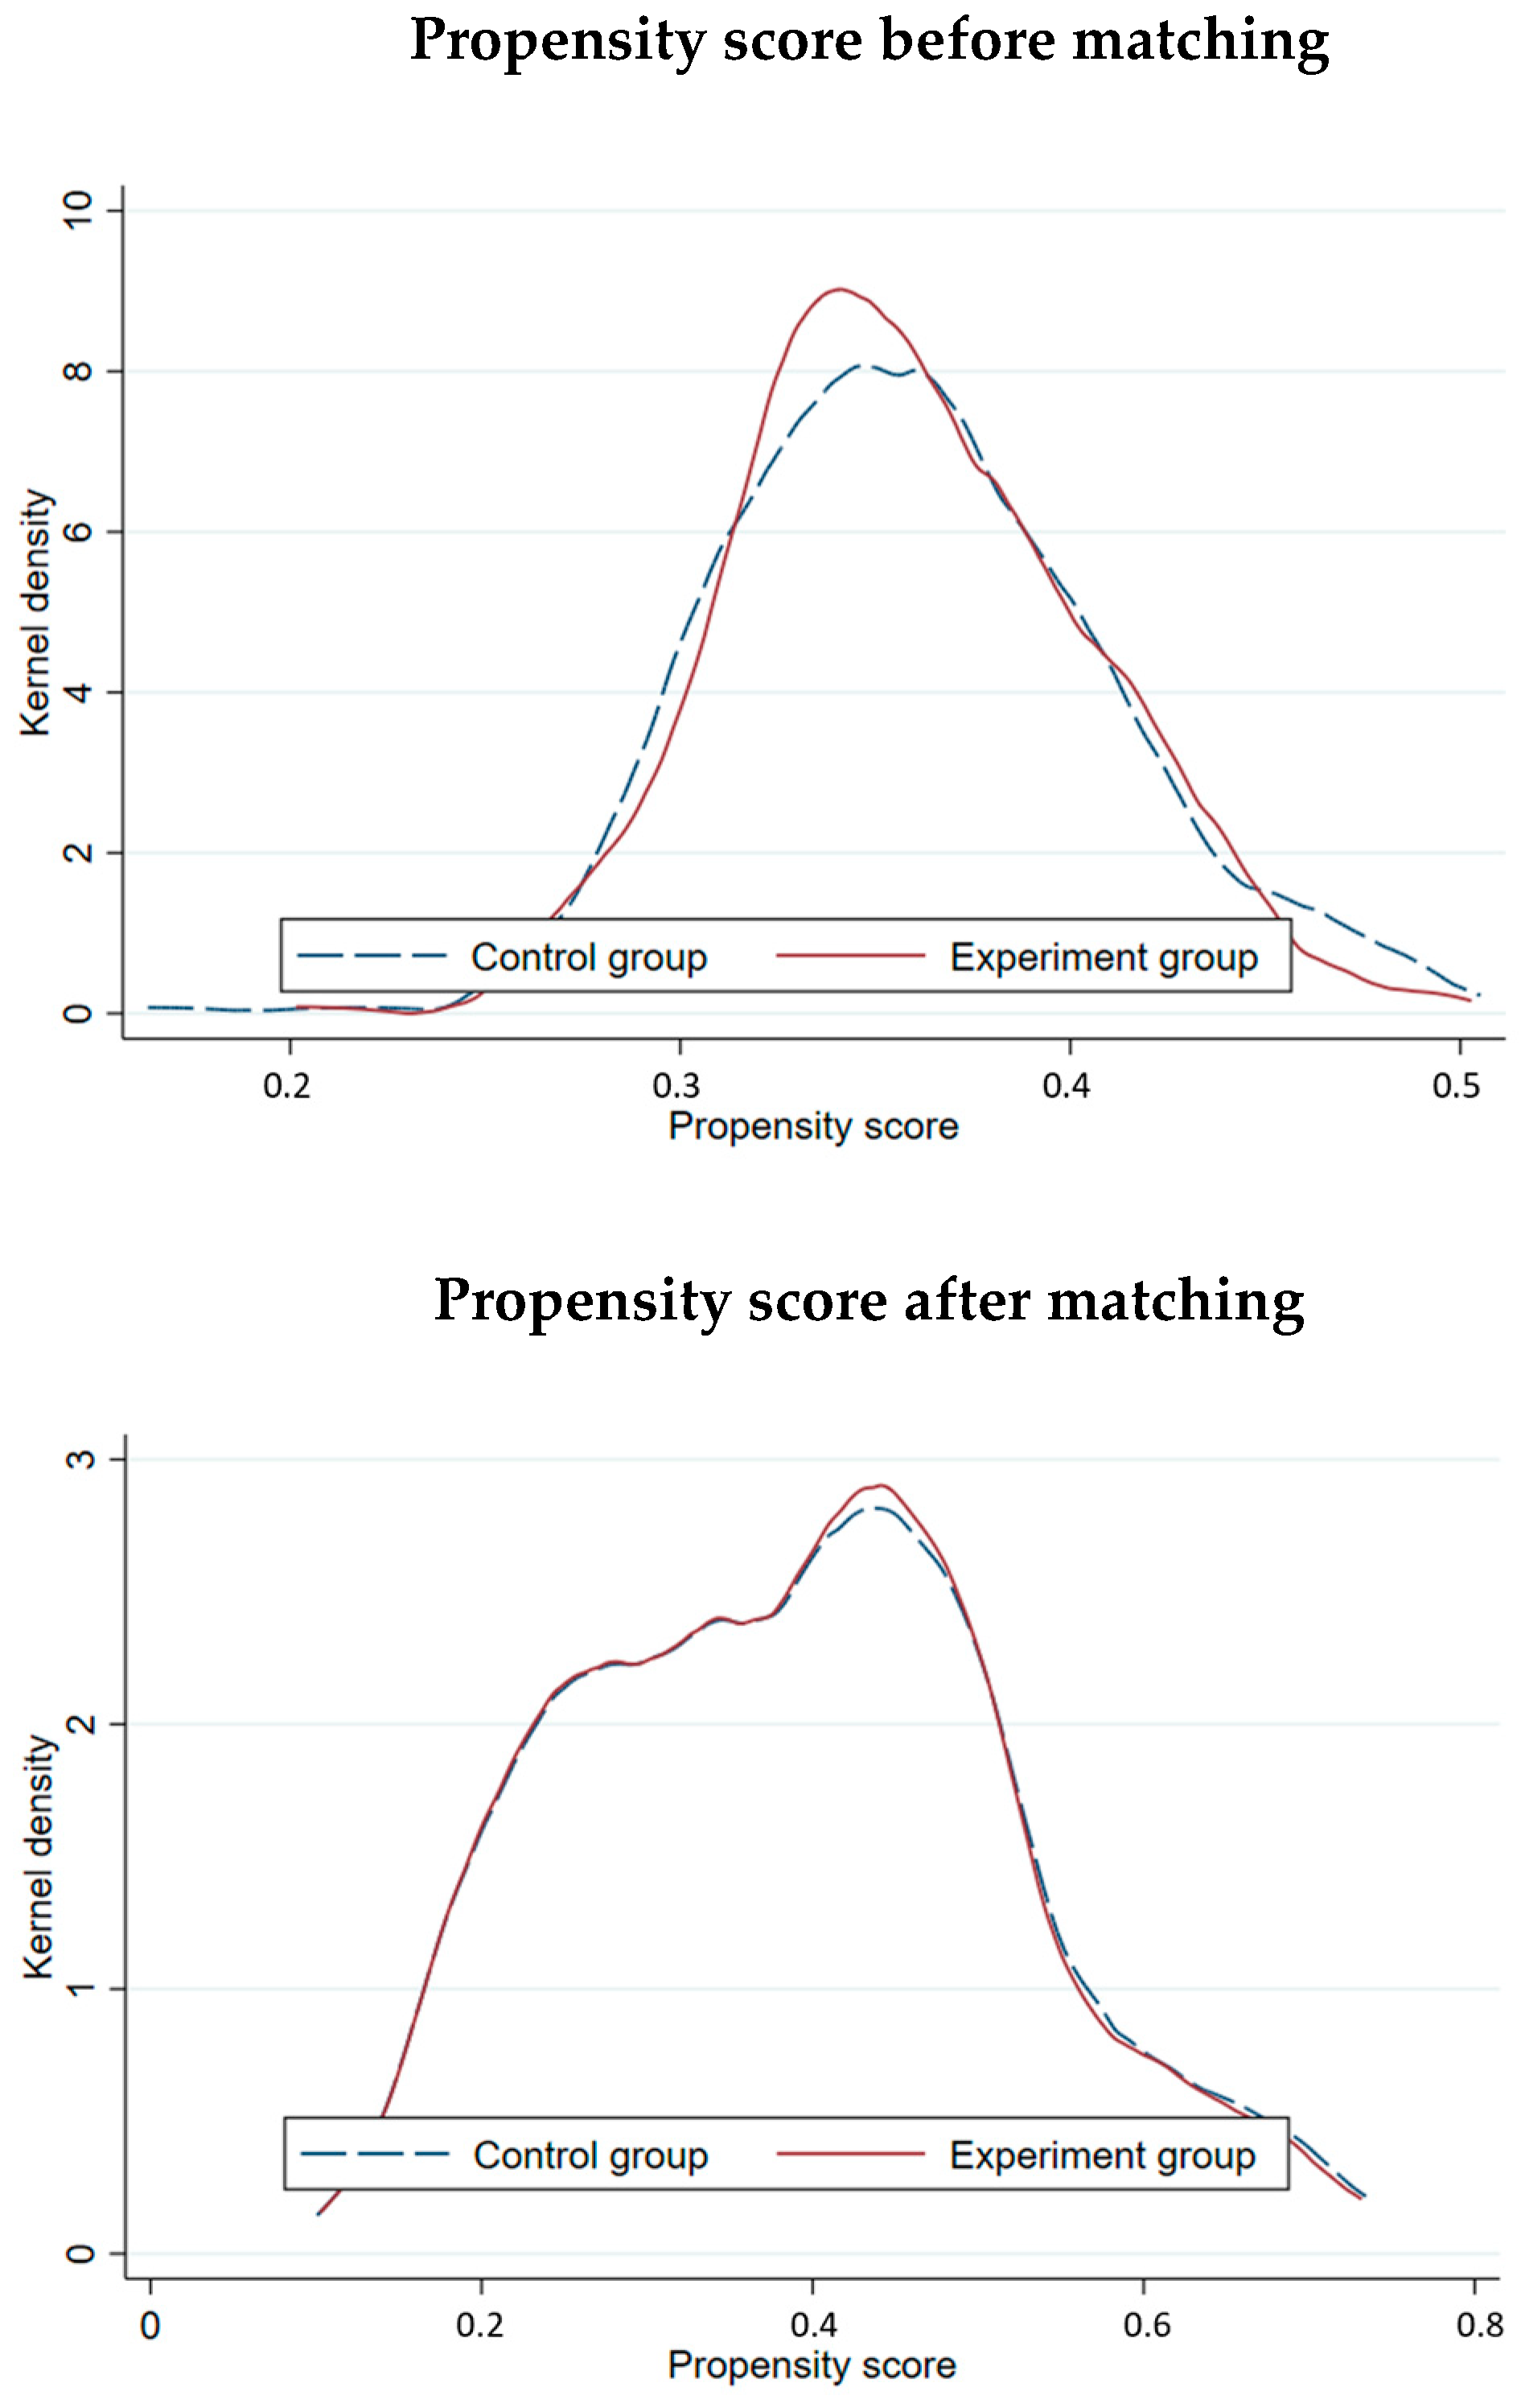
| Panel A: Balance test and matching results | ||||||
| Variables | Unmatched Matched | Mean | %bias | t-Test | ||
| Treated | Control | t | p-Value | |||
| CEOAGE | U | 4.037 | 4.026 | 8.5 | 1.280 | 0.201 |
| M | 4.034 | 4.041 | −5.7 | −0.718 | 0.473 | |
| BSIZE | U | 20.332 | 20.695 | −3.6 | −0.544 | 0.586 |
| M | 20.696 | 20.556 | 1.4 | 0.172 | 0.863 | |
| FAGE | U | 2.854 | 2.789 | 6.6 | 1.004 | 0.316 |
| M | 2.849 | 2.846 | 0.3 | 0.034 | 0.973 | |
| FSIZE | U | 14.918 | 14.949 | −1.1 | −0.170 | 0.865 |
| M | 14.802 | 14.742 | 2.1 | 0.261 | 0.795 | |
| ROA | U | 0.190 | 0.231 | −2.3 | −0.322 | 0.748 |
| M | 0.172 | 0.286 | −4.7 | −0.600 | 0.548 | |
| LIQUIDITY | U | 1.733 | 4.338 | −6.0 | −0.821 | 0.412 |
| M | 1.752 | 1.352 | 7.4 | 0.937 | 0.349 | |
| GDP | U | 15.199 | 15.423 | −13.8 | −2.139 | 0.033 |
| M | 15.389 | 15.422 | −2.1 | −0.263 | 0.793 | |
| Panel B: Relationship of STEM CEOs and ESG risk-taking by PSM samples | ||||||
| Variables | RISK_SCORE | |||||
| STEM | −0.462 * | |||||
| (−1.848) | ||||||
| CEOAGE | 1.706 | |||||
| (1.607) | ||||||
| BSIZE | −0.050 *** | |||||
| (−3.354) | ||||||
| FAGE | 0.251 * | |||||
| (1.941) | ||||||
| FSIZE | −0.037 | |||||
| (−0.646) | ||||||
| ROA | −0.067 *** | |||||
| (−4.957) | ||||||
| LIQUIDITY | −0.019 | |||||
| (−1.218) | ||||||
| GDP | −0.251 | |||||
| (−0.796) | ||||||
| Constanta | −15.093 ** | |||||
| (−2.168) | ||||||
| Industry FE | Yes | |||||
| Country FE | Yes | |||||
| R2 | 0.167 | |||||
| Adjusted R2 | 0.110 | |||||
| N | 644 | |||||
| RISK_SCORE | ||
|---|---|---|
| (1) | (2) | |
| EU | Non-EU | |
| STEM | −0.841 ** | −0.086 |
| (−2.43) | (−0.32) | |
| CEOAGE | −0.870 | 1.504 |
| (−0.58) | (1.58) | |
| BSIZE | −0.075 *** | −0.039 *** |
| (−3.55) | (−2.78) | |
| FAGE | 0.016 | 0.521 *** |
| (0.09) | (4.05) | |
| FSIZE | −0.069 | −0.031 |
| (−0.82) | (−0.52) | |
| ROA | −0.065 *** | −0.403 |
| (−3.65) | (−1.59) | |
| LIQUIDITY | −0.022 | 0.004 *** |
| (−1.22) | (6.28) | |
| GDP | 1.394 *** | −0.489 ** |
| (4.15) | (−2.09) | |
| _cons | −31.477 *** | −12.417 ** |
| (−3.66) | (−2.36) | |
| Industry FE | Yes | Yes |
| Country FE | Yes | Yes |
| r2 | 0.169 | 0.154 |
| r2_a | 0.084 | 0.108 |
| N | 379 | 660 |
| RISK_SCORE | ||
|---|---|---|
| (1) | (2) | |
| Developed Countries | Developing Countries | |
| STEM | −0.414 * | 0.126 |
| (−1.85) | (0.18) | |
| CEOAGE | 0.687 | 0.839 |
| (0.77) | (0.36) | |
| BSIZE | −0.047 *** | −0.021 |
| (−3.92) | (−0.54) | |
| FAGE | 0.368 *** | 0.060 |
| (3.55) | (0.14) | |
| FSIZE | −0.038 | −0.363 |
| (−0.76) | (−1.20) | |
| ROA | −0.058 *** | −0.567 |
| (−3.65) | (−0.39) | |
| LIQUIDITY | −0.024 | 0.038 |
| (−0.93) | (0.95) | |
| GDP | −0.452 ** | 1.330 |
| (−2.02) | (1.57) | |
| _cons | −11.080 ** | −32.801 * |
| (−2.11) | (−1.98) | |
| Industry FE | Yes | Yes |
| Country FE | Yes | Yes |
| r2 | 0.142 | 0.312 |
| r2_a | 0.102 | 0.067 |
| N | 935 | 104 |
| Panel A: Distribution of STEM-educated CEO by gender | ||||||
| Gender | Non-STEM CEO | STEM CEO | Total | |||
| N | % | N | % | N | % | |
| Female | 68 | 79% | 18 | 21% | 86 | 100% |
| Male | 600 | 63% | 353 | 37% | 953 | 100% |
| Total | 668 | 64% | 371 | 36% | 1039 | 100% |
| Panel B: Sub-sample regression results | ||||||
| Variables | RISK_SCORE | |||||
| (1) | (2) | |||||
| Female CEO | Male CEO | |||||
| STEM | −1.542 * | −0.295 | ||||
| (−1.91) | (−1.35) | |||||
| CEOAGE | 1.809 | 0.840 | ||||
| (0.53) | (1.01) | |||||
| BSIZE | −0.018 | −0.049 *** | ||||
| (−0.34) | (−4.11) | |||||
| FAGE | 0.264 | 0.356 *** | ||||
| (0.67) | (3.46) | |||||
| FSIZE | 0.161 | −0.067 | ||||
| (0.75) | (−1.31) | |||||
| ROA | −0.310 | −0.065 *** | ||||
| (−0.70) | (−3.91) | |||||
| LIQUIDITY | −0.033 | 0.004 *** | ||||
| (−0.78) | (4.97) | |||||
| GDP | −1.011 | −0.505 ** | ||||
| (−1.25) | (−2.18) | |||||
| Constanta | −11.385 | −9.620 * | ||||
| (−0.68) | (−1.89) | |||||
| Industry FE | Yes | Yes | ||||
| Country FE | Yes | Yes | ||||
| R2 | 0.410 | 0.166 | ||||
| Adjusted R2 | 0.088 | 0.115 | ||||
| N | 86 | 953 | ||||
Disclaimer/Publisher’s Note: The statements, opinions and data contained in all publications are solely those of the individual author(s) and contributor(s) and not of MDPI and/or the editor(s). MDPI and/or the editor(s) disclaim responsibility for any injury to people or property resulting from any ideas, methods, instructions or products referred to in the content. |
© 2025 by the authors. Licensee MDPI, Basel, Switzerland. This article is an open access article distributed under the terms and conditions of the Creative Commons Attribution (CC BY) license (https://creativecommons.org/licenses/by/4.0/).
Share and Cite
Harymawan, I.; Setiawan, D.; Adhariani, D.; Paramayuda, A.A.R. Innovation over ESG Performance? The Trade-Offs of STEM Leadership in Top Sustainable Firms. J. Risk Financial Manag. 2025, 18, 372. https://doi.org/10.3390/jrfm18070372
Harymawan I, Setiawan D, Adhariani D, Paramayuda AAR. Innovation over ESG Performance? The Trade-Offs of STEM Leadership in Top Sustainable Firms. Journal of Risk and Financial Management. 2025; 18(7):372. https://doi.org/10.3390/jrfm18070372
Chicago/Turabian StyleHarymawan, Iman, Doddy Setiawan, Desi Adhariani, and Atikah Azmi Ridha Paramayuda. 2025. "Innovation over ESG Performance? The Trade-Offs of STEM Leadership in Top Sustainable Firms" Journal of Risk and Financial Management 18, no. 7: 372. https://doi.org/10.3390/jrfm18070372
APA StyleHarymawan, I., Setiawan, D., Adhariani, D., & Paramayuda, A. A. R. (2025). Innovation over ESG Performance? The Trade-Offs of STEM Leadership in Top Sustainable Firms. Journal of Risk and Financial Management, 18(7), 372. https://doi.org/10.3390/jrfm18070372