1. Introduction
Due to increased investor anxiety and greed, the global financial market has recently seen several volatile events (
Albers, 2023). Due to behavioral biases, these feelings have greatly influenced decision-making and market dynamics. For example, the global financial crisis in 2007–2008, the European debt crisis in 2009–2010, the COVID-19 pandemic-induced meltdown in 2020, the Russia-Ukraine war, and the interest rate hiking cycle all demonstrated the significant influence of investor emotion on market outcomes (
Li et al., 2021). While times of optimism and greed spurred speculative behaviors that further destabilized markets, fear surged throughout these crises as investors struggled with uncertainty, increased market volatility, and risk aversion (
Elyasiani et al., 2021;
Hollstein & Prokopczuk, 2023). The efficient market hypothesis (
Fama, 1970,
1991) assumes that investors behave rationally and fully account for all available information when setting asset prices. This perspective is challenged by behavioral finance findings, which demonstrate that psychological elements like fear, greed, and overreaction frequently influence investor decisions, especially during times of increased market volatility and uncertainty (
Bhanu, 2023;
Umeaduma, 2024). These emotional reactions have the potential to skew how market players perceive and respond to information, which could increase price swings and lead to inefficiencies in the market. Research has demonstrated that both positive and negative investor sentiment can lead to price deviations from fundamental values, which in turn can impact market volatility and mispricing (
Verma & Verma, 2021). The significance of creating sentiment-based indicators that capture the behavioral and emotional aspects of financial markets is shown by this divergence from reasonable expectations. Accordingly, indices like the CNN Fear and Greed Index have become more well-known throughout the world for tracking the dynamics of investor emotions (
Gómez-Martínez et al., 2023). However, because emerging markets like South Africa have different market structures, liquidity, investor profiles, and macroeconomic sensitivities, relying solely on U.S.-based measures may not accurately reflect sentiment circumstances in these regions. In order to provide a more accurate instrument for gauging sentiment and comprehending its relationship to global markets, this study creates a South African Fear and Greed Index that is specific to the home market. In actuality, investors may be biased when making choices about their investments since they are often swayed by the feelings of others in scenarios involving uncertain investments (
Barber & Odean, 2008). The study of investor sentiment has drawn much interest recently as a significant component of behavioral finance, which has grown to be a significant area of finance (
Jiang et al., 2019;
Lan et al., 2021).
Numerous academics have extensively studied the development of investor sentiment indexes (
Baker & Wurgler, 2006;
Baker et al., 2012) and the impact of investor sentiment on asset pricing (
Qadan & Nama, 2018). Investor sentiment spreads from one investor to another. Because the internet is so widely used, investors from other nations can communicate with one another through stock forums, stock market networks, and social interactions, and even the wider social internet can propagate investor mood among stock market players. Investors in financial markets have been shown to communicate and learn from one another (
Hirshleifer et al., 2025). Expanding on this, more recent empirical studies have concentrated on measuring sentiment using composite indexes like the CNN Fear and Greed Index, which measures market sentiment according to variables like momentum, volatility, and demand for safe havens (
Sarkar, 2023;
Ahadzie et al., 2024). However, there hasn’t been much effort made to create or use these indices in the context of emerging countries like South Africa, and they are mostly focused on the United States. Furthermore, at the macro level,
Baker et al. (
2012) discovered that both local and global sentiment can negatively affect stock prices and that international capital flows (CFs) are the primary conduit for cross-regional contagion of investor attitudes. The likelihood of investor sentiment spreading across markets increases with the globalization of financial markets (
Niţoi & Pochea, 2020). The subprime mortgage crisis, for instance, started in the U.S. financial sector, but the global panic that quickly spread had a significant effect on the global financial system. Global stock markets plummeted in 2020 when the coronavirus (COVID-19) epidemic swept the globe. The well-managed pandemic initially kept South African stock markets comparatively stable. The Johannesburg Stock Exchange Index ultimately experienced a significant decline due to the subsequent panic in the European and American stock markets. Yet, despite increased global interest in the mechanisms of emotional contagion, there remains a substantial empirical gap in understanding how Fear-and-Greed-type sentiment develops and spreads within African markets, particularly in terms of its transmission from dominant countries like the U.S. By creating a South African Fear and Greed Index and examining its relationship to the U.S. index, this study fills this knowledge vacuum and advances a more regional understanding of behavioral risk. Therefore, it is not only relevant but also crucial to comprehend how investor sentiment impacts South Africa’s financial market and spreads throughout the world in order to improve market resilience and direct investor plans. Studying the method by which investor mood spreads throughout global financial markets is crucial in this regard in order to comprehend the investor sentiment contagion path.
Financial crises happen frequently and share several characteristics (
Reinhart & Rogoff, 2008). For instance, the volatility of the financial markets typically surges substantially during crises and spreads to other markets. It would be desirable to be able to quantify and track these spillovers in order to track the development of ongoing crises as well as to create “early warning systems” for emerging ones. Given the recent global financial crisis and COVID-19 epidemic, spillovers across sentiment are particularly interesting. However, they have not previously been examined utilizing the DY framework and a Fear and Greed Index. These methodological and substantive shortcomings are filled in this work. The forecast-error variance decompositions in this paper’s generalized vector autoregressive framework explicitly account for directional volatility spillovers and are invariant to the variable ordering. The techniques were then applied in a thorough empirical study of monthly volatility spillovers across Fear and Greed sentiment in the U.S. and SA for 17 years, including the COVID-19 epidemic and the global financial crisis.
Investor sentiment significantly impacts asset prices, volatility, and investment choices in financial markets. The CNN Fear and Greed Index is a well-known indicator of market sentiment in the U.S. that assists investors in determining the market’s emotions and modifying their approach accordingly. However, there is no similar methodical way to gauge investor sentiment in South Africa that incorporates several market indicators to account for investor Fear and Greed changes in the country’s financial markets. This study seeks to close this gap by creating a South African Fear and Greed Index based on the CNN index but adjusted for local market conditions. The lack of a standardized investor sentiment metric for South Africa is the main issue this article attempts to address, since it restricts investors’ capacity to measure market sentiment and evaluate its effects on financial markets. Investors, legislators, and financial experts could find it difficult to gauge market sentiment accurately without such an index, resulting in ineffective risk assessment and decision-making. This study aims to provide market participants with a valuable tool to better understand market sentiment, enhance risk management methods, and improve predictive models of market movements by developing and validating a sentiment index tailored to South Africa. This study will also investigate the connectedness between the U.S. CNN Fear and Greed Index and the recently created sentiment index. The following are the study’s main contributions:
Creation of a Fear and Greed Index for South Africa—addresses the shortcomings of U.S.-centric sentiment measures in emerging economies by creating a localized sentiment index specific to the financial market in South Africa.
Evaluation of global market sentiment connectivity—investigates how investor sentiment is transferred between South Africa and U.S. financial centers, to improve knowledge of behavioral contagion effects.
Behavioral transmission channels: an empirical evaluation—demonstrates the temporal pattern and asymmetry of sentiment spillovers into the South African financial system by offering a dynamic analysis of how changes in investor sentiment in the United States affect the sentiment of the home market.
This paper is structured as follows: Theoretical and empirical literature studies are discussed in
Section 2. Then, the methodological approach focusing on the DY model’s use of generalized variance decompositions and directional spillovers is covered in
Section 3. The data and results are presented in
Section 4, while
Section 5 concludes the discussion.
3. Data and Methodology
In summary, from the above literature, the linking effects of stock market risks and the cross-country spillover effects of stock market volatility have been the main subjects of the majority of recent research on global capital market correlations (
Ji et al., 2020;
Su, 2020a,
2020b;
Yang & Zhou, 2020). Few studies have examined investor sentiment contagion between two nations (
Hudson & Green, 2015), making it challenging to define the mechanisms underlying spillover effects in international capital markets. Existing research techniques often employ multi-linear regression models, which can only capture the static linear relationship between nations (
Hudson & Green, 2015). The network structure of cross-country spillovers is not well analyzed in the literature. This study adds something new to the expanding literature on behavioral finance, global stock market connectivity, and investor sentiment, especially in the context of emerging markets. The measurement, interpretation, and influence of investor sentiment in Africa, particularly in South Africa, are still completely unexplored, despite the fact that much of the research so far has focused on developed countries, most notably the United States (
Plakandaras et al., 2020;
Yousaf et al., 2022). This study fills this gap by creating a South African Fear and Greed Index based on market dynamics, sentiment proxies, and local financial data, offering a sentiment metric that is unique to South African circumstances. This study improves the knowledge of sentiment connectedness between a major global market (the United States) and an emerging market (South Africa) by comparing this new index to the popular CNN Fear and Greed Index. This helps to clarify how the emotions of international investors affect or differ from those of domestic investors. This paper contends that context-specific sentiment indicators are required to capture the subtleties of emerging market investor psychology, regulatory frameworks, and market microstructure, in contrast to earlier research that uses only U.S. sentiment measures as stand-ins for global fear and greed (
Sarkar, 2023;
Ahadzie et al., 2024) Additionally, by empirically investigating the dynamic transmission of sentiment between the U.S. and South African markets, particularly during times of financial stress and uncertainty like the 2008 Global Financial Crisis, the COVID-19 pandemic, the Russia–Ukraine war, and the 2022 interest rate–hiking cycle, this paper contributes to the body of literature. Exploring time-varying spillovers, volatility transmission, and behavioral contagion, areas that are still poorly understood in the African context, is made possible by these chaotic periods. Using the DY model, this study created a Fear and Greed investor sentiment variable using the South African equivalent variables spillover network with the CNN U.S. Fear and Greed variable. It then looked at the static and dynamic structural characteristics of the spillovers between the two countries to determine whether South Africa needs its own Fear and Greed Index. This was conducted to thoroughly understand the linkage effects and diffusion mechanisms of the Fear and Greed investor sentiment across the two nations. Although South Africa and the Johannesburg Stock Exchange (JSE) are the specific subjects of this study, the methodology created, which includes creating a localized Fear and Greed Index, is generally relevant to other emerging and frontier markets. The model can be used in a variety of national contexts because it is based on widely accessible financial and macroeconomic information (such as trading volumes, bond spreads, and volatility indexes). Additionally, the model can capture global sentiment contagion effects due to the cross-market connectedness component, which looks at spillover effects from the U.S. CNN Fear and Greed Index. This is especially important in a time of growing financial globalization, when macroeconomic shocks and investor psychology spread quickly across national boundaries. Additionally, the framework’s modular and time-varying design enables it to adapt to market-specific circumstances, such as differing investor profiles, regulatory frameworks, and market maturity levels. As a result, the suggested model offers a solid and repeatable basis for investigating macro-financial interconnections and behavioral finance dynamics in both developed and emerging markets.
3.1. Sample
For this analysis, this paper examines the connectedness between the U.S. Fear and Greed Index and the South African equivalent of the Fear and Greed Index between June 2007 and June 2024. This was specifically chosen to cover a number of significant international financial and economic events that had a big impact on market dynamics and investor sentiment. The global financial crisis of 2007–2008, the European sovereign debt crisis of 2009–2010, the market meltdown brought on by the COVID-19 pandemic in 2020, the geopolitical unrest caused by the Russia–Ukraine war starting in 2022, and the global interest rate hike cycle started by central banks in response to post-pandemic inflationary pressures are all included in this timeframe. By including these occurrences, this research is guaranteed to reflect a range of market situations, from recovery and tightening cycles to extreme volatility and downturns. This improves the relevance and robustness pf the findings with regard to investor sentiment connectedness. Additionally, to the best of the authors’ knowledge, this study is the first attempt to create a Fear and Greed Index tailored to the South African market. Therefore, it was essential to determine the index’s full-sample characteristics and assess its long-term relationship and connectivity with the well-established U.S. counterpart. The U.S. prematurely splitting the time series may make it more difficult to identify general structural co-movement patterns and lower the statistical power of the connectedness analysis, particularly in a market with smaller capitalization and less frequent data flows, like the Johannesburg Stock Exchange, JSE. CNN Business calculates the Fear and Greed Index, which ranges from 1 to 100. A value of 100 denotes extreme greed, while a value of 1 denotes extreme fear. The market is often afraid when the index has lower values and greedy when it has higher values. Market momentum, stock price strength, stock price breadth, the ratio of put-to-call options, market volatility (VIX), safe-haven demand, and junk bond demand are the seven components that make up this index, which is computed as a simple average. In order to construct the South Africa Fear and Greed Index, it was necessary to replicate the CNN Fear and Greed Index. However, due to data availability and characteristics of the South African economy, it could not be an exact match. The data was sourced for the following variables in standardized form, in order to create the South African Fear and Greed Index. The data had to be converted from its standard form into an indexed value ranging from 1 to 100 to replicate the CNN Fear and Greed Index.
The South African variables used in this study are as follows, following the same variables utilized in the U.S. CNN Fear and Greed Index: (1) stock price momentum—a measure of the JSE All Share Index versus its 125-day moving average (MA), which essentially is the difference between the standardized values of the variables. This process of using the standardized value for the variables is continued as follows. (2) The relative strength index of the JSE All Share Index measures stock price strength. (3) Stock price breadth is the JSE All Share Index volume. (4) This paper used the South African futures market index as a proxy for the ratio of put-and-call options. Since futures contracts do not undergo theta erosion, futures options are frequently chosen over conventional call-and-put options because of their leverage, capital efficiency, and decreased influence from time decay. In addition, they have extended trading hours, better liquidity, and are better than stock options at hedging indices, commodities, and interest rates. Furthermore, futures markets offer direct exposure to various asset types outside of stocks and are heavily regulated, lowering counterparty risk. Futures options are preferred for wider market exposure, hedging, and effective capital allocation, while stock options might be better for directional bets on individual equities. (5) Junk bond demand was based on SA government bonds versus the U.S. government bonds. (6) Market volatility was based on the South African Volatility Index vs. the 50-day MA. Finally, (7) safe-haven demand was represented by the JSE All Share return vs. the 10-year treasury bond. Once the standardized data was obtained, the values were indexed between 1, indicating fear, and 100, indicating greed per month. However, they are not all equally weighted in the index. To better capture the structural and behavioral subtleties of the South African financial market, this study uses a bespoke weighting scheme, whereas the original CNN Fear and Greed Index gives each of its seven indicators an equal value (around 14.29%). There are notable differences between the U.S. and South African economies, financial markets, and investment behavior. The sentiment signals that drive asset values on the Johannesburg Stock Exchange (JSE) may, therefore, not be accurately reflected by a direct reproduction of the U.S. index. The following weighting was allocated to the index value of the variables per month: market momentum (20%)—because of the JSE’s robust trend-following behavior, where momentum is crucial to both retail and institutional trading techniques, this is given more weight. In emerging markets, sentiment spillovers, both domestically and internationally, are frequently reflected in momentum indicators. Stock price strength (15%) and stock price breadth (10%)—these record the market’s internal confirmation. Because large-cap stocks dominate the JSE, strength is given a somewhat larger weight than breadth, which is a result of small-cap stocks’ less extensive involvement in influencing market-wide trends. The ratio of put-to-call options (10%)—when data availability allows, this indicator is kept at a small weight to indicate sentiment related to derivatives, even if options trading is less active on the JSE than in developed markets. Market volatility (SAVI) (15%)—this weight acknowledges the decreased liquidity of volatility instruments in South Africa while reflecting the relevance of volatility as a major fear signal worldwide. Safe-haven demand (15%) and junk bond demand (15%)—these are kept with moderate weights because of South Africa’s sensitivity to international capital flows, particularly during macroeconomic or geopolitical shocks, which makes flight-to-safety dynamics and risk-on/risk-off cycles relevant. Finally, once the indices were allocated their respective weighting per month, they were summed up per month to obtain the SA Fear and Greed Index per month for the period of the study. By preserving the original index design while adapting it to the unique circumstances of an emerging economy, this weighting structure exemplifies a hybrid approach. For South African investors, politicians, and analysts, the decision to stray from equal weighting aligns with the desire to increase explanatory power and local relevance. Additionally, by employing differentiated weights, this index can serve as a diagnostic tool in addition to a sentiment gauge, highlighting the sentiment channels (such as momentum and volatility) that are causing market stress or excitement at any particular moment. Because of the asymmetric influence between the two markets, the analysis is limited to sentiment spillovers from the U.S. to South Africa. As the world’s leading financial center, the U.S. has a disproportionately large influence on how investors behave globally, especially in developing nations like South Africa. Reverse spillovers are anticipated to be small and outside the purview of this study’s main goal, which is to evaluate how susceptible the developing market mood is to outside shocks, given South Africa’s relatively small impact on international markets. Through the use of a Fear and Greed Index tailored to South Africa, this study effectively integrates behavioral finance theory, even though it does not rely on primary data gathering or direct polls of investor behavior. Important sentiment-driven market indicators that serve as proxies for the psychological states of fear and greed in financial decision-making are captured by this index, including momentum, volatility, option activity, and safe-haven demand (
Moodley et al., 2025). The study indirectly infers Prospect Theory-aligned behavioral tendencies, like loss aversion and overreaction, by examining how changes in this composite score correlate with market movements. For example, moments of greed may correspond with market rallies propelled by overconfidence, whereas periods of increased fear may correspond with market sell-offs as investors respond disproportionately to perceived losses (
Liu et al., 2014). This work uses visible market data to indicate underlying sentiment, much like
Rupande et al. (
2019), who used principal component analysis (PCA) and lag structures on the JSE to create an investor sentiment index. This study adds to the body of research on behavioral finance by demonstrating how collective sentiment, as gauged by proxies derived from the market, can reflect behavioral patterns that impact market outcomes in South Africa, even though it does not directly test particular cognitive biases like regret aversion or mental accounting. Additionally, this study subtly reflects regret aversion in cautious trading patterns during volatile periods, as investors steer clear of decisions that could result in unfavorable outcomes in retrospect. It also highlights mental accounting in investors’ distinct responses to asset classes represented in the index components (e.g., safe-haven demand vs. equity momentum). All the data was sourced from the IRESS database, Bloomberg, the CNN website, and Federal Reserve economic data.
3.2. Methodology
Diebold and Yilmaz (
2009,
2012,
2014) developed total and directional spillover indices to account for the directions and degrees of spillovers, and the authors introduced a vector autoregression-based variance decomposition to measure spillover effects. This is the current standard approach for analyzing spillovers.
Diebold and Yilmaz (
2014) examined the daily time-varying correlations of stock return volatilities of major U.S. financial institutions over ten years to determine the degree of correlation among U.S. financial enterprises, focusing on the 2007–2008 Great Financial Crisis. The authors also built a spillover network to investigate the degree and direction of spillover caused by the stock return volatility of each financial institution. Several academics have used the DY spillover model to examine the feedback and spillover effects in the stock, bond, and foreign exchange markets, as well as the spillover effects across other economies. Several modern researchers have used the DY spillover model to study the feedback and spillover.
Liu et al. (
2023), for instance, looked at the levels and directions of investor sentiment spillovers in ten countries between 2003 and 2020 by creating aggregate and directional spillover indices and examining the network structures and static and dynamic characteristics of the spillover effects. The findings showed that investor sentiment had time-varying and significant cross-country spillover effects, with the overall sentiment spillover index rising sharply in response to extreme events like the coronavirus pandemic, the European sovereign debt crisis, the subprime mortgage crisis, and the United Kingdom’s (U.K.) Brexit policy.
This study used the model consistent with
Liu et al.’s (
2023) study; the degree of cross-country investor sentiment spillovers is measured between the U.S. and South African Fear and Greed Index using the DY method for the generalized variance decomposition-based spillover indices, as follows (
Diebold & Yilmaz, 2014). Initially, a stationary covariance
n-dimensional vector autoregressive (VAR) model for investor sentiment in the sample nations is developed:
where
is an i.i.d. vector and
is an
n-dimensional column vector made up of the investor sentiment indices for
nations in natural logarithmic form. Equation (1)’s moving average expression is shown as follows:
It is true that + + ⋯ + for the n-order matrix. is an identity matrix of n-order. = 0 when . To estimate the prediction error variance of ahead of the steps due to the shocks of , , and , that is, one can use variance decomposition to break down the prediction error of each variable into a percentage that can be ascribed to systemic shocks.
The extent to which spillover shocks have impacted investor sentiment in each nation is then determined using a generalized variance decomposition:
where
is the standard deviation of the error term in the
equation,
is the unit vector of the element
, and
is the variance matrix of the error vector
. The total of the items in each row of the variance decomposition table does not always equal 1 because the shocks to each variable are not orthogonal; that is,
. We normalize the rows in the manner described below in order to compute the spillover index and assess the generalized connectivity:
where
, and
.
The following formula can be used to create a total volatility spillover index:
The total spillover index calculates the overall amount of spillover from global investor sentiment, as well as the contribution of investor sentiment shock spillover in sample nations to the total prediction error variance. Lastly, an index of directional spillover is created. This paper quantifies the degree to which one country has influenced the spillover amount of country
in order to determine the direction of volatility spillovers in investor sentiment across nations, using the generalized VAR method:
Likewise, the degree of investor sentiment volatility in country
that is transferred to other nations is as follows:
The direction and magnitude of nation
’s spillover are shown in Equations (6) and (7). In applying the two Fear and Greed indices to these models, the results are presented in
Section 4 below.
4. Empirical Analysis
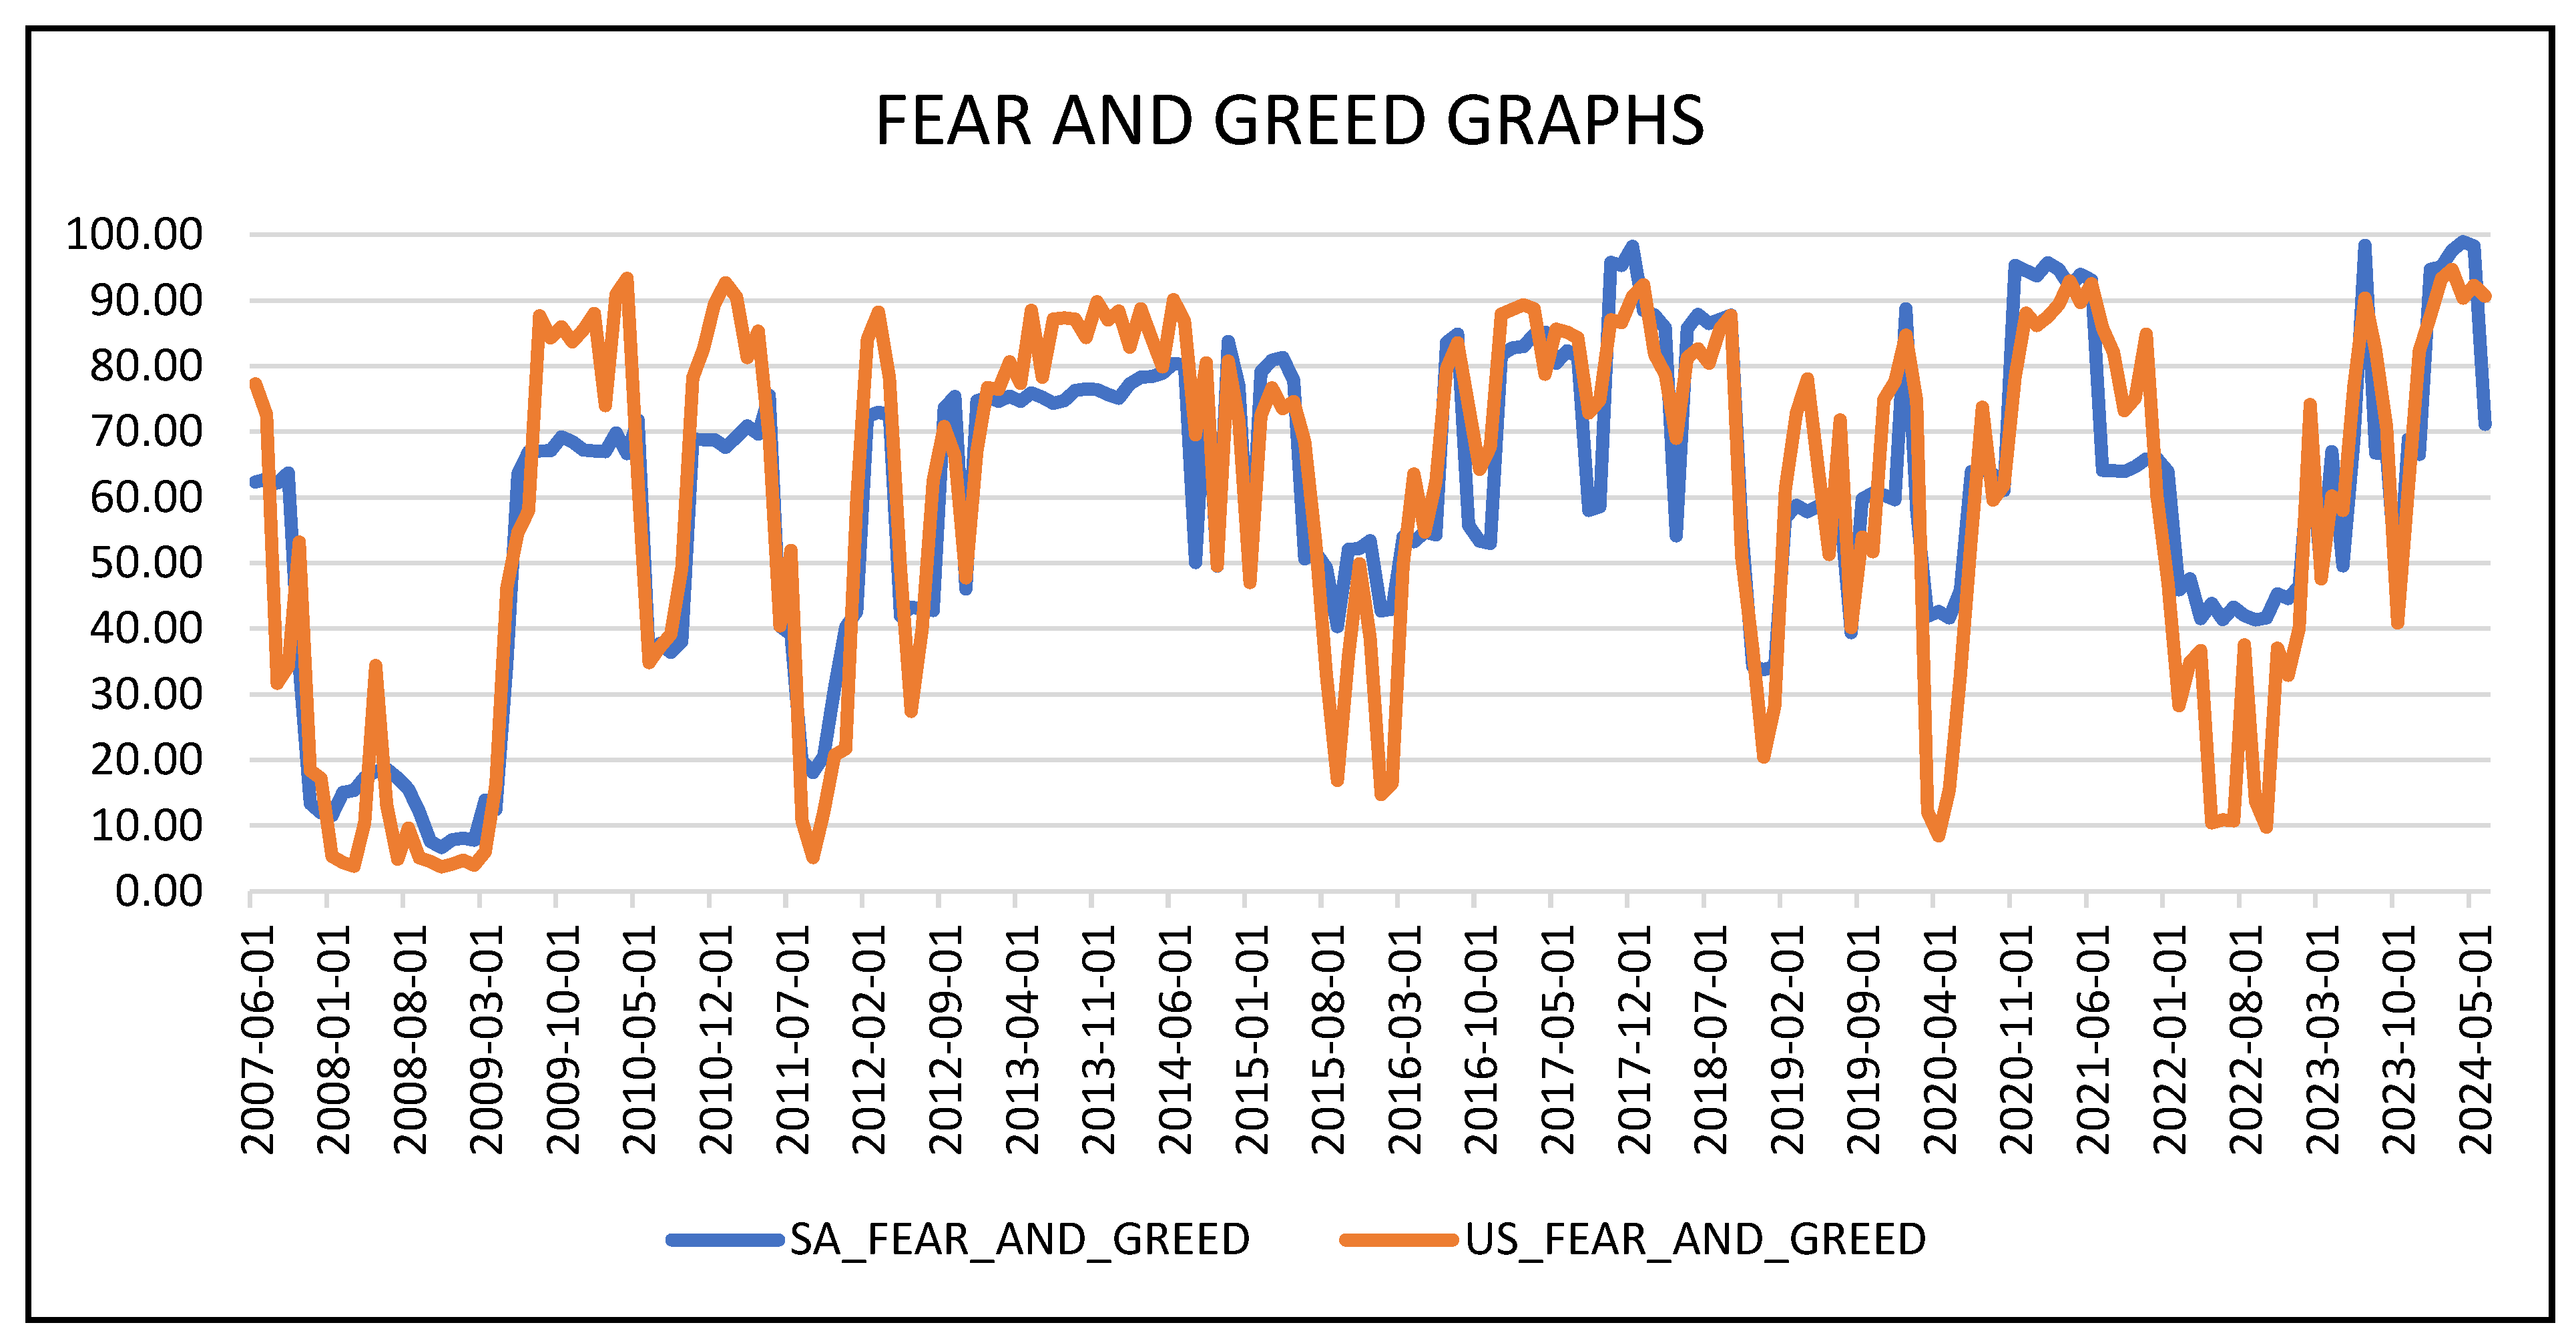
A composite graph of the SA and USA Fear and Greed variables is taken into consideration in this section’s graphical portrayal. The variables’ descriptive statistics are then carried out. Finally, the PP, KPSS, and ADF are analyzed.
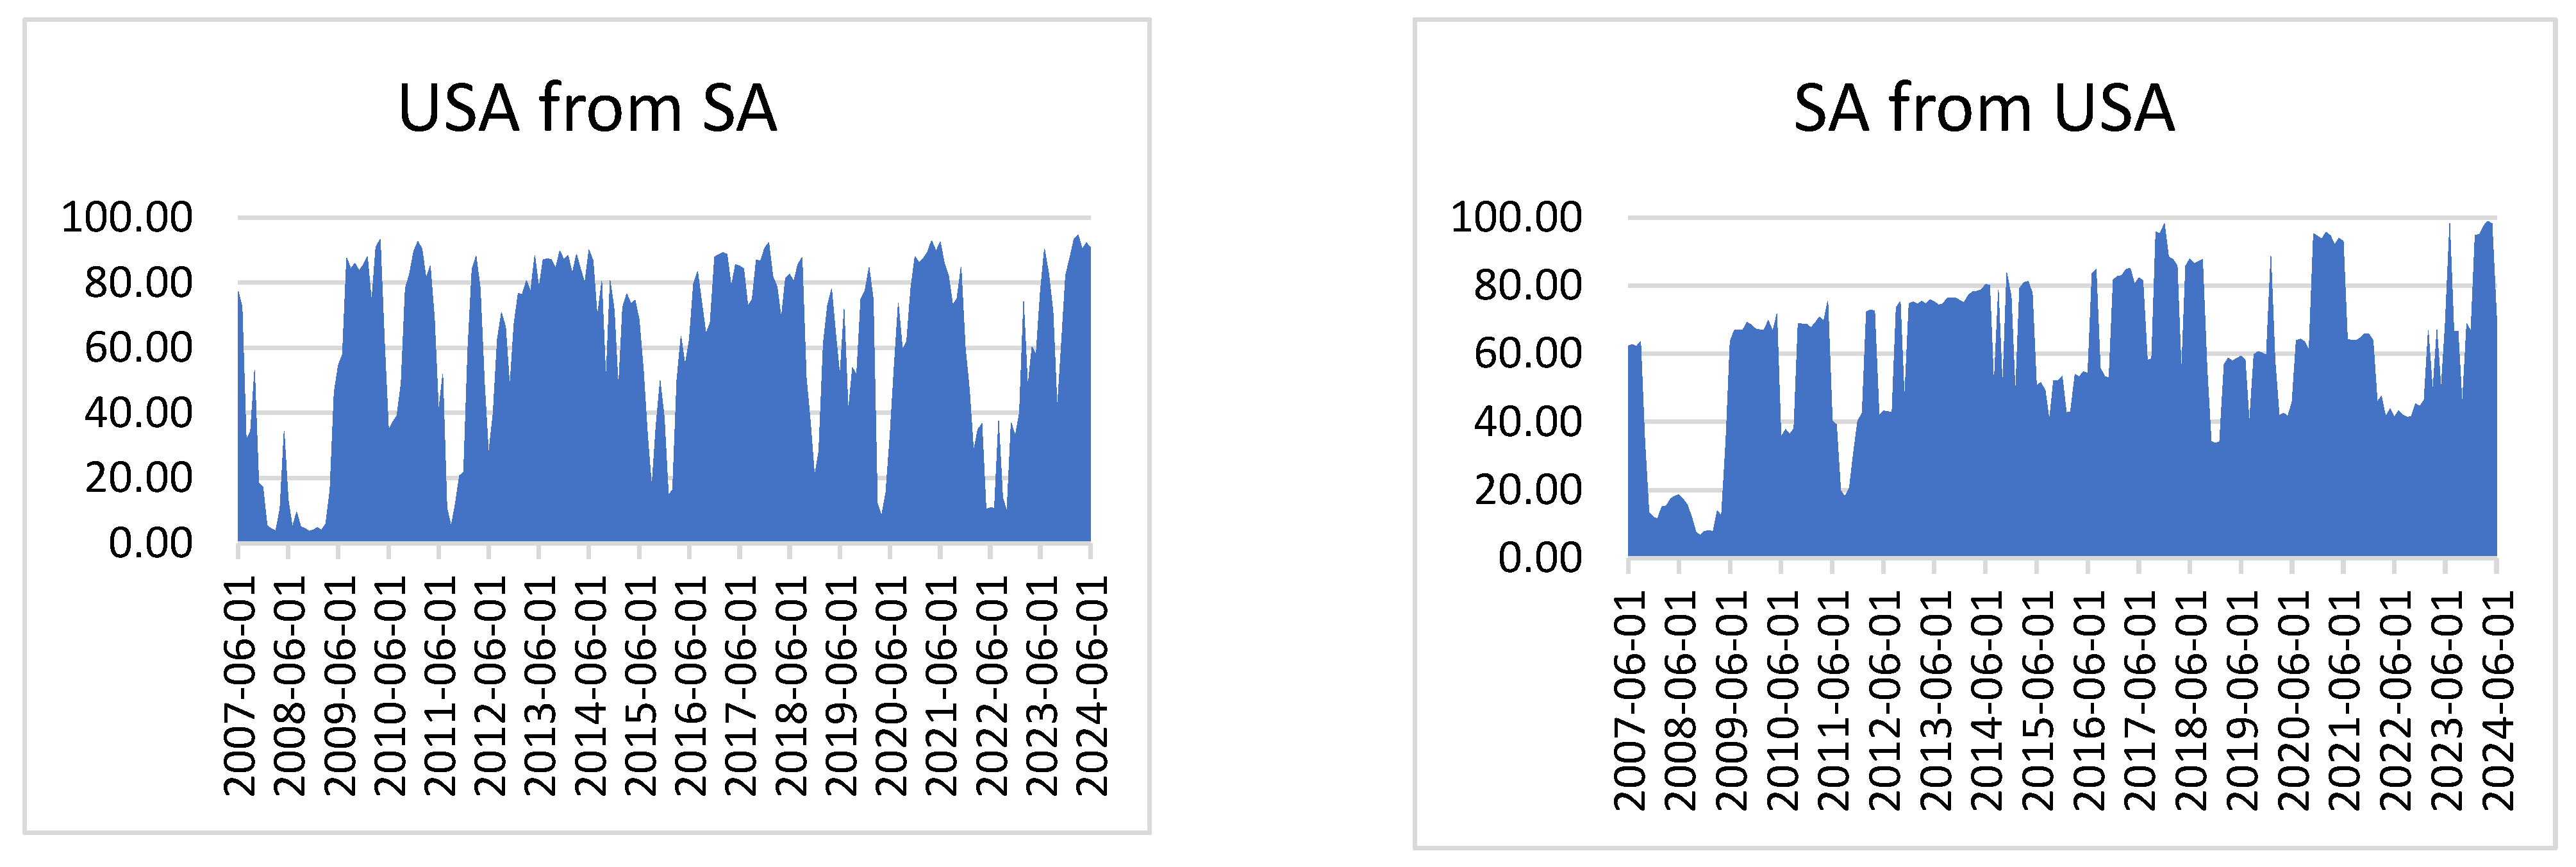
From
Figure 1, graphically, there appears to be quite a high correlation between the U.S. and SA markets. Due to several important considerations, South Africa’s financial markets are heavily influenced by and associated with the United States. The largest economy in the world, the United States, impacts global capital flows, including those in emerging markets like South Africa, through its monetary policies, particularly the Federal Reserve’s interest rate decisions (
Azad & Serletis, 2022). Multinational corporations and commodity exporters comprise a large portion of the Johannesburg Stock Exchange (JSE), which is influenced by both U.S. market trends and global risk sentiment. Furthermore, the value of the rand and the dynamics of commerce in South Africa are impacted by the U.S. dollar, the primary global reserve currency (
Yilmazkuday, 2022). This high association is further supported by the fact that similar market moves in South Africa are frequently triggered by investor sentiment, risk appetite, and geopolitical developments in the United States.
The overall index for each nation varied between 0% and 100%, with greater variations at particular periods, as shown in
Figure 1. During the period, the Fear and Greed Index did experience some major lows, indicating fear, as can be seen in
Figure 1. The lows experienced were below 40, mainly occurring during the 2008 financial crisis, the COVID-19 pandemic, the war between Russia and Ukraine in 2022, and the interest rate hiking cycle. Other than those significant periods, the Fear and Greed Index remained above a score of 40, indicating neutral-to-greedy periods. The global financial crisis had an effect outside of the industrialized economies as well. The crisis had a negative impact on emerging market economies and developing nations, including South Africa. Significant financial withdrawals, a decline in actual foreign investment, and a decline in the demand for and prices of export commodities—particularly mineral exports—were the main ways that the crisis affected South Africa. The nation experienced severe macroeconomic imbalances as a result. As a proportion of gross domestic product (GDP), the current account deficit increased from roughly 1.1% to 5.8%. South Africa’s GDP growth rate dropped from 1.8% in the final quarter of 2008 to −3.2% in the second quarter of 2009. Inflation increased to about 9.9% due to rising commodity prices. The nation had massive job losses, which led to a record-high actual unemployment rate of 32% (
Rena & Msoni, 2014). Due to multiple stock market meltdowns brought on by the COVID-19 pandemic, which led national economies to stagnate, the indices in various countries increased to varying degrees at the start of 2020. Since the financial markets were naturally vulnerable to a number of uncertainties, most indexes experienced significant fluctuations during this period as investors were unsure of the stock market prospects. Significant occurrences had a negative impact on investor mood, which in turn influenced investment practices (
Liu et al., 2023). From
Table 1, volatility measured by the standard deviation shows that the USA experienced more volatility periods compared to SA, with a score of 0.826223 vs. 0.560552. The means and medians between both countries are similar, as well as both being negatively skewed, highlighting the likelihood of extremely low values. However, SA has a higher kurtosis, indicating more outliers and extreme values than the USA.
From
Table 2, based on the ADF and PP tests, all variables are stationary at a significance level of 1%, except for the SA Fear and Greed, stationary at a significance level of 10%. When first differenced, the ADF and PP tests indicate that the variables are stationary at a significance level of 1%. When applying the KPSS test at the level, both variables are stationary at a significance level of 10%; however, after first differencing, they are stationary at the level at a significance level of 1%.
4.1. Static Analysis of International Spillover Effects of Investor Sentiment
The VAR model shown in Equation (1) is estimated using the Fear and Greed Investor Sentiment Index for the U.S. and South Africa. Several spillover measures are then calculated, including the total spillover index, total directional spillover to others, and total directional spillover from others. The investor sentiment spillover matrix for Fear and Greed is shown in
Table 3. The diagonal elements in
Table 3 specifically show the spillover impact of each nation on itself. Because shifts in opinion initially impact a country’s own financial markets, this kind of effect is the largest in comparison to spillover effects on other nations. The total directional spillover from one country to every other nation in the system, and from every other country to that country, is represented by the off-diagonal column sums (“to”) and row sums (“from”), respectively. The total spillover index, which is the sum of the off-diagonal elements divided by two, is displayed in the lower right corner. Overall, the cross-border contagious effect accounts for 37.7% of investor sentiment changes in the two nations, confirming spillover and suggesting that spillovers in other nations have impacted attitudes. The impact of emotion is likely to be conveyed through trade and capital flows (CFs), as well as through direct and indirect economic linkages between nations.
Baker et al. (
2012) concluded that international CFs are one of the pathways for cross-country spillovers. Cross-regional sentiment contagion was one of the primary drivers of global sentiment formation (
Liu et al., 2023).
A total of 95.7% of the variance in the USA’s own forecast error may be explained by its own variance contribution. The USA is mostly affected by its own shocks, and it accounts for 71.1% of the variance in the SA’s own forecast inaccuracy, while SA accounts for 28.9% of its own variance contribution. This implies that the SA is greatly influenced by outside sources, such as the USA. Shocks from the SA account for just 4.3% of the variance in the USA when directional spillover is taken into account. This indicates that the SA has little sway over the USA. Nonetheless, the USA accounts for a fairly significant amount (71.1%) of the variance in SA. This implies that the USA is a key source of shocks impacting SA and that the USA has a considerable spillover effect on the USA as well as a powerful shock transmitter, since it has a big effect on SA. Currency fluctuations and monetary policy transmission are clear examples of the spillover effects between South Africa and the United States. Global capital flows are affected when the U.S. Federal Reserve modifies interest rates, and investors frequently move toward safer U.S. assets, depreciating the South African rand. Additionally, a stronger dollar increases the cost of imports into South Africa, which fuels inflation (
Kabundi et al., 2020). On the other hand, monetary easing in the United States may raise risk appetite and encourage capital inflows into developing nations such as South Africa. The South African Reserve Bank (SARB) must balance internal economic conditions with foreign shocks to maintain currency stability and control inflation; therefore, changes in U.S. inflation, bond yields, and global liquidity conditions also impact SARB policy decisions (
Kabundi et al., 2020).
Yonis (
2011) analyzed VAR based on two lags and found evidence of return spillover from the NYSE to the JSE. Empirical findings from the analysis of the MA-GARCH model show that the volatility spillover between the U.S. and SA is persistent. Accordingly, the analysis concludes that the U.S. market significantly impacts the movement of stocks in the South African market. This is consistent with the findings of
Kalu et al. (
2020) and
Kabundi et al. (
2020). To add depth to the discussion, the study compares these findings with those of
Tran and Pham (
2020), who discovered that emerging economies may suffer from U.S. monetary policy shocks. Their findings imply that the benefits of spillover effects may not be consistent across regions, policy types, and transmission channels. Using this discrepancy, the study contends that the process and impact of sentiment-based spillovers may be different from those of monetary policy-based ones. The findings are given more nuance by this critical lens, which implies that although behavioral transmission from the United States does affect South Africa, the type and impact of this influence should be evaluated differently than typical economic spillovers.
Through direct trade, international market dynamics, and economic policy, the United States significantly affects South Africa’s commercial ties (
Sibizo, 2023). With accords like the African Growth and Opportunity Act (AGOA), which allows duty-free access to specific items, the United States, which is one of South Africa’s main trading partners, has opened its markets to South African exporters. Global commodity prices are also influenced by U.S. trade policies, consumer demand, and economic conditions, which affect South Africa’s resource-based economy immediately. South Africa’s export earnings and import expenses are impacted by the strength of the U.S. dollar, which also impacts trade competitiveness (
Mhaka & Jeke, 2018). Furthermore, by altering global supply chains and demand patterns, U.S. relations with other economies, such as China and the EU, indirectly influence South Africa’s trading environment. With the USA to SA spillover level at 71.1%, as expected, and the SA to the USA spillover level at 4.3%, the mutual spillover effects between SA and the USA are high when these diagonal factors are taken out of the equation. The two nations’ net spillover is 66.8% from the former to the latter. Since the USA is a highly developed nation with substantial levels of capital openness and better ties between financial markets and economic exchanges, spillover effects are more significant. It is possible to conclude that industrialized nations, which have greater levels of economic openness and more frequent international commerce, have higher amounts of international spillover and spillback (
Liu et al., 2023). Developed nations have a high level of engagement, early financial liberalization, high levels of foreign direct investment, and robust economies in the global financial system. When their investor attitude drastically shifts, it causes the nation’s capital market to fluctuate significantly. It transfers uncertainty to other countries, particularly developing ones like South Africa, which affects investor sentiment in other countries. Similar results were found in the studies by
Kalu et al. (
2020),
Kabundi et al. (
2020), and
Liu et al. (
2023). It is crucial to recognize opposing viewpoints even if the results indicate that changes in U.S. investor sentiment have a major and direct impact on the South African stock market, confirming the findings of
Kalu et al. (
2020),
Kabundi et al. (
2020), and
Liu et al. (
2023). The effect of U.S. macroeconomic shocks on South African financial volatility, for example, is asymmetrical and heavily contingent on the type of shock, according to
Esin and Gupta (
2017). Their research specifically demonstrates that while negative news has no statistically meaningful impact on SA market volatility, positive news regarding U.S. inflation does. Additionally, market risk is less reduced by unexpected rises in U.S. unemployment than by risk increases brought on by unexpected drops in unemployment. These results suggest that South Africa’s financial conditions and volatility react to outside shocks in a complex and non-linear manner. This stands in contrast to the more consistent sentiment contagion that our analysis indicated, highlighting the need for more research to separate the economic transmission of news events and policy shocks from the behavioral transmission of emotion. By taking these differences into account, sentiment indices may become more predictive, and the policy implications for developing countries like South Africa may be improved.
4.2. Dynamic Analysis of International Spillover Effects of Investor Sentiment
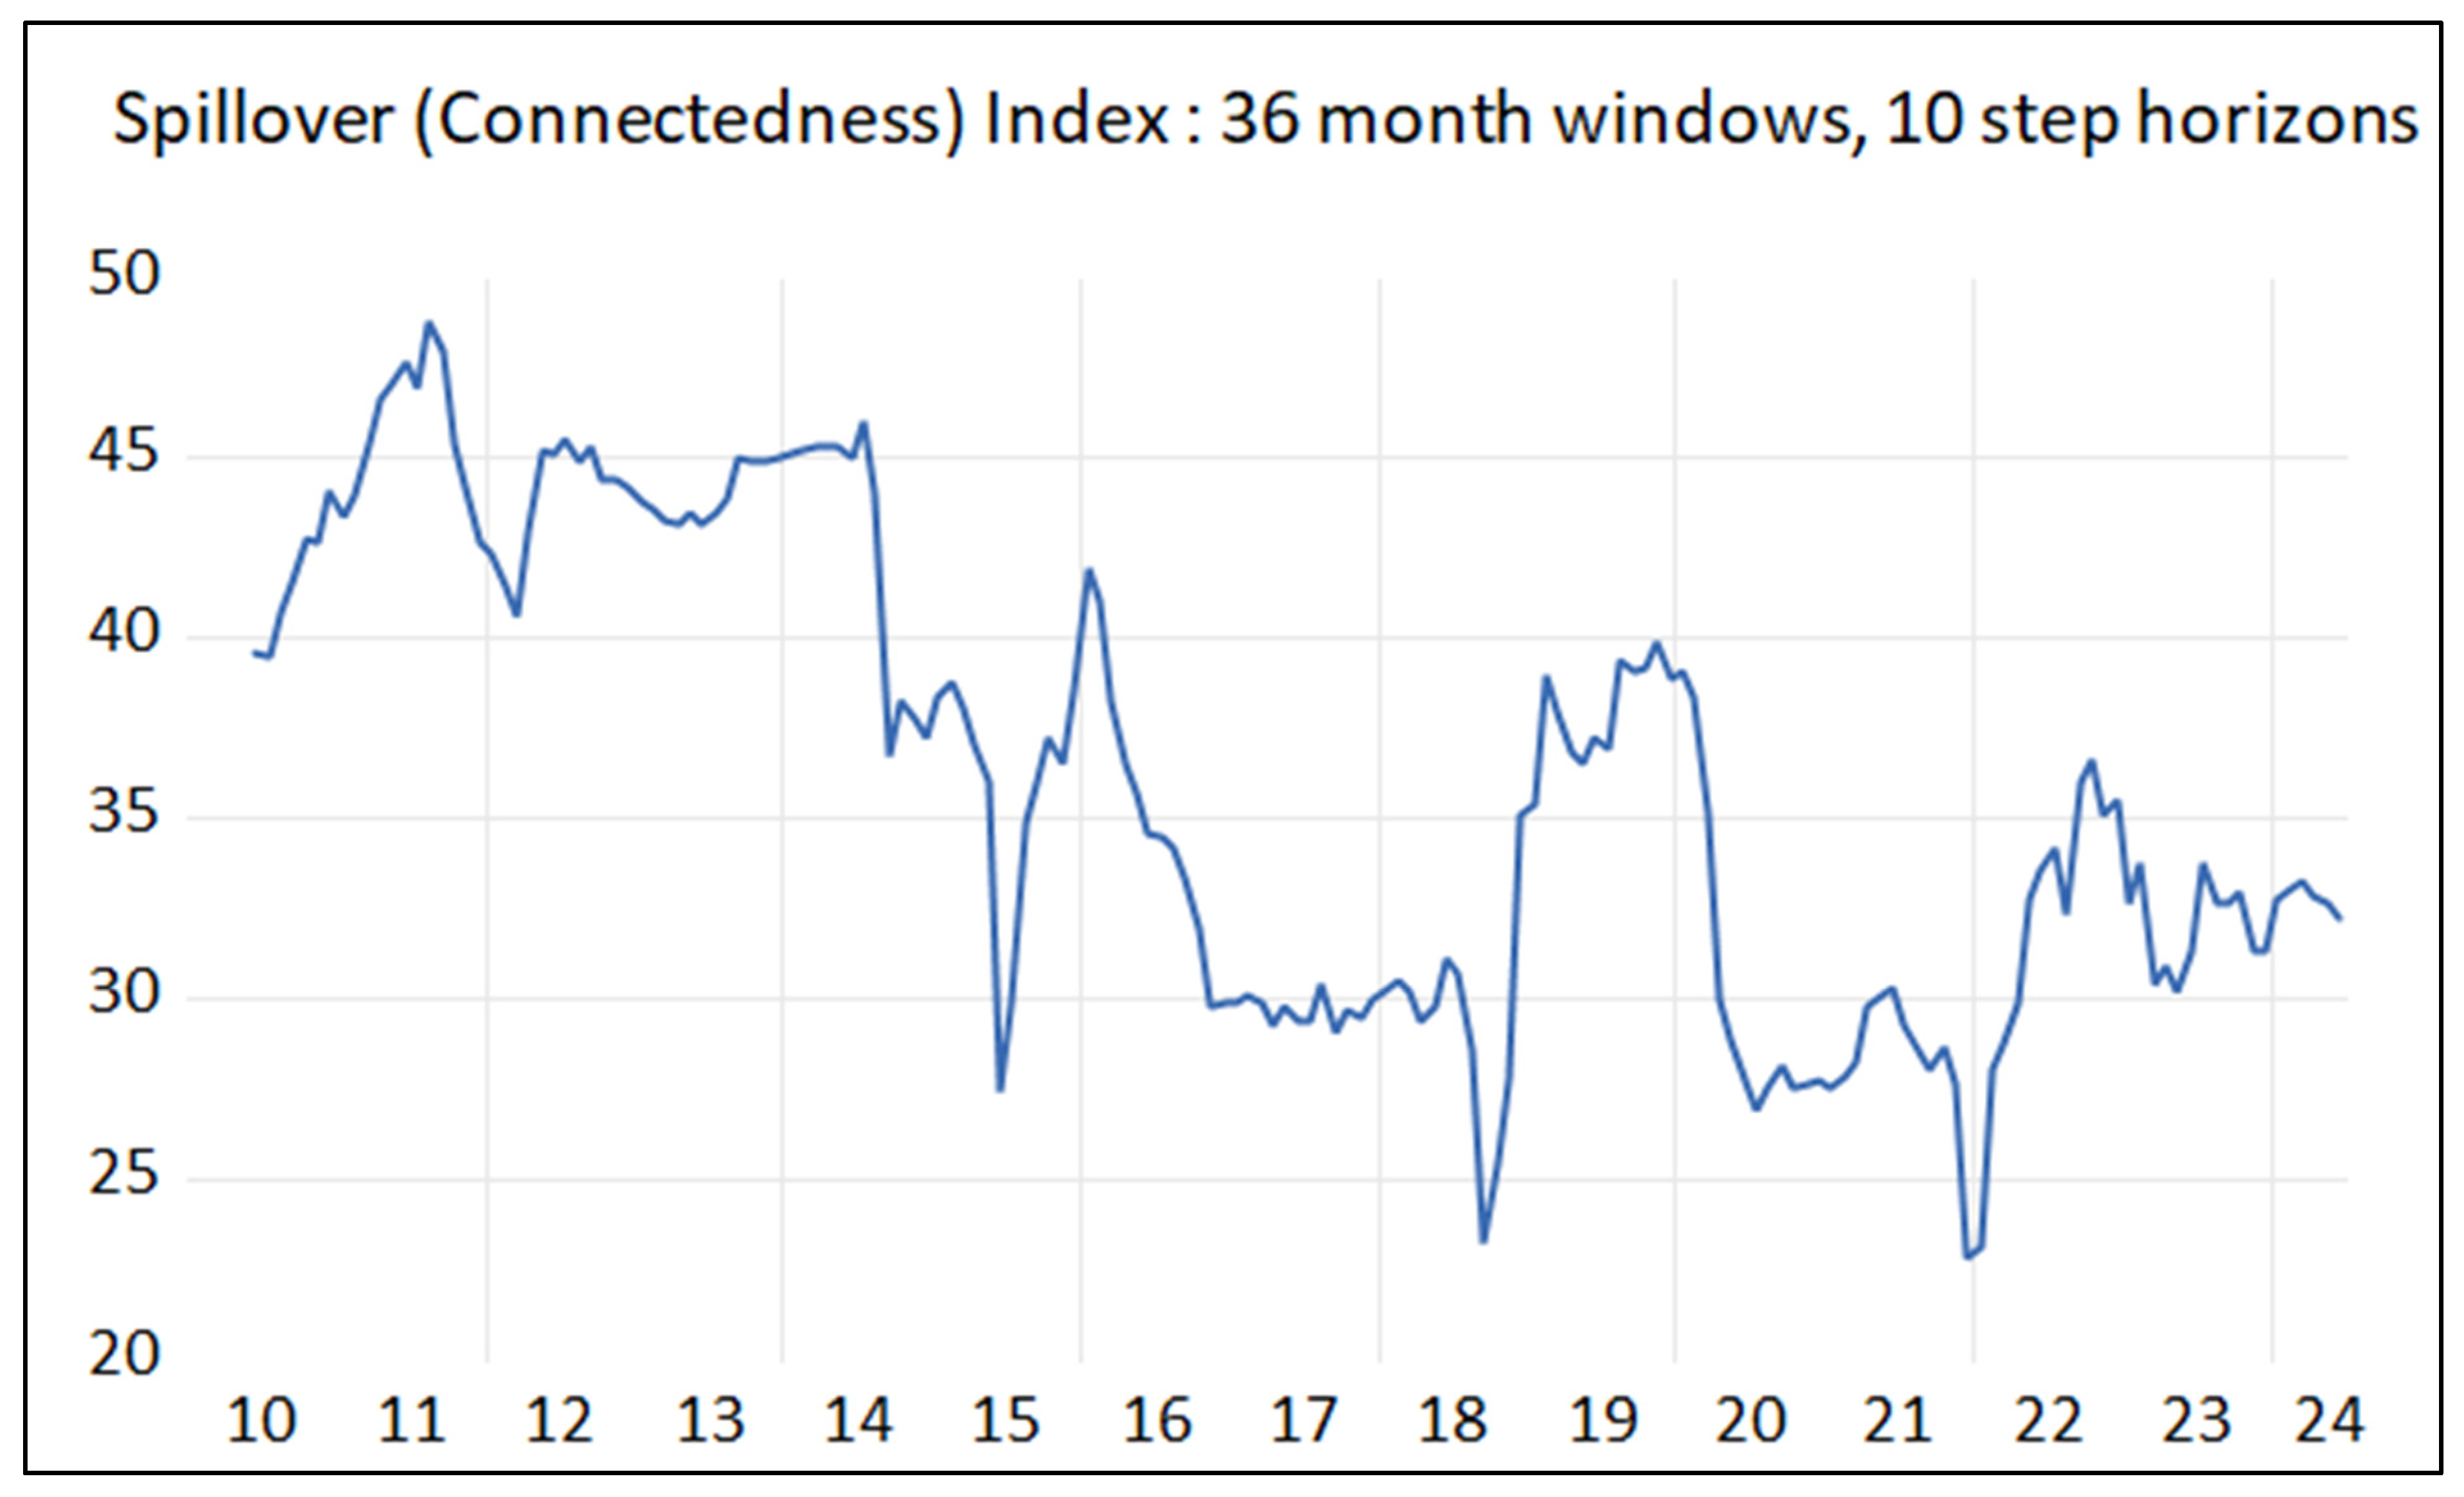
This study used a rolling sample of 36 months to gauge the total degree of sentiment spillover among foreign investors. The entire spillover index, as shown in
Figure 2, varies between roughly 30% and 48%, which reflects the features of cross-country spillover and is in line with the static analysis discussed in the previous section.
The following major geopolitical shocks caused several significant changes in the overall level. The fluctuation level is very similar to that shown in
Figure 2. First, the ensuing financial and European sovereign debt problems caused the sentiment to climb steadily, reaching a peak of 49% in 2011. Second, China’s stock market fell in 2015–2016 along with Brexit and Sino–U.S. trade tensions, which led to a violent and more frequent fluctuation of up to around 41% in the spillover index. Third, between 2018 and early 2020, changes in commodity prices and trade dynamics caused by global trade disputes, especially those between the United States and China, had an indirect impact on South Africa’s economy. In addition, the COVID-19 pandemic began to spread over the planet. Governments responded by implementing expansionary monetary policies, including quantitative easing and interest rate reductions. The overall spillover index rapidly increased to almost 40%. However, the sentiment fluctuated widely since investors could not establish steady expectations of future stock market movements due to recurrent pandemic outbreaks. The economy eventually stabilized when the epidemic was contained, and the spillover decreased to 23%, suggesting that the extreme events were the primary drivers of the cross-country spillovers and sentiment volatility. Fourthly, due to diplomatic and commercial interactions being impacted by South Africa’s fragile relationship with the United States, as a result of its neutral position on the conflict between Russia and Ukraine, as well as the severe interest rate hiking cycle in late 2022, the spillover index rose sharply to 36%.
Fratzscher (
2012) discovered that cross-border CF, which is crucial for disseminating investor sentiment, can significantly impact global push factors (
Baker et al., 2012). Thus, the study concluded that investor sentiment contagion between nations becomes more severe when extreme global events occur. This is in line with the findings of
Baker et al. (
2012),
Fratzscher (
2012), and
Liu et al. (
2023). However, this interpretation may overestimate the consistency and severity of behavioral transmission during geopolitical events, even though the spike in the spillover index to 36% during South Africa’s neutral stance on the Russia–Ukraine conflict and the aggressive U.S. interest rate hikes in late 2022 suggests heightened sentiment contagion. Not every worldwide upheaval results in greater spillover of investor sentiment. For instance,
Ehrmann and Fratzscher (
2009) contend that domestic macroeconomic fundamentals, institutional credibility, and market openness all influence the direction and efficacy of cross-border attitude spillovers. Instead of intensifying foreign sentiment shocks, South Africa’s structural market frictions and political unpredictability may act as a buffer or a source of distortion. Furthermore, research by
Beirne et al. (
2013) shows that during times of global financial stress, capital flows frequently become more selective, favoring markets that are thought to be more stable or removed from the shock’s epicenter. As a result, whereas severe international events have the potential to exacerbate investor sentiment contagion, the extent and regularity of these spillovers vary by environment and may be mitigated by local investor behavior and policy reactions. This calls into question the notion that external rate shocks or geopolitical neutrality inevitably result in increased sentiment transmission to developing countries such as South Africa.
4.3. Directional Spillover Levels of International Spillovers of Investor Sentiment
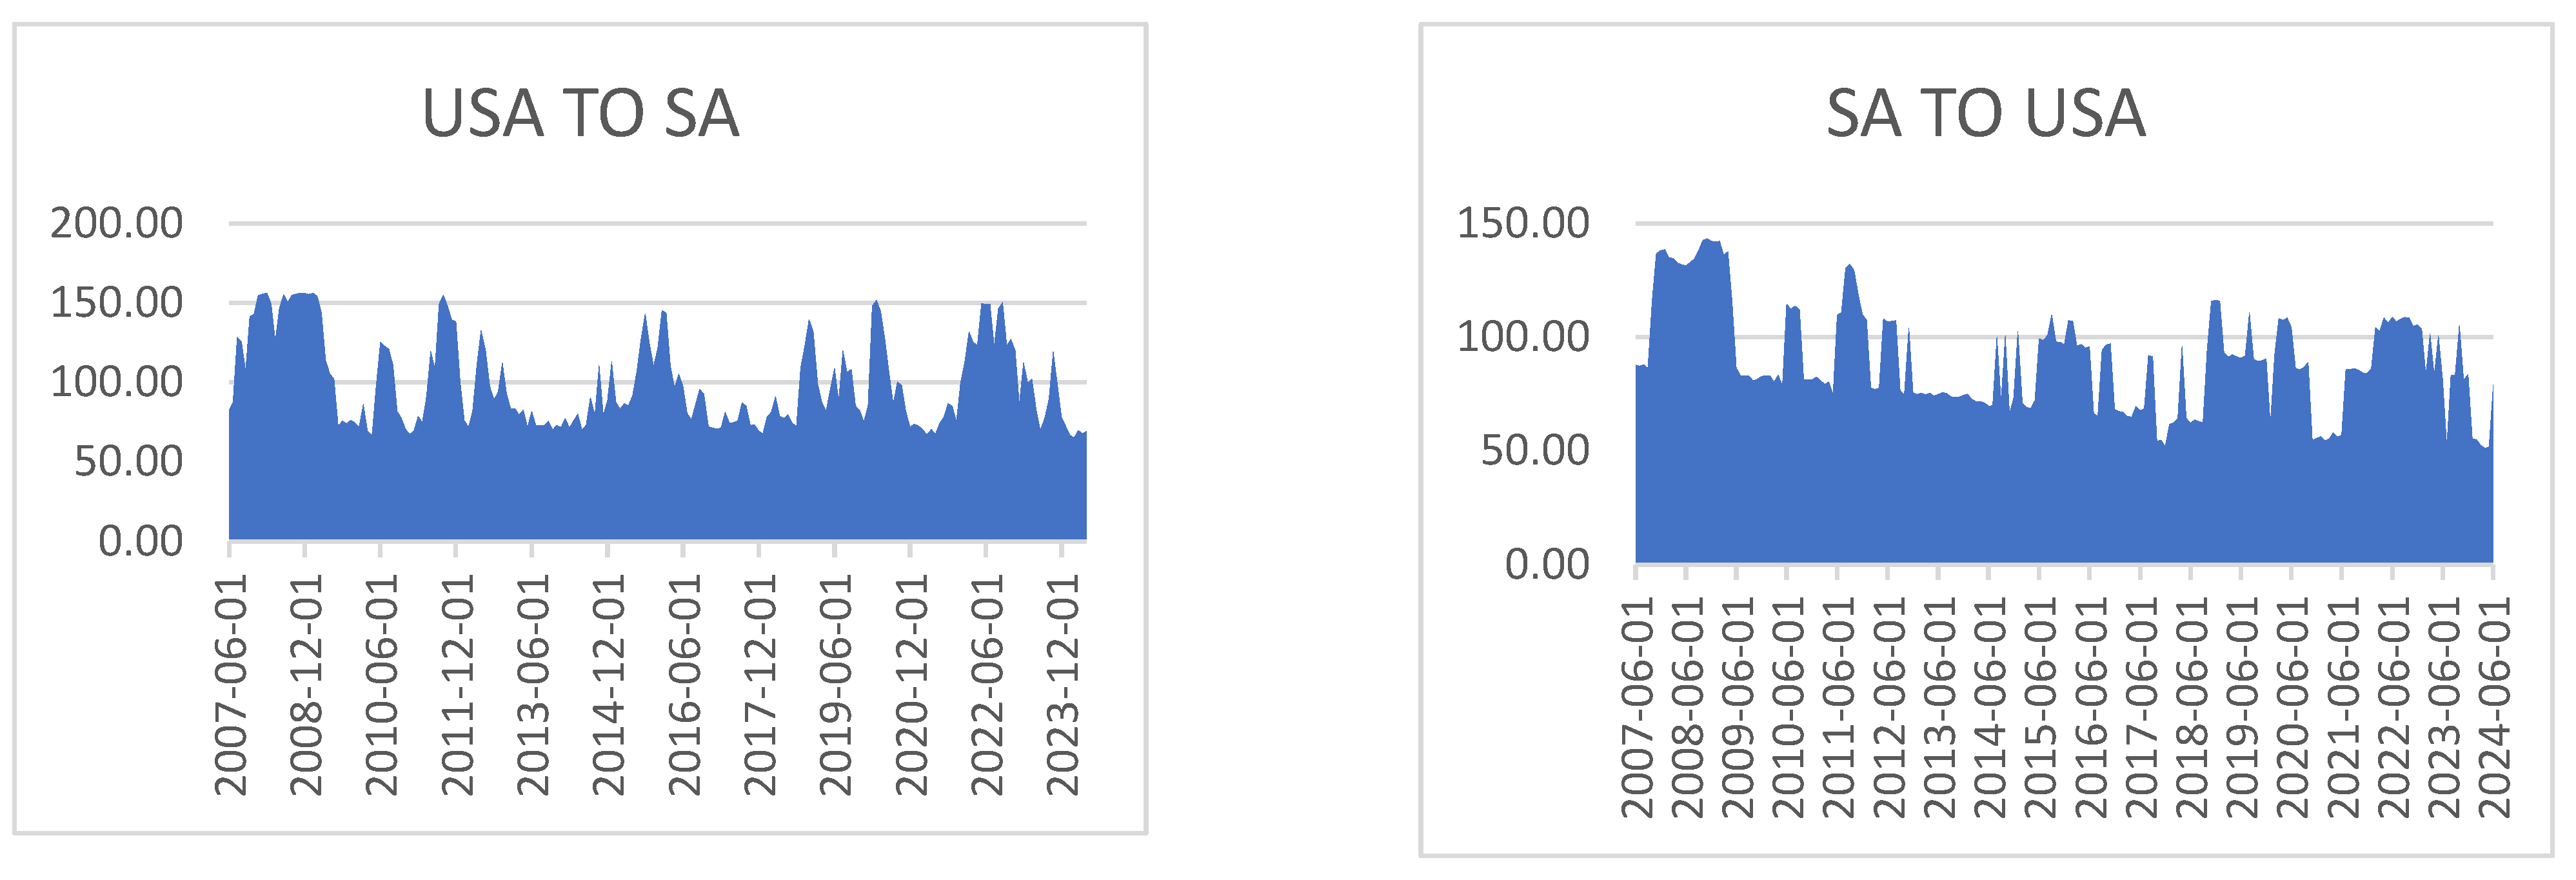
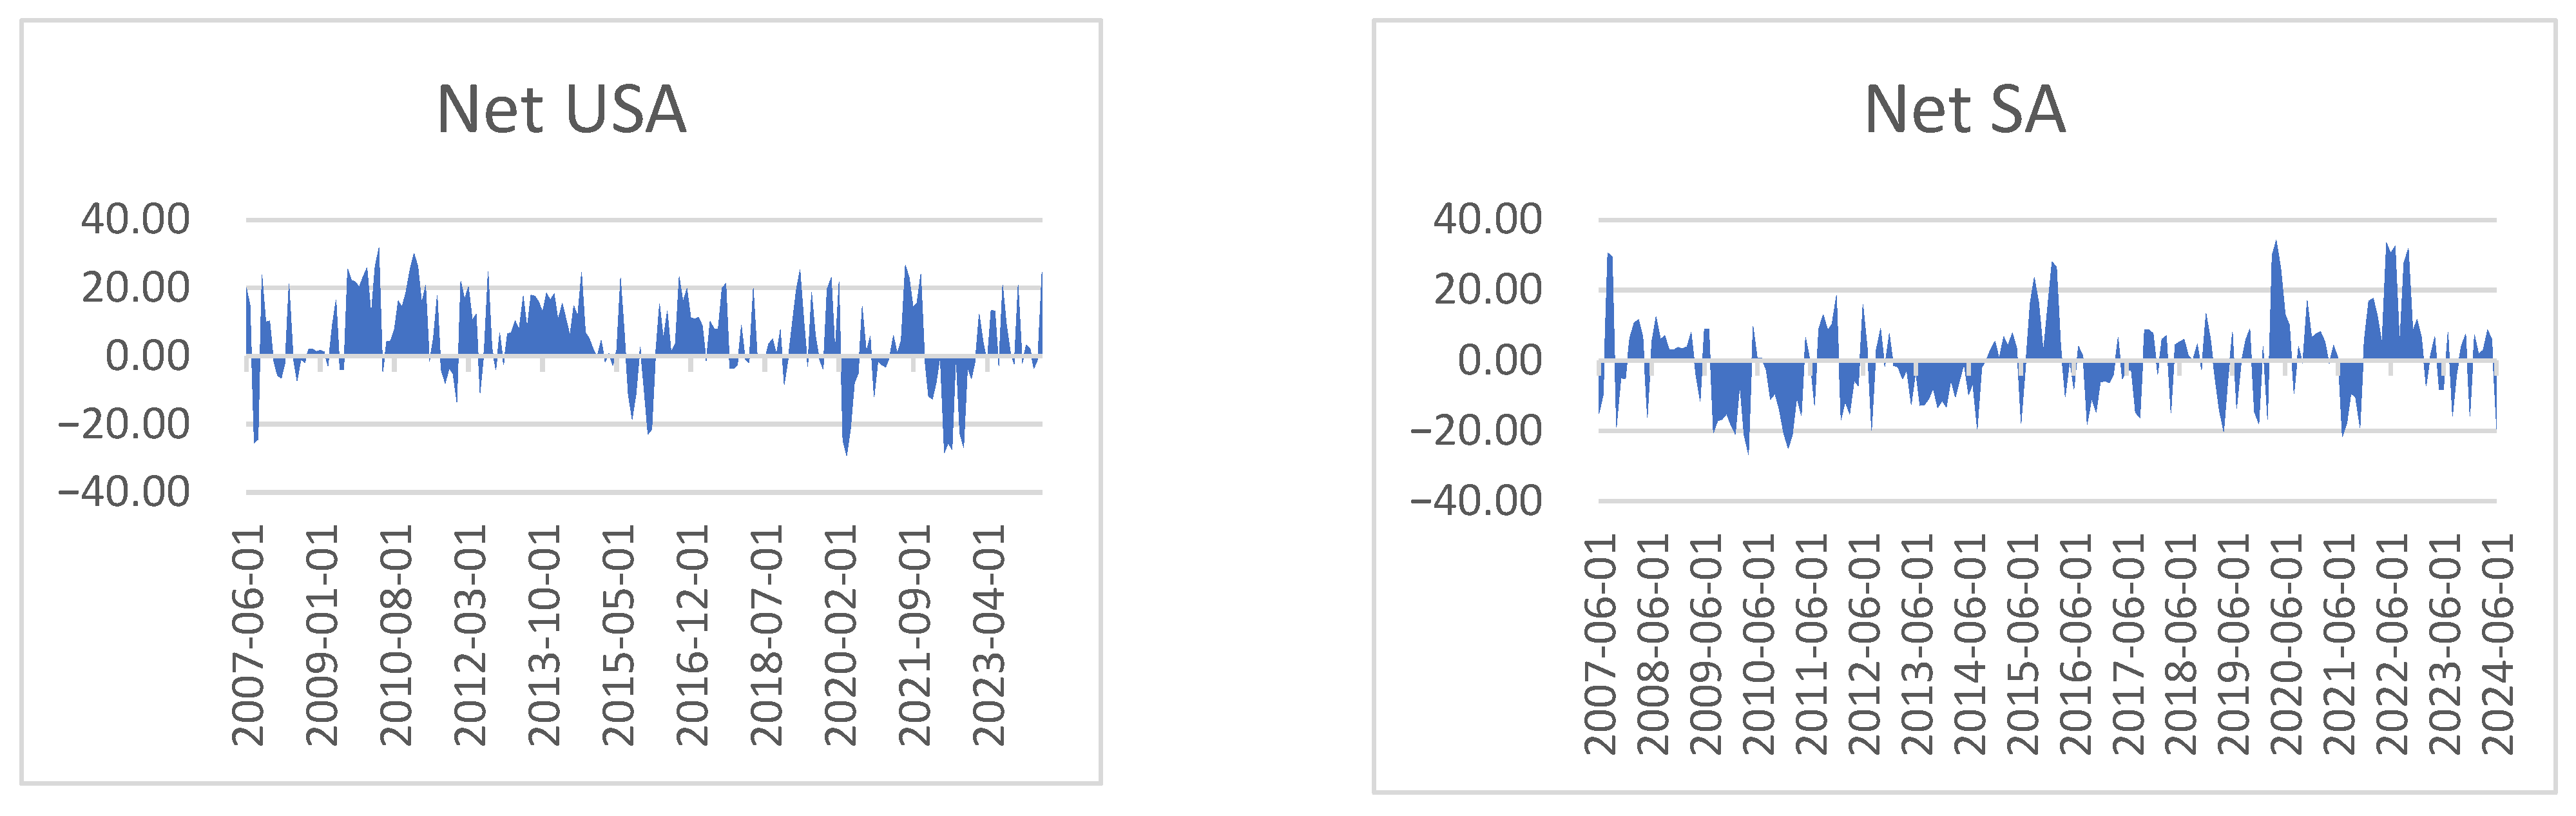
The overall level of cross-country investor sentiment spillover describes the features and intensity of the overall spillover between the two nations. To avoid significant risks and preserve the stock market’s stability, it is critical to analyze the degree and direction of spillover and spillback in each nation. In order to investigate the time-varying features of the directional spillover in each nation, this study utilized dynamic spillover and spillback indices. The dynamic levels of directional spillback (FROM other countries), directional spillover (TO other countries), and net spillover are depicted in
Figure 3,
Figure 4, and
Figure 5, respectively. There is a clear distinction between the volatility of the spillover and spillback levels in
Figure 3 and
Figure 4. Because the cross-country contagion of emotion in one nation affects all the countries with which it interacts, they are all subject to spillovers from one another, which reduces the volatility of the spillbacks (FROM other countries). A country’s investor sentiment shocks are disseminated to other nations when sent outward, but the shocks are substantially smaller in each of those nations. The magnitudes of the fluctuations from other nations are, therefore, lower. The notable distinction between spillover and spillback further supports the cross-country spillovers of investor mood.
There are also notable variations in the levels of spillovers and spillbacks for each nation. The directional spillover level fluctuates and is susceptible to significant shocks, just like the overall spillover level. The 2008 financial crisis, the 2020 COVID-19 epidemic, and the interest rate hike cycle affected several nations and had wide-ranging consequences. The external effects on each economy are unpredictable due to each nation’s distinct economic policies and development levels; therefore, proper countermeasures are necessary to lessen the effects of the shocks. The causes of spillovers and spillbacks for each nation would be distinct from those of other nations. However, what can be seen in
Figure 3, throughout the year, South Africa’s market reacts more slowly to economic news compared to the United States due to differences in market efficiency, financial infrastructure, and global influence. While the U.S. benefits from algorithmic trading and rapid information dissemination, South Africa relies more on traditional financial institutions and has a smaller analyst base, leading to delayed price adjustments. Additionally, significant international economic events often occur outside of South African market hours, further hindering timely responses. The reliance on external data sources also complicates the incorporation of new information into asset pricing and market sentiment. The directional spillovers in
Figure 3 rise to about 90% during volatile times, whereas the spillovers from each market are less than 5% during calm times. This is explained by behavioral finance; cognitive biases, including overreaction, loss aversion, and herd mentality, cause markets to respond more strongly to unexpected news. While unexpected occurrences cause emotional reactions and increased volatility, expected news is typically factored in gradually, resulting in subdued responses. Investors react asymmetrically, with negative shocks leading to steeper drops and good surprises leading to increases (Prospect Theory), and they frequently overreact to recent dramatic occurrences (availability bias). Because uncertainty prompts quick re-evaluations of risk and investment choices, this leads to impulsive market swings. Furthermore, from
Figure 4, because of the relative size, global importance, and economic might of the two nations, news flow from South Africa to the United States has less sway than the opposite. Since the United States is the world’s most significant economic and financial center, its business profits, monetary policies, and geopolitical actions significantly impact the world. As an emerging market, South Africa, on the other hand, has a smaller and less globally integrated economy, which means that its domestic news has less effect on global markets. Furthermore, because U.S. investors and institutions rely on U.S. markets, they are less sensitive to changes in South Africa since they have less exposure to South African assets. Furthermore, unless significant geopolitical or commodity market ramifications exist, SA events receive less coverage from the U.S.-centric global financial media, emphasizing American news.
Figure 5 shows a high correlation between the difference between the level of spillover and spillback and the level of national development. Developed nations with significant capital power, like the United States, are typically at the net spillover level. Since sentiment in these nations tends to ebb and flow, it is more likely to impact other nations. It is important to note that the U.S. net spillover index was high for a while during the Great Financial Crisis, suggesting that investor sentiment in other nations (SA) was greatly influenced by that of the United States during this time. From the standpoint of investor attention, the functioning of capital markets in developed nations like the United States became a greater concern for investors from a variety of nations following the financial crisis. Investors actively gathered and disseminated information through a variety of media outlets during that time. Investors in other nations, particularly developing nations, such as South Africa, are primarily information “receivers,” whereas those in the United States are more likely to be information “distributors.” The sentiment of American investors is, therefore, more likely to spread to South Africa during that time. According to a global macro-perspective on international CF, the post-crisis outflow of global capital to safe, high-quality assets has also somewhat aided in the diffusion of investor attitude. Due to their infrequent CF, lower levels of economic development, and smaller shares in the global market, developing nations like South Africa are more susceptible to the sentiment of foreign investors and are, therefore, frequently at the net level of spillback. Following 2020, South Africa’s net investor sentiment spillover showed a clear increasing trend, indicating that South Africa’s stock market has been more strongly impacted by the global capital market in the U.S. as a result of the capital market’s enhanced opening.
In general, the United States has high levels of spillover, which suggests that countries that experience the most spillovers are developed to developing, such as the United States to South Africa. However, the degree and direction of spillover, on the other hand, are more equal in industrialized nations like the United States. A low degree of capital mobility and occasional economic interactions are indicated by the overall low level of spillover between developing nations, like South Africa, where the highest level reaches only about half of that in the U.S.
Furthermore, from
Figure 5, the USA’s net connectivity varies from positive to negative. According to the periods of strong positive values, the USA is a net transmitter of shocks, which means it influences other markets more than it is influenced by them. The USA is also a net receiver, meaning external shocks impact it, as indicated by the periods of negative values. The USA seems more volatile regarding net connectivity, particularly during global events and financial crises (e.g., COVID-19, the 2008 financial crisis). Although it varies, South Africa’s net connectivity appears less volatile than the United States. It exhibits multiple periods when it is a net recipient of shocks (negative values), indicating that the global market dynamics frequently impact it. There are sporadic surges into positive territory, which indicates that it occasionally sends shockwaves to other markets. Larger fluctuations are shown in the most recent years (2020–2023), likely due to global economic volatility (e.g., COVID-19, inflation, and geopolitical threats). According to larger peaks in positive net connectivity, the USA is a more prominent shock transmitter overall. Although it occasionally transmits, South Africa is mostly more of a receiver. The timing of the spikes indicates that market spillovers increase during global crises (e.g., 2008, 2020), which have varying effects on both countries. Several notable increases in the levels of spillover and spillback greater than 20% between pairs of countries were highlighted during the 2008 financial crisis. Similar circumstances arose during the 2012 European sovereign debt crisis when the impacts of spillover and spillback escalated to differing degrees. The interest hike cycle post-COVID-19, the Russian–Ukraine war, and COVID-19 also showed that when the pandemic started to spread worldwide in early 2020, there was an increase in the cross-country sentiment spillover effects between the nations. This shock demonstrated how sharp changes in their economies had initially impacted their financial markets, then increased investor fear, altering investment habits and jeopardizing stock market stability.
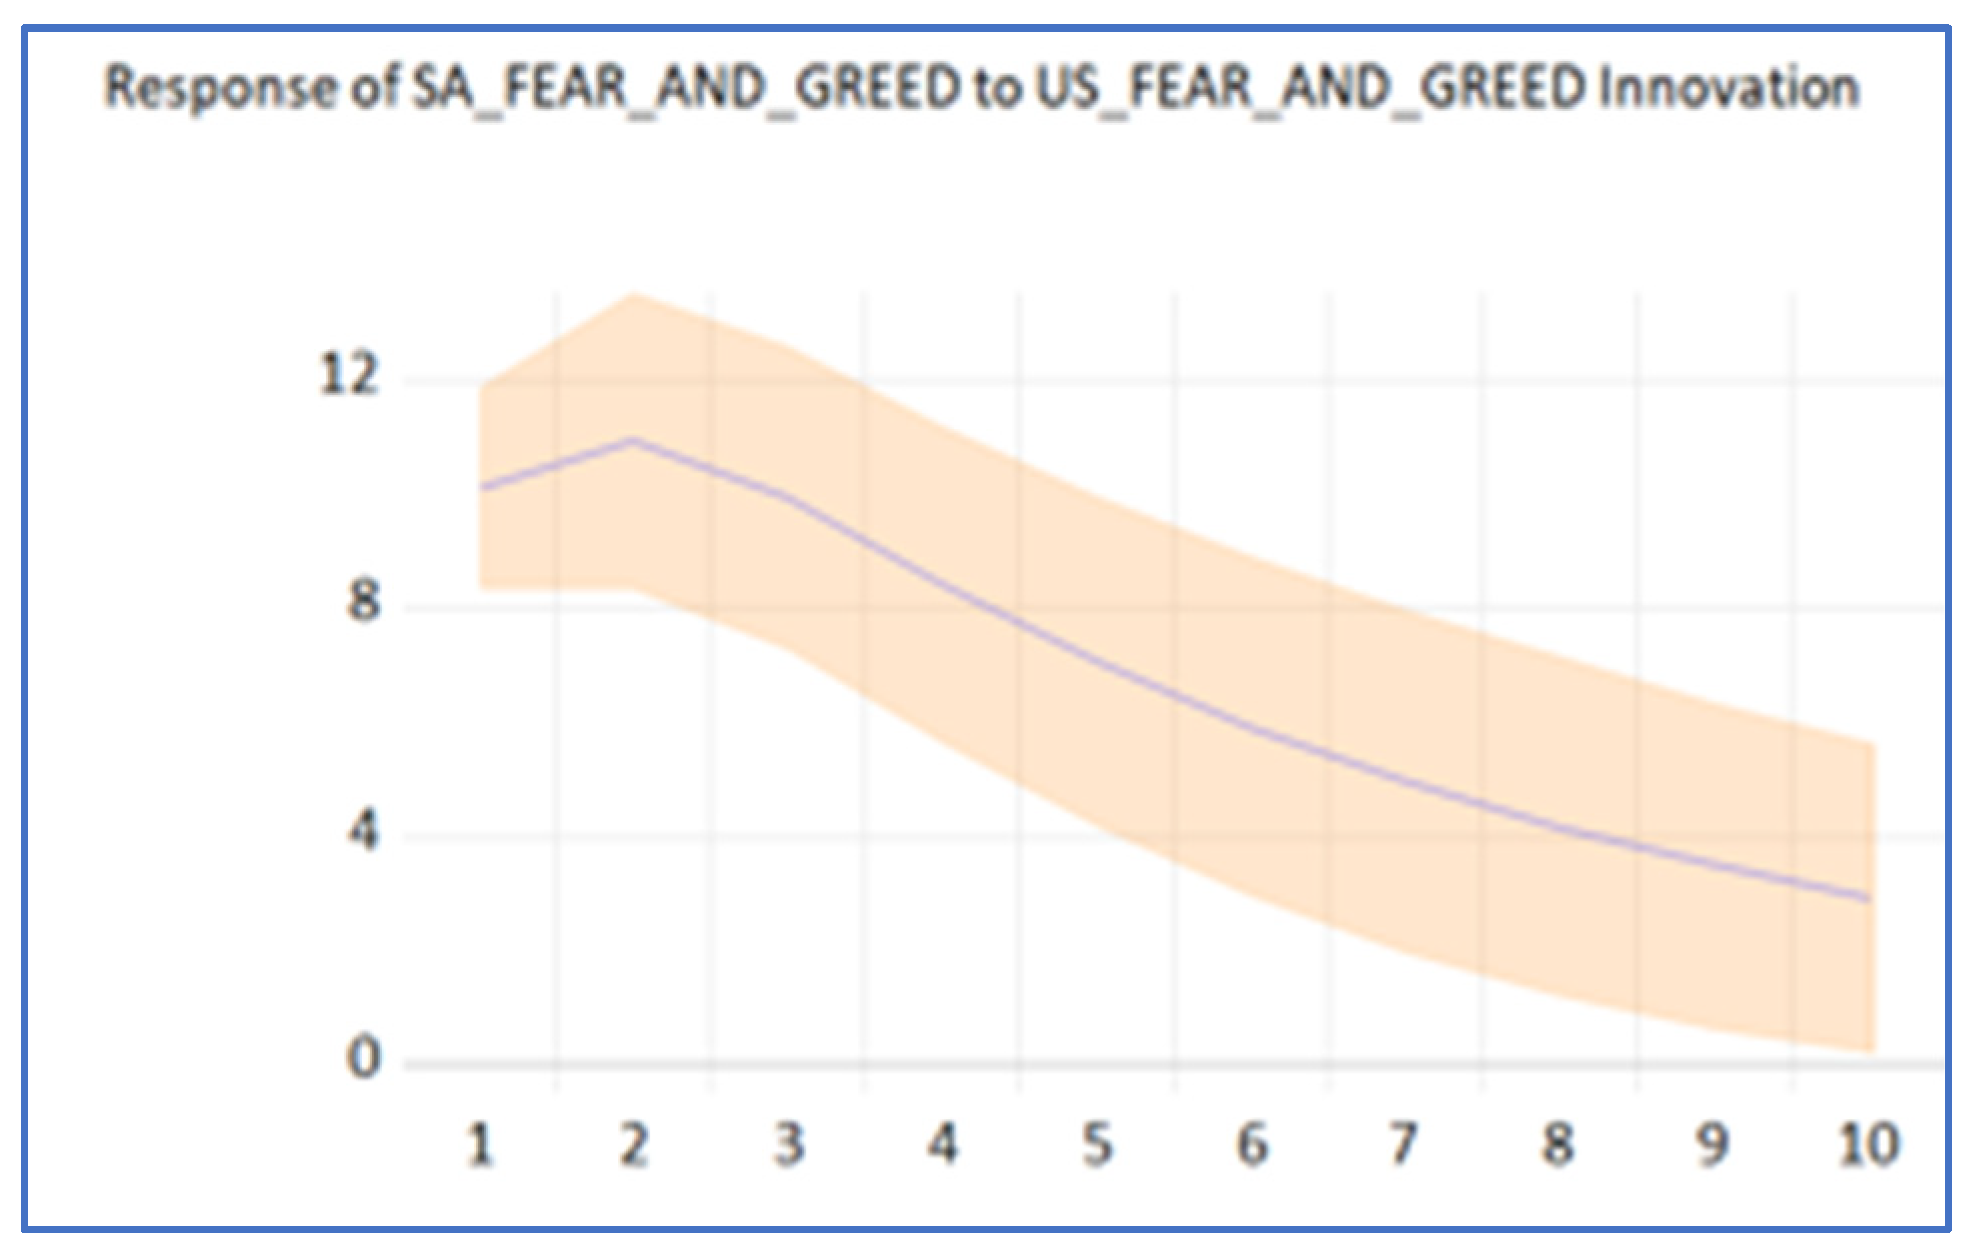
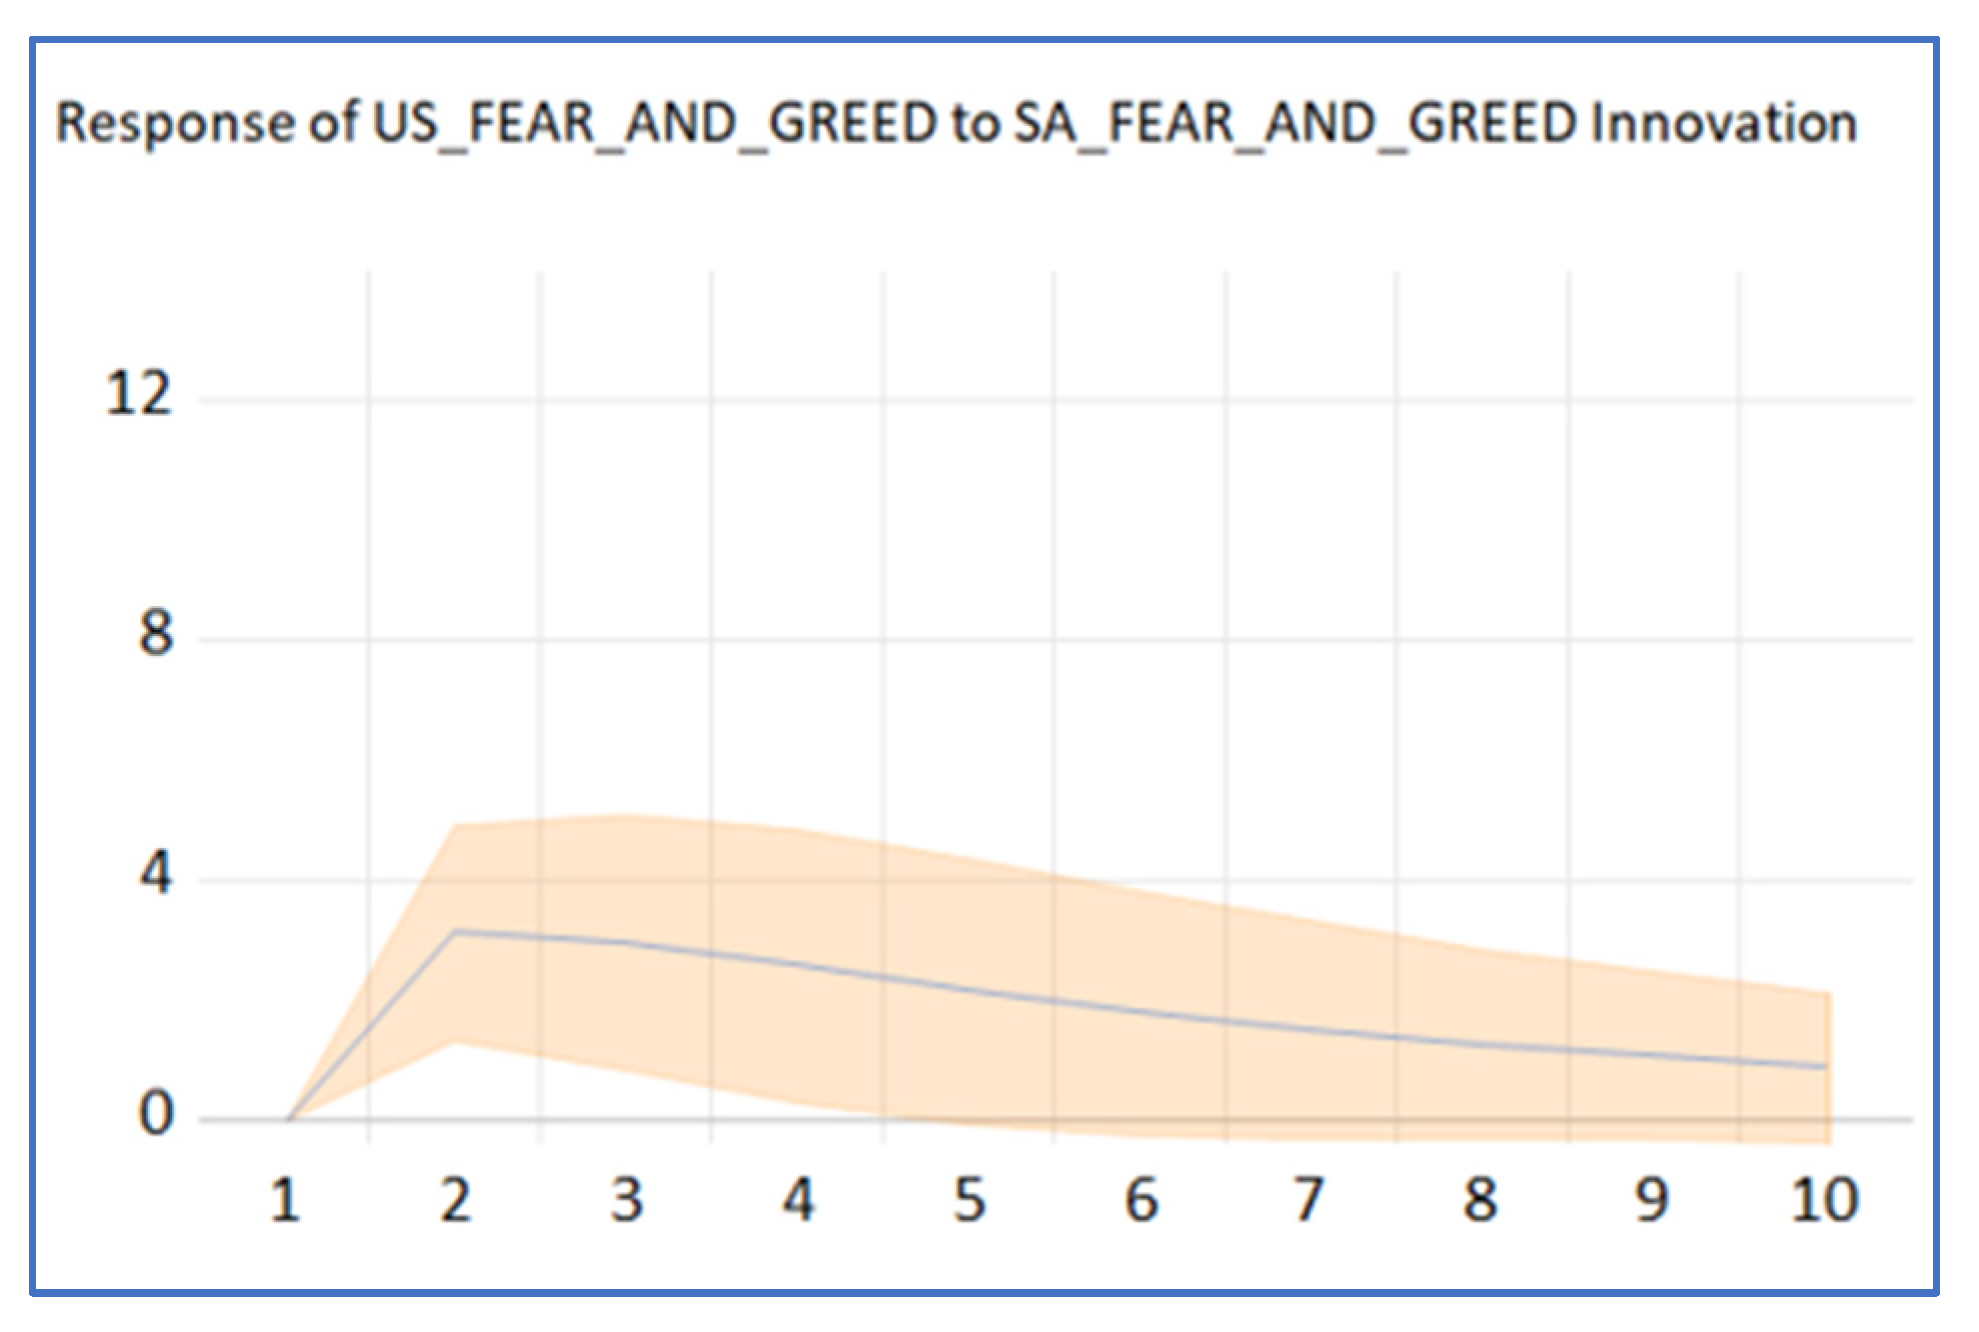
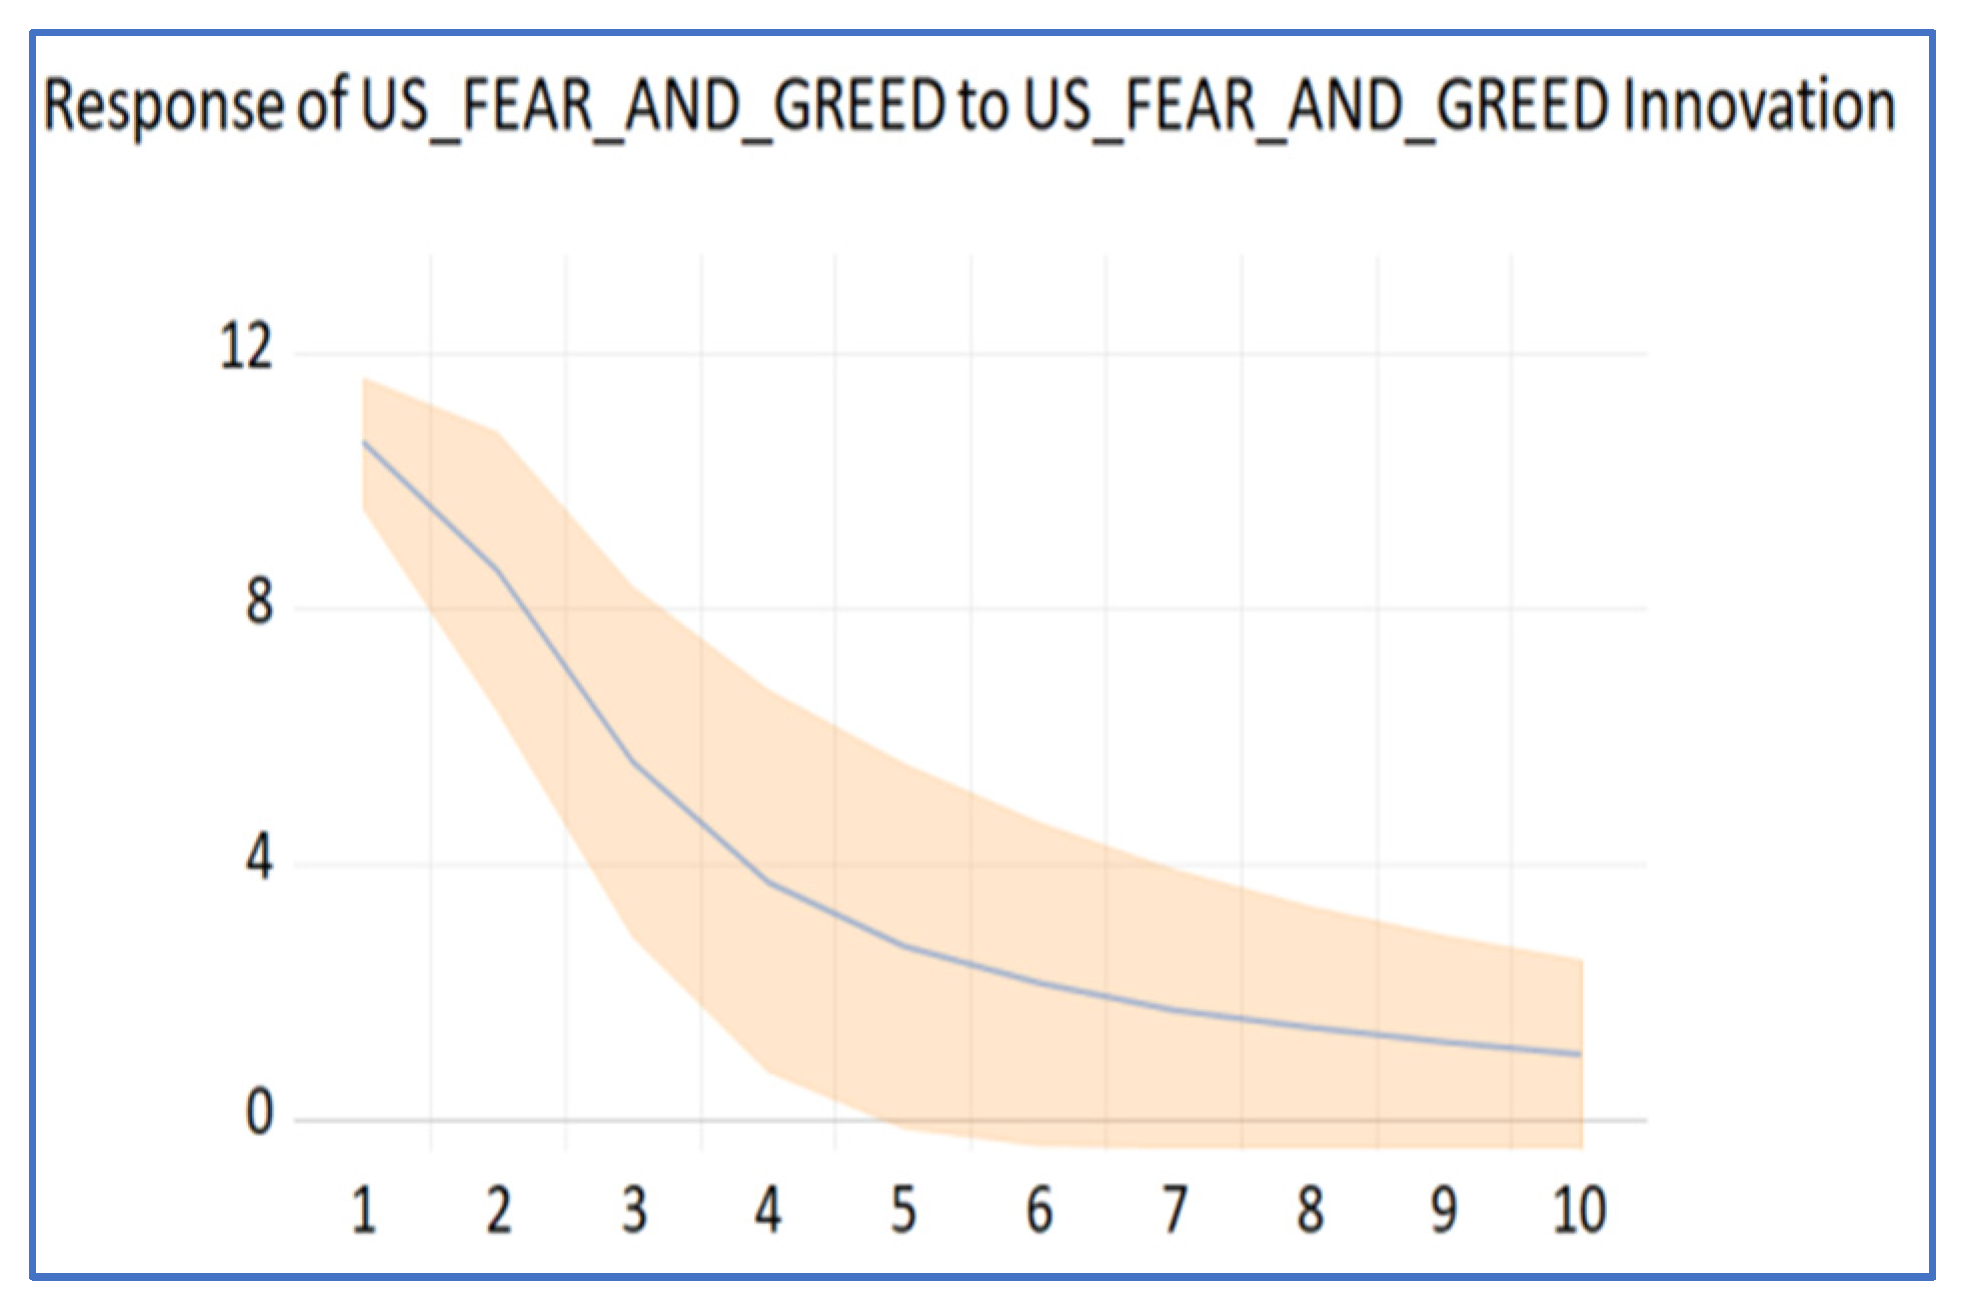
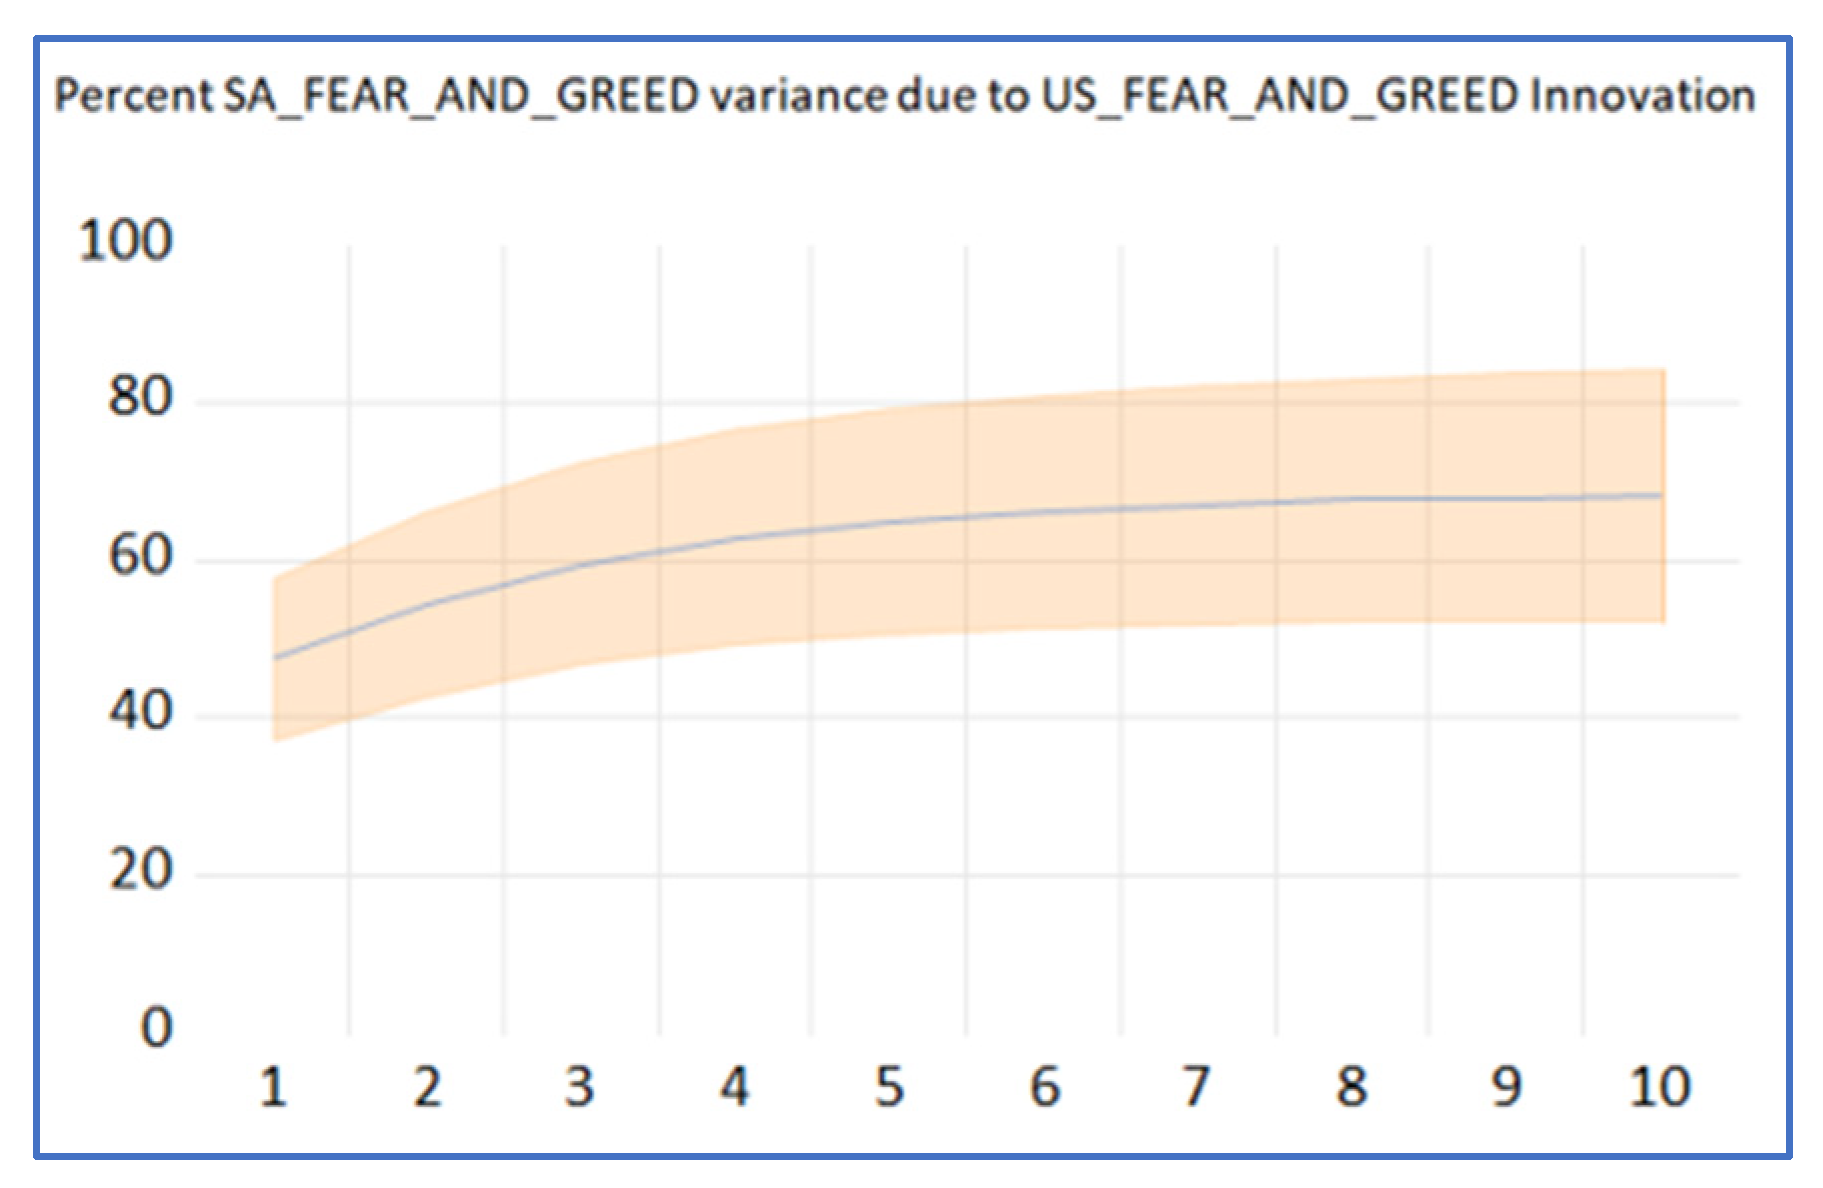
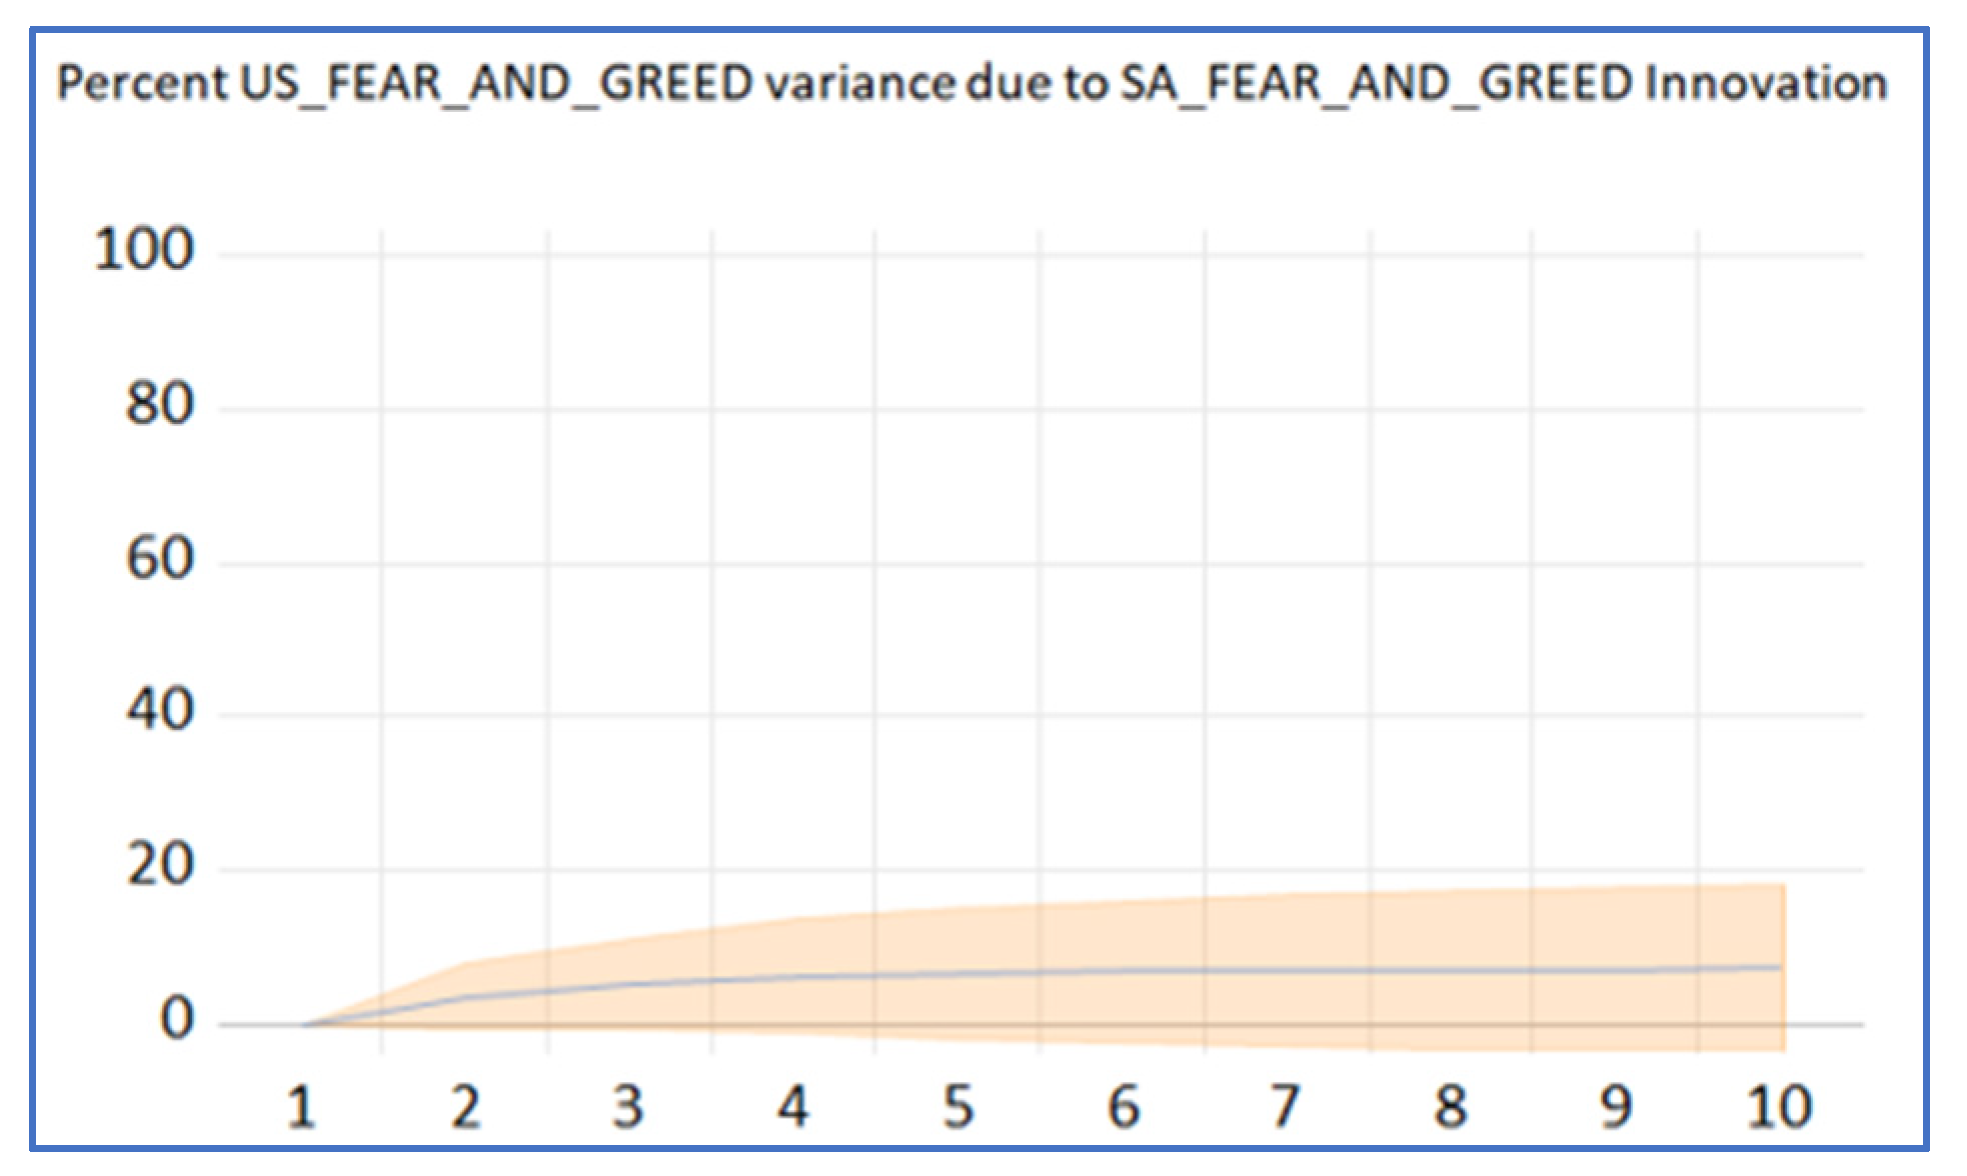
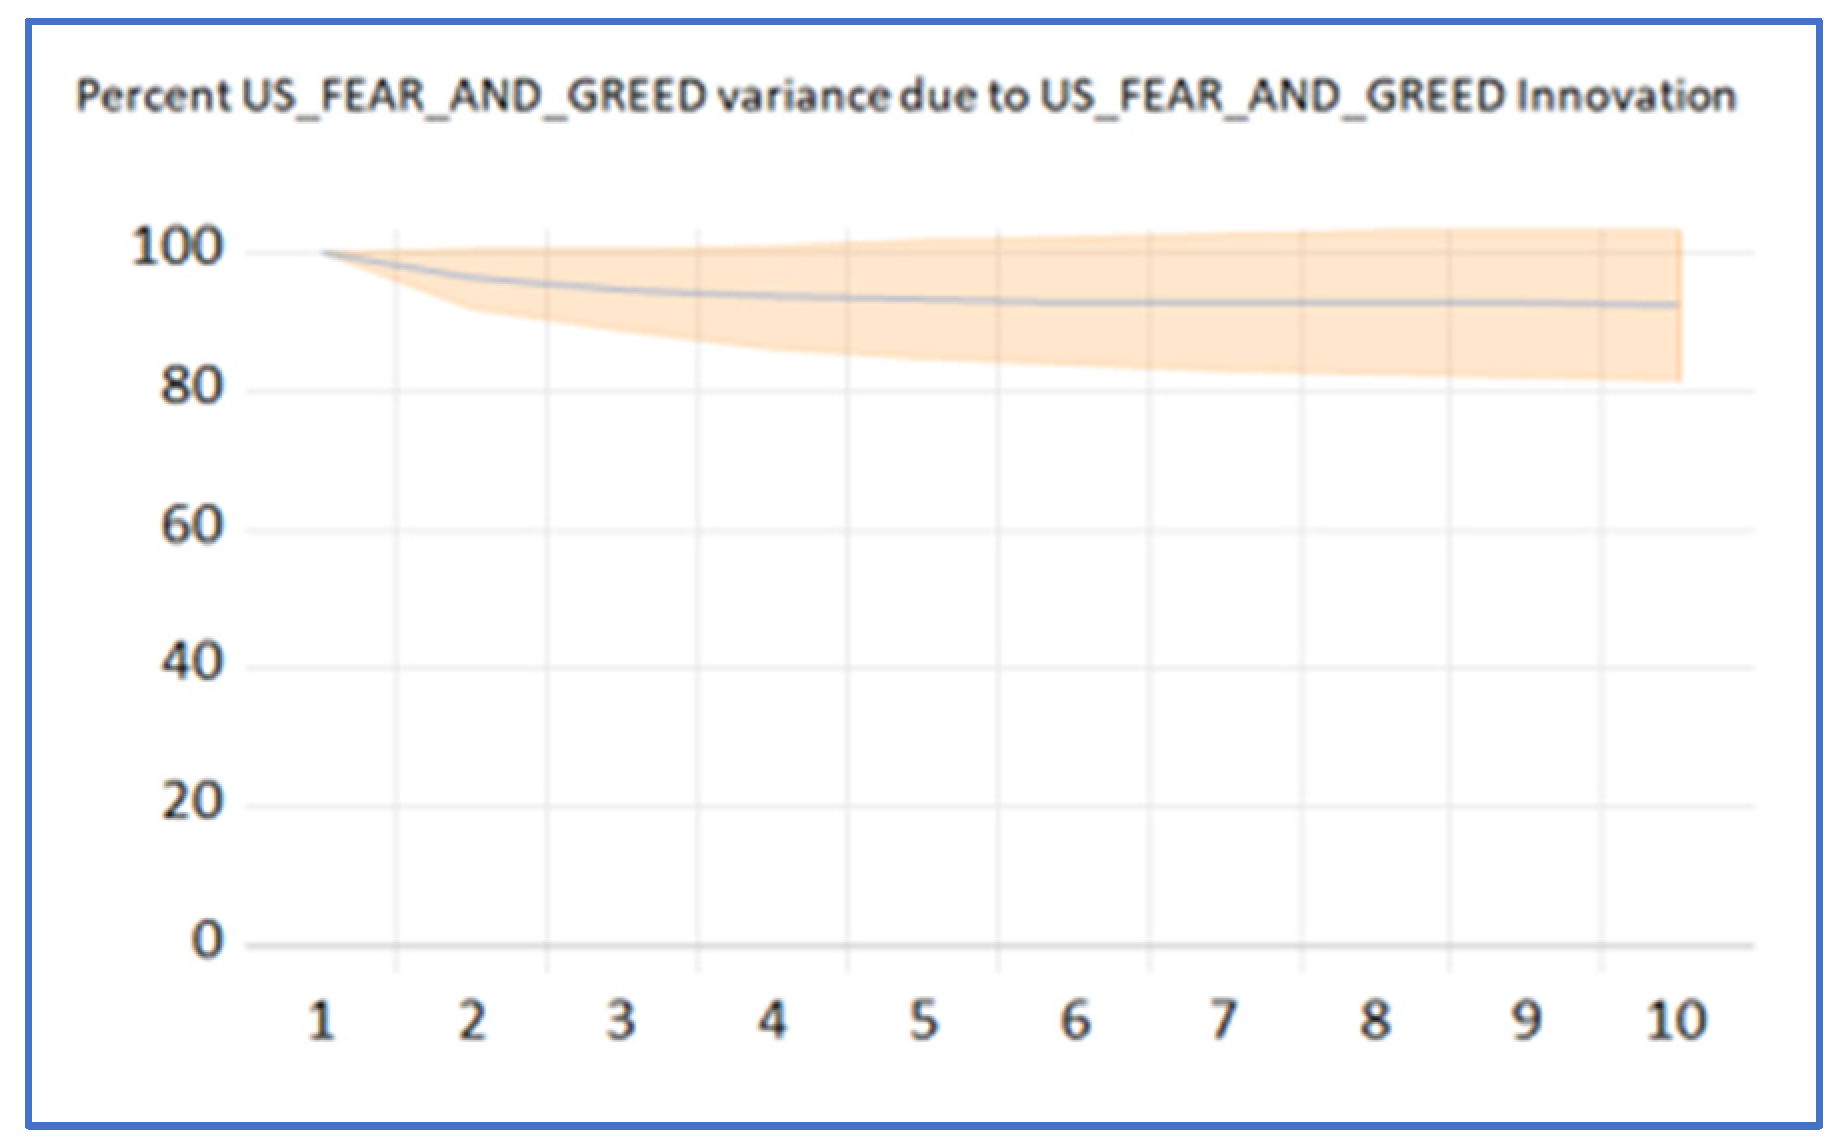
The Impulse Response Functions and Forecast Error Variance Decomposition results are shown in
Appendix A to shed more light on the dynamic transmission mechanisms and the extent of spillover effects between the US index and the South African Fear and Greed Index.
4.4. Robustness Tests
The findings’ sensitivity to the choice of forecast horizon and rolling window width was examined in order to validate the aforementioned analysis. The assessments in the aforementioned sections were carried out using a forecast horizon of 10 months and a rolling window width of 36 months. The models were re-estimated using forecast horizons of 2, 4, 6, and 8 months and rolling window widths of 32, 40, 44, and 48 months. The results showed that the choice of forecast horizons and rolling window width had neither a qualitative nor quantitative impact on the estimations of the time-varying total spillover indices. As a result, the empirical studies’ conclusions are confirmed.
5. Conclusions and Recommendations
By creating investor sentiment indices for South Africa and the U.S. based on the CNN Fear and Greed Index, this study examined the sentiment spillover effects of investor mood related to fear and greed. The following are our conclusions. Initially, there were notable cross-country spillover effects from investor sentiment related to fear and greed, and its traits were closely linked to global economic trends. Furthermore, as demonstrated by the 2008 financial crisis, the COVID-19 pandemic, the Russia–Ukraine war, and the interest rate cycle, it had time-varying characteristics, and its spillover effects grew when economic development was uncertain. Second, due to the larger sizes of developed economies and their greater involvement in the global financial system, the U.S. had higher overall sentiment spillover and spillback levels than South Africa. Additionally, the U.S. had more shocks than SA, with SA being a net receiver and the U.S. being a net transmitter. Finally, this paper sought to determine whether South Africa requires its own Fear and Greed Index; from the findings, it is clear that the USA significantly influences SA. However, as the CNN Fear and Greed Index focuses heavily on U.S. options, bonds, and equities, it does not account for conditions in SA. Different market dynamics drive the JSE; the emerging market environment and other factors such as local policies, exchange rates, and commodities influence SA sentiment. The CNN Fear and Greed Index is mainly influenced by large-cap U.S. stocks operating mainly in the tech industry. Changes in the ZAR/USD currency rate, foreign capital flows, and commodity prices (e.g., gold, platinum) all significantly impact South Africa. These factors are not taken into account by the CNN Fear and Greed Index. Furthermore, investor confidence is significantly impacted by local events such as municipal elections, policy uncertainty, and Eskom power outages. CNN’s score may be deceptive for SA because the risk characteristics in the U.S. market differ. Investor behavior in South Africa may differ from that of American markets. The fear and greed phases in the United States might not coincide with financial cycles in South Africa. In conclusion, yes, it can be used as a benchmark; however, during times of local political and economic instability, it may not reflect the true sentiment of SA.
Several policy recommendations can be made in light of the aforementioned findings. First, in stock markets with strong trade, economic, and geographic linkages, governments or regulators should pay particular attention to tracking shifts in investor opinion. Cross-border regulatory cooperation can stop the spread of investor sentiment when significant shocks occur by blocking cross-country spillover channels. Second, to help investors make more logical decisions, detect and stop the spread of unfavorable information, and avoid significant fluctuations in investor sentiment brought on by information asymmetry and other factors, financial market regulators should step up their oversight of stock markets. Lastly, for risk management and portfolio construction, particularly when it comes to international diversification, in addition to improving our comprehension of local investor sentiment, the creation of a South African Fear and Greed Index offers a useful indicator for foreign investors looking to diversify into emerging markets. When maximizing cross-border asset allocations, international investors can profit from keeping an eye on sentiment spillovers, given the observed connectivity between the sentiment indices in South Africa and the United States. Investors can more accurately predict times of elevated market emotion, such as extreme fear or enthusiasm, which are frequently associated with higher volatility and mispricing, by incorporating sentiment indicators into their portfolio decision-making process. Those who oversee diversified portfolios with exposures to both developed and emerging markets will find this especially pertinent. The inclusion of behavioral indicators into conventional risk–return frameworks is ultimately supported by our research, which promotes better timing and allocation choices that can lower downside risk during sentiment-driven market disruptions.
Due to data limitations, this study only really examines the connectedness between the SA and U.S. markets, which is a glaring shortcoming; future research should focus on the SA market’s connections with other markets. Future research can broaden the study’s coverage to other emerging and developed markets, contributing to the literature on the subject. A detailed examination of the dynamics of different markets would enable a more thorough generalization about the connectivity between Fear and Greed investor sentiment across countries. Additionally, by using rolling-window methodologies or sub-sample periods, future research can construct more detailed insights on top of the fundamental baseline provided by the full-period analysis. Moreover, the analysis depicts significant market-wide occurrences (e.g., the global financial crisis of 2007–2008, the COVID-19 pandemic of 2020, and the monetary tightening that followed in 2022) as ongoing shocks in a dynamic global setting. Segmenting the dataset runs the risk of arbitrarily reducing the impact of these events over time, which could impair the model’s real-time ability to capture cross-market sentiment transmission. Furthermore, although the focus of this study is on the relationship between the CNN Fear and Greed Index and the South African Fear and Greed Index, it is crucial to recognize that China has a substantial and expanding influence on the sentiment and capital flows in South African financial markets. China’s economic performance, policy changes, and investor behavior can have significant direct and indirect impacts on the Johannesburg Stock Exchange (JSE), as it is South Africa’s largest bilateral trading partner as well as a major source of FDI and infrastructure financing. China’s influence is especially noticeable in sectors of the JSE that are closely related to commodities, such as mining and minerals. Investor confidence and sectoral returns in South Africa can be impacted by shifts in trade policy, monetary interventions (such as interest rate adjustments or currency management), or variations in the demand for raw materials in China. Additionally, by strengthening co-movement through common policy frameworks and regional strategic alignment, South Africa’s membership in the BRICS alliance enhances the political–economic relations between the two nations. Future research could benefit from including a China–South Africa sentiment transmission route, even though this study does not specifically represent China’s sentiment index or its direct market signals. This would improve knowledge of how the structural and behavioral features of the South African equities market are influenced by geopolitical and global macroeconomic pressures, especially those that come from significant growing economies like China. Another potential drawback of this study is that it relied on monthly data observations. While monthly data makes it easier to analyze long-term patterns and reduces the noise of high-frequency data, it ignores short-term intraday swings in investor sentiment, which can be further explored in future studies. Finally, this study’s inability to distinguish between bull and bear market conditions when analyzing sentiment spillovers between the U.S. and South Africa is one of its main limitations. By using regime-switching or threshold models, future research could examine how market sentiment and spillover dynamics may behave differently depending on larger market regimes. Additionally, control variables that can affect the size of spillovers, such as changes in exchange rates, market volatility indices, or macroeconomic indicators, are not included in the research. Future models could improve the explanatory power and robustness of the results by incorporating such features.


