1. Introduction
Global risks have increasingly shaped the monetary policy landscape in recent decades. Shifts in U.S. interest rates, volatility in global commodity prices, and episodes of financial risk or economic policy uncertainty have disrupted macroeconomic stability, triggering capital flow volatility, exchange rate swings, and inflationary pressures. For monetary authorities, managing such external shocks requires navigating trade-offs among monetary independence, exchange rate stability, and capital account openness.
The international finance trilemma (
Mundell, 1963) offers a foundational framework for understanding these constraints. It posits that no country can simultaneously maintain a fixed exchange rate, free capital mobility, and monetary policy autonomy. While widely accepted in theory, its empirical validity remains the subject of ongoing debate. Foundational studies such as
Obstfeld (
2021) support the trilemma historically, but others, including
Rey (
2015), argue that global financial cycles may constrain monetary autonomy even under floating exchange rates. More recent work, such as
Ito and Kawai (
2024), finds mixed evidence across countries and time periods, suggesting that the trilemma continues to evolve under modern global conditions.
This study explores how institutional configurations and the nature of global shocks jointly shape monetary policy and exchange rate dynamics. We focus on ASEAN+4 economies—five ASEAN members (Indonesia, Malaysia, the Philippines, Singapore, and Thailand) and four East Asian economies (China, Japan, Korea, and Hong Kong)—that together exhibit a broad spectrum of monetary and exchange rate regimes. Their deep integration into global trade and financial networks makes them particularly sensitive to external conditions, while their diversity allows for comparative analysis. Against this background, the paper addresses the central question: how do institutional settings—such as exchange rate regimes and capital account openness—and the type of global shock jointly determine monetary and exchange rate responses across Asian economies?
Using structural vector autoregressive models with exogenous global variables (SVARX), we analyze monthly data from January 2010 to June 2022. We consider four key global shocks: U.S. monetary policy changes, oil price fluctuations, global financial risk, and policy uncertainty. Based on their policy frameworks, the economies are grouped into three trilemma-consistent categories: (1) floating exchange rates with capital openness, (2) fixed exchange rates with capital openness, and (3) capital controls with varying exchange rate regimes.
Our findings lead to three main conclusions. First, while the trilemma suggests that economies with floating exchange rates and open capital markets should fully align with global interest rate shifts, many—such as Korea and several ASEAN economies—exhibit only partial alignment, indicating retained monetary autonomy under open capital account. Second, among external shocks, U.S. monetary policy has the most dominant and synchronized effect on domestic interest rates, whereas oil price shocks, policy uncertainty, and financial risk produce more diverse and asymmetric responses. Third, we find that oil-exporting and oil-importing countries react differently to external shocks, highlighting the influence of underlying economic structures. These results underscore the limitations of one-size-fits-all policy frameworks and point to the value of more flexible, shock-specific monetary strategies and stronger regional coordination to mitigate spillovers.
The rest of the paper is organized as follows:
Section 2 reviews the related literature.
Section 3 summarizes the monetary policy objectives and exchange rate regimes across ASEAN+4 economies.
Section 4 introduces the empirical methodology.
Section 5 presents the data.
Section 6 discusses empirical results.
Section 7 reports robustness checks.
Section 8 concludes this study with policy implications.
This paper makes three specific contributions to the literature on global risk transmission and the international finance trilemma. First, it reassesses the trilemma by analyzing how different exchange rate regimes and capital account policies shape monetary and exchange rate responses to multiple types of global shocks—including U.S. interest rate changes, oil price fluctuations, and global uncertainty indicators (VIX, GEPU, FSI)—within a unified SVARX framework. While previous studies have primarily focused on U.S. monetary policy spillovers, this paper highlights that the type of global shock significantly influences monetary policy responses. Second, by applying a consistent empirical approach across nine Asian economies (ASEAN+4), the study documents cross-country heterogeneity in responses that systematically reflect differences in policy regimes and structural characteristics, such as capital controls, exchange rate arrangements, and oil trade exposure. Third, the paper contributes to policy discussions by showing that domestic macroeconomic structures—such as oil exporter/importer status or safe-haven currency roles—affect the transmission of global shocks, underscoring the need for more tailored and potentially regionally coordinated policy responses. These findings refine the empirical understanding of the trilemma under contemporary global risk conditions.
2. Literature Review
Our study builds on two strands of literature. First, the influence of US monetary policy shocks on the global economy, particularly in East and Southeast Asian economies, has been rigorously analyzed. Early studies showed significant implications of US monetary policy shocks for Asian financial markets (
Fukuda et al., 2013;
Mackowiak, 2007;
Nanda & Yeh, 2016;
Ogawa et al., 2023;
Schnabl & Spantig, 2016;
Turner, 2014).
Ahmed and Zlate (
2014) found that tighter US monetary stances lead to higher policy rates and exchange rate depreciation in many Asian economies.
Bruno and Shin (
2015) identified global bank capital flows as a major channel for these spillovers, with
Q. Y. Chen et al. (
2016) noting strong effects during global financial distress. Recent literature (
Dées & Galesi, 2021) revealed increased Asian market vulnerabilities to US monetary policy due to greater integration into the global financial system.
Aizenman et al. (
2020) emphasized the role of macroprudential policies and regulatory frameworks in individual economies’ resilience.
Anaya et al. (
2017),
Ogawa et al. (
2023), and others highlighted the role of capital flows as a spillover channel for US monetary policy shocks. Thus, while US monetary policy’s influence is dominant, individual nations’ susceptibility varies based on financial openness and domestic monetary policies (
Aizenman, 2019;
Azad & Serletis, 2022;
Bowman et al., 2015). Therefore, different policy responses to exchange rate shocks under different exchange rate regimes lead to variate macroeconomic influence (
Ameziane & Benyacoub, 2022). While these studies offer valuable insights, they also exhibit important limitations that our paper seeks to address.
However, while these empirical studies establish the importance of U.S. monetary policy spillovers, most of them analyze single-country dynamics or treat economies as homogeneous in their responses. They often neglect the role of institutional heterogeneity—such as differences in capital account regimes and exchange rate arrangements—in shaping the degree and nature of monetary transmission. Moreover, prior work frequently abstracts from structural macroeconomic constraints implied by the international finance trilemma, thus overlooking whether the observed policy responses are consistent with theoretical limits on policy autonomy. There is also scarce work examining how Asian economies’ monetary autonomy under open capital markets has evolved in response to intensified global financial integration since the 2010s.
Second, aside from US monetary policy, various global risk factors affect Asian monetary policy and exchange rates. Global investor risk aversion and policy uncertainty exert significant pressure on Asian exchange rates (
Caldara et al., 2020;
Mueller et al., 2017;
Ogawa & Luo, 2024;
Yang, 2013;
Yildirim, 2022;
Zhou et al., 2020). Global commodity price shocks, especially oil price fluctuations, are another risk source, particularly for oil importers (
Basnet & Upadhyaya, 2015;
Kilian, 2010;
Nusair & Olson, 2019;
Sun et al., 2022). Global geopolitical tensions can cause abrupt capital flow reversals, impacting Asian financial markets (
Rey, 2015). Global banking and financial linkages transmit global liquidity shocks to Asia (
Bruno & Shin, 2015). Lastly, global pandemics, such as COVID-19, can dramatically influence policy and exchange rate dynamics in the region, as well as the local financial market (
Kwon, 2025;
Miranda-Agrippino & Rey, 2020).
Despite the growing literature on global risk factors beyond the U.S.’ monetary policy, much of it tends to focus on individual shocks—such as oil or uncertainty—without placing them in a unified analytical framework that accounts for structural policy regimes. Studies seldom consider how different economies prioritize exchange rate stability or monetary independence in response to the same external shock, even though such differences may stem from divergent policy mandates or development strategies. Furthermore, most analyses fail to systematically integrate multiple global shocks into a coherent empirical setting that reflects the evolving nature of global macro-financial linkages.
Despite extensive research on the spillover effects of global shocks, gaps remain in understanding how multiple risk factors—such as monetary policy changes, commodity price fluctuations, and uncertainty—interact with domestic monetary regimes. In particular, few studies examine these interactions through the lens of the international finance trilemma or assess how economic structure (e.g., oil exporter vs. importer) contributes to heterogeneity in policy responses.
In response to these gaps, our study makes several conceptual and empirical contributions. This study fills these gaps by adopting a structural VARX model framework that simultaneously accounts for multiple global shocks—U.S. monetary policy, oil price changes, financial risk, and uncertainty—while incorporating domestic macroeconomic variables under different trilemma configurations. Unlike prior research that treats institutional context as secondary, our approach explicitly categorizes ASEAN+4 economies by their exchange rate and capital account regimes, allowing for a comparative analysis of policy responses. By embedding the trilemma constraints into the empirical design, this paper contributes conceptually and empirically to the literature on global monetary spillovers and offers a more nuanced understanding of how institutional arrangements mediate shock transmission.
3. The ASEAN+4 Monetary Policy Objectives and Exchange Rate Arrangements
The international finance trilemma continues to shape the policy configurations of ASEAN+4 economies, leading to considerable diversity in monetary policy objectives, exchange rate regimes, and capital account openness.
Table 1 summarizes the official exchange rate arrangements and monetary policy frameworks of these economies, based on the IMF’s 2023 Annual Report on Exchange Arrangements and Exchange Restrictions (
IMF, 2023).
Several Asian economies—Japan, Korea, Indonesia, Malaysia, the Philippines, and Thailand—maintain floating exchange rate regimes combined with inflation targeting frameworks. Despite their formal commitment to monetary autonomy, these economies operate under full capital mobility and varying degrees of exchange rate management. Japan places greater emphasis on monetary independence, whereas Korea and the ASEAN-5 often prioritize exchange rate stability as a secondary objective.
China and Myanmar employ managed exchange rate systems. China’s 2005 and 2015 reforms introduced greater flexibility into the Renminbi exchange rate, but exchange rate stability remains a key objective. Despite moves toward liberalizing foreign investment and cross-border Renminbi usage, China continues to manage capital flows and uses a mix of monetary and exchange rate tools to balance growth and stability.
Luo (
2018) observes that even after the 2015 reforms, the U.S. dollar remains dominant in China’s reference currency basket, reflecting a cautious approach to liberalization.
Currency board arrangements are used in Hong Kong and Brunei, where exchange rates are pegged to a major reserve currency, ensuring exchange rate stability at the cost of monetary policy autonomy. Singapore and Cambodia adopt exchange rate bands, allowing some flexibility while anchoring expectations. These hybrid regimes reflect the balancing act between external stability and domestic policy space.
De facto arrangements often diverge from official classifications. Many emerging Asian economies manage their exchange rates more tightly than declared, reflecting implicit preferences for stability, especially in the face of capital flow volatility. This discrepancy between de jure and de facto regimes is a recurring theme in the literature on Asian exchange rate policy.
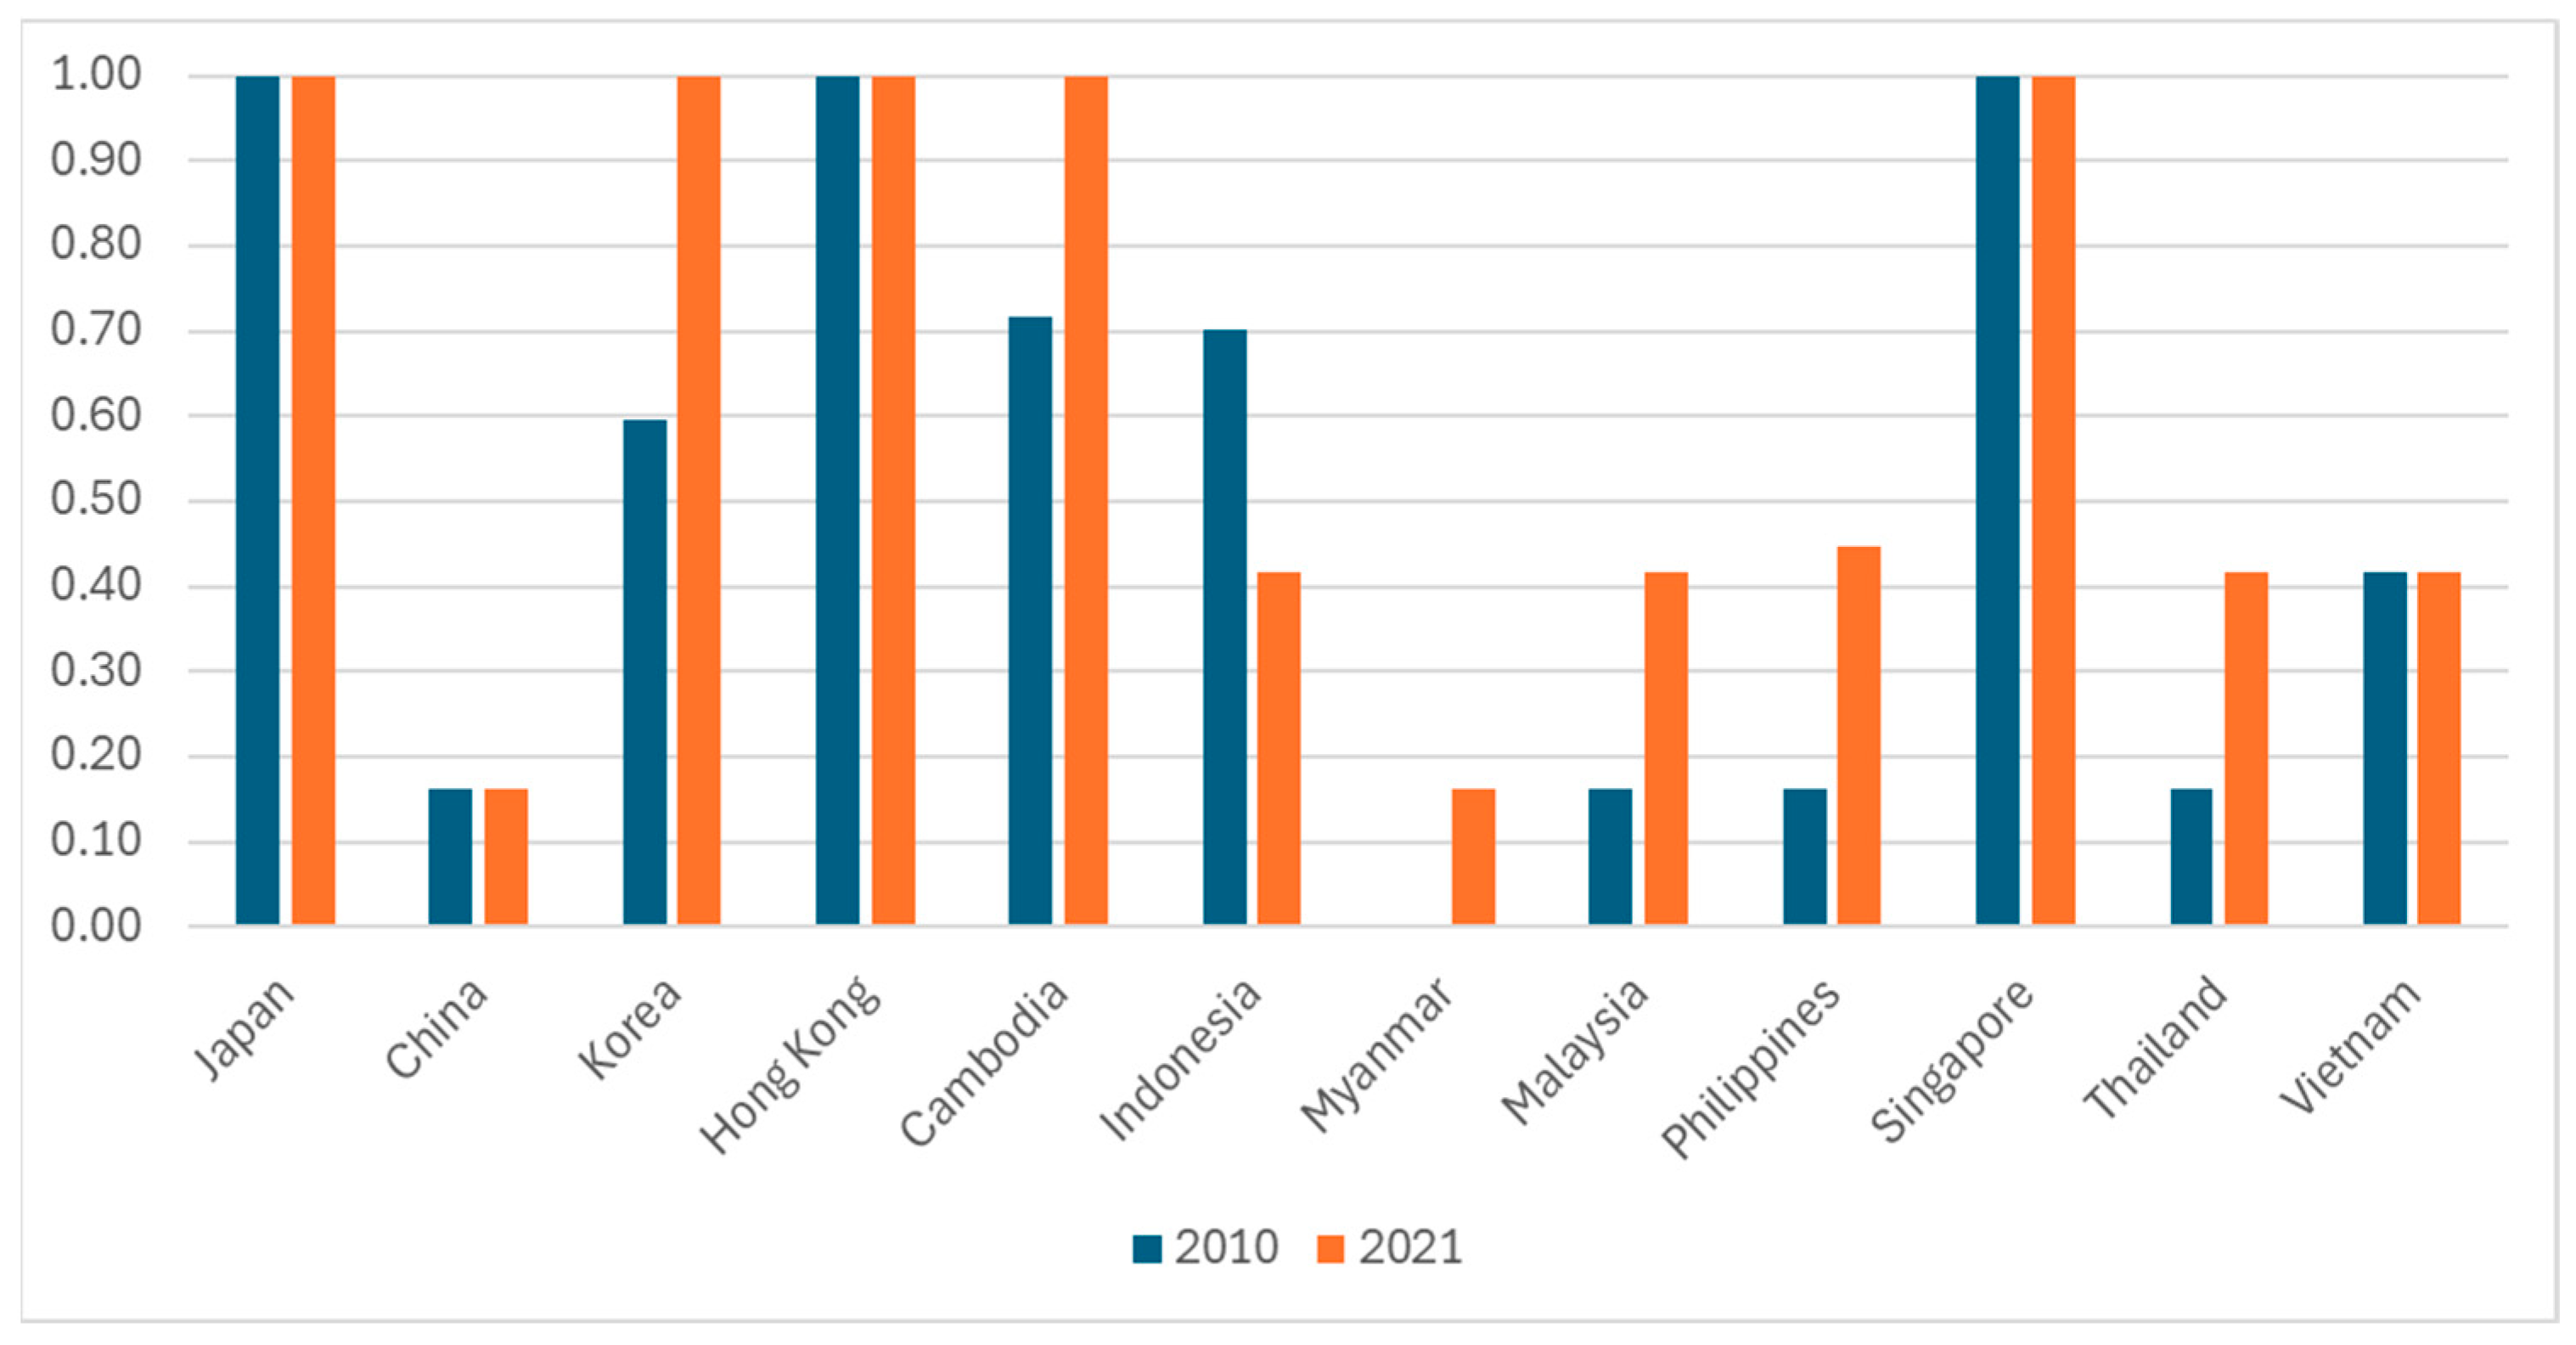
Capital account openness has also evolved significantly.
Figure 1 presents the Chinn–Ito Index, a standard measure of capital account openness, for ASEAN+4 economies. Between 2010 and 2021, most countries moved toward greater liberalization. By 2021, Japan, Korea, Hong Kong, Cambodia, and Singapore showed the highest levels of capital openness. Indonesia, Myanmar, and Malaysia showed fluctuations, while China and Vietnam maintained more restrictive stances. These shifts reflect post-Asian financial crisis lessons, economic integration goals, and growing exposure to global capital markets.
While capital openness can attract foreign investment and support growth, it also increases exposure to global financial volatility and speculative capital flows. Policymakers in the region continue to grapple with the challenge of balancing growth objectives with the risks of financial instability, a tension at the heart of the international finance trilemma.
4. Methodology
4.1. Model Specification
This study investigates the global shocks’ spillovers to monetary policy rates and exchange rate dynamics in ASEAN+4 economies using a structural vector autoregressive model with exogenous variables (SVARX). The modeling framework builds on standard open-economy macroeconomic theory, particularly the uncovered interest parity (UIP), Taylor rule-based monetary policy reaction functions, and the IS and Phillips curves in an open-economy context.
We selected the SVARX model because it offers a flexible and robust framework for analyzing dynamic interactions between domestic macroeconomic variables and external global shocks, while allowing for the explicit treatment of exogenous influences. In particular, the SVARX structure enables researchers to isolate the effects of shocks originating from global sources—such as U.S. monetary policy, oil prices, and financial uncertainty—on a country’s monetary and exchange rate responses, without confounding these with internal dynamics. This separation is especially useful for small open economies that are heavily influenced by external developments but still retain some domestic policy tools. Moreover, the SVARX model is well suited to the international finance trilemma framework, as it facilitates the evaluation of policy autonomy under different capital account and exchange rate regimes. Similar methodologies have been employed in existing research by
Alom et al. (
2013),
Pham and Sala (
2020), and
Sousa and Zaghini (
2007) to capture monetary transmission mechanisms and external spillovers in open economy settings.
In the short term, interest rate differentials, global risk appetite, and market dynamics influence exchange rate fluctuations. The UIP condition (Equation (1)) suggests that the spot exchange rate reflects the expected future exchange rate adjusted for interest rate differentials:
where
is the log of current spot exchange rate,
is the log of expected future spot rate, and
, are the domestic and foreign short-term interest rates. Under rational expectations, the domestic currency is expected to depreciate when the interest rate differential rises.
However, empirical deviations from UIP—commonly referred to as the “interest rate parity puzzle”—suggest that factors such as capital controls, risk premiums, or policy frictions may distort this relationship. This deviation can be captured in a reduced-form model (Equation (2)):
Monetary policy is modeled using the Taylor rule framework (Equation (3)), in which the policy rate responds to inflation and output gaps:
where
is the equilibrium real interest rate at which potential GDP is realized,
is the inflation target, and
is the output gap. In open economies, the central bank may also respond to exchange rate movements,
Ball (
1999), yielding the extended reaction function (Equation (4)):
Output and inflation dynamics follow standard IS and Phillips curve formulations. The IS curve links output to its lag, the interest rate, and the exchange rate (Equation (5)):
Inflation is modeled via a Phillips curve, depending on lagged inflation, output, and exchange rate changes (Equation (6)):
Based on these theoretical foundations, we construct a SVARX model, specified in Equation (7):
where
is a vector of endogenous variables,
is a vector of exogenous global shocks, and
,
are coefficient matrices. The structural form of the model (Equation (8)) is as follows:
Assuming invertibility, we define it as follows:
The order condition for identification requires at least
restrictions on the
matrix. The baseline SVARX model in this study includes four domestic endogenous variables and three global exogenous shocks:
In our baseline SVARX model, variables are classified into two types.
Endogenous variables (domestic):
: Output (proxied by the industrial production index);
: Inflation (CPI);
: Domestic short-term interest rate (3-month interbank rate);
: Effective exchange rate.
Exogenous variables (global):
: U.S. interest rate;
: Global oil prices;
: Global risk indicators (e.g., VIX, GEPU, Financial Stress Index).
This classification reflects the assumption that ASEAN+4 economies are small open economies that respond to, but do not contemporaneously influence, global conditions. Accordingly, the global variables are treated as exogenous in the baseline SVARX model.
While the SVARX model treats global shocks as exogenous—consistent with the assumption that ASEAN+4 economies are small open economies influenced by but not influencing global conditions—we acknowledge that strict exogeneity may not always hold. For instance, feedback effects from large Asian economies to global markets could bias the estimates. To address this concern,
Section 7.1 presents robustness checks in which selected global variables (e.g., oil prices and financial risk indices) are included as endogenous in a broader model specification. The results remain consistent with the baseline, supporting the validity of the exogeneity assumption in our main model.
We adopt a recursive identification strategy by imposing a Cholesky decomposition (lower-triangular structure) on the contemporaneous response matrix , consistent with a standard structural VAR identification approach. The order of the variables is as follows: output (), inflation (), interest rate (), and exchange rate (). This order assumes that output and prices do not respond contemporaneously to shocks in interest rates or exchange rates within a month, while the interest rate can react contemporaneously to output and prices, and the exchange rate is free to respond to all variables contemporaneously. This scheme imposes a block-triangular structure on , which sets the upper-right entries to zero, consistent with standard open-economy macroeconomic assumptions.
Compared to standard VAR models, the SVARX framework allows for clear treatment of global variables as exogenous drivers of domestic dynamics—an essential feature for analyzing how small open economies respond to external shocks under the trilemma. Standard VAR models treat all variables as endogenous, which can obscure the role of global factors such as U.S. interest rates or oil prices. While Bayesian VAR (BVAR) models are advantageous for forecasting, our objective is to identify structural transmission mechanisms and policy responses. Thus, SVARX is a more appropriate choice for our empirical framework, as it enables sharper identification of the causal effects of global shocks.
4.2. Hypothesis
In line with the international finance trilemma, Asian economies adopt different exchange rate regimes and capital account policies according to their monetary policy objectives. Based on the framework proposed by
Ogawa and Luo (
2024), we develop hypotheses for three distinct types of economies, classified by their exchange rate arrangements and capital mobility (summarized in
Table 2).
China represents a case where capital controls are maintained, and exchange rate management remains an active policy tool. Following the Renminbi reforms in 2005 and 2015, which introduced greater flexibility in exchange rate determination, China has pursued gradual liberalization of capital flows while retaining significant monetary policy autonomy. We hypothesize that domestic economic conditions—such as inflation and output growth—are the primary determinants of short-term interest rates, with limited direct responsiveness to foreign interest rates. A depreciation of the Renminbi may lead to an accommodative policy to support growth, while oil price increases are expected to raise interest rates due to inflationary pressure. In contrast, rising global financial risk may prompt policy easing to stabilize domestic conditions.
Economies with Floating Exchange Rate and Capital Openness (e.g., Korea, Indonesia, Malaysia, the Philippines, and Thailand)
These economies operate under floating exchange rate regimes with relatively open capital accounts. In line with the trilemma, we expect only partial monetary policy independence. Changes in U.S. interest rates are likely to induce corresponding adjustments in domestic policy rates, aimed at stabilizing exchange rates and maintaining investor confidence. Domestic inflation and output remain relevant, but policy reactions are also shaped by external factors. Oil-exporting countries in this group, such as Malaysia and Indonesia
1., may exhibit currency appreciation in response to oil price increases. Japan also maintains a floating exchange rate and open capital market, but differs in its pursuit of strong monetary policy independence—particularly under the Abenomics framework. As a result, the yen exchange rate is more sensitive to interest rate differentials and global risk sentiment, often appreciating during periods of elevated global uncertainty due to its status as a safe-haven currency.
Hong Kong and Singapore represent economies that prioritize exchange rate stability and capital mobility, sacrificing monetary policy autonomy. Hong Kong operates a strict currency board, fully aligning its policy rate with that of the United States to maintain the peg
2. Singapore adopts a managed float against a reference currency basket, which it uses as the primary monetary policy instrument. Although the specific basket composition is undisclosed, we hypothesize that Singapore adjusts its interest rates in line with changes in the monetary policy of its key trading partners, to ensure consistency with its exchange rate management objectives.
4.3. Estimation
We estimate the baseline SVARX model specified in Equation (10) for each ASEAN+4 economy, tailoring the specification to reflect country-specific economic contexts. This model framework enables us to capture the differential effects of global shocks—particularly those related to monetary policy, oil prices, and risk sentiment—on domestic interest rates, exchange rates, output, and prices.
To account for various dimensions of global uncertainty, we incorporate multiple global risk indicators into the exogenous variable set. These include a global financial risk indicator, a global policy uncertainty index, and a financial stress index. Each captures distinct aspects of risk transmission, allowing for a more nuanced analysis of how different shocks influence domestic macroeconomic variables.
Lag lengths for both endogenous and exogenous variables are selected based on the Akaike Information Criterion (AIC). For endogenous variables, the optimal lag length typically ranges from one to two, while exogenous variables consistently use a lag length of one. This ensures a balance between model parsimony and capturing dynamic relationships accurately.
Following estimation, we employ multiplier analysis (MA) to trace the impulse response functions of domestic variables to global shocks. All estimations are conducted using the VAR module in EViews 13, ensuring consistency and robustness in the empirical results.
5. Data
This study examines short-term interest rate and exchange rate dynamics across nine ASEAN+4 economies—China, Japan, Korea, Hong Kong, Indonesia, Malaysia, the Philippines, Singapore, and Thailand—over the period from January 2010 to June 2022. This time frame captures a variety of global economic conditions, including the post-global financial crisis recovery, U.S. monetary tightening cycles, and the COVID-19 pandemic, providing a comprehensive basis for empirical analysis.
The data are sourced from multiple authoritative databases. Macroeconomic and financial variables are drawn from Datastream, the IMF’s International Financial Statistics (IFS), the Bank for International Settlements (BIS) Effective Exchange Rate (EER) database, and the Economic Policy Uncertainty (EPU) website.
Table 3 provides a summary of all variables used.
The industrial production index is used as a proxy for real economic activity (output), while the Consumer Price Index (CPI) represents the price level. Domestic interest rates are captured by the 3-month interbank rate, and the BIS broad-based effective exchange rate index measures currency value. For foreign interest rates, we use the 3-month U.S. dollar LIBOR. Global shocks are represented by several indicators: oil prices (sourced from the IMF’s Primary Commodity Price Index for crude oil), global economic policy uncertainty (GEPU) from
Davis (
2016), the CBOE Volatility Index (VIX) as a proxy for global risk appetite, and the Office of Financial Research (OFR) Financial Stress Index (FSI) to capture financial market stress.
Figure 2 illustrates the evolution of short-term interest rates, interest rate differentials with the U.S. dollar, and effective exchange rates for ASEAN+4 economies. Panel A highlights monetary policy convergence during global monetary easing and divergence during U.S. rate hikes, particularly post-2015. Panel B plots nominal effective exchange rates, revealing varied exchange rate paths: for example, the Japanese yen and Korean won experienced significant depreciation during the sample period, while the Singapore dollar and Chinese yuan remained relatively stable. These patterns underscore the heterogeneous responses of Asian economies to global shocks and provide empirical motivation for our trilemma-based model.
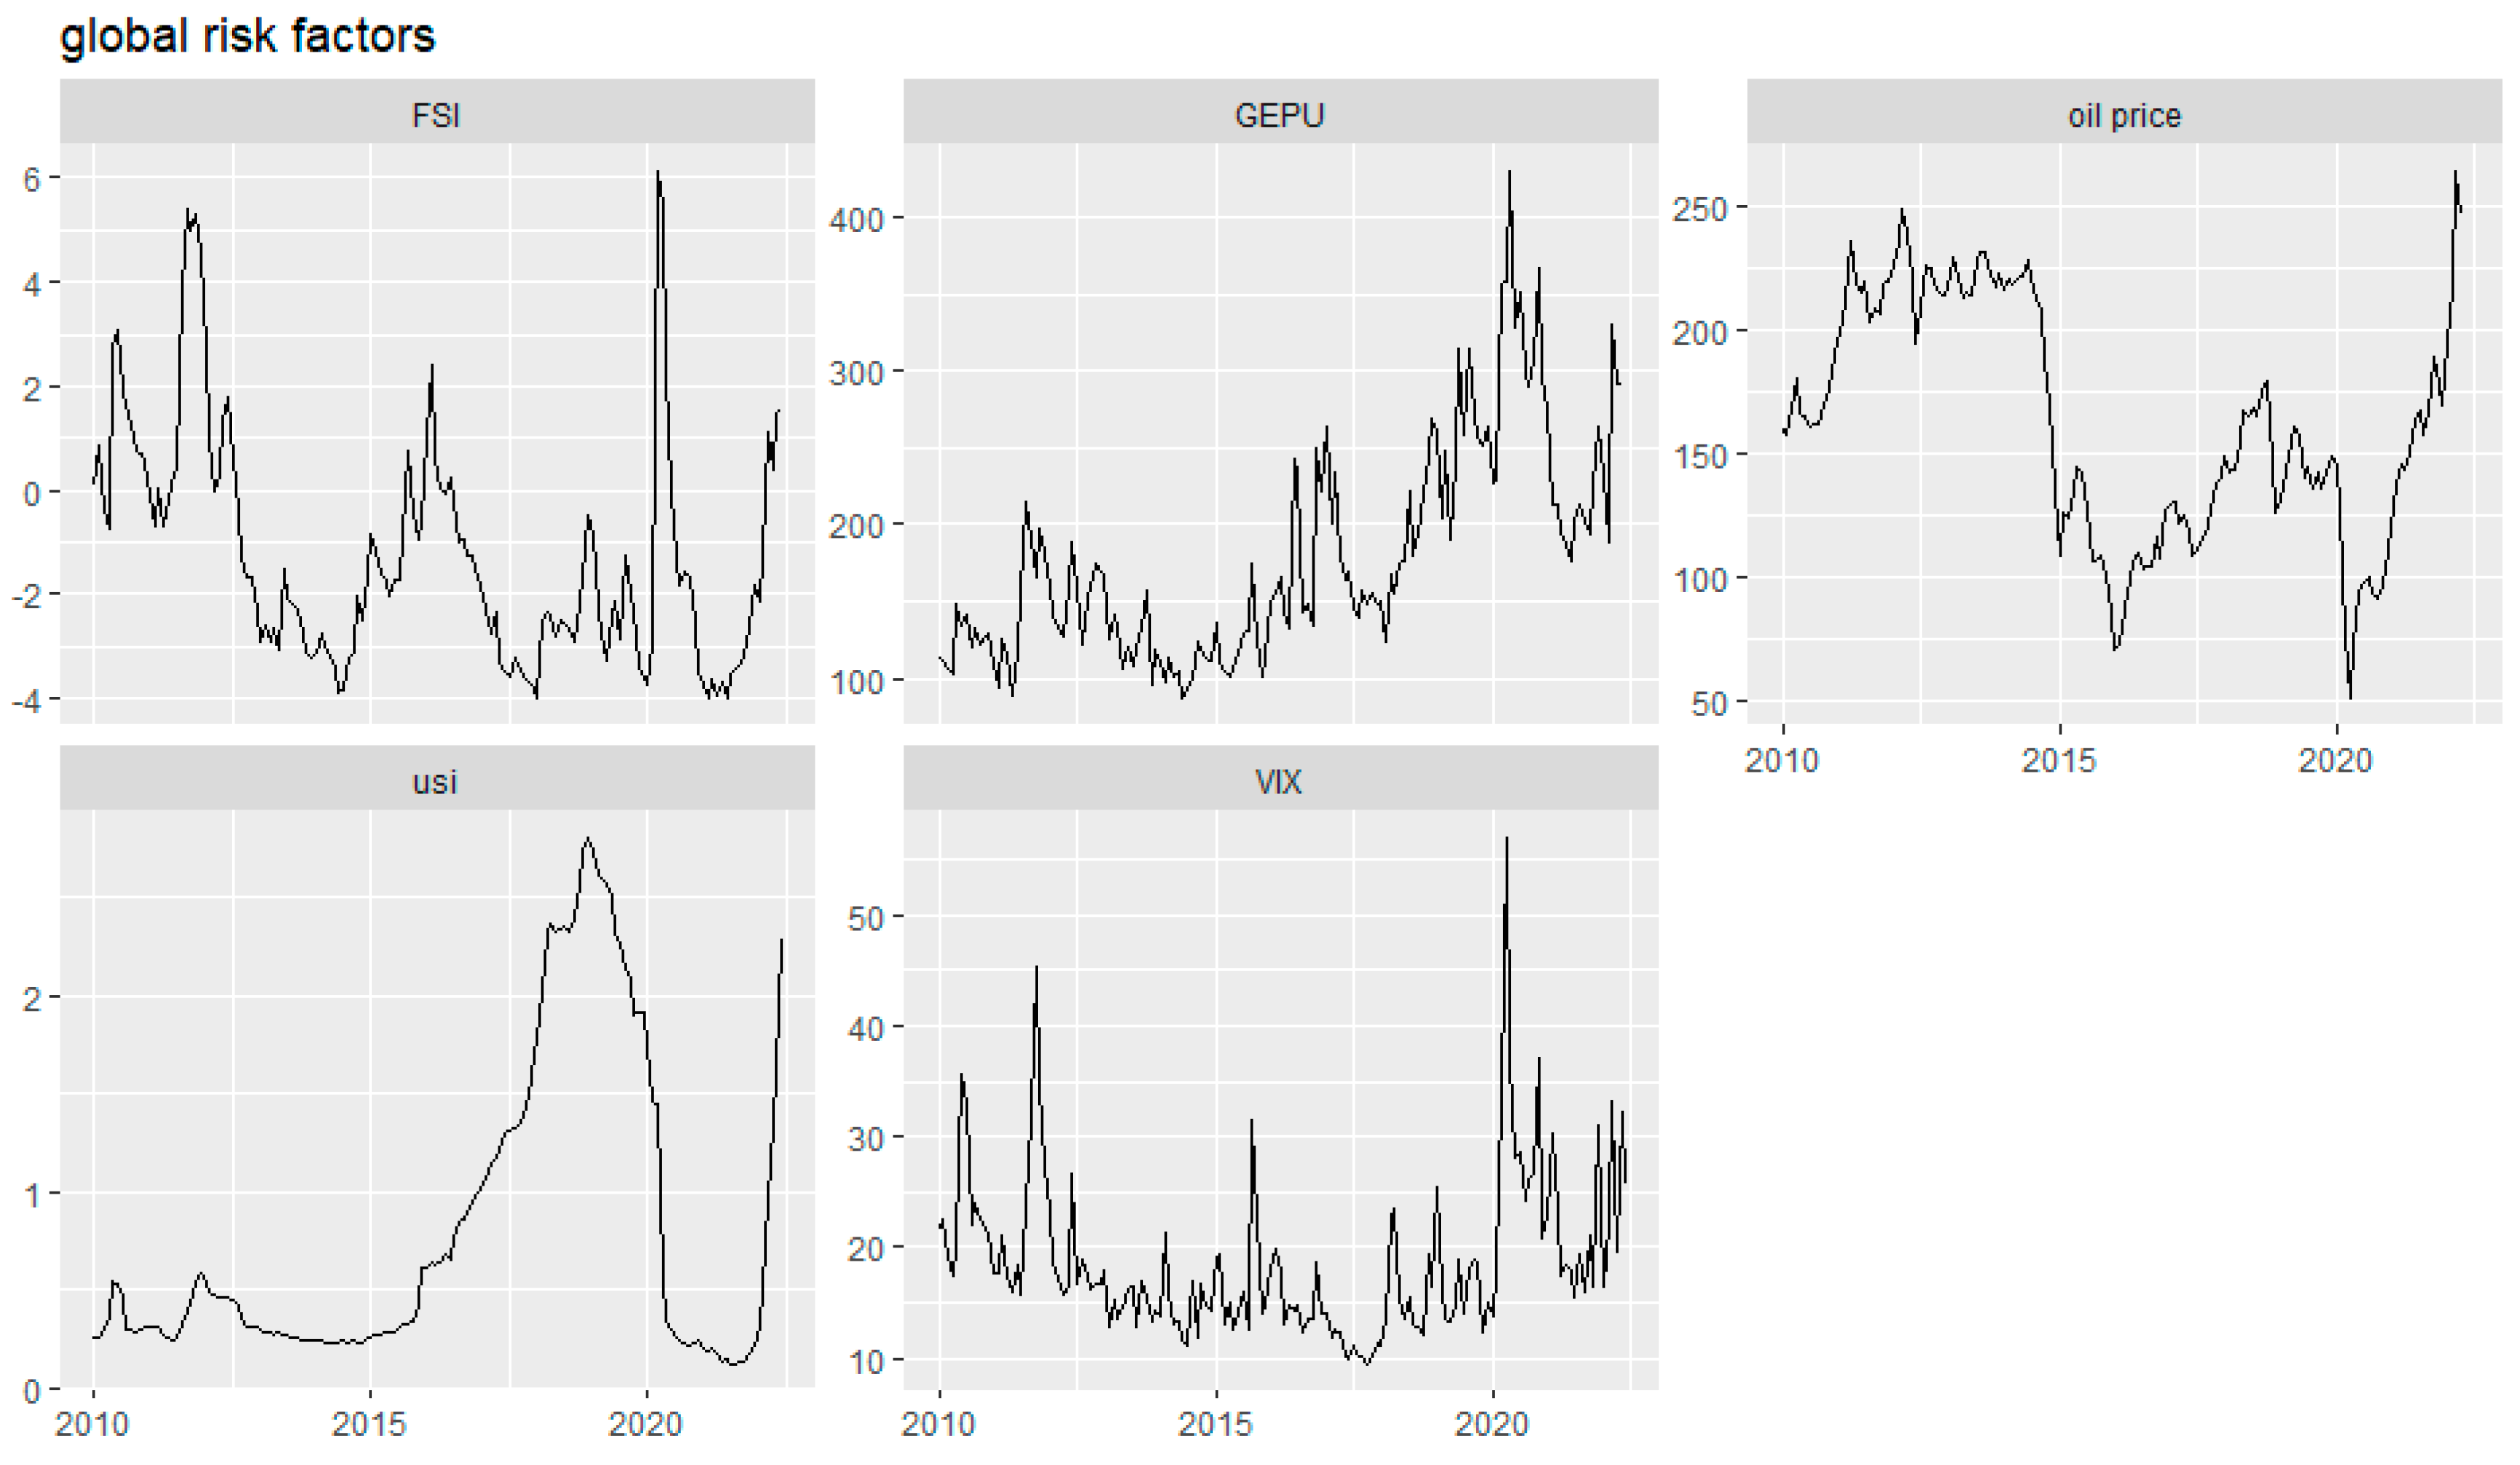
Figure 3 illustrates the evolution of global risk indicators over the sample period. U.S. interest rates remained at historically low levels following the global financial crisis, gradually increased from 2015, and returned to near-zero during the COVID-19 pandemic. The VIX displayed moderate volatility with pronounced spikes during episodes of heightened uncertainty, while the FSI captured financial distress during major global events. The GEPU index rose sharply in periods of geopolitical tension, and oil prices showed substantial fluctuations due to supply shocks, global demand changes, and pandemic-driven disruptions.
We examined the time series properties of all model variables by applying the Augmented Dickey–Fuller (ADF) unit root test. The null hypothesis of a unit root could not be rejected for most series at conventional significance levels, indicating non-stationarity. To ensure stationarity required for valid SVARX estimation, we transformed the variables accordingly. Specifically, we used log differences for output (), prices (), exchange rates (), and global risk indicators (, , and ), as these series are expressed in levels or indices and exhibit exponential trends. For interest rates (, ) and the financial stress index (), which are already in percentage or point format, we applied simple first differences. All variables were log-differenced to achieve stationarity except the financial stress index and interest rates, which includes zero and negative values. Therefore, we applied first differences without taking logs. These transformations remove deterministic trends and stabilize the variance, ensuring that all variables are stationary prior to estimation.
6. Empirical Results
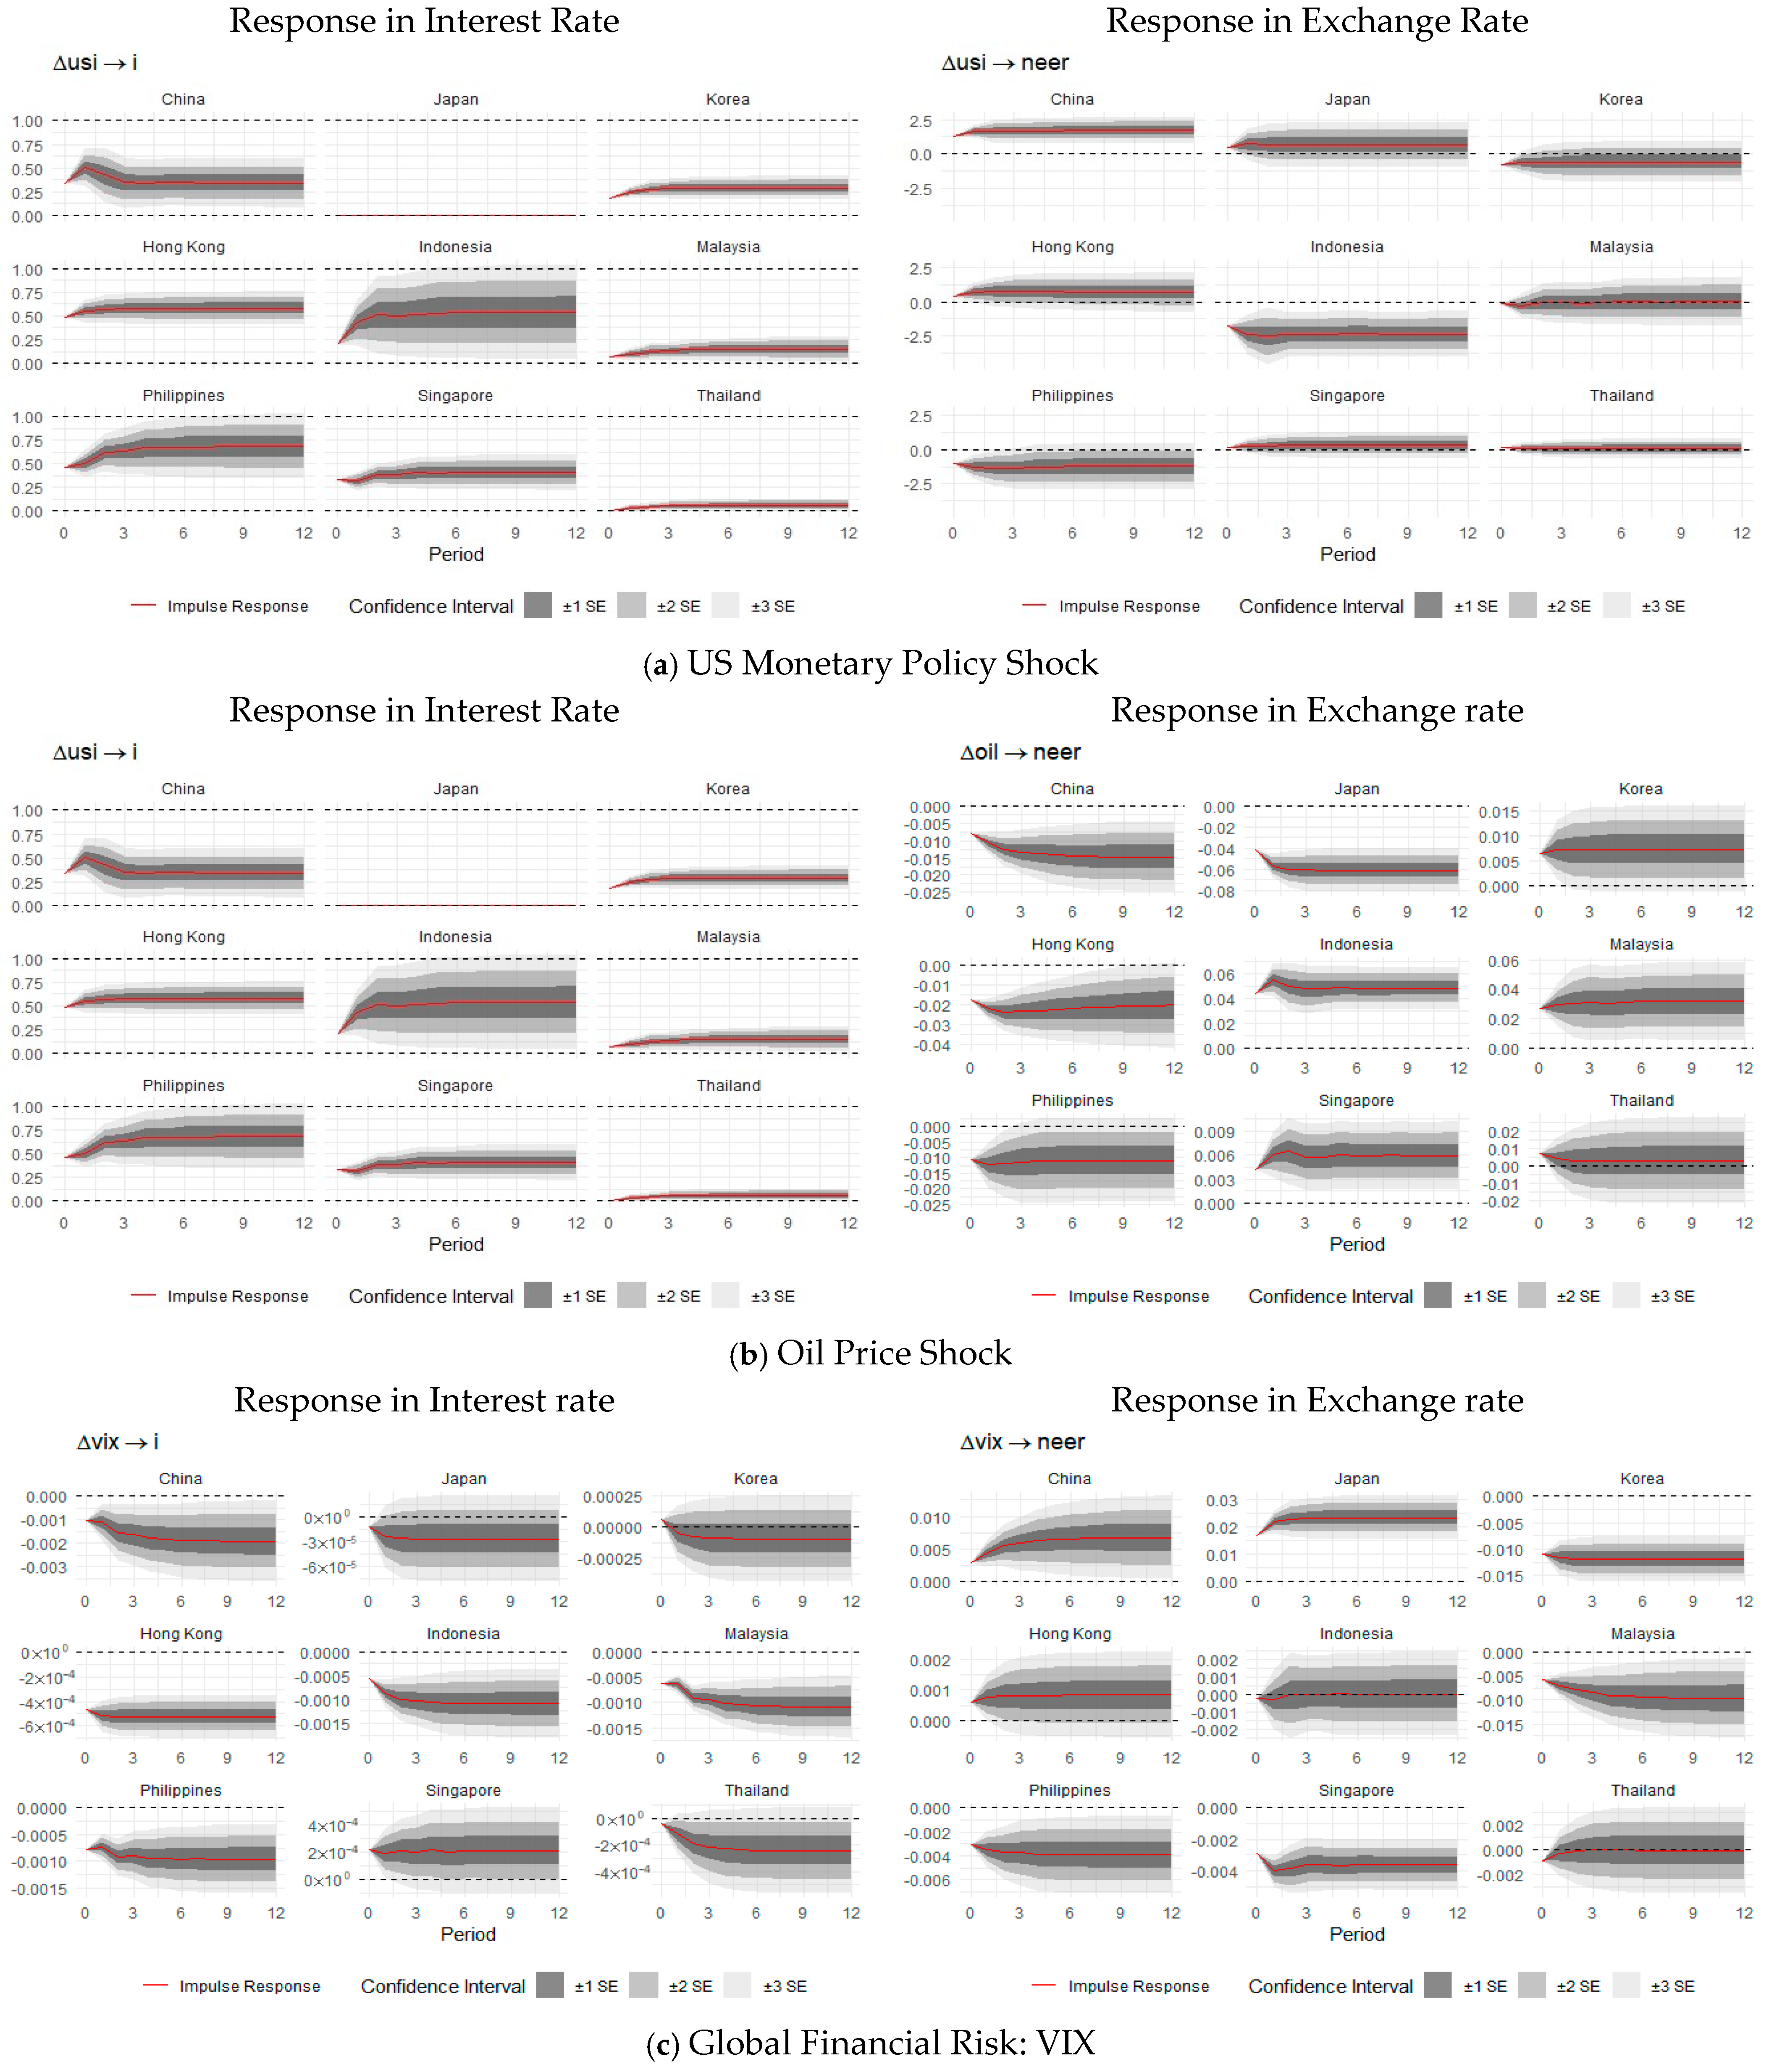
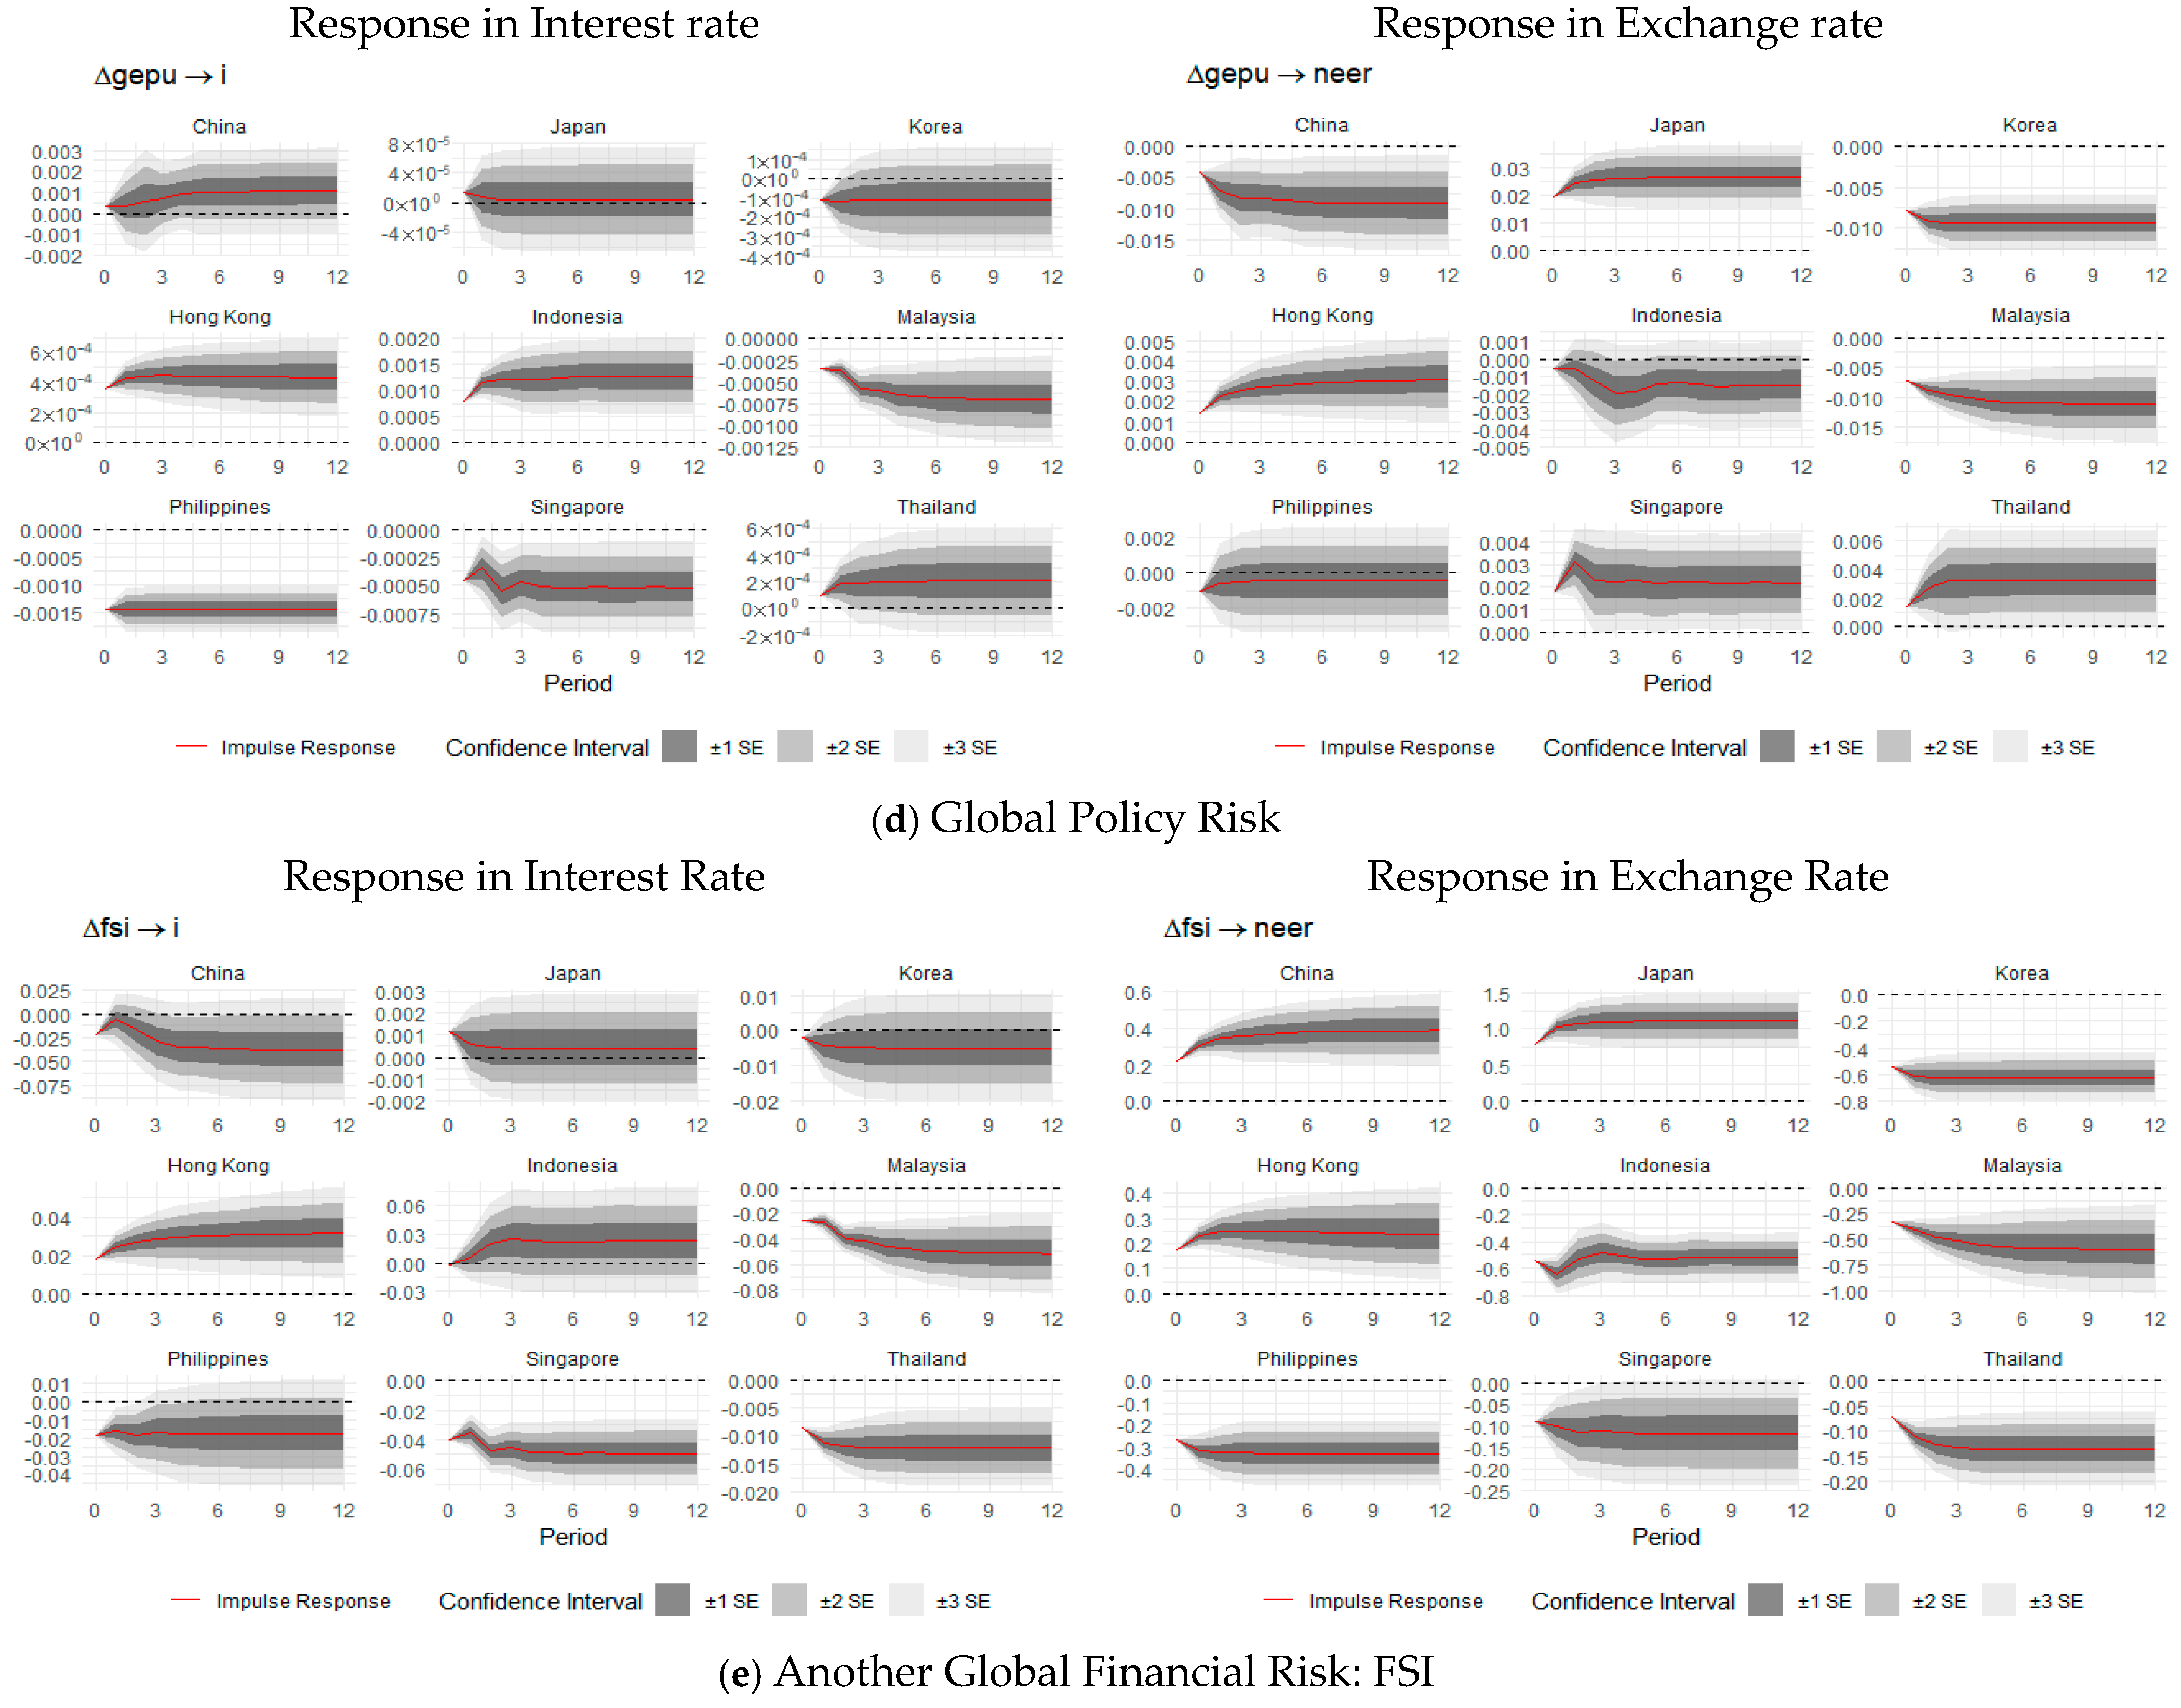
Figure 4 presents the accumulated impulse response functions (IRFs) of interest rates and exchange rates to one-percentage-point shocks in various global risk factors, including U.S. monetary policy, oil prices, global financial risk (VIX), global policy uncertainty (GEPU), and financial stress (FSI). The IRFs are accompanied by 68% (±1 standard error), 95% (±2 standard error), and 99% (±3 standard error) confidence intervals, calculating using analytical standard errors derived from the estimated variance-covariance matrix.
Table 4 reports the corresponding magnitudes and statistical significance of the responses based on the baseline SVARX model estimates, enabling cross-country and cross-shock comparisons.
Appendix A provides the diagnostic testing results on SVARX estimations.
To ensure the reliability of our SVARX model estimates, we conducted standard diagnostic checks for serial correlation and model stability. All models satisfy the stability condition, with characteristic roots lying inside the unit circle. Most specifications also pass the Lagrange Multiplier test for autocorrelation at the 5% level, confirming that residuals are not serially correlated. These results, summarized in
Appendix A, support the econometric robustness of our impulse response analysis across the ASEAN+4 economies.
The impulse response functions in
Figure 4 and the impulse response magnitude in
Table 4 reveal several important patterns. U.S. monetary policy shocks lead to rapid and statistically significant increases in interest rates across most ASEAN economies within the first three months, especially in countries like Indonesia and the Philippines, which show stronger alignment with U.S. rate hikes. In contrast, Japan’s short-term rate remains flat, consistent with its zero-interest rate environment and monetary policy independence. Exchange rate responses vary; while the Japanese yen appreciates following global risk shocks, reflecting its safe-haven status, most of the Asian currencies, such as Indonesia rupiah and the Philippines peso, tend to depreciate, highlighting their vulnerability to capital outflows.
In response to oil price shocks, Malaysia and Indonesia—both oil exporters—see appreciations in their exchange rates, while oil importers like the Philippines experience currency depreciation. These dynamics are in line with trade-balance effects and confirm our theoretical expectations in
Table 2. Responses to global financial risk and uncertainty (VIX, GEPU) are more muted in interest rates but more pronounced in exchange rates, reflecting risk-driven portfolio reallocations rather than policy tightening. These asymmetries across economies and shocks underscore the trilemma’s relevance and the importance of economic structure in shaping policy outcomes.
The impulse response analysis reveals diverse monetary policy reactions to a one-percentage-point increase in the U.S. policy rate. Indonesia and Malaysia show notable increases in domestic interest rates, indicating a close alignment with U.S. monetary tightening. Korea displays moderate responsiveness, while Japan’s policy rate remains largely unchanged, reflecting its ongoing focus on domestic economic recovery and deflation management.
In terms of exchange rate responses, the Japanese yen appreciates significantly, consistent with its role as a safe-haven currency. The Hong Kong dollar also appreciates due to its currency board peg to the U.S. dollar. The Chinese Renminbi shows moderate appreciation, reflecting a balancing act between competitiveness and capital flow stability. In contrast, currencies such as the Philippine peso and Thai baht experience slight depreciation or remain stable, possibly due to weaker external buffers.
These results support the hypothesis that the degree of monetary policy autonomy and exchange rate flexibility influences responses to U.S. monetary policy shocks. However, variations across economies—particularly in China and the smaller ASEAN countries—highlight the role of domestic structural factors.
A one-percentage-point increase in global oil prices generates heterogeneous interest rate responses across the region. The Philippines exhibit the largest increase, suggesting inflationary pressures from oil imports. China also responds with notable interest rate hikes, reflecting its high dependence on energy imports. Japan’s interest rate response is more muted, likely due to a stable monetary regime and stronger inflation anchoring.
Exchange rate responses again underscore structural differences. Japan experiences substantial currency appreciation, reinforcing its safe-haven status even amid oil price shocks. The Renminbi depreciates slightly, while Indonesia and Malaysia—both oil exporters—see appreciations, consistent with improved terms of trade. These findings align with the hypothesis that exchange rate regimes and trade structures shape country-level responses to commodity price shocks.
Shocks to global financial risk, proxied by the VIX, elicit modest interest rate responses overall. China and the Philippines show slight monetary easing, possibly in an effort to counteract negative demand effects from heightened uncertainty. Other countries demonstrate limited interest rate movements, suggesting either stronger insulation or delayed monetary reactions.
On the exchange rate side, Japan again sees notable appreciation, confirming the yen’s safe-haven behavior. Other currencies show minimal or slightly negative movements. Singapore and the Philippines exhibit mild depreciations, indicating some vulnerability to risk-off sentiment. These outcomes reflect the trilemma-based hypothesis, with more flexible regimes allowing for exchange rate adjustment, while pegged or managed regimes rely more on interest rates or capital flow tools.
The response to global policy uncertainty shocks shows similar patterns to those of financial risk shocks, but with greater variation in interest rate behavior. China records the strongest interest rate increase, possibly as a pre-emptive tightening to maintain financial stability. In contrast, Japan and Korea show negligible changes, suggesting more robust monetary frameworks or a higher threshold for reactive policy shifts.
Exchange rate movements again show the yen appreciating significantly, followed by modest appreciations in the Singapore dollar, Indonesian rupiah, and Hong Kong dollar. These patterns support the safe-haven hypothesis while indicating that even managed exchange rate systems can experience moderate revaluation during global uncertainty episodes.
Financial stress shocks, as measured by the OFR Financial Stress Index, produce stronger and more widespread interest rate responses than the VIX or GEPU shocks. Hong Kong and Indonesia exhibit the sharpest increases in policy rates, signaling a proactive stance to defend financial stability. Japan and Korea register smaller rate hikes, consistent with relatively more resilient financial systems.
Exchange rate responses mirror earlier patterns. The Renminbi and yen appreciate notably, highlighting their perceived stability during stress episodes. Hong Kong’s dollar also appreciates due to its peg. In contrast, Malaysia and Indonesia experience depreciation, pointing to relative vulnerability and the limited buffering capacity of their financial systems.
Overall, the empirical findings provide strong, yet nuanced, support for the international finance trilemma. Economies with fixed exchange rates and open capital markets, such as Hong Kong, show limited monetary policy autonomy and strong alignment with U.S. interest rate movements. In contrast, countries with capital controls, particularly China, demonstrate greater monetary independence, although their exchange rate responses remain sensitive to external shocks. Economies with floating exchange rates and open capital accounts—such as Korea, Indonesia, and Malaysia—exhibit partial responsiveness, consistent with the theoretical expectation of constrained autonomy.
However, the results also highlight important asymmetries across shock types and countries. U.S. monetary policy shocks induce the most synchronized responses, underscoring their central role in global spillovers. Oil price shocks and global uncertainty measures produce more diverse reactions, influenced by domestic factors such as trade structure (e.g., oil exporters vs. importers), inflation expectations, and financial stability concerns. The frequent appreciation of the Japanese yen, regardless of shock type, reflects its unique position as a safe-haven currency rather than a straightforward case of monetary regime classification.
These findings emphasize that while the trilemma offers a useful conceptual framework, real-world responses are shaped by more than institutional constraints. Domestic macroeconomic priorities, credibility of policy institutions, and external perceptions (e.g., safe-haven status) all mediate the transmission of global shocks. This underlines the importance of flexible, context-sensitive monetary strategies and suggests that deeper regional coordination may help mitigate asymmetric spillovers across Asian economies.
The observed heterogeneity in exchange rate responses to global shocks is consistent not only with differences in exchange rate regimes and capital account openness, but also with deeper structural policy orientations. Many of the ASEAN+4 economies have historically followed developmental state strategies, characterized by export-led growth, industrial policy, and an emphasis on maintaining a competitive exchange rate. Countries like Malaysia, Thailand, and China have actively managed their exchange rates to support external competitiveness and macroeconomic stability, even under partially liberalized financial systems. These policy orientations may partly explain the relatively muted or asymmetric exchange rate reactions to global financial shocks, as authorities intervene to dampen volatility. Thus, while our model captures short-term dynamic responses, these patterns reflect broader policy frameworks that have shaped macroeconomic behavior in the region over the past two decades (
Eichengreen, 2008;
Wade, 1990).
In addition, most sample economies are active participants in regional and global economic integration frameworks, such as the ASEAN Economic Community (AEC), the Regional Comprehensive Economic Partnership (RCEP), and the World Trade Organization (WTO). These agreements influence the degree of trade and financial openness, as well as expectations of policy transparency and coordination. As a result, such institutional factors may also contribute to shared patterns—or divergences—in the way economies absorb and respond to global shocks.
7. Robustness Check
7.1. Big Economy Model
While the baseline SVARX model assumes that ASEAN+4 economies are primarily recipients of global shocks, this small open economy assumption may not fully apply to large economies such as China and Japan. These countries are not passive recipients of global conditions but active participants capable of influencing global financial variables such as oil prices, global risk sentiment, and capital flows (
Beirne et al., 2013;
P. Chen & Miao, 2024;
Cross & Nguyen, 2017;
Inoue & Okimoto, 2022).
In the robustness test for China and Japan, we revise the SVARX specification by treating global oil prices and global risk indicators (e.g., VIX, GEPU, and FSI) as endogenous variables, rather than exogenous. This modeling change acknowledges the growing influence that these two large economies exert on global markets. For example, fluctuations in China’s industrial output or Japan’s monetary stance can impact global oil demand and financial market sentiment. By endogenizing these variables, we allow for two-way spillover effects between domestic macroeconomic developments and global conditions—an interaction that the baseline model, which assumes small open economies, cannot capture. In this revised structure, only the U.S. interest rate remains exogenous, under the assumption that U.S. monetary policy is not immediately affected by developments in individual Asian economies. This extended model provides a more comprehensive view of policy interdependence and ensures that the empirical results are robust to the assumption of passive global conditions. In this “big economy” specification, the revised model for China and Japan includes six endogenous variables and one exogenous variable, as shown in Equation (11):
This framework allows us to capture potential bidirectional effects between global variables and domestic macroeconomic dynamics in China and Japan. Lag length selection based on the Akaike Information Criterion (AIC) identifies an optimal lag of one. We apply a recursive identification strategy using the Cholesky decomposition, ordering the endogenous variables to reflect plausible causal relationships.
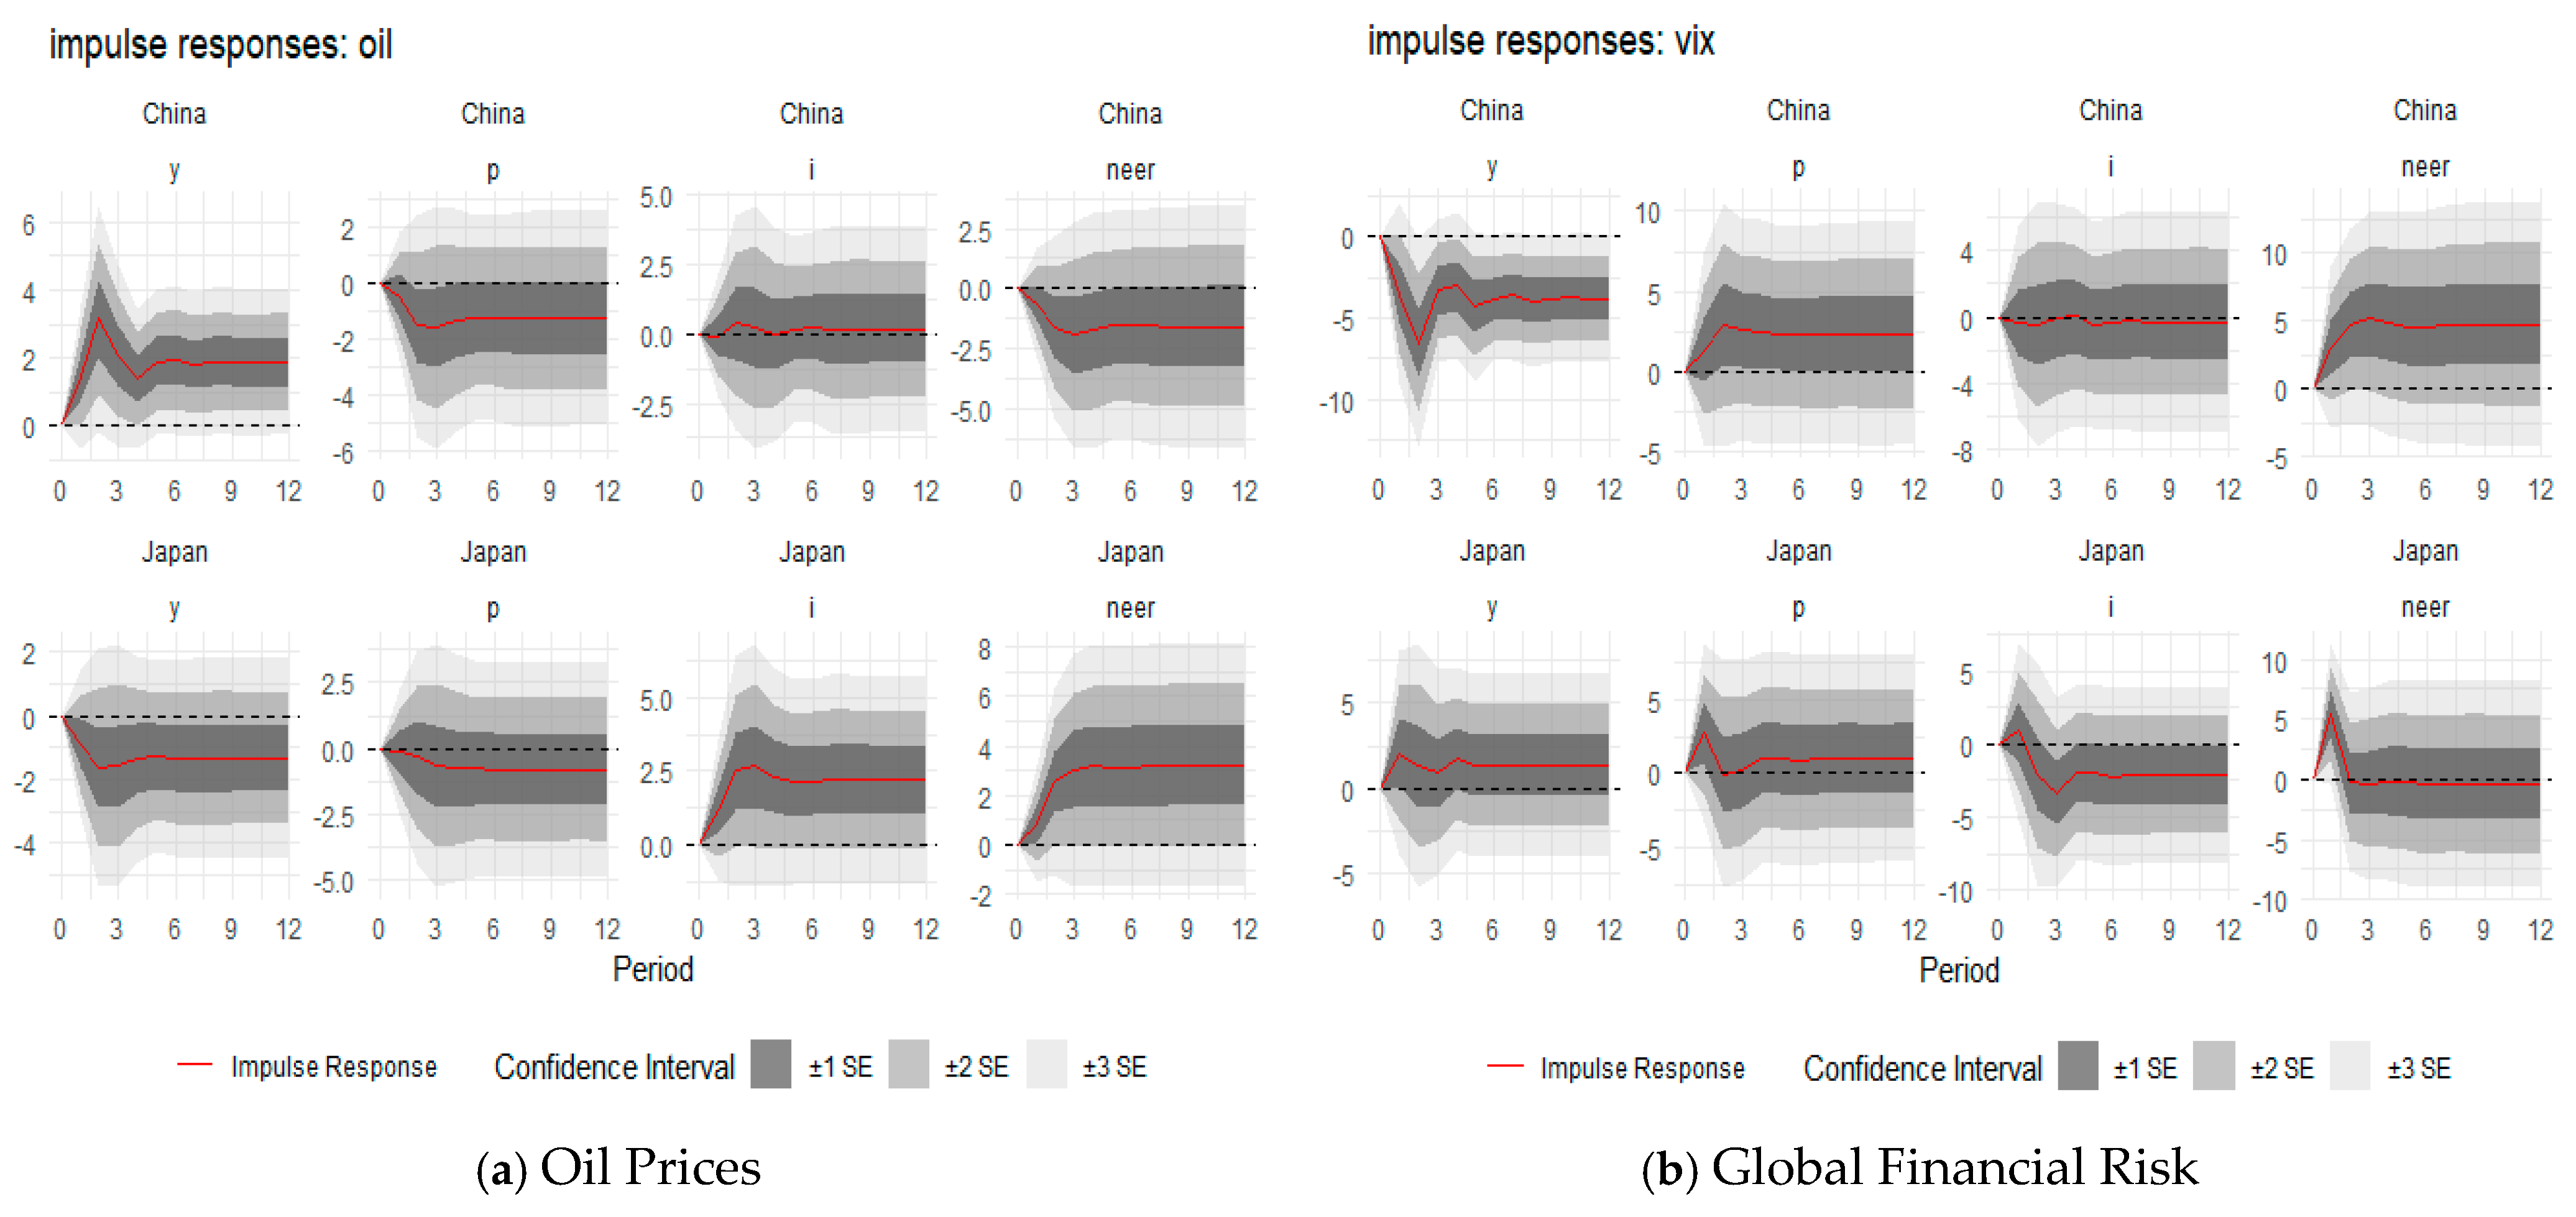
Figure 5 and
Figure 6 report the impulse response functions derived from the extended model. The results indicate that domestic variables in China and Japan significantly affect global conditions. For example, output shocks in China and monetary policy shocks in Japan are found to increase global oil prices. Furthermore, both Chinese output shocks and Japanese exchange rate shocks significantly influence global financial risk indicators. These results confirm that China and Japan exert considerable influence on global risk dynamics, justifying the endogenization of these global variables in the robustness check.
Importantly, the impulse responses of domestic interest rates and exchange rates to global shocks in the extended model remain consistent with those observed in the baseline specification. In China, monetary and exchange rate responses to global shocks remain substantial, reaffirming its growing role in the global economy. In Japan, exchange rate responses continue to reflect its status as a safe-haven currency. These findings validate the robustness of our original results and demonstrate that incorporating the global influence of large economies yields a more accurate representation of their interaction with global risk factors.
7.2. Monetary Base as Japanese Monetary Indicator
From 2010 to 2022, Japan’s short-term interest rate remained near zero, limiting its effectiveness as an indicator of monetary policy stance. The Bank of Japan (BOJ) introduced a negative interest rate policy in 2016 and relied heavily on quantitative and qualitative monetary easing. Under such conditions, the short-term rate becomes a poor proxy for policy shifts, as it lacks responsiveness to macroeconomic developments and external shocks.
From 2010 to 2022, Japan’s short-term interest rate remained near zero, limiting its usefulness as an indicator of monetary policy stance. Following the introduction of a negative interest rate policy in 2016, the Bank of Japan (BOJ) increasingly relied on quantitative and qualitative monetary easing. In this context, the short-term interest rate is a weak proxy for policy shifts, as it does not respond meaningfully to macroeconomic conditions or external shocks.
As an alternative, we follow
Miyao and Okimoto (
2020) and use the monetary base as a proxy for Japan’s unconventional monetary policy. The monetary base reflects BOJ’s liquidity operations and better captures policy actions in a zero lower bound environment, where interest rates become unresponsive to shocks. While this measure may exhibit some endogeneity to financial conditions, it still serves as a useful indicator of the BOJ’s active policy stance during periods of non-traditional easing.
The modified SVARX model is specified as follows:
where
represents the Japanese monetary base. Lag lengths for both endogenous and exogenous variables are set to one, as determined by the Akaike Information Criterion. We apply a recursive identification strategy using Cholesky decomposition of the reduced-form residuals.
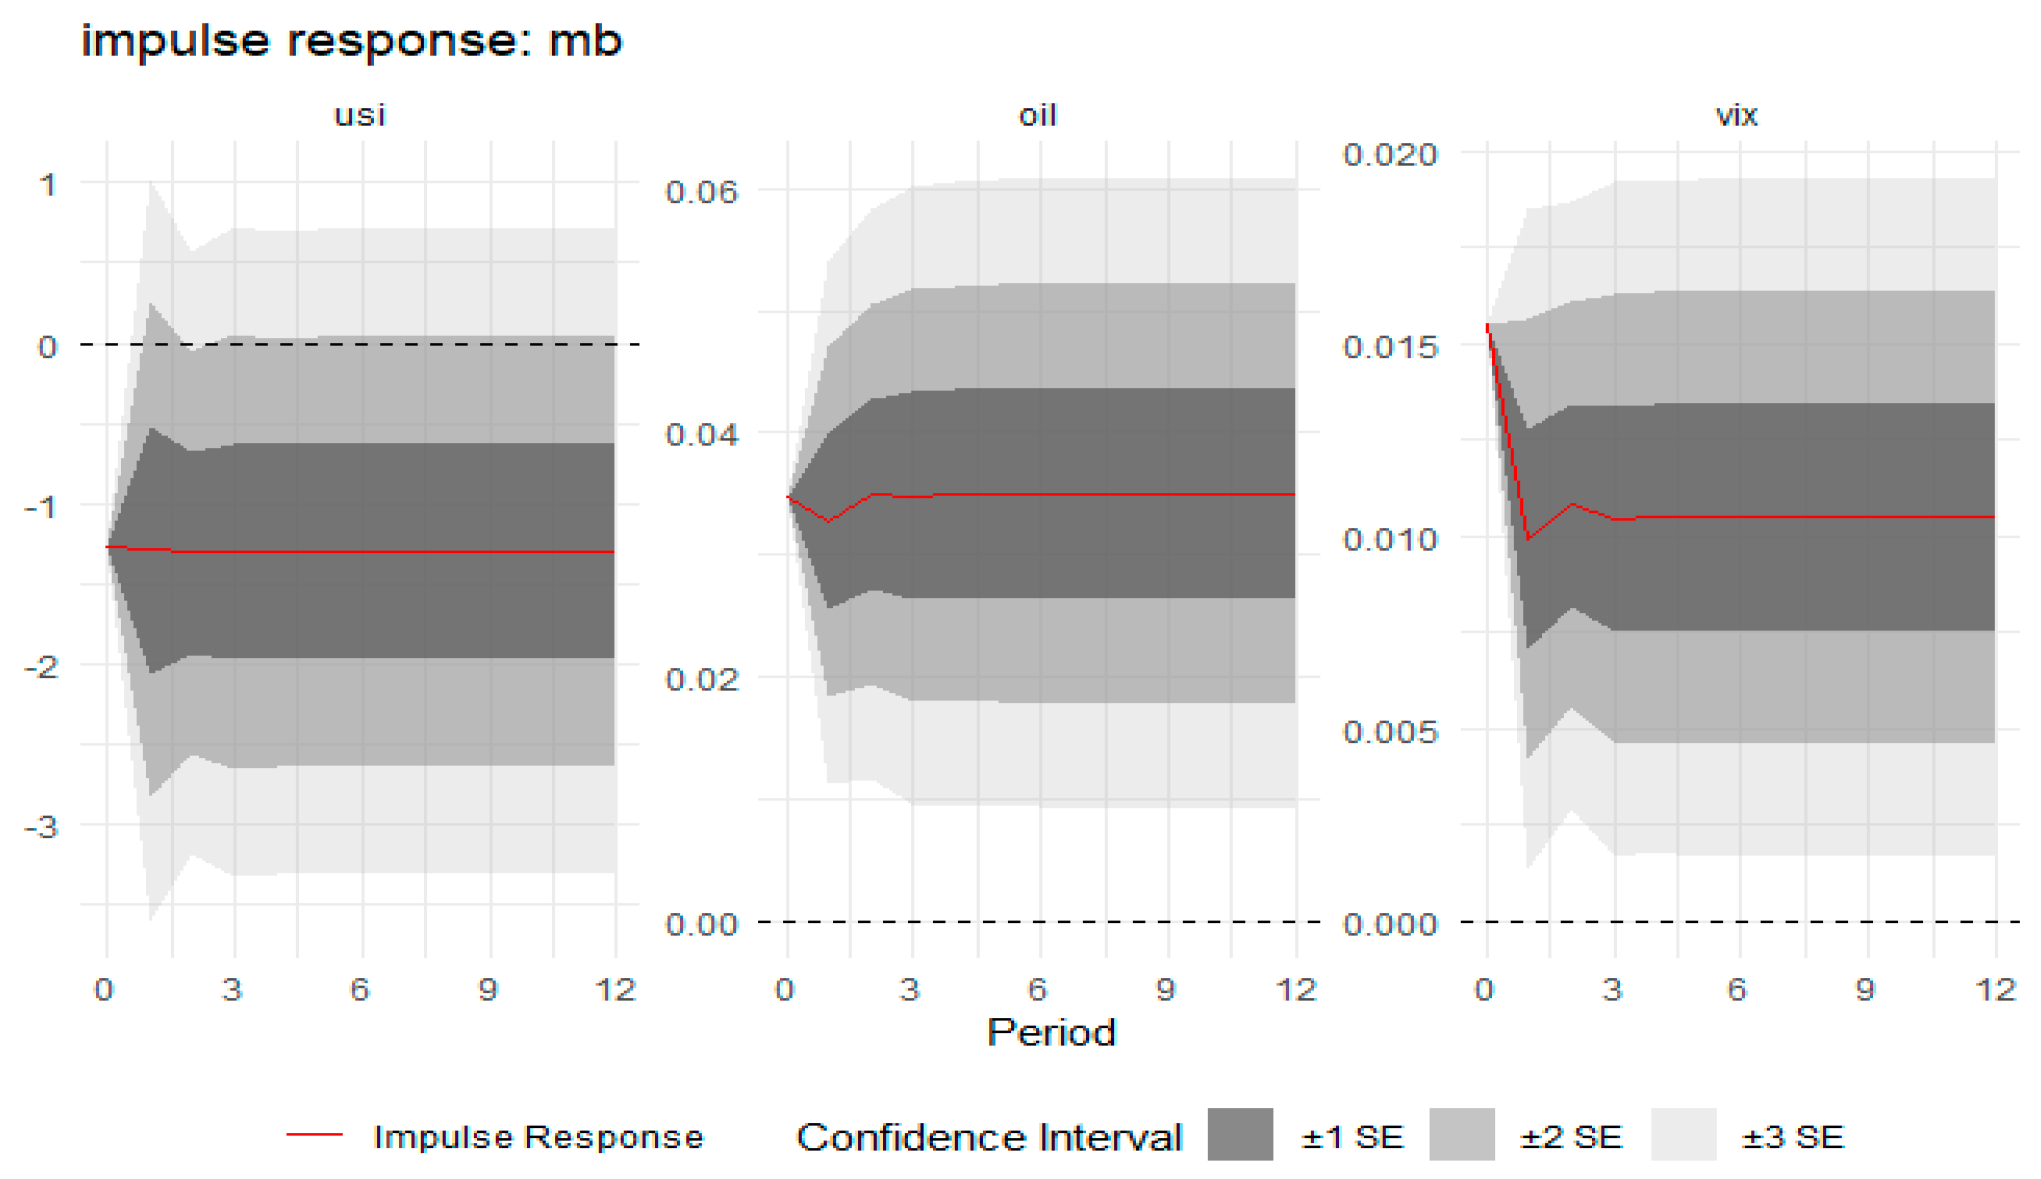
The results from this alternative specification, shown in
Figure 7, confirm the robustness of our baseline findings. The Japanese monetary base shows a significant negative response to U.S. monetary policy shocks, indicating a counteractive easing stance by the BOJ. In contrast, oil price and global financial risk shocks lead to a positive response in the monetary base, consistent with the hypothesis that the BOJ expands liquidity to stabilize the economy under external pressure.
These results reaffirm that Japan’s monetary policy behavior, even when measured through the monetary base, aligns with the patterns observed using the short-term interest rate. The BOJ’s policy response to U.S. tightening—particularly the expansion of the monetary base—is likely aimed at countering capital outflows, managing yen depreciation, and addressing inflationary pressures amid global divergence in policy stances.
Overall, this robustness check highlights the complexity of interpreting monetary policy under unconventional frameworks. Despite aggressive easing, Japan’s structural constraints and external vulnerabilities limited the transmission of policy into broader economic stabilization. While using the monetary base helps capture the BOJ’s policy intentions under the ZLB regime, we acknowledge its potential endogeneity and limitations as a standalone indicator. Nevertheless, the consistency of impulse response patterns between the interest rate and monetary base specifications provides confidence in the robustness of our main findings.
8. Concluding Remarks and Policy Implications
The international finance trilemma continues to shape the policy space available to Asian economies, especially in the face of increasingly complex global shocks. This study analyzed how ASEAN+4 economies—with varying monetary policy objectives and exchange rate regimes—responded to different global shocks using SVARX models and monthly data from 2010 to 2022.
Our findings indicate that most Asian monetary authorities, excluding Japan, adjust their policy rates in response to changes in U.S. monetary policy, primarily to stabilize exchange rates and manage capital flows. The extent of this alignment varies depending on each country’s exchange rate regime. Second, although global financial risk and policy uncertainty tend to drive currency depreciation across the region, their impact on short-term interest rates is relatively modest, suggesting that global risk appetite plays a limited role in shaping monetary policy. Third, we observe divergent responses between oil-exporting and oil-importing economies, reflecting the influence of domestic economic structures on policy reactions.
These findings yield several important policy implications. First, monetary authorities should enhance monitoring of global risk factors and their combined effects on domestic financial conditions, given their potential to trigger macroeconomic instability. Second, as U.S. monetary policy remains the most influential external shock source, national policy responses must be carefully calibrated to manage its cross-border spillovers.
Third, our results show that while ASEAN+4 economies share exposure to global shocks, their responses differ based on institutional settings. This heterogeneity highlights potential gains from regional policy coordination. Although full synchronization may not be feasible, sharing information, aligning communication strategies, and cooperating during major external shocks could help manage spillovers more effectively. Such coordination could enhance regional financial stability and resilience, especially during periods of heightened global uncertainty.
Finally, it is important to note that the results of this study reflect the specific historical context of the 2010–2022 period. This timeframe includes exceptional global events—such as the COVID-19 pandemic—that may have produced atypical policy responses. In addition, structural changes in global governance, shifting geopolitical dynamics, and evolving leadership priorities across major economies could influence future policy behavior in ways not captured in our current model. As such, caution is warranted in generalizing the results beyond the sample period, and future developments may lead to different configurations of the monetary trilemma in practice.


