1. Introduction
The rapid evolution of the cryptocurrency ecosystem has led to a complex and interconnected network of digital assets that extends well beyond foundational Layer 1 tokens, such as Bitcoin and Ethereum. Over the past decade, the emergence of decentralized finance (DeFi), stablecoins, and infrastructure governance tokens has formed the backbone of a novel financial architecture operating primarily outside traditional regulatory frameworks. These innovations underpin a growing share of transaction volumes, collateral systems, and on-chain liquidity provision, making the crypto-asset ecosystem increasingly systemically relevant.
This study is motivated by the urgent need to understand the structural vulnerabilities and interdependencies within this systemically important yet underregulated ecosystem, particularly in light of its growing integration with traditional financial markets. We focus on the period from September 2021 to March 2025, which captures key structural episodes, including the post-COVID-19 speculative rally, the 2022–2023 crypto winter (encompassing the Terra/LUNA and FTX collapses), and the post-halving political–economic shifts of 2024. This window also represents the earliest point at which complete and harmonized daily data is available across all selected crypto-assets, enabling consistent analysis of tail-dependent risk dynamics.
Despite these advances, the ecosystem remains acutely vulnerable to endogenous fragilities and external macroeconomic and financial shocks. Events such as the collapse of the Terra/LUNA algorithmic stablecoin (
Lee et al., 2023;
Santiago et al., 2025) and the FTX bankruptcy (
Galati et al., 2024;
Khan et al., 2025) have illustrated how local disruptions can trigger cascading spillovers across protocols, tokens, and exchanges. These incidents exposed an intricate web of interdependencies among governance tokens, DeFi protocols, stablecoin pegs, and oracle infrastructure, resulting in systemic liquidity freezes and abrupt repricing of risk.
While traditional financial markets are increasingly monitored using network-based systemic risk measures, cryptocurrency finance remains underanalyzed through this lens. Most studies rely on linear correlations, GARCH-type volatility models, or mean-based spillover indices (
Kumar et al., 2022;
Katsiampa et al., 2022). Such frameworks are poorly suited to capturing the nonlinear, regime-dependent contagion that characterizes crypto-assets, especially in the lower tail of the return distribution where systemic dislocations emerge. In markets where smart contracts can trigger automatic liquidations, bridges can break, and algorithmic stablecoins can collapse, feedback loops are more abrupt and more challenging to detect without tail-sensitive tools.
Recent studies have emphasized the asymmetric nature of connectedness in crypto markets. For example,
Xu et al. (
2021) and
Barkai et al. (
2024) demonstrate that tail-risk contagion is not evenly distributed across tokens; speculative assets, such as Bitcoin, act as systemic givers, while infrastructure assets, like Ethereum, are more susceptible to receiving shocks (
Ahelegbey et al., 2021). Similarly,
Bouri et al. (
2023) and
Esparcia et al. (
2024) highlight how major platform failures such as FTX led to downside volatility transmission toward DeFi and stablecoin markets, with varying resilience across tokens. The literature also notes that algorithmic stablecoins (e.g., DAI) are more unstable than fiat-collateralized ones (
Thanh et al., 2023). Additionally, their popularity increases during episodes of volatility in traditional cryptocurrency markets (
Łęt et al., 2023;
Hoang & Baur, 2024).
Nevertheless, a gap remains in capturing direct, tail-specific linkages across core crypto-asset groups. Conventional approaches conflate shared market exposure with direct spillovers, making it challenging to distinguish which assets or groups accurately transmit shocks under stress. Moreover, while methods such as the TVP-VAR (
Yousaf & Yarovaya, 2022) capture dynamic spillovers, they still often focus on average behavior rather than the extremes where risk amplification is most consequential.
In response to these limitations, our study uses a novel partial correlation-based network approach proposed by
Shahzad et al. (
2025) to model systemic tail dependence across the crypto-asset ecosystem. Specifically, we examine whether DeFi tokens, stablecoins, and infrastructure/governance assets exhibit asymmetric connectedness behavior during extreme downside versus upside events. We pay special attention to structural breaks induced by landmark events such as the Terra crash, the Ethereum Merge, the FTX collapse, and the 2024 U.S. election outcome, all of which shifted the crypto market’s systemic topology.
In this context, our study makes a timely contribution by examining systemic tail dependence across core segments of the crypto-asset ecosystem, namely, DeFi tokens, stablecoins, and infrastructure/governance tokens. Using a partial correlation-based network framework, we filter out standard shocks and identify direct and tail-specific linkages among crypto-assets. Unlike full-sample correlation or variance decomposition methods, our approach allows us to map dependence structures that emerge specifically in the lower (crash) and upper (surge) tails, providing a clearer picture of asymmetric contagion. For example, we ask whether stablecoins serve as volatility absorbers during crises or infrastructure tokens evolve into systemic transmitters during speculative rallies. Furthermore, the methodology enables us to explore possible drivers behind these interdependencies, such as liquidity linkages, protocol composability, and governance overlaps.
This study is motivated by a central research question: How does systemic tail dependence manifest across different segments of the crypto-asset ecosystem under extreme market conditions? To explore this core issue, we investigate the following sub-questions: (i) How are systemic risks distributed across major crypto-asset groups, such as DeFi tokens, stablecoins, and infrastructure tokens? (ii) Do connectedness patterns intensify asymmetrically during extreme downside (crashes) versus upside (bubbles) events? (iii) How do major crypto-specific events, such as stablecoin depegging, Bitcoin halving cycles, and political regime shifts, reshape the topology of systemic dependence in the crypto network?
To address these questions, this study analyzes daily return data for eight major crypto-assets, categorized into Layer 1 protocols, decentralized finance (DeFi) tokens, stablecoins, and infrastructure or governance tokens, from September 2021 to March 2025. The empirical framework combines Triangulated Maximally Filtered Graphs (TMFGs) applied to both partial correlation and quantile-based correlation matrices, enabling the identification of robust, tail-specific dependence structures across the crypto-asset network. This is complemented by a dynamic connectedness analysis using traditional Generalized Forecast Error Variance Decomposition (GFEVD) and rolling-window network estimation, which allows us to capture the evolution of systemic linkages over time. To interpret structural breaks in connectedness, we annotate the connectedness plots with major market events, including the Terra crash, the USDC depeg, the BTC halving, and the Trump election. Through this multi-layered approach, the paper offers three main contributions: First, it introduces a partial correlation-based network framework tailored to the tail-risk properties of crypto-assets, providing a clearer view of direct systemic linkages under extreme conditions. Second, it provides the first comprehensive analysis of tail-dependent connectedness across DeFi tokens, stablecoins, and infrastructure assets, highlighting their shifting and asymmetric roles across different market regimes. Third, by integrating event-based structural interpretation, the study provides actionable insights into how crypto-systemic risk evolves in response to endogenous disruptions and exogenous political–economic shocks, thereby contributing to emerging frameworks for monitoring crypto-financial stability. Thus, the findings suggest potential regulatory leverage points, such as protocol-level disclosures, liquidity reserve standards, and stress-tested governance rules, as viable instruments for mitigating extreme spillover risks.
The results indicate systemic connectedness in the crypto-asset ecosystem is highly state-dependent and asymmetric, with significantly stronger co-movements during extreme downside (lower-tail) events than during market surges. Ethereum, Chainlink, and Uniswap consistently act as central transmitters of systemic risk, while the stablecoin Dai generally serves as a volatility absorber; however, its insulation weakens during periods of stress. The dynamic analysis shows that connectedness is not constant but evolves in response to significant events, with the most pronounced surge in system-wide dependence occurring after the 2024 Bitcoin halving and subsequent U.S. political regime shift. Partial correlation-based methods prove more effective than traditional variance decomposition in detecting short-term structural breaks, offering sharper insights into how risk propagates through decentralized financial networks.
The remainder of the paper is organized as follows:
Section 2 reviews the literature,
Section 3 outlines the methodology,
Section 4 describes the data,
Section 5 presents the empirical results and discussion, and
Section 6 concludes this paper.
2. Literature Review
The growing body of research on systemic risk in crypto-asset markets reflects increasing concerns about interdependence, tail risks, and contagion dynamics. Early studies focused primarily on mean-based correlations and volatility spillovers across major cryptocurrencies (e.g., Bitcoin, Ethereum). However, more recent work has focused on identifying structural vulnerabilities in the broader cryptocurrency ecosystem, particularly among stablecoins, decentralized finance (DeFi) platforms, and infrastructure tokens.
2.1. Stablecoins and Systemic Spillovers
Stablecoins have become central to the functioning of DeFi and trading ecosystems, acting as units of account, mediums of exchange, and collateral instruments. According to
Łęt et al. (
2023), stablecoins such as USDT, USDC, and DAI exhibit distinct market behaviors tied to investor demand for safety during periods of heightened volatility in traditional cryptocurrencies like BTC and ETH. Their study finds that investor activity in stablecoins, measured via address count and transaction volume, responds significantly to downside shocks in volatile crypto markets, suggesting a flight-to-stability mechanism. However, stablecoins themselves are not immune to systemic pressures.
Thanh et al. (
2023) show that USDT and USDC exert significant spillover effects on other stablecoins. Additionally, algorithmic variants, such as DAI, are more prone to instability than their fiat-backed peers. Similarly,
Hoang and Baur (
2024) find that stablecoins exhibit strong co-movement with Bitcoin volatility and trading volumes, supporting functional integration within speculative cycles.
The literature also points to differentiated resilience among stablecoins during systemic events. During the FTX collapse,
Bouri et al. (
2023) and
Esparcia et al. (
2024) find that USDT was relatively more resistant to spillover shocks than algorithmic or less capitalized tokens.
Kristoufek (
2021) and
Shahzad et al. (
2025) caution against overestimating the safe-haven role of stablecoins, noting that increased issuance often responds to, rather than mitigates, rising systemic stress.
Recent evidence has also expanded the lens beyond crypto-to-crypto dynamics.
Napari et al. (
2025) examined the interplay between stablecoins and fiat currencies in emerging market and developing economies (EMDEs) with high levels of crypto adoption. Using a probabilistic principal component analysis (PPCA) to construct return and volatility indices, and applying time-varying correlation and TVP-VAR connectedness frameworks, they found that return shocks in EMDE currencies spill over into the stablecoin market, both before and after the COVID-19 pandemic. This finding suggests that stablecoins increasingly function as flight-to-safety instruments not just within the crypto ecosystem but also across macro-financial environments in the Global South.
2.2. DeFi, Infrastructure, and Tail Dependence
DeFi tokens, such as AAVE, UNI, and LINK, represent a layer of programmable finance built on smart contracts; however, they are inherently exposed to liquidity spirals and composability risks.
Katsiampa et al. (
2022) demonstrate strong co-movements between Ethereum-based tokens during the DeFi boom, with Ethereum increasingly acting as a foundational layer for NFTs, DAOs, and decentralized exchanges. This entrenchment makes DeFi tokens both recipients and amplifiers of systemic shocks.
Barkai et al. (
2024) propose a tailored systemic risk model for crypto markets, showing that conventional risk metrics understate the extent of tail dependencies. Using daily returns of tokens like Ripple and Litecoin, they find that tail-based models outperform GARCH-style volatility models in forecasting drawdowns. Similarly,
Ahelegbey et al. (
2021) distinguish speculative “tail givers” (e.g., BTC) from technical “tail receivers” (e.g., ETH), echoing the asymmetric transmission dynamics found in partial correlation networks. Using the TENET model,
Xu et al. (
2021) identify Ethereum as the most significant systemic emitter, in contrast to Bitcoin’s role as a systemic receiver. These findings are reinforced by
Ugolini et al. (
2023), who observe persistent within-market spillovers among DeFi and crypto tokens, in contrast to weaker linkages with traditional financial assets.
Recent studies have further contextualized the interdependence between DeFi ecosystems and broader monetary developments.
Wan et al. (
2025) explore the volatility spillovers between central bank digital currency (CBDC) uncertainty and cryptocurrencies across both time and frequency domains. Their results reveal that CBDC-related uncertainty transmits short-term risk to cryptocurrencies, with a greater spillover observed as CBDC initiatives progress globally. They find that “good” volatility dominates, suggesting that DeFi markets may respond optimistically to regulatory innovation and digital monetary shifts, albeit with rising systemic entanglement.
In parallel,
Huang and Hsu (
2025) employed the GARCH-EVT-Copula framework to analyze dependence structures across primary DeFi tokens. They found stronger tail associations between DeFi tokens and Ethereum than between DeFi tokens and Bitcoin, emphasizing Ethereum’s central role in DeFi infrastructure. Their findings reveal weaker lower-tail dependencies among DeFi tokens, suggesting a potential for these assets to mitigate extreme downside contagion and offer diversification benefits in turbulent markets. These insights contribute to a growing recognition of DeFi’s dual role, as a risk amplifier through composability and governance fragility, and as a potential stabilizer under specific structural conditions.
Khiari et al. (
2025) examine how cryptocurrency fraud events influence price volatility using a framework rooted in information asymmetry theory and rational speculation. They argue that the lack of regulatory oversight and uneven information distribution contribute significantly to abnormal price swings, especially for tokens with opaque governance. Their findings underscore the relevance of incorporating fraud dynamics and governance quality into systemic risk models. While their study focuses on fraud-induced volatility, our work extends this line of inquiry by examining how governance tokens and decentralized protocols amplify or absorb tail-risk spillovers within a broader systemic framework.
2.3. Crisis Events and Contagion
The literature on crypto contagion has grown rapidly due to high-profile events such as the Terra/LUNA collapse and the FTX bankruptcy.
Lee et al. (
2023),
Santiago et al. (
2025), and
Briola et al. (
2023) document the abrupt disintegration of cross-asset stability during the Terra incident, highlighting its significant impact on market sentiment, inter-token dependency, and cross-chain liquidity. The collapse triggered repricing across major and minor tokens, as reliance on the Anchor protocol incentives exposed systemic fragilities.
The FTX episode marked a second systemic rupture.
Khan et al. (
2025),
Galati et al. (
2024), and
Conlon et al. (
2023) provide evidence of strong negative contagion across digital assets and centralized exchange tokens, with pronounced investor flight and price distortions. While
Bouri et al. (
2023) identify Solana as the most exposed asset due to its ties to FTX, others, such as
Yousaf et al. (
2023) and
Jalan and Matkovskyy (
2023), stress the importance of governance failures and regulatory gaps rather than crypto-specific mechanics per se.
The contagion remained contained mainly within crypto markets, with limited spillover to traditional assets. However,
Yousaf and Yarovaya (
2022) and
Liao et al. (
2024) show that tail risks between digital and traditional assets increase during extreme episodes, particularly when political or macroeconomic factors intersect with crypto-specific turmoil.
2.4. Toward Tail-Sensitive Network Approaches
Despite these advances, a gap remains in tools that simultaneously capture directionality, partial dependence, and tail asymmetries.
Kumar et al. (
2022) and
Barkai et al. (
2024) argue that linear models often underrepresent systemic risk, particularly in the context of high-frequency or short-horizon shocks. Partial correlation-based network models, which isolate direct linkages by filtering out common market influences, offer a promising alternative.
This gap is particularly acute in understanding asymmetric risk roles during downside vs. upside events. The potential of stablecoins to serve as shock absorbers or infrastructure tokens, such as Chainlink, to become systemic nodes has been underexplored. By integrating partial and quantile correlation frameworks with event-based structural analysis, this study extends the existing literature to provide a more detailed and time-sensitive view of systemic connectedness in cryptocurrency markets. Building on these gaps, our study differentiates itself from the prior literature in several aspects. First, while many previous studies employ linear correlation, GARCH-type volatility models, or TVP-VAR frameworks to estimate spillovers (e.g.,
Katsiampa et al., 2022;
Kumar et al., 2022;
Yousaf & Yarovaya, 2022), we adopt the partial correlation-based network approach proposed by
Shahzad et al. (
2025). This method is specifically tailored to isolate direct and tail-specific dependencies by filtering out common shocks that traditional models often confound. Second, the asset selection in our study spans a broader ecosystem than most prior research. Whereas some works focus solely on stablecoins (e.g.,
Thanh et al., 2023;
Hoang & Baur, 2024), Layer 1 tokens (e.g.,
Kristoufek, 2021), or on single-event contagion effects (e.g.,
Bouri et al., 2023;
Esparcia et al., 2024), our study integrates assets across four distinct categories: Layer 1, DeFi, stablecoins, and infrastructure/governance tokens. This more holistic classification enables us to capture the whole structure of functional and systemic interdependence. Third, unlike earlier studies that emphasize mean-based connectedness or event-specific dynamics, we model both lower- and upper-tail dependencies, offering insights into how systemic risk manifests during crises and speculative surges. By covering the period from September 2021 to March 2025, our analysis incorporates multiple structural shifts, including the Terra-LUNA collapse, Ethereum Merge, FTX fallout, and the 2024 U.S. election cycle.
Finally, our empirical strategy blends static partial correlation networks with dynamic Generalized Forecast Error Variance Decomposition (GFEVD) methods, enabling us to disentangle both short-term and evolving patterns of systemic connectedness. This layered approach yields a more comprehensive understanding of how risk propagates across different segments of the crypto-asset ecosystem under various market conditions.
Recent contributions have further emphasized the need for modeling frameworks that account for tail-dependent and asymmetric systemic dynamics. For instance,
Atik et al. (
2025) introduce a novel measure of nonlinear tail dependence between major cryptocurrencies, stablecoins, and commodity markets, uncovering persistent upper and lower tail linkages that vary across expansionary and contractionary monetary regimes. Their results underscore the structural entrenchment of crypto-assets in broader macro-financial cycles, particularly through dual-sided tail dependencies that conventional models may overlook. Complementing this,
Benbachir et al. (
2025) examine asymmetric multifractality in DeFi markets, revealing stronger correlation structures during downturns for tokens like AAVE, SNX, and MKR. Their findings point to distinctive long-memory properties and asymmetric trend sensitivities that challenge the assumptions of time-invariant or Gaussian-based risk models. These studies reinforce the value of tail-sensitive, behavior-aware approaches to mapping systemic interdependence across crypto-assets.
Our theoretical perspective is also aligned with recent advances in the literature that emphasize the role of information asymmetry, fraud risk, and behavioral volatility channels in shaping systemic dependencies across crypto-assets. For example,
Khiari et al. (
2025) investigate how cryptocurrency fraud exacerbates price volatility, emphasizing the need for models that incorporate both governance quality and asymmetric information structures. While their study focuses on fraud-induced volatility patterns, their integration of theories such as rational speculation and behavioral contagion highlights the underlying mechanisms through which systemic shocks can spread. Building on this, our study extends the analysis to network-level systemic interdependence, offering a tail-sensitive and structure-aware framework to detect how infrastructure design and protocol functionality contribute to risk amplification or absorption in extreme market conditions.
2.5. Normative Structures and Regulatory Context
While systemic risk in traditional financial systems is subject to globally coordinated oversight, the crypto-asset ecosystem still lacks a comprehensive and harmonized regulatory framework. In conventional finance, institutions such as the Financial Stability Board (FSB) and the Basel Committee on Banking Supervision (BCBS) have developed macroprudential guidelines to manage systemic risk. These include capital adequacy requirements, stress testing, and systemic importance assessments for financial institutions (
Basel Committee on Banking Supervision, 2022).
In the crypto domain, regulatory efforts remain fragmented and vary significantly across jurisdictions. However, recent global initiatives signal an increasing level of coordination. The FSB has published a comprehensive global regulatory framework for crypto-asset activities, which outlines recommendations to address financial stability risks, particularly those arising from interconnected platforms and inadequate risk management practices (
Financial Stability Board (FSB), 2023a). Complementing this, the FSB has also released high-level recommendations for the regulation, supervision, and oversight of global stablecoin arrangements, focusing on risk management, redemption rights, and cross-border interoperability (
Financial Stability Board (FSB), 2023b). These initiatives reflect a growing recognition of the systemic relevance of certain crypto-assets and underscore the need for real-time surveillance tools and stress-responsive governance mechanisms, goals consistent with the methodological contributions of this paper.
The absence of consistent regulation, particularly in Decentralized Finance (DeFi), exacerbates systemic vulnerabilities. Protocols involving uncollateralized lending, algorithmic stablecoins, and interlinked smart contracts are especially susceptible to tail risks and cascading failures. As shown in recent research, such as
Aldasoro et al. (
2023), interactions between the crypto sector and traditional banking can amplify shocks, reinforcing the need for robust diagnostics and monitoring frameworks. In this context, tail-sensitive and structure-aware tools, like the partial correlation networks used in this study, offer valuable insights for both academic and policy applications.
3. Research Methodology
This study employed the innovative connectedness methodology developed by
Shahzad et al. (
2025), which combines partial correlation networks with quantile-based tail dependence metrics to explore systemic risk transmission and directional linkages within the crypto-asset ecosystem. This framework is particularly effective for detecting nonlinear and asymmetric dependencies that emerge during market stress conditions. We began by calculating the conventional Pearson correlation coefficient, which captures the average linear co-movement between asset return series:
Although this measure offers insights under typical market conditions, it does not adequately reflect co-movements in the tails of the return distribution. To address this limitation, we followed
Shahzad et al. (
2025) by employing extreme downside correlation (EDC) and extreme upside correlation (EUC), which are computed at the lower and upper quantiles, respectively. The EDC for a specific quantile
τ is expressed by:
where the
τ-quantile conditional returns are defined as:
A similar formulation is used to estimate the EUC at upper quantiles ().
To account for conditional relationships between assets, the methodology introduces first-order partial correlations. This allowed us to isolate the direct dependence between asset
i and asset
j by controlling for the mediating effect of a third asset
k:
This adjustment helps distinguish between direct and indirect interdependencies. The difference between the full Pearson correlation and the partial correlation indicates the contribution of the mediating asset
k:
To quantify the overall systemic impact of each asset, we computed the average mediating influence that asset
k exerts across all pairwise relationships involving asset
i:
From the resulting dependence matrix, we derived directional connectedness measures, including:
Finally, the total connectedness index (TCI) is calculated as the mean of all values in the dependence matrix, summarizing the extent of systemic interdependence across the network. This matrix is designed to be asymmetric and sparse, capturing both the direction and selectivity of real-world financial spillovers. Unlike traditional model-based techniques such as VAR-GFEVD, this nonparametric method does not rely on distributional assumptions. It is thus more robust to the heavy tails and regime switches often observed in crypto-asset returns. Furthermore, by combining partial correlation filtering with tail-specific quantile dependence (EDC/EUC), our approach offers two key advantages: (i) it isolates direct spillovers by removing the influence of common shocks, and (ii) it detects nonlinear asymmetries that only emerge during extreme downside or upside events. This structure-aware framework provides a sharper and more accurate mapping of systemic risk compared to conventional methods, especially under stress conditions. The use of rolling-window estimation further enhances temporal sensitivity, allowing us to capture dynamic shifts in network topology induced by major structural events such as the Terra collapse, the USDC depeg, and the FTX bankruptcy. Compared to the TENET approach (
Xu et al., 2021), which identifies tail-event spillovers via Granger-type causality structures, our framework is undirected and model-free, making it more suitable for systems characterized by simultaneity and dense interconnections. Moreover, unlike TVP-VAR-based connectedness metrics, which often overestimate systemic ties due to additive GFEVD structures, our partial correlation network avoids spurious links and better reflects actual tail-risk dependencies. This makes our methodology especially practical in crypto-asset markets, where nonlinearity, structural breaks, and endogenous feedback loops are pervasive.
4. Data Description
This study utilized daily closing price data for eight major crypto-assets spanning from 14 September 2021 to 31 March 2025, covering multiple market phases, including the post-COVID-19 speculative rally, the 2022–2023 bear market, and the renewed structural shifts following the 2024 Bitcoin halving and political realignment in the United States. The starting date (14 September 2021) was selected because it marks the earliest point at which consistent, high-frequency data is available across all eight selected assets, ensuring methodological uniformity and robustness. Additionally, this period encompasses multiple structural breaks, allowing us to observe the evolution of systemic risk across exuberant, turbulent, and recovery phases in crypto markets. The selected crypto-assets were grouped into four core categories that reflect their distinct functional roles within the broader crypto-financial ecosystem, ensuring a theoretically grounded and methodologically consistent analysis of systemic tail dependence.
The first group includes Bitcoin (BTC) and Ethereum (ETH), which serve as the primary building blocks for running decentralized applications and smart contracts. Because they are widely used and heavily traded, these assets often lead the way when market-wide risks spread across different crypto tokens. The second group includes DeFi tokens such as Uniswap (UNI) and Chainlink (LINK), which facilitate key financial tools like decentralized exchanges and pricing systems. Because they are widely connected to other crypto systems, they play a significant role in spreading risk during market turmoil. The third group is represented by Dai (DAI), a decentralized, overcollateralized stablecoin that functions as a key unit of account, means of payment, and collateral asset across the DeFi landscape. The inclusion of DAI is particularly relevant given the increased scrutiny on stablecoins following incidents like the USDC depeg in March 2023, which exposed vulnerabilities in liquidity and peg maintenance mechanisms. Finally, the infrastructure and governance token group comprises Maker (MKR), The Graph (GRT), and Synthetix (SNX). These tokens provide essential protocol-level services, including decentralized governance, data indexing, and the creation of synthetic assets. Their inclusion captures an additional layer of system functionality that supports the scalability and resilience of decentralized ecosystems.
The choice to focus on these eight tokens, rather than a broader or random selection of cryptocurrencies, was both theoretically and empirically grounded. We aimed to assess systemic tail dependence across three functionally distinct yet systemically critical segments of the crypto-financial system: DeFi tokens, stablecoins, and infrastructure/governance assets. This aligns with the recent literature emphasizing the need to study tail spillovers within decentralized financial architectures (e.g.,
Napari et al., 2025;
Huang & Hsu, 2025;
Benbachir et al., 2025). For instance,
Huang and Hsu (
2025) show that DeFi tokens have weaker lower-tail dependence, offering diversification during downturns, while
Napari et al. (
2025) highlight the growing role of stablecoins as safe-haven assets during emerging market stress. Similarly,
Benbachir et al. (
2025) find asymmetric multifractality in infrastructure tokens, such as MKR and SNX, which justifies their inclusion in systemic risk studies. Therefore, our selected assets were not only among the most liquid and capitalized but also represent key vectors of transmission and absorption of tail risk across DeFi infrastructures, as documented in the growing literature.
Moreover, all assets meet the requirements for empirical robustness in terms of liquidity, market capitalization, and data availability across the entire sample period. The final dataset includes log return series computed from daily closing prices and standardized across assets. This structure enables the application of partial correlation and quantile network methods, which are particularly sensitive to noise and structural outliers.
Table 1 provides a classification of the selected crypto-assets used in the empirical analysis, grouped by their functional roles in the ecosystem.
Table 1 also highlights each asset’s specific focus within its category, allowing for a more straightforward interpretation of its systemic relevance and potential tail-risk behavior.
Table 2 illustrates the descriptive statistics.
Table 2 presents the descriptive statistics of the daily log returns for the eight selected cryptocurrencies over the sample period. Across all series, the return distributions exhibit varying degrees of skewness and high kurtosis, indicating significant deviations from normality. The Jarque–Bera statistics strongly reject the null hypothesis of normality for all assets, particularly for DAI, which displays extreme kurtosis. This highlights its role as a highly non-Gaussian asset, likely due to its peg mechanisms. The Elliott–Rothenberg–Stock (ERS) test results confirm stationarity for all return series. Furthermore, the Ljung–Box Q(20) and Q
2(20) statistics reveal traces of autocorrelation and volatility clustering, especially for ETH, LINK, and the infrastructure tokens (MKR, GRT, and SNX). These findings validate the use of models that accommodate nonlinearity and tail dependence in empirical analysis.
5. Empirical Results
5.1. Preliminary Analysis
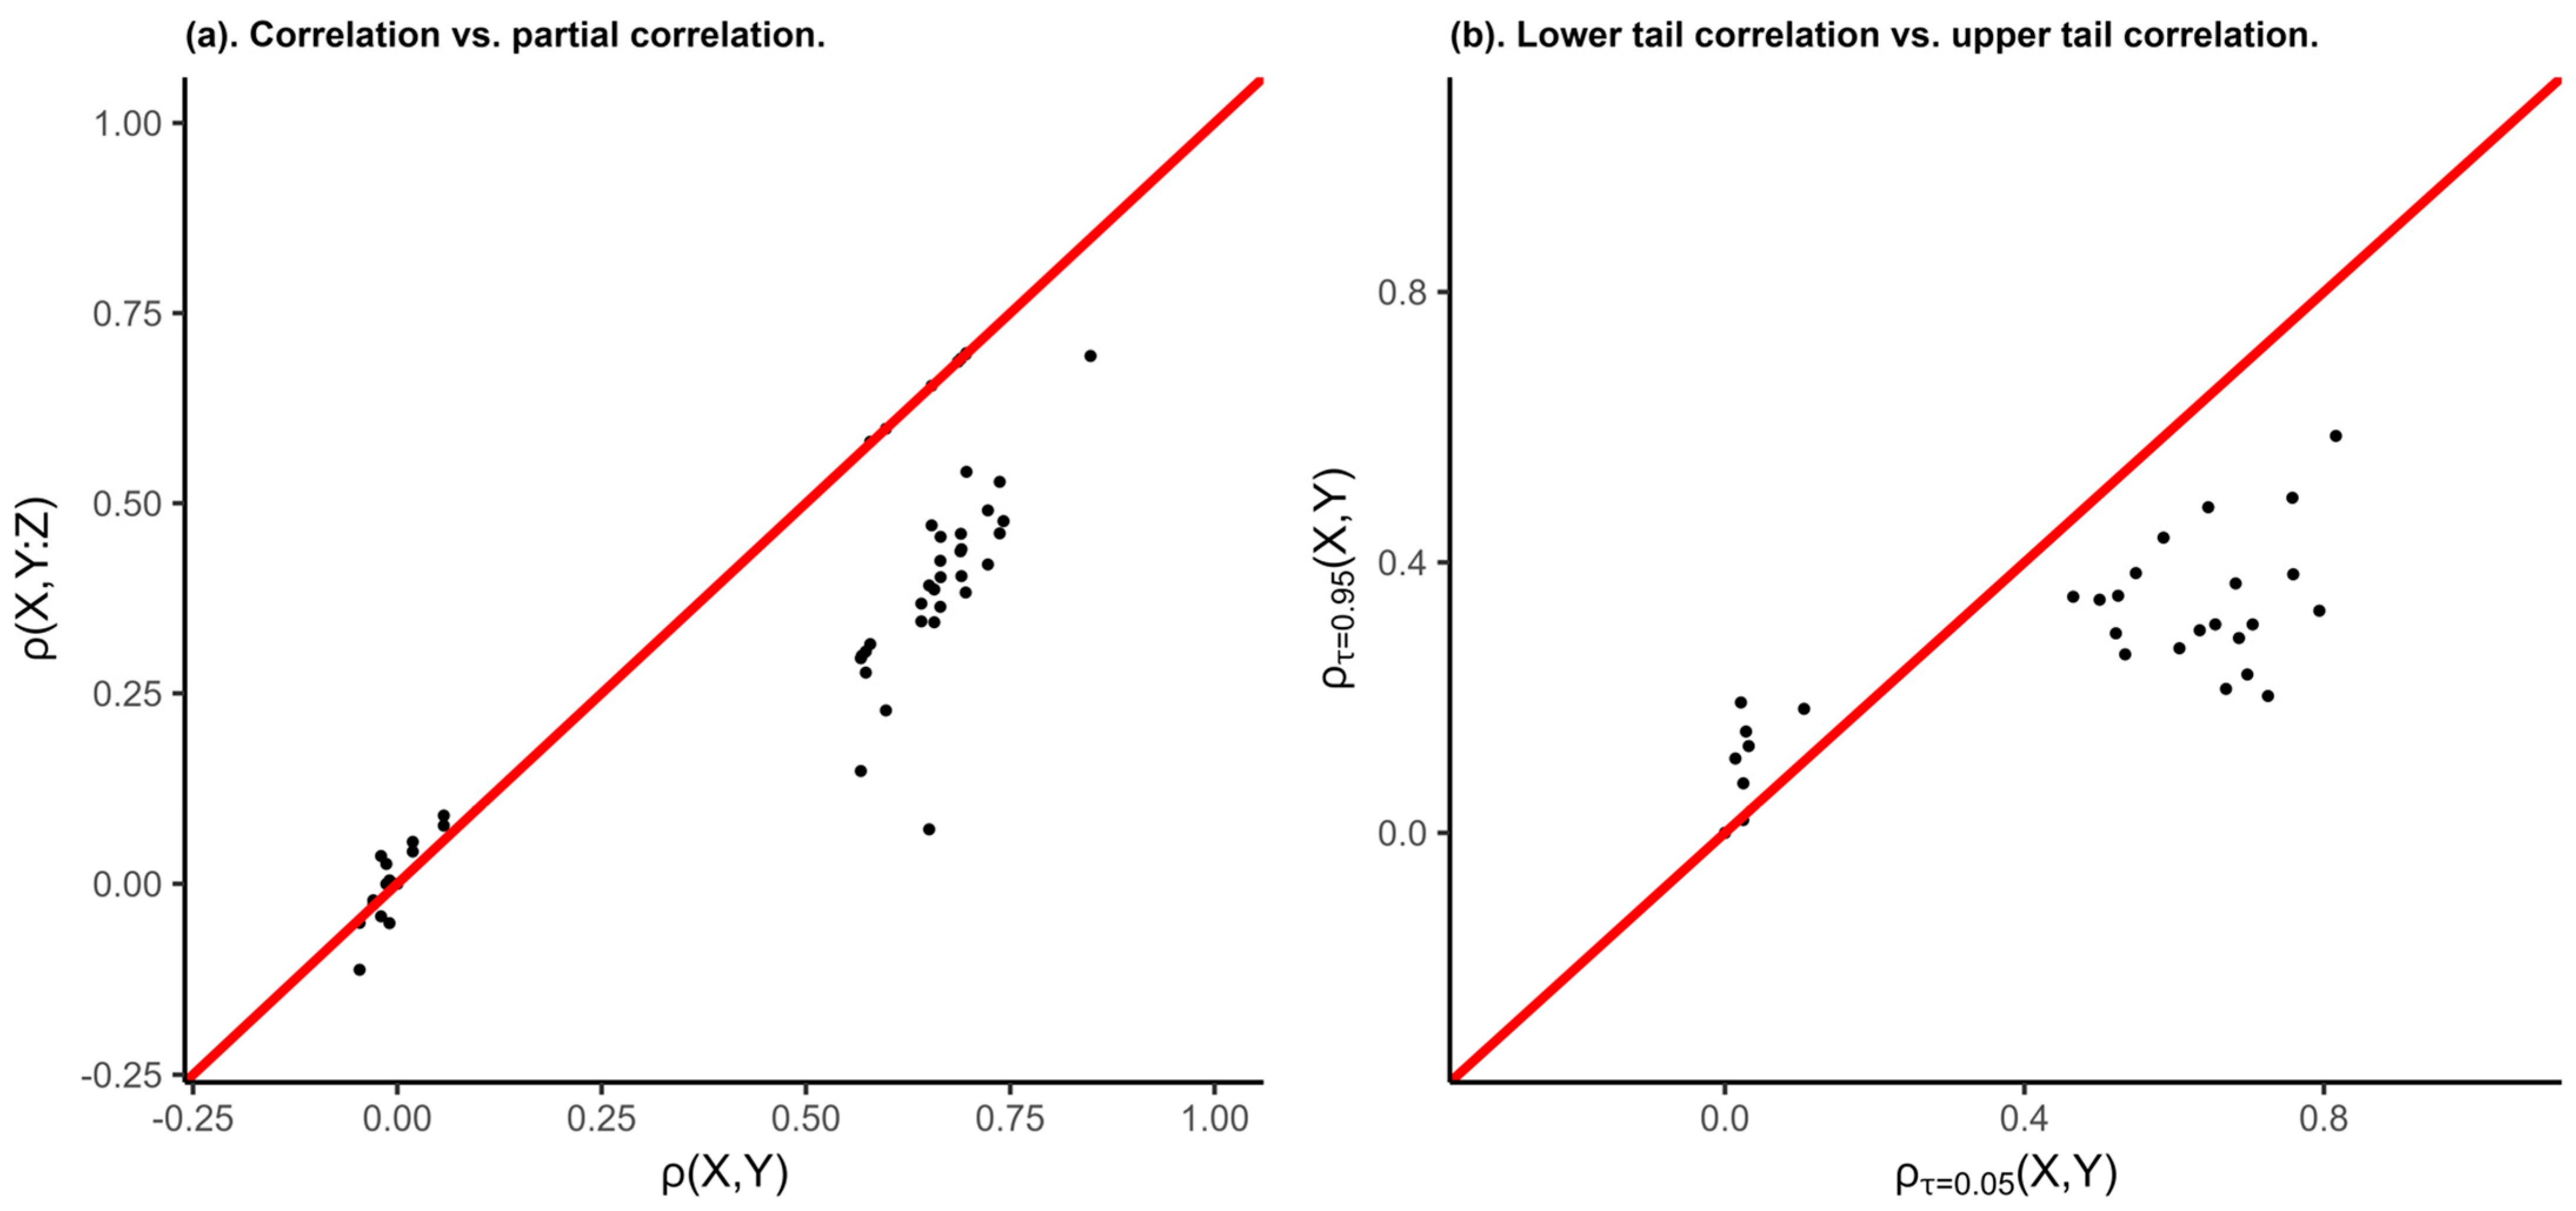
Figure 1 presents a set of scatter plots comparing alternative dependence measures across all unique pairs of the eight selected crypto-assets. The goal was to assess whether traditional dependence metrics adequately capture the structure and asymmetries in the crypto-asset network, especially under extreme market conditions.
The left panel of
Figure 1 plots standard Pearson correlation coefficients on the horizontal axis against partial correlation coefficients on the vertical axis. Each point corresponds to a unique asset pair. The prevalence of points below the 45-degree line suggests that unconditional (Pearson, London, UK) correlations systematically overstate the degree of dependence between assets. This is because Pearson correlations fail to account for the mediating influence of other variables in the system. In contrast, partial correlations isolate the direct relationship between two assets, controlling for all others. The observed downward shift relative to the identity line reinforces the appropriateness of partial correlation as a more accurate and structure-sensitive measure of interdependence in complex asset networks.
The right panel compares lower-tail dependence (correlation at the 5th percentile of the joint return distribution) with upper-tail dependence (correlation at the 95th percentile). Most points lie below the 45-degree line, indicating that dependence tends to be stronger in the downside tail than in the upside tail. This asymmetry implies that crypto-assets co-move more tightly during negative market shocks than during rallies, a finding consistent with the patterns of contagion observed in other asset classes. Such tail asymmetry is significant in systemic risk, where the joint downside exposure most often triggers market-wide instability. These preliminary results indicate the limitations of conventional correlation analysis in capturing the dynamics of crypto-asset interdependence. They also emphasize the importance of utilizing tail-sensitive and structure-aware methods, such as partial and quantile-based correlation networks, for effective systemic risk monitoring in decentralized financial systems.
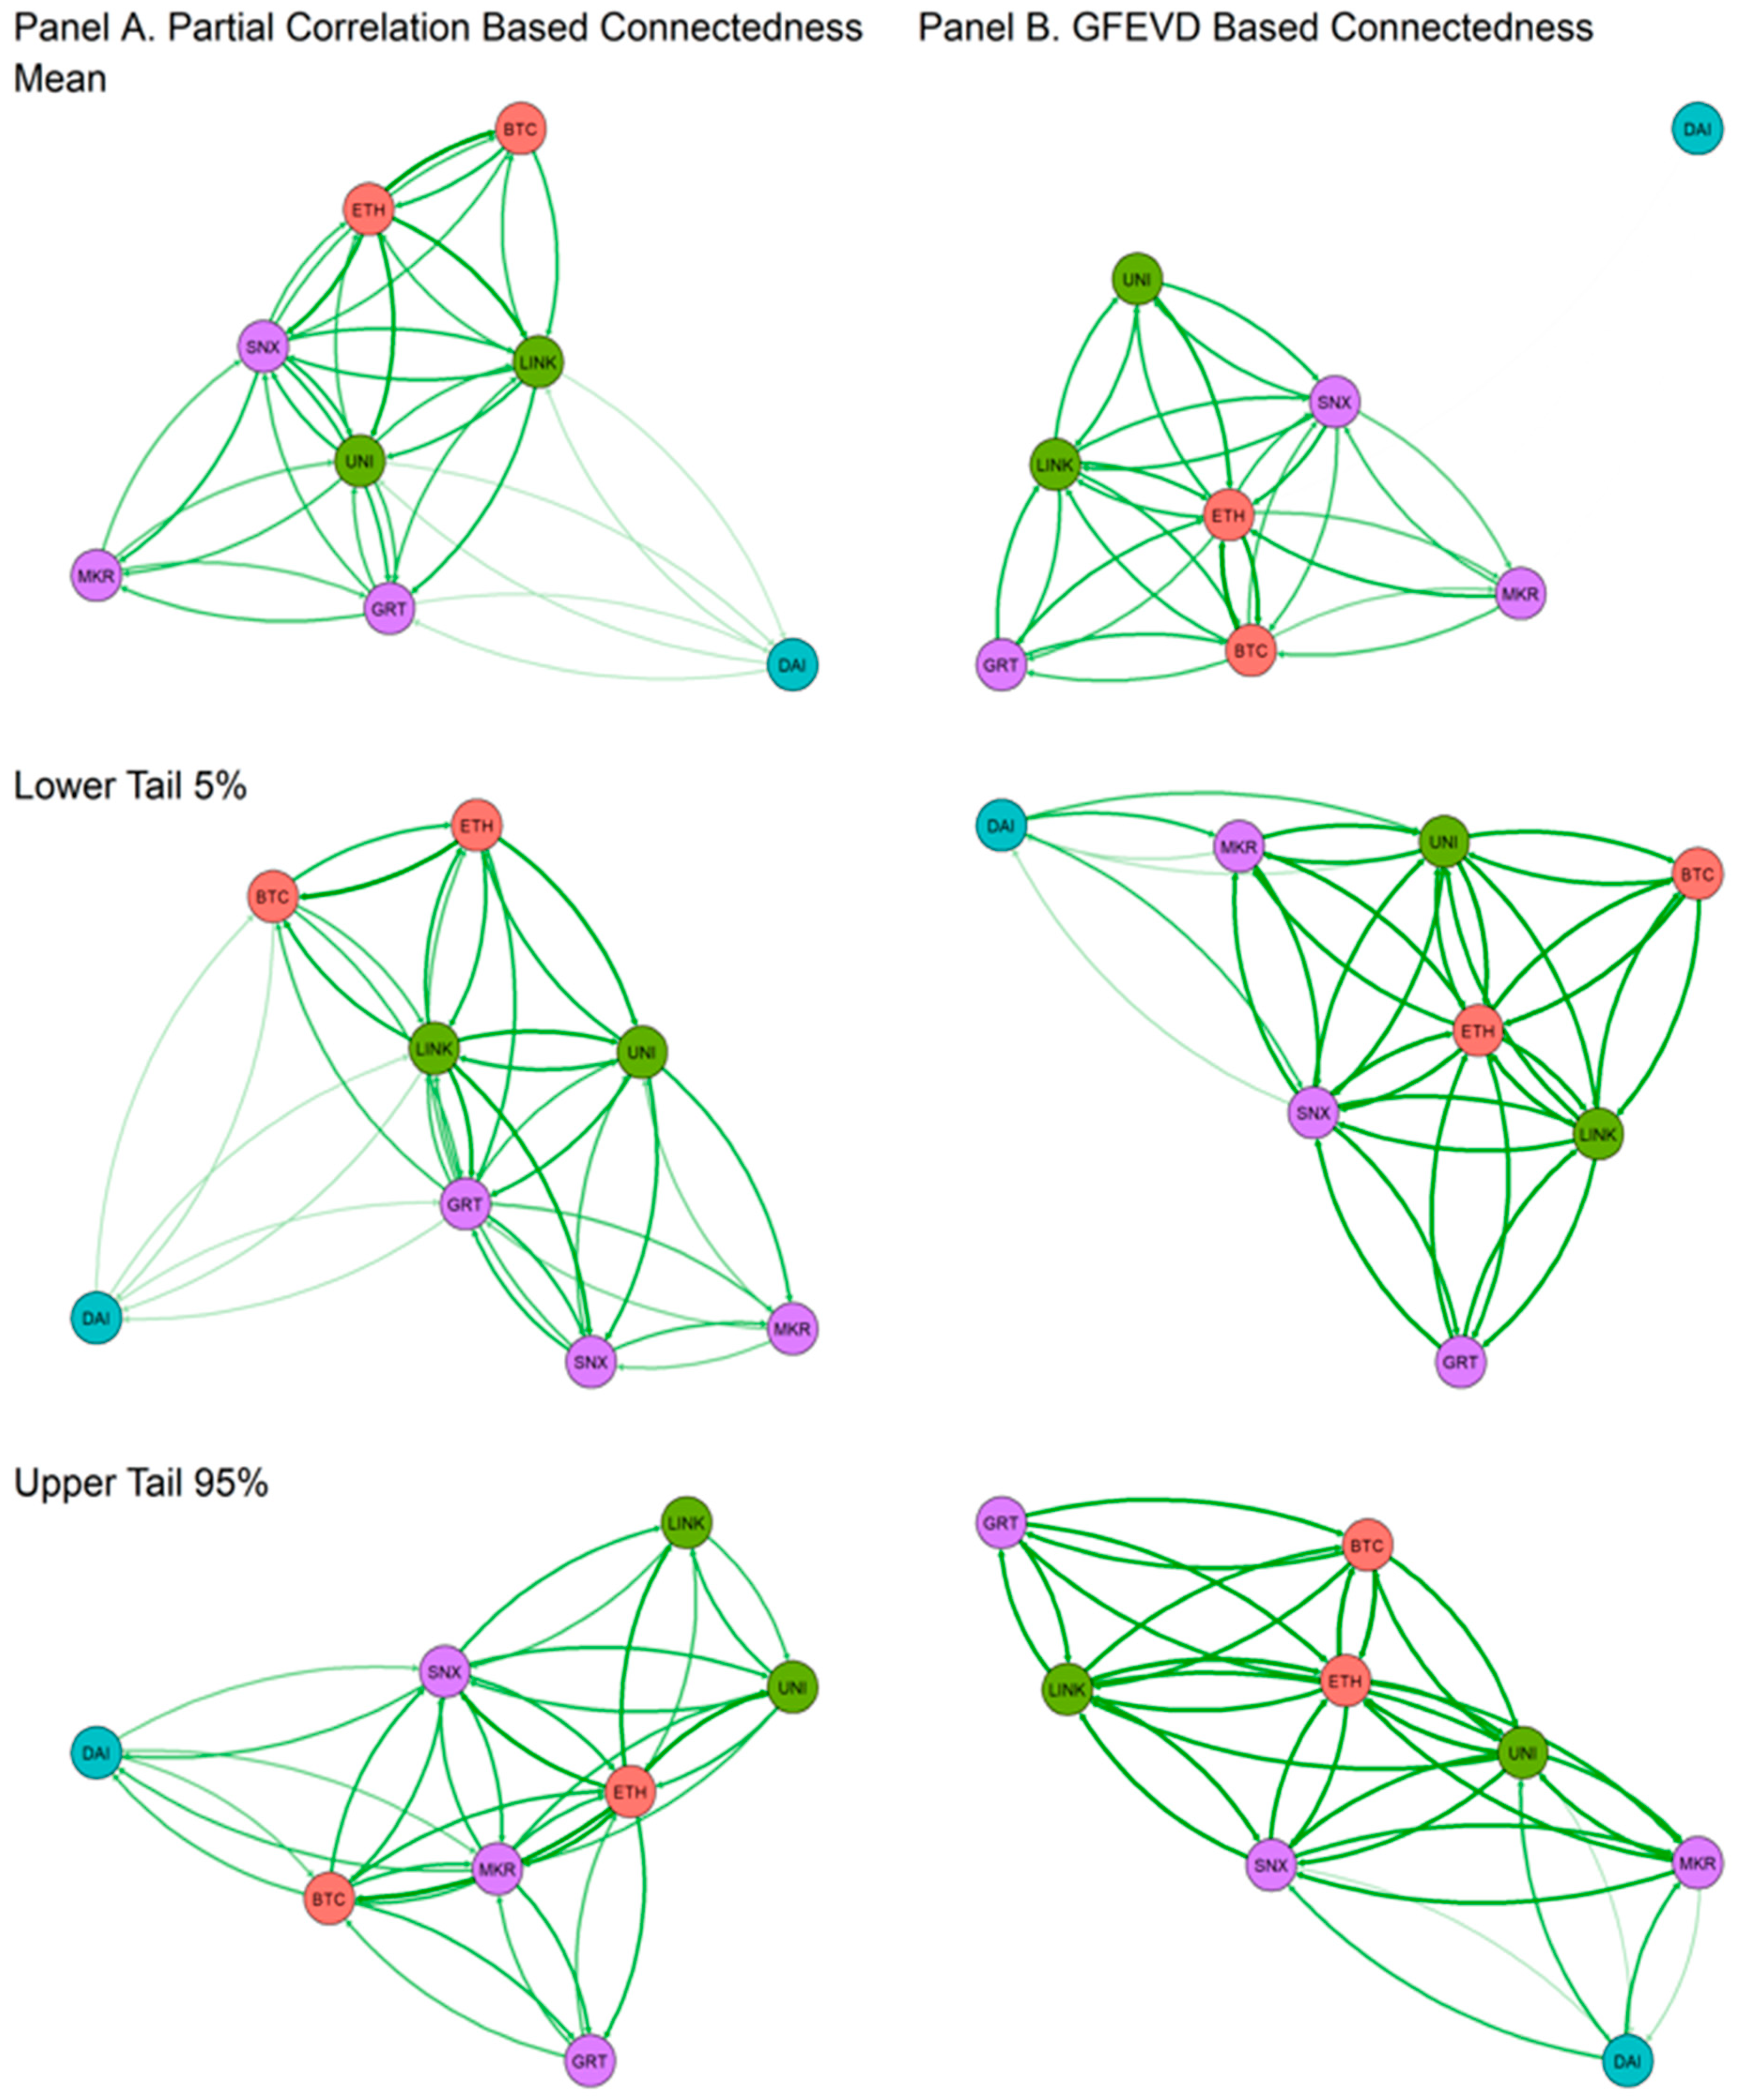
5.2. Static Dependence Networks
Figure 2 displays the static network representations of connectedness among the eight selected crypto-assets, using two different methodologies: partial correlation (Panel A) and the Generalized Forecast Error Variance Decomposition (GFEVD) framework (Panel B), both estimated at the mean of the return distribution, lower tail (5%), and upper tail (95%). These networks help visualize the structural channels through which volatility and systemic risk may propagate across the ecosystem under different market conditions.
5.2.1. Static Dependence (Mean)
In the mean of the return distribution (Panel A), the partial correlation-based network reveals a dense and highly interconnected structure, with apparent clustering by asset function. LINK (Chainlink) and UNI (Uniswap) emerge as central nodes, directly connected to nearly all other assets. This supports the findings of
Katsiampa et al. (
2022), who highlighted the growing influence of Ethereum-based DeFi protocols following the COVID-19 pandemic, driven by the NFT and DeFi boom. ETH and BTC also show strong bilateral connections, reinforcing their role as Layer 1 anchors. This observation aligns with
Ugolini et al. (
2023), who documented strong intra-crypto spillovers within foundational assets. DAI, however, appears weakly connected, indicating a limited role in systemic propagation.
Kristoufek (
2021) and
Thanh et al. (
2023) found that DAI responds to crypto volatility but does not influence price behavior, supporting this result. This peripheral positioning of DAI further supports
Napari et al. (
2025), who view stablecoins as “flight-to-safety” assets, with limited transmission of return shocks, especially outside of crisis periods. Similarly,
Hoang and Baur (
2024) emphasize that stablecoins like DAI are influenced by Bitcoin-driven volatility, which is consistent with our findings that DAI acts more as a volatility receiver than a transmitter.
In contrast, Panel B presents the GFEVD-based connectedness network. The network remains dense, though slightly less than in the partial correlation case. ETH, LINK, and BTC remain the dominant cryptocurrencies. This aligns with
Huang and Hsu (
2025), who document a stronger dependence of DeFi tokens on Ethereum, reinforcing the systemic positioning of ETH and its linked protocols, such as UNI. Our results also align with those of
Benbachir et al. (
2025), who report negative asymmetry for UNI and MKR, indicating their heightened systemic roles during stress periods. While DAI’s peripheral role is even more pronounced, this further validates its design as a mechanism for absorbing volatility. MKR, SNX, and GRT exhibit more substantial lagged spillover effects, consistent with
Bas et al. (
2024), who documented bidirectional influences between crypto-assets and broader digital financial indices.
Both approaches confirm the systemic importance of DeFi infrastructure tokens. While partial correlation reflects direct interdependence, GFEVD captures delayed spillovers. DAI’s consistent isolation across models supports its stabilizing role (
Kristoufek, 2021), whereas the centrality of LINK, UNI, and ETH indicates their role in shaping system-wide dynamics even under average conditions.
5.2.2. Static Dependence (Lower Tail)
In the lower tail of the return distribution (Panel A and Panel B, 5% quantile), the networks become markedly denser, highlighting intensified co-movement during downturns. This aligns with
Kumar et al. (
2022), who observed a higher connectedness during COVID-19 crashes. This pattern highlights the tendency of crypto-assets to move in unison when exposed to adverse shocks, revealing latent fragilities in the ecosystem’s interconnected architecture.
Based on partial correlations in Panel A, the network exhibits greater cohesion than the mean state, yet it still preserves clear differentiation in connectivity strength and node roles. LINK, UNI, and ETH form a tightly knit cluster that remains central to the structure, with GRT, SNX, and MKR becoming more integrated relative to the mean. Interestingly, DAI, although typically peripheral, displays increased linkages to core assets, suggesting that even stablecoins are not immune to systemic downside spillovers. This behavior resonates with findings by
Atik et al. (
2025) and
Thanh et al. (
2023), who both report increased lower-tail dependence between stablecoins and major cryptocurrencies during monetary tightening and crisis events. Our result further supports the notion that stablecoins are not immune to systemic shocks, especially during periods of stress. Furthermore, the findings is consistent with
Hoang and Baur (
2024), who found stablecoin volatility highly sensitive to Bitcoin shocks during stress events. However, the partial correlation framework continues to filter out indirect relationships, allowing us to more precisely identify primary conduits of distress.
In contrast, Panel B, which presents the GFEVD-based network, appears nearly fully saturated, with most asset pairs connected by thick, bidirectional edges. This configuration indicates that downside shocks are broadly transmitted across all nodes, producing a scenario of near-total connectedness. While this may accurately capture the magnitude of systemic stress, it also introduces a key limitation: the lack of edge differentiation masks the underlying spillover hierarchy. The network becomes so entangled that it is challenging to distinguish between dominant transmitters and passive receivers, thereby undermining the interpretability of the structure. This “over-connectedness” in GFEVD networks mirrors critiques by
Barkai et al. (
2024) and
Shahzad et al. (
2025), who caution that traditional variance-based frameworks often obscure the transmission hierarchy during turbulent episodes. This phenomenon of “over-connectedness” blurs causal pathways and limits the usefulness of GFEVD as a diagnostic tool under extreme downside conditions. These lower-tail networks illustrate an apparent asymmetry in how systemic risk manifests in crypto markets. Risk contagion becomes widespread and less discriminating during crash episodes, particularly in models that account for lagged spillovers. Partial correlation networks, by contrast, provide a more selective and structurally informative depiction of systemic linkages, highlighting the importance of model choice in stress-testing and risk monitoring frameworks.
5.2.3. Static Dependence (Upper Tail)
In the upper tail (Panel A and Panel B, 95% quantile), the network structure is sparser. This supports the asymmetry reported by
Liao et al. (
2024) and
Yousaf and Yarovaya (
2022), who found that downside events produce more substantial spillovers than upside events. This asymmetry suggests that crypto-asset co-movements tend to concentrate during market downturns, while positive shocks propagate through more fragmented and localized pathways.
The partial correlation network in Panel A reveals a less uniformly connected structure. This lack of edge granularity limits interpretability, an issue discussed by
Shahzad et al. (
2025), who noted that GFEVD fails to capture instability in transmission strength under turbulence. Partial correlation reveals that ETH, MKR, and BTC form a core cluster, while LINK and UNI exhibit a more distant relationship. Consistent with
Benbachir et al. (
2025), who found that UNI and MKR are structurally central in uptrend regimes, our results emphasize the role of UNI in driving network dynamics during positive market episodes. DAI remains on the network fringe, confirming findings by
Kristoufek (
2021) that stablecoins respond to, rather than drive, positive cryptocurrency movements. This aligns with the literature, which suggests that stablecoins serve as safe-haven assets (
Napari et al., 2025;
Łęt et al., 2023), reacting to market optimism but not actively participating in bullish spillovers. Interestingly, DAI remains at the fringe of the network, with only weak ties, indicating its limited engagement in the upward co-movement dynamics, which is consistent with its role as a stable, non-speculative asset. The partial correlation approach effectively highlights this differentiation, allowing for more precise identification of structurally significant connections rather than superficial co-movements.
In Panel B, the GFEVD-based network appears denser yet exhibits more discernible differentiation than the over-saturated lower-tail configuration. ETH, BTC, and UNI again occupy central positions, with LINK and GRT demonstrating increased connectivity regarding variance-based influence. Unlike in the lower tail, the edges here display more gradation in thickness, making it possible to observe relative spillover dominance; for example, ETH and UNI serve as strong transmitters. At the same time, DAI, MKR, and SNX absorb variance more passively. This structure suggests that, while positive returns generate interconnected dynamics, the propagation is more selective, driven by asset-specific fundamentals and localized market narratives (e.g., ETH staking upgrades or DeFi protocol rallies).
The upper-tail networks confirm the asymmetric nature of systemic risk in crypto markets. Favorable performance regimes generate connectedness, but the system does not converge into an all-encompassing web of co-dependence as it does during distress. Instead, network centrality becomes conditional, often revolving around specific assets that benefit disproportionately from bullish sentiment. This reinforces the importance of using tail-sensitive frameworks to capture directional differences in contagion patterns and to inform portfolio or protocol-level risk management strategies. The results affirm the necessity of asymmetric modeling frameworks for crypto risk management, as proposed by
Barkai et al. (
2024) and
Xu et al. (
2021).
5.3. Dynamic Dependence
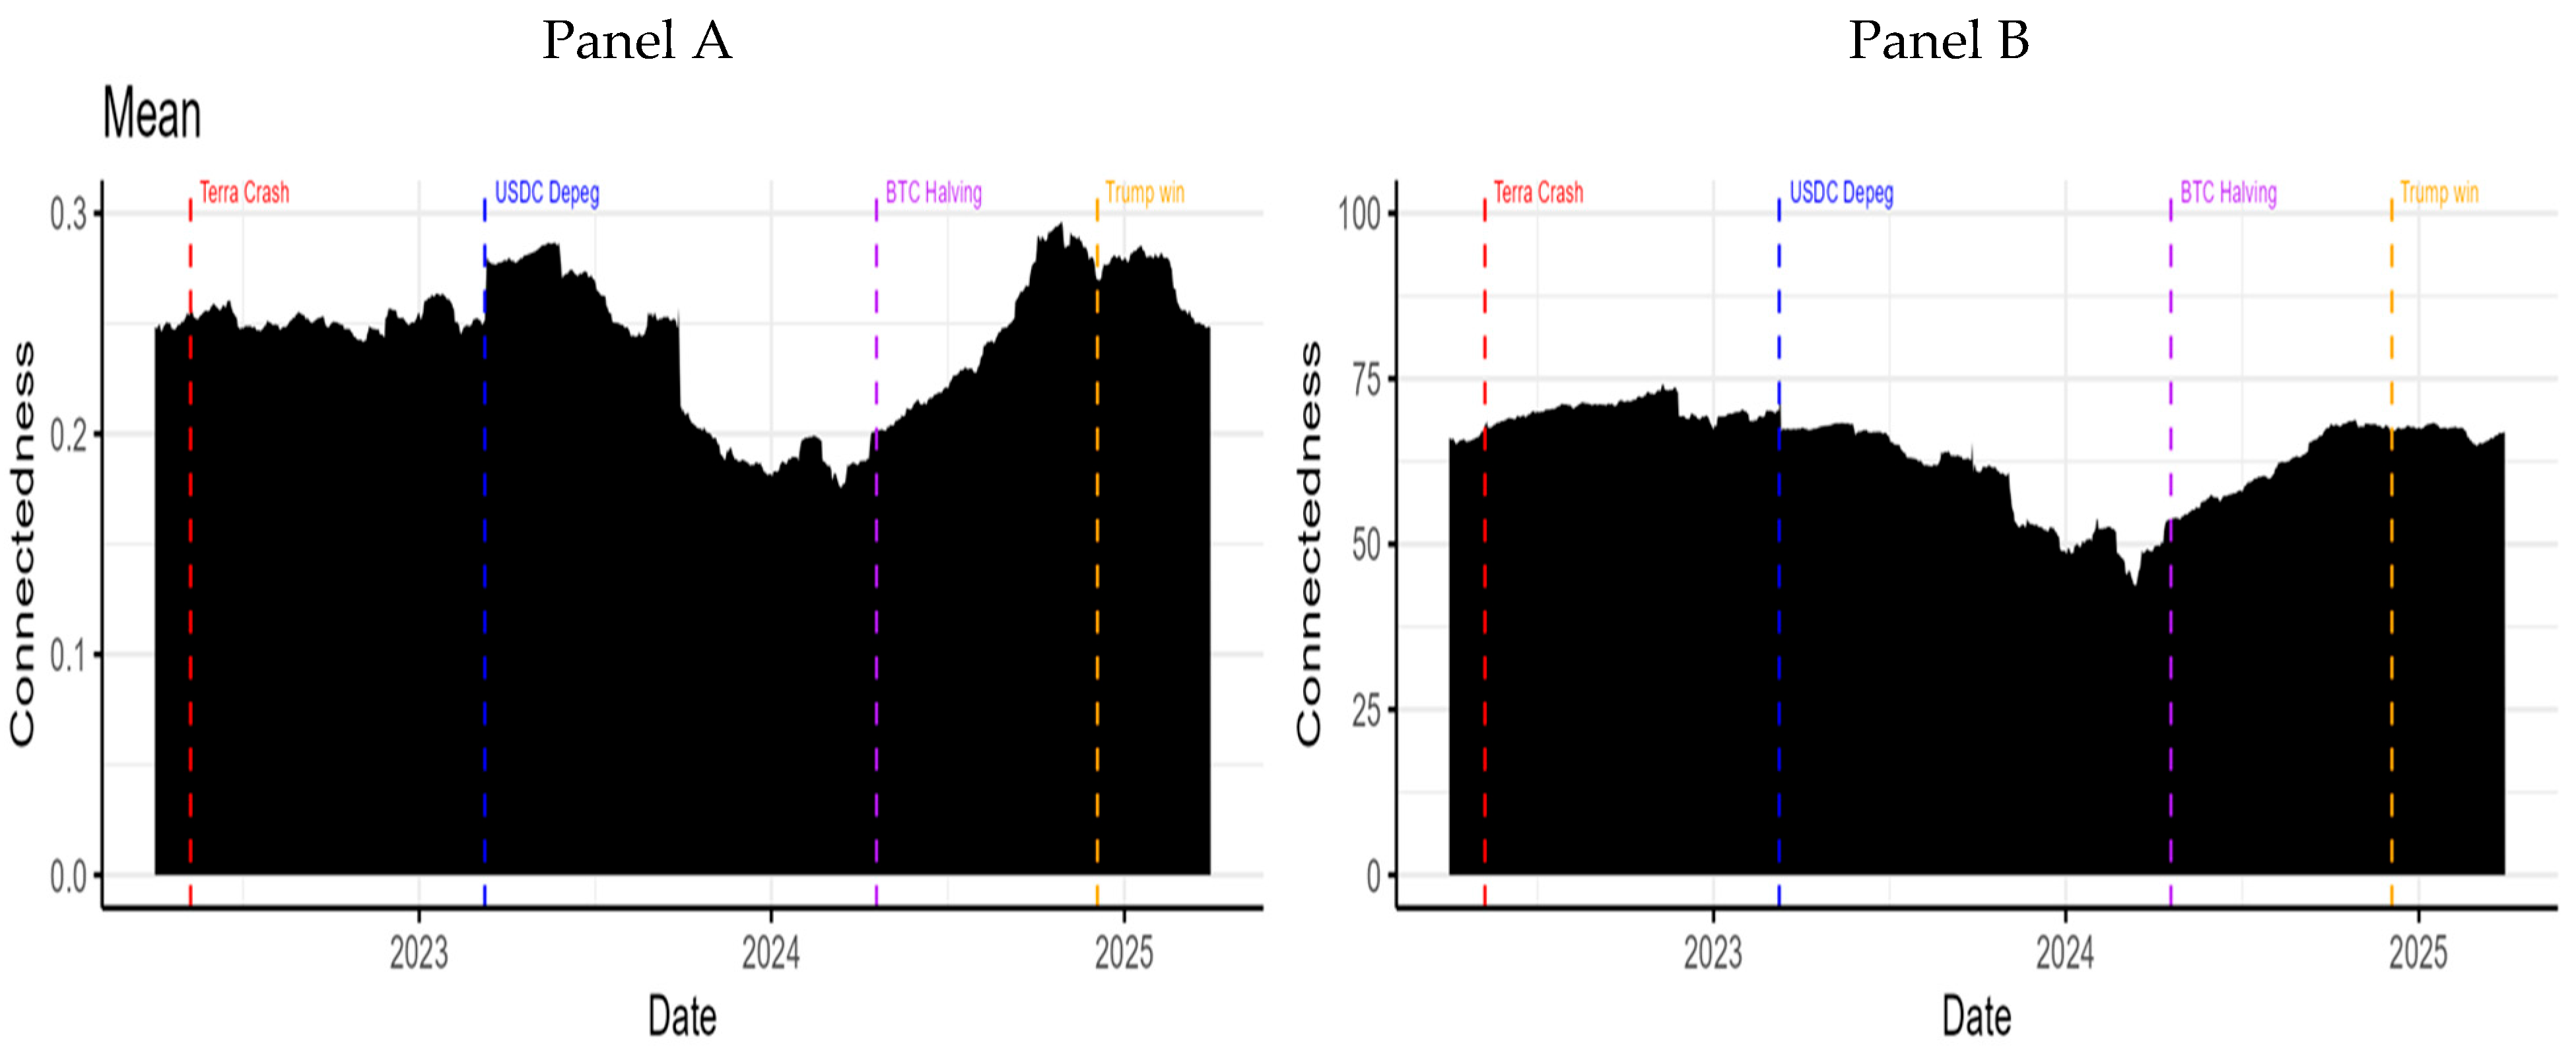
5.3.1. Dynamic Dependence (Mean)
Figure 3 provides a dynamic view of systemic interdependence in the crypto-asset ecosystem by tracing the evolution of the Total Connectedness Index (TCI) over time. The figure captures how overall market connectedness fluctuates under average conditions using both the partial correlation-based (PCI) and GFEVD-based methodologies.
In the mean-based connectedness analysis (Panel A and Panel B of
Figure 3), the Partial Correlation-Based Connectedness Index (PCI) demonstrates greater sensitivity to short-term market dynamics compared to its GFEVD counterpart. The PCI captures multiple waves of stress and recovery, such as the sharp decline following the USDC depeg (March 2023), followed by a significant rise in the run-up to the Bitcoin halving (April 2024) and the subsequent political event in late 2024. These fluctuations suggest that partial correlation networks are more responsive to shifts in direct bilateral dependencies after filtering out common shocks. This finding aligns with the observations of
Bouri et al. (
2023) and
Esparcia et al. (
2024), who document episodic increases in connectedness following the FTX collapse and the USDC depeg. Notably, our model captures those spillovers with greater resolution than variance-based GFEVD approaches.
In contrast, the GFEVD-based TCI exhibits smoother, lower-frequency trends, with minimal reactivity to real-time developments. The index exhibits a gradual decline through 2023, followed by a partial rebound thereafter. This underlines the GFEVD method’s focus on long-term variance transmission rather than contemporaneous stress dependencies, corroborating past critiques about its lagging nature during crisis periods (e.g.,
Barkai et al., 2024;
Shahzad et al., 2025). Collectively, these observations reaffirm the complementary strengths of both models, where PCI excels at detecting evolving, direct interdependencies, while GFEVD provides a broader picture of underlying variance attribution.
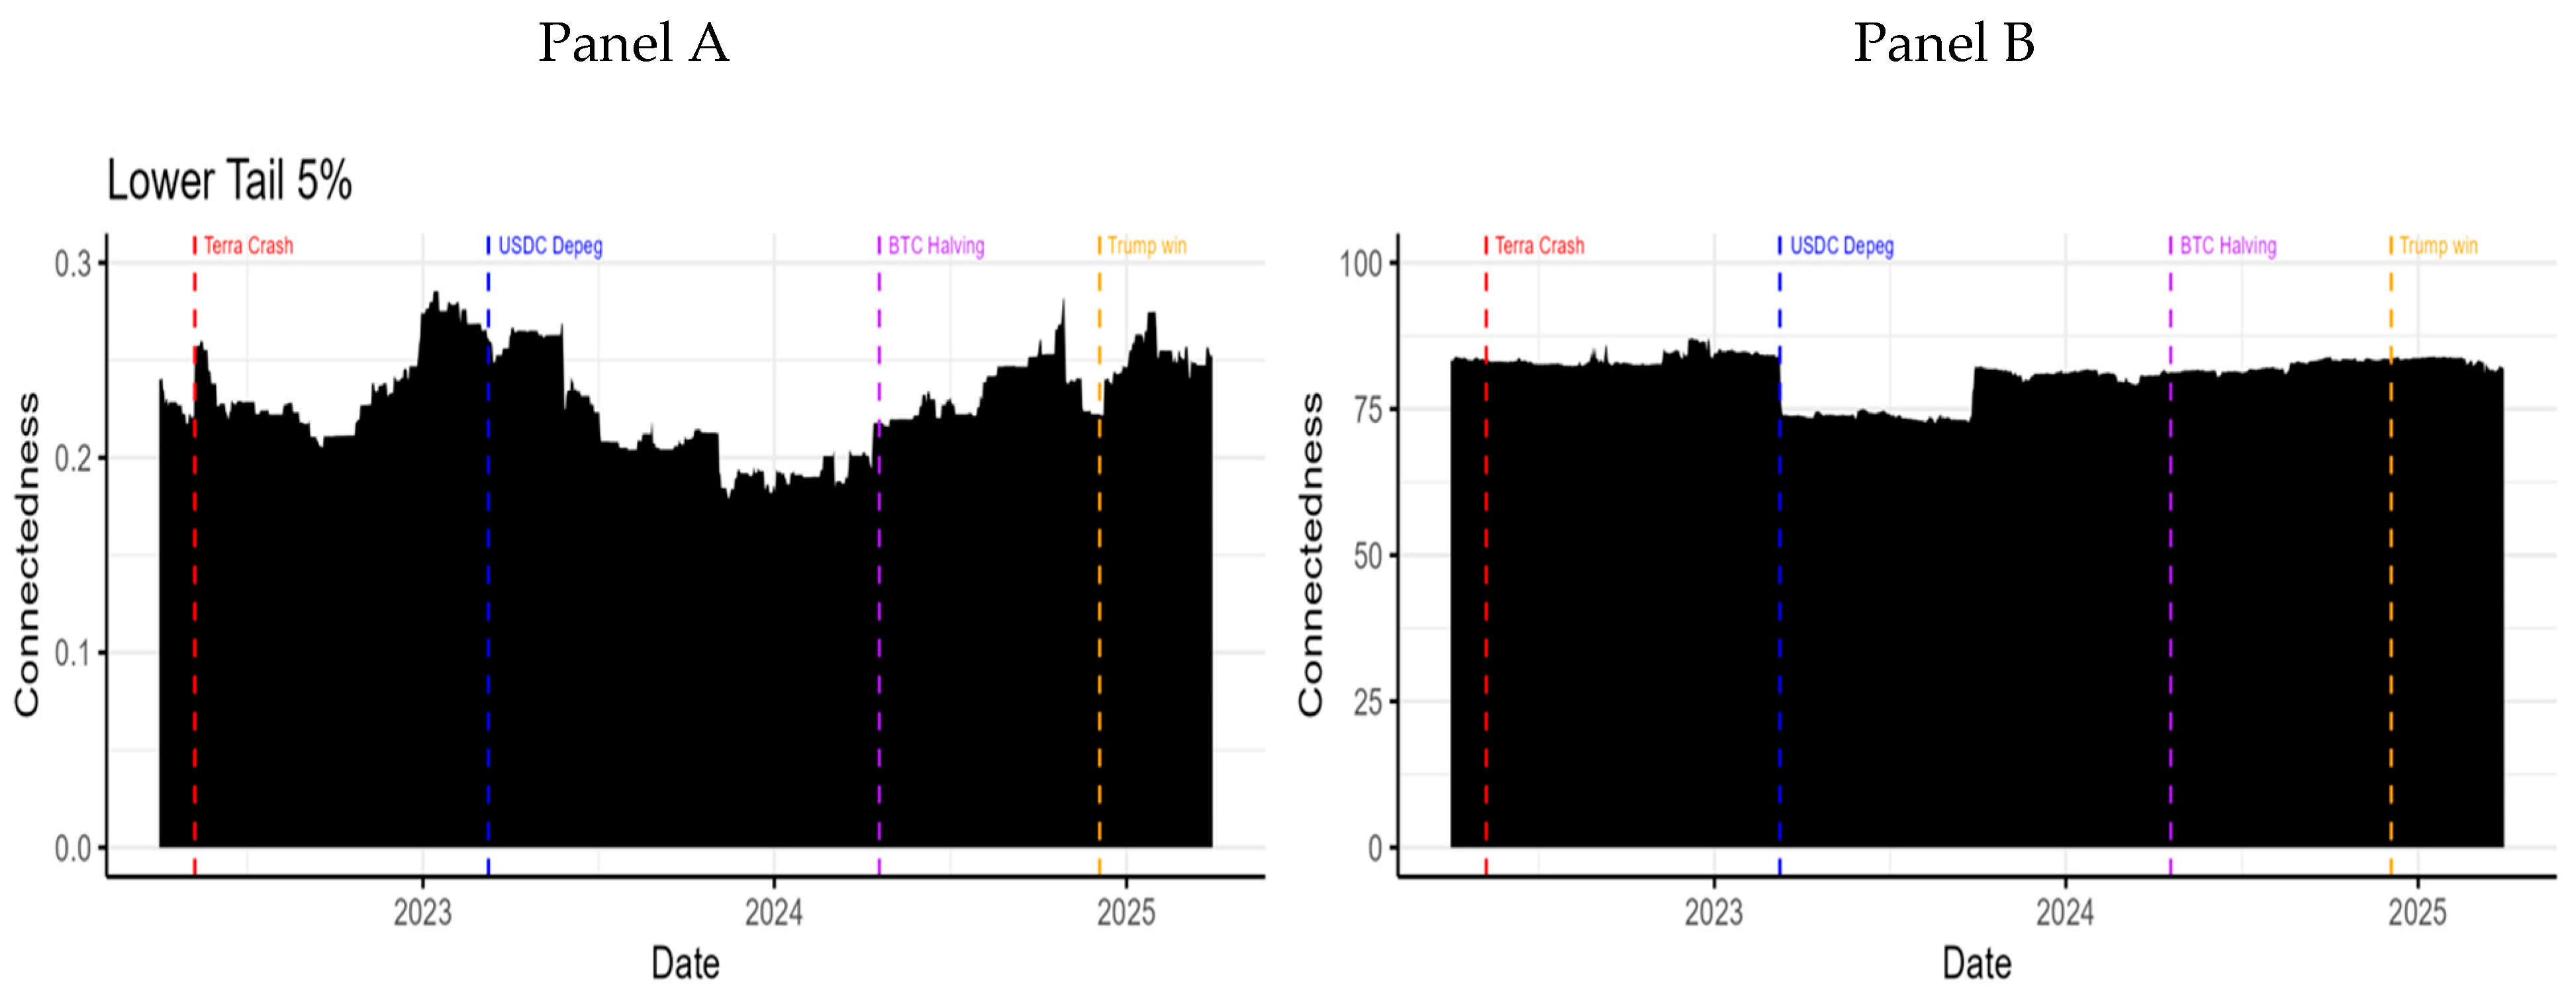
5.3.2. Dynamic Dependence (Lower Tail)
Figure 4 illustrates the evolution of lower-tail (5%) connectedness over time, capturing downside systemic risk dynamics across the crypto-asset network.
Figure 4 indicates that partial correlation-based connectedness (PCI) in the lower tail exhibits clear responsiveness to periods of downside market stress. These observations align with those of
Kumar et al. (
2022), who report enhanced tail dependence and connectedness during the COVID-19 and crypto crashes. Our findings also reflect those of
Xu et al. (
2021), who highlight Ethereum as a systemic risk emitter during downturns. In the left panel, the partial correlation-based connectedness (PCI) exhibits mild increases around the Terra crash (May 2022) and USDC depeg (March 2023), though these events do not correspond to sharp spikes. Instead, the most notable upward shift in PCI occurs gradually after early 2024, leading into and following the Bitcoin halving (April 2024) and Trump’s election win (late 2024). This suggests that downside risk interdependence intensified in the more recent phase of the sample, potentially reflecting increasing market integration or macro-driven systemic sensitivity. The fluctuations remain more dynamic and responsive compared to the upper tail or mean connectedness. These findings align with
Kumar et al. (
2022) and
Bouri et al. (
2023), who observed stronger lower-tail dynamics during turbulence and asset-specific contagion.
In contrast, the right panel shows that GFEVD-based lower tail connectedness remains consistently high and flat, with only minimal variation across all events. This lack of responsiveness highlights how variance decomposition methods can obscure the time-localized buildup of downside systemic risk, underscoring the value of PCI in capturing tail-specific, event-sensitive dynamics.
5.3.3. Dynamic Dependence (Upper Tail)
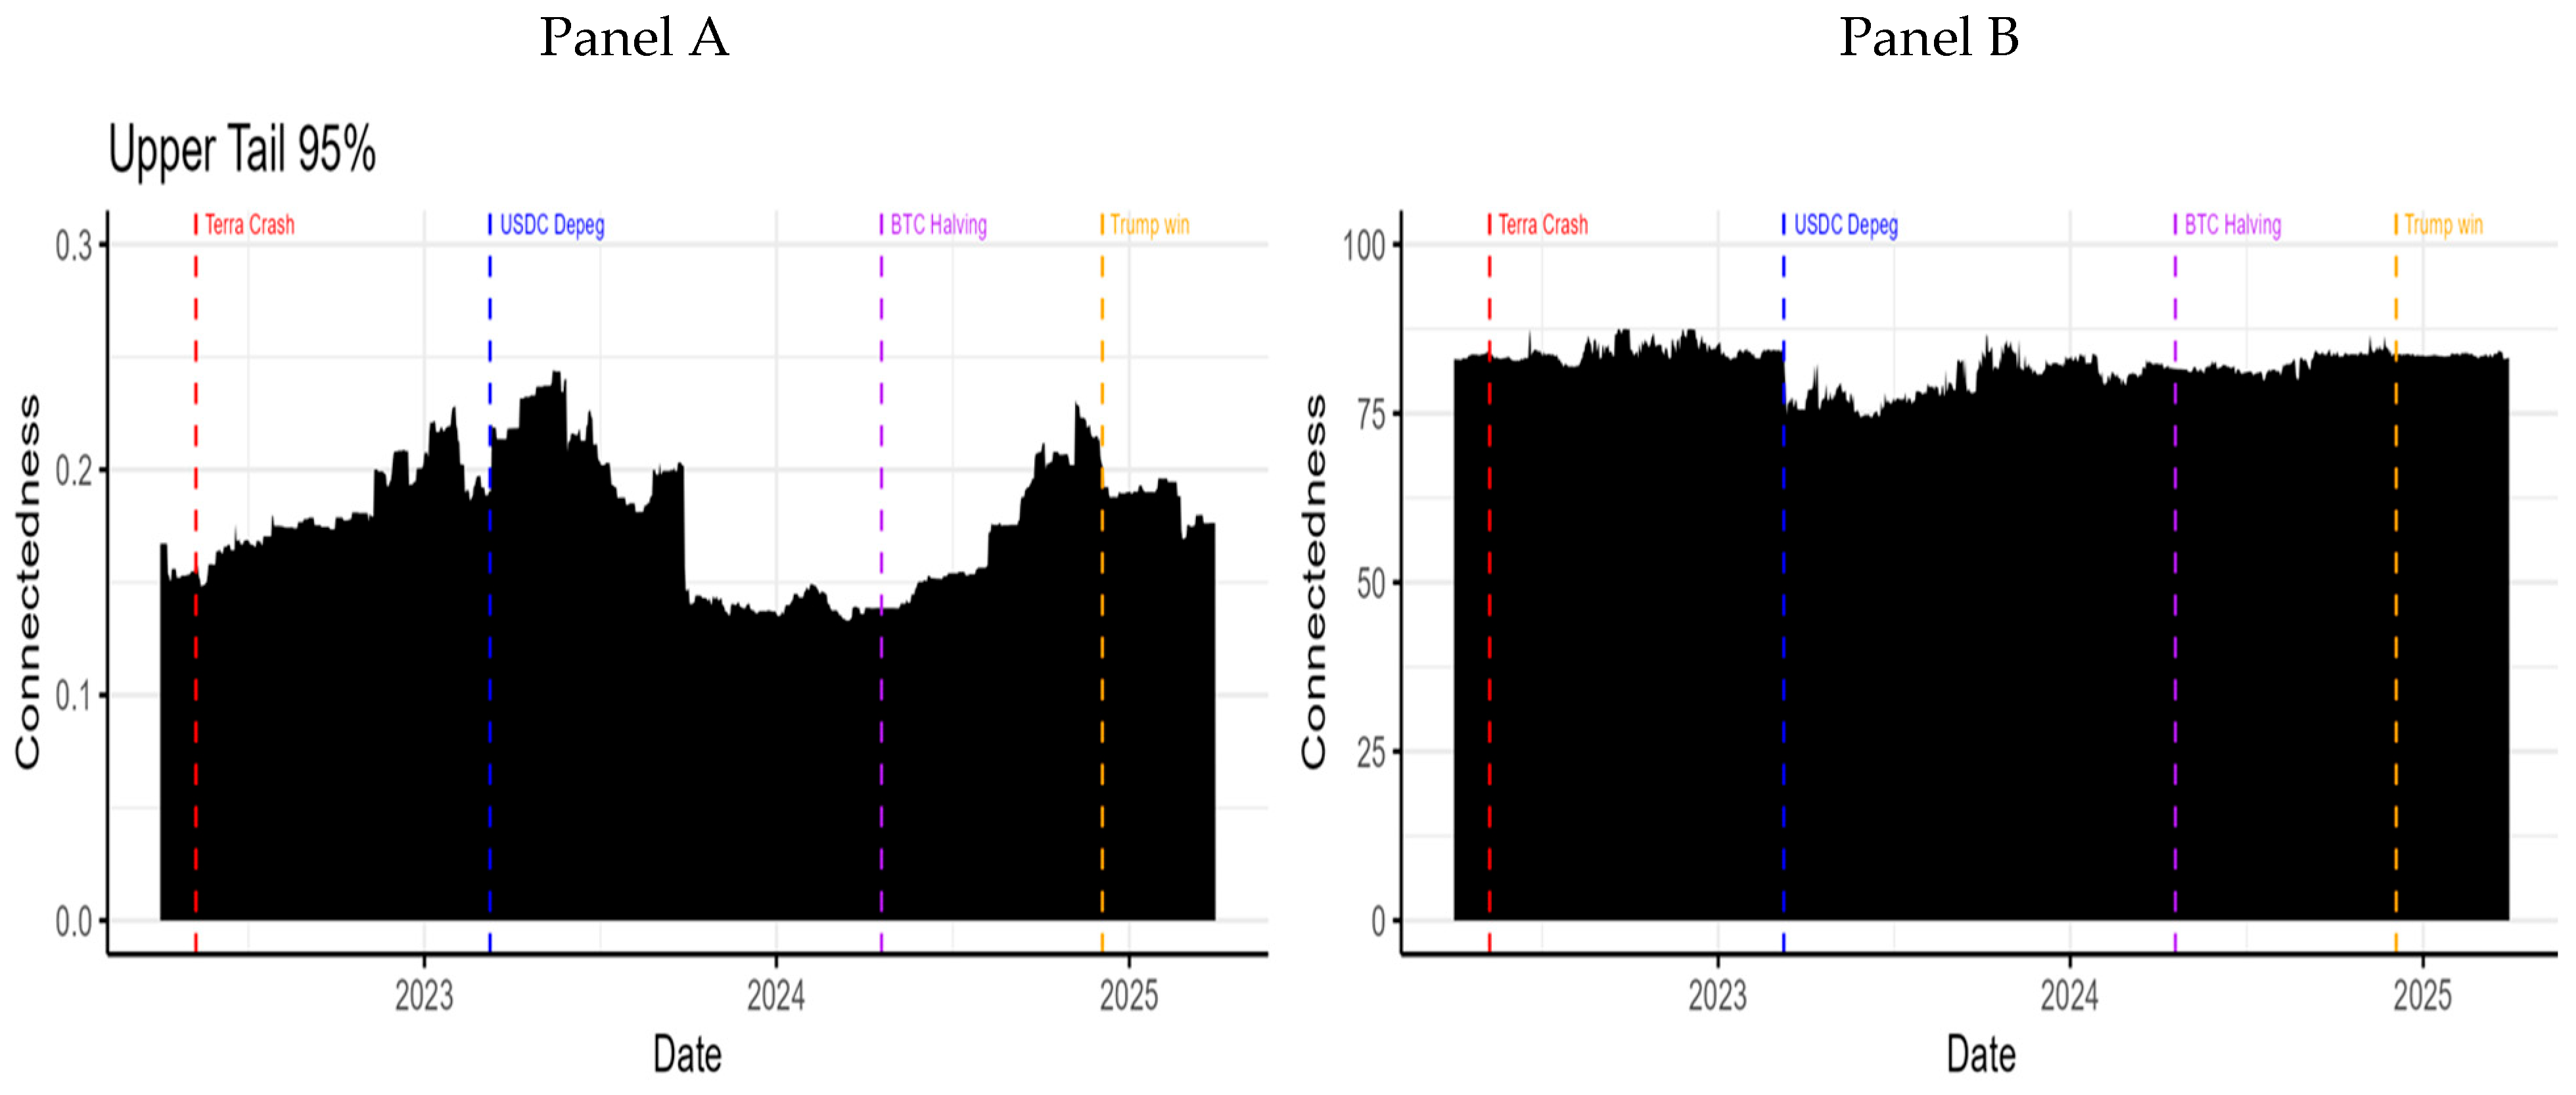
Figure 5 illustrates the evolution of upper-tail (95%) connectedness, reflecting co-movement patterns during periods of extreme positive returns across the crypto-asset network.
The partial correlation-based upper-tail connectedness (Panel A) exhibits a generally subdued and stable pattern throughout most of the sample, punctuated by modest increases around the USDC depeg in early 2023 and a more pronounced surge beginning in mid-2024, peaking just before the 2024 U.S. election. This rise suggests a phase of optimistic market sentiment and synchronized gains, likely driven by anticipation around the Bitcoin halving and speculative momentum following political developments. However, the increase is notably more contained than in the lower tail, reinforcing the asymmetric nature of systemic dependence in crypto markets, where downside shocks elicit sharper and broader co-movements than upside rallies.
In contrast, the GFEVD-based upper-tail connectedness (Panel B) remains high and relatively flat throughout the period, offering little differentiation across events or market cycles. This reinforces the notion that traditional variance-based approaches may obscure dynamic structure in tail-specific contagion, particularly during phases of bullish sentiment.
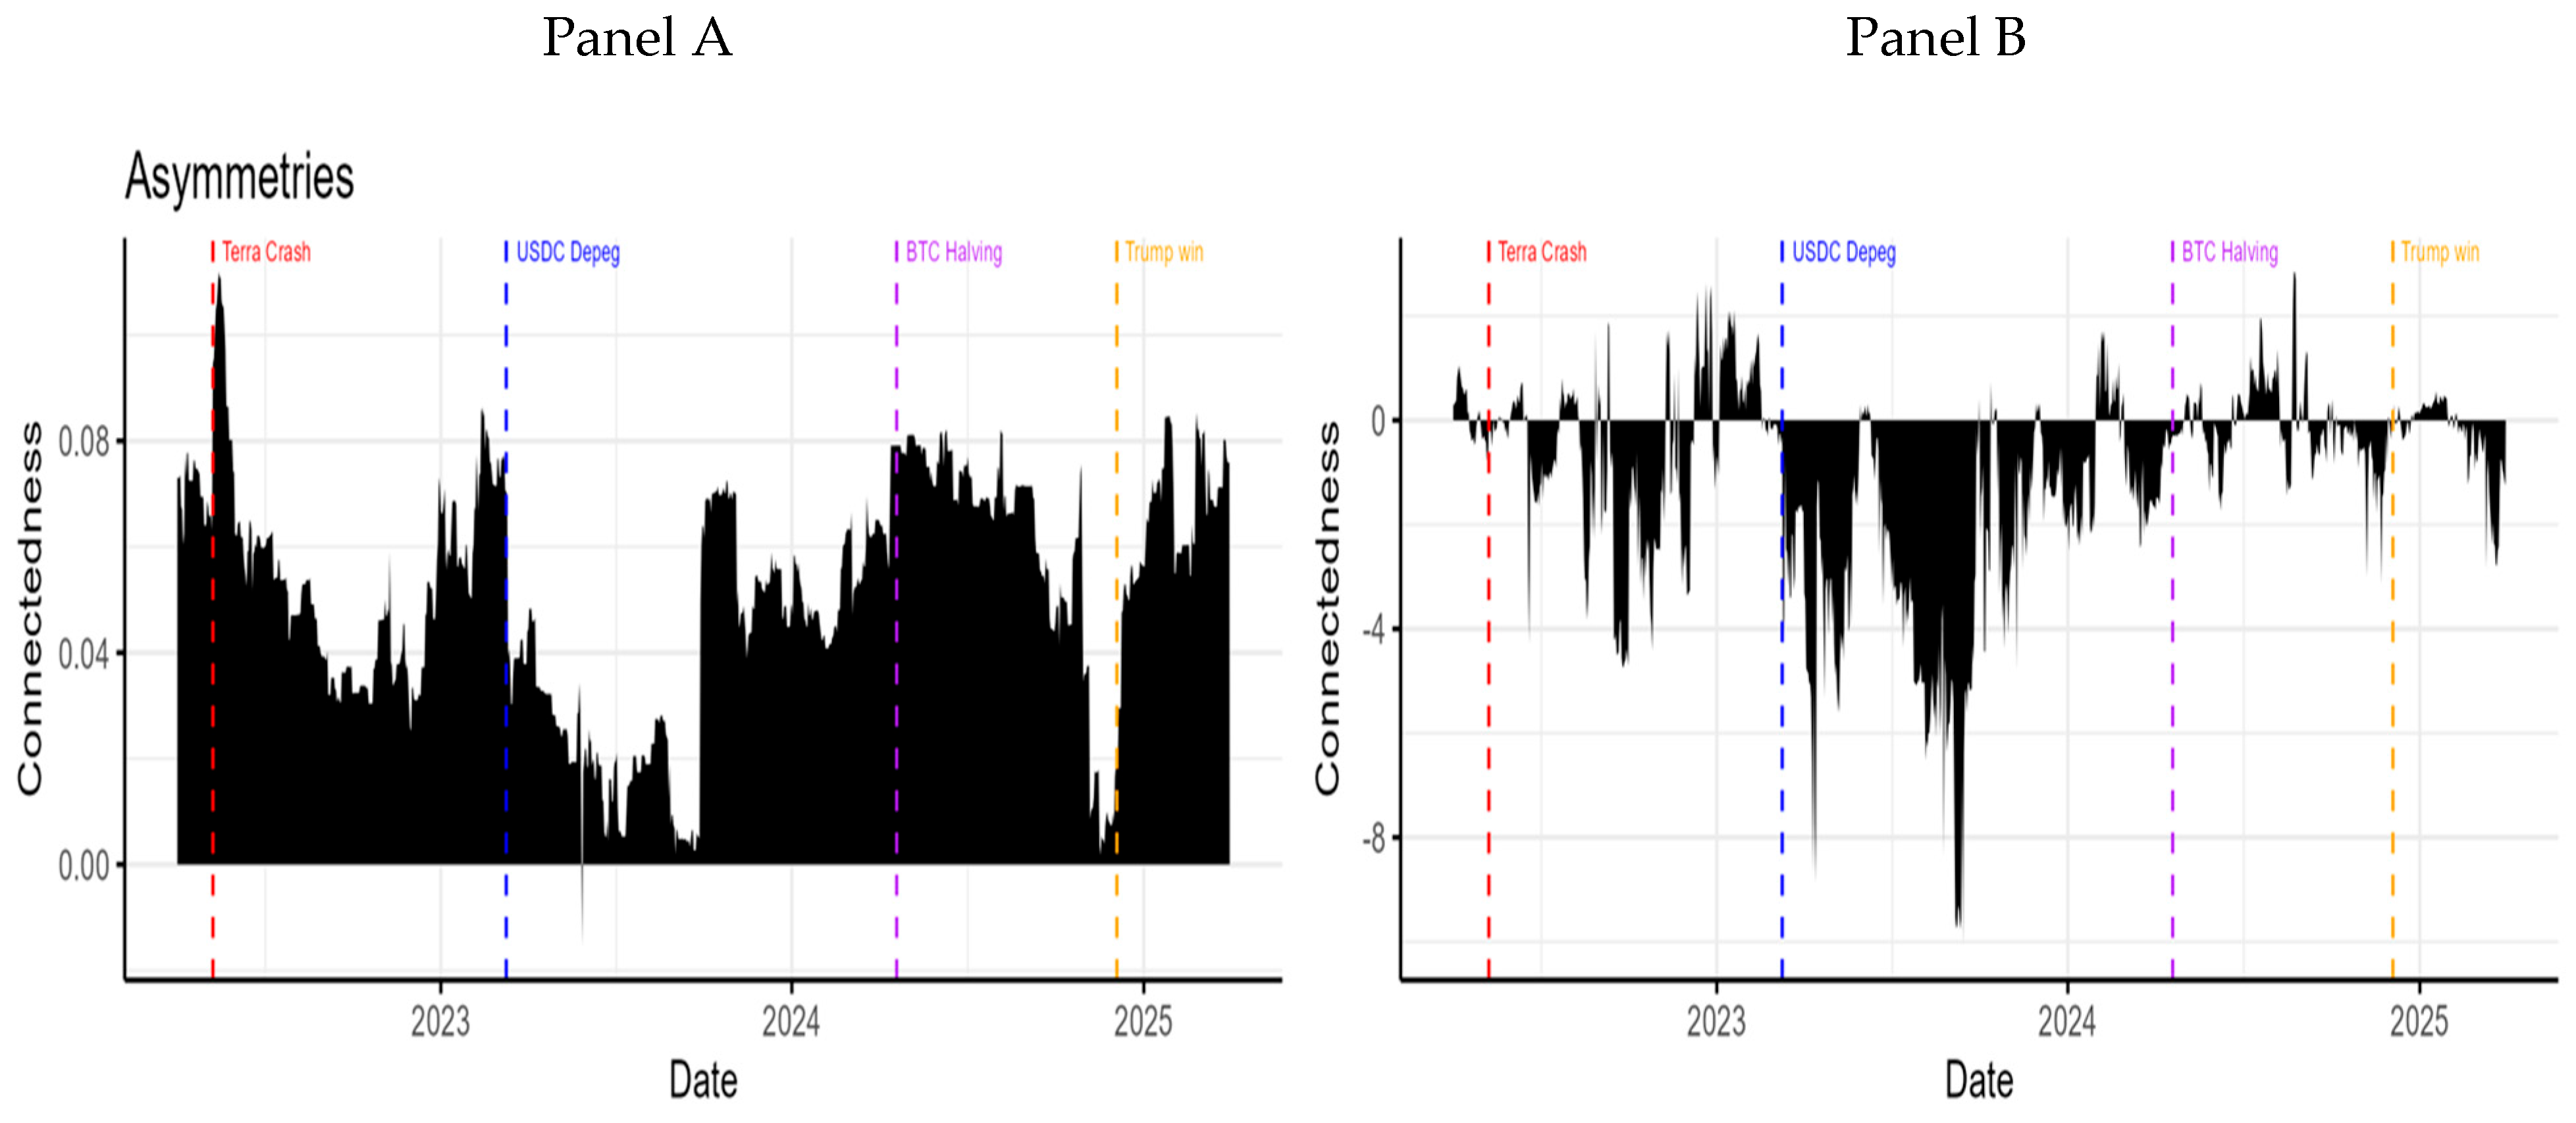
5.3.4. Dynamic Dependence (Asymmetry)
Figure 6 illustrates the asymmetry in systemic connectedness by plotting the difference between lower-tail and upper-tail connectedness indices for the Partial Correlation-based (left) and GFEVD-based (right) approaches. These plots highlight the directional bias in interdependence, where downside co-movements often dominate.
In the PCI-based asymmetry (left panel), the periods following the Terra crash and USDC depeg exhibit sharp and sustained positive asymmetry, indicating that connectedness is significantly higher during downturns than upswings. This asymmetry intensifies again from mid-2024, persisting even after the Trump re-election event, signaling that systemic downside risks remain more entangled than upside dynamics throughout much of the sample. Notably, the sign of asymmetry never reverses for long, reinforcing the dominance of left-tail risk in crypto contagion patterns. This result confirms findings by
Ahelegbey et al. (
2021), who categorize Ethereum and DeFi-linked assets as significant contagion receivers, and by
Barkai et al. (
2024), who show that advanced tail-risk models outperform traditional approaches in predicting asymmetric systemic shifts.
In contrast, the GFEVD-based asymmetry (right panel) fluctuates around zero, but remains overwhelmingly negative, suggesting that this framework systematically overstates upper-tail spillovers or under-captures crash-driven dependence. The more profound and more volatile asymmetry during 2023 implies a lack of granularity in the GFEVD’s ability to differentiate between directional stress episodes, further motivating the need for tail-specific approaches like PCI.
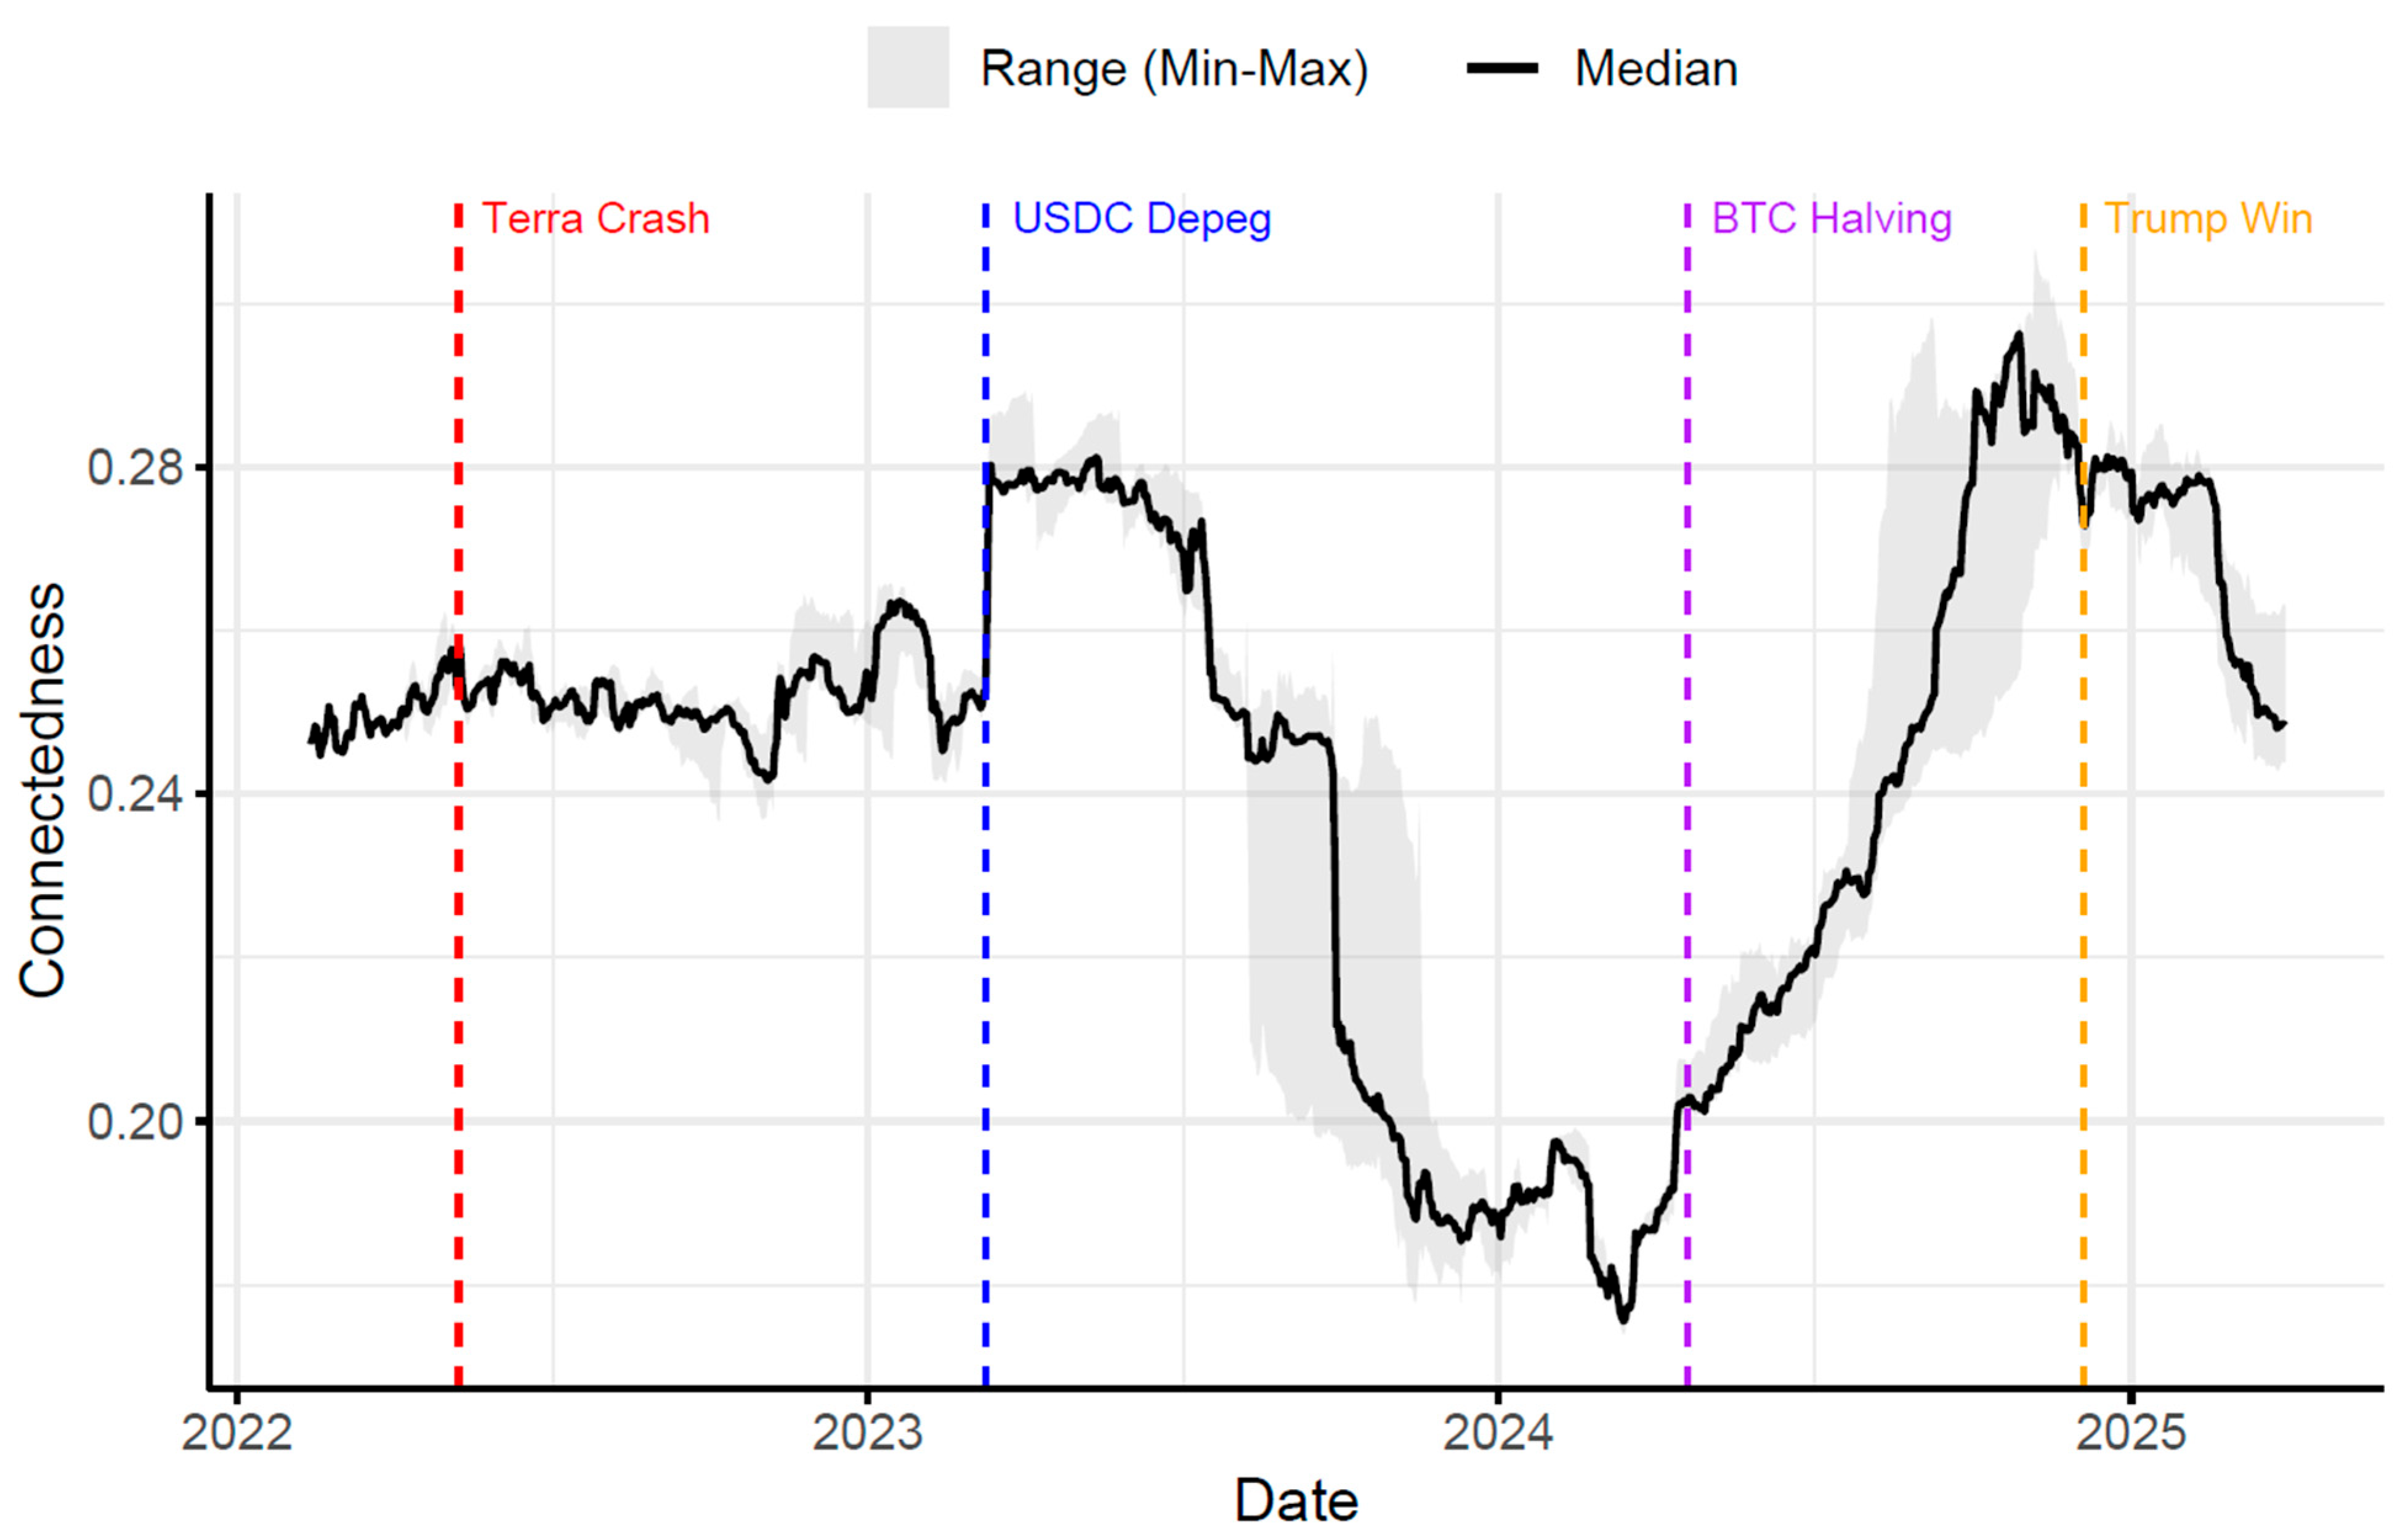
5.4. Robustness Check
Figure 7 presents a robustness check for the Total Connectedness Index (TCI) based on the Partial Correlation-based Connectedness (PCI) framework. Specifically, it displays the median, minimum, and maximum TCI estimates obtained from three different rolling window lengths, 150, 200, and 250 days, over the study period. The shaded grey area represents the range (min–max), while the solid black line indicates the median across the three window configurations.
The objective of this test was to examine whether the evolution of systemic connectedness is sensitive to different rolling window specifications. This is important because the window length may affect the detection of short-term versus persistent risk dynamics. By comparing the PCI-based TCI estimates across multiple window sizes, we assessed the robustness of our findings to alternative smoothing parameters.
The TCI was calculated as the mean of all pairwise partial correlation-based dependence values in the connectedness matrix at each point in time. Formally, this corresponds to the average magnitude of tail-specific linkages across the asset network, as defined in Equation (9) in the Methodology Section. The TCI thus summarizes the overall density of systemic connections after filtering out common shocks and indirect spillovers.
The visualization of
Figure 7 confirms the stability of the TCI dynamics across alternative specifications. Despite some variation in magnitude, particularly during high-volatility phases, the core trends and turning points in connectedness, notably those around the Terra crash, USDC depeg, BTC halving, and post-2024 surge, remain consistent. The narrow confidence band throughout most of the sample suggests that the observed patterns are not artifacts of specific window choices, strengthening confidence in the robustness and reliability of our tail-dependent systemic risk findings.
6. Conclusions
This study examined the nature and evolution of systemic tail dependence within the crypto-asset ecosystem, with a specific focus on DeFi tokens, stablecoins, Layer 1 protocols, and infrastructure and governance tokens. Employing a partial correlation-based network approach and quantile-specific connectedness measures, we uncovered robust evidence of asymmetric interdependencies, particularly heightened during extreme negative market conditions. Our findings suggest that traditional correlation metrics overestimate bilateral dependence, whereas GFEVD-based connectedness often obscures key volatility channels due to network overconnectivity. In contrast, partial correlation networks provide a more transparent lens into directional spillovers, identifying assets like LINK, ETH, and UNI as recurrent central nodes in stress propagation, and stablecoins such as DAI as volatility absorbers under crisis regimes.
By decomposing dependence into lower and upper tails and integrating event annotations (e.g., USDC depeg, Bitcoin halving, and political shocks), the analysis also highlights the dynamic sensitivity of crypto-systemic risk to both endogenous protocol failures and exogenous macroeconomic events. The methodological contribution lies in combining tail-filtered correlation structures with network-based connectedness, offering a refined toolkit for systemic risk diagnosis in decentralized markets.
From a policy standpoint, these findings have direct regulatory relevance. Crypto-assets that consistently act as systemic transmitters, such as LINK, ETH, and UNI, may require differentiated regulatory treatment, including enhanced liquidity reserve requirements, real-time disclosure mechanisms, and protocol-level stress testing to contain directional spillovers. Conversely, stablecoins like DAI, which function as volatility absorbers, would benefit from frameworks that prioritize peg stability, transparency in collateral composition, and enforceable redemption mechanisms. These targeted interventions could help reduce risk amplification without undermining innovation. Furthermore, the study highlights that interdependence is not solely a function of market sentiment but is also rooted in protocol design features such as oracle dependencies, composability, and overcollateralization mechanisms. Addressing these structural channels through modular risk buffers and standardized risk disclosures can enhance systemic resilience.
For DeFi protocol designers, the findings demonstrate the systemic role of oracles, governance tokens, and stablecoin design in influencing network resilience. Based on our network findings, we recommend that DeFi protocols adopt real-time monitoring dashboards using tail-sensitive indicators (e.g., extreme downside correlation metrics) to detect early signs of stress propagation. Integrating on-chain analytics that flag abnormal directional connectedness patterns, such as sudden shifts in centrality or persistent inter-group linkages, could serve as effective early warning systems. Moreover, protocol design should prioritize modular oracle frameworks with fallback mechanisms, circuit-breaker features that activate under liquidity stress, and adaptive collateralization ratios that respond to tail-risk exposure. These design choices can materially reduce amplification pathways during systemic events.
For institutional investors and risk managers, the results caution against relying solely on average dependence metrics when assessing crypto exposures, especially during episodes of extreme stress. Ultimately, this paper contributes to the growing recognition that crypto markets are not merely volatile; they are structurally interconnected, and this structural asymmetry demands a new regulatory paradigm grounded in tail-sensitive, network-aware risk monitoring.
In addition to implications for regulators, protocol designers, and institutional investors, this study also offers valuable insights for researchers, corporate managers, and fintech firms. For academic researchers, the findings provide a foundation for future work on dynamic systemic risk in decentralized markets, particularly by encouraging the adoption of tail-sensitive and structure-aware network models beyond cryptocurrencies. For corporate managers and treasury officers considering crypto exposure or payment integration, the asymmetric risk structure uncovered in this paper signals the need for scenario-based stress testing tailored to crash regimes. Fintech firms operating in the DeFi or stablecoin space can leverage the structural insights from our analysis to design more robust protocols, optimize governance mechanisms, and align product development with systemic resilience benchmarks.
Despite these contributions, the study has limitations. First, the sample was limited to eight crypto-assets selected for their liquidity and systemic relevance; future research could expand to a broader or rotating panel of tokens to capture evolving market dynamics. Second, our framework did not explicitly integrate macroeconomic variables or cross-asset contagion (e.g., to equities or commodities), which may further influence systemic spillovers. Addressing these extensions represents a valuable direction for future research.


