Article

Sophisticated Capital Budgeting Decisions for Financial Performance and Risk Management—A Tale of Two Business Entities

1
School of Business and Management, Institut Teknologi Bandung, Jl. Ganesa No.10, Lb. Siliwangi, Kecamatan Coblong, Kota Bandung 40132, Indonesia
2
UWS School of Business & Creative Industries, University of West Scotland, Paisley Campus, George St., Paisley PA1 2BE, UK
*
Author to whom correspondence should be addressed.
J. Risk Financial Manag. 2025, 18(6), 297; https://doi.org/10.3390/jrfm18060297
Submission received: 30 March 2025 / Revised: 17 May 2025 / Accepted: 18 May 2025 / Published: 29 May 2025
(This article belongs to the Section Business and Entrepreneurship)

Abstract

:
Capital budgeting, particularly sophisticated decisions, is key to the financial performance and risk management of firms, yet academic studies have documented their relationship inconsistently. This study employs the fundamentals of resource-based view (RBV) and agency theories to investigate the impact of sophisticated capital budgeting decisions on financial performance and risk management of the firms of two different sizes, classified as small and medium enterprises (SMEs) and multinational corporations (MNCs). The empirical data of 590 Indonesian firms from between 2014 and 2023 were obtained and analyzed through the Generalized Method of Moments (GMM) technique. The results show that the usage of sophisticated capital budgeting decisions in investment appraisals of classified firms significantly improves their financial performance. Further analyses confirm that although sophisticated capital budgeting decisions are robust in resolving solvency issues, they appear less effective in reducing liquidity risks. The findings also elucidate that sampled firms may realize the financial benefits of sophisticated risk management. The mediation results highlighted that risk management has a significant and positive effect on the relationship between sophisticated capital budgeting decisions and financial performance. The present study contributes to corporate finance by validating the relevance of SCBDs in strategic financial planning and stable investments in firms of different sizes.

1. Introduction

Capital budgeting decisions (CBDs) are pivotal for planning the profitability and growth of small and medium enterprises (SMEs) and multinational corporations (MNCs). The significance of CBDs in these entities stems from the fact that both constitute 90% of the businesses and are the key economic contributors to global economies (World Bank, 2024). CBDs are long-term investment planning tools used for the efficient allocation of financial resources (Khan, 2024). Strategically, CBDs improve the accuracy of firms’ perspectives on financial investments (Seddiki, 2025). Modern-day firms have started employing diverging CBDs that integrate established managerial finance theories. Despite these systematic approaches, it is challenging for the firms to maintain their profitability due to underlying differences in the efficacy of CBDs, relevance to certain industries, and the risks associated with the feasibility and uncertainty of projects (Ermasova, 2020). Therefore, accurate decisions are essential for the market survival and competitive advantage of the firms. Whereas poor CBDs wrongly allocate financial resources, intensify risk, and jeopardize the profitability of firms. The puzzle of what type of CBDs are effective in maximizing the financial performance (FP) and risk management (RM) of different types of entities remains unresolved. This leads to investigating the first research question (RQ1).
RQ1: 
What is the effectiveness of different CBDs in managing the FP and RM of firms of different sizes?
The dynamic business environment exposes firms to multiple risks (Hunjra et al., 2024). The drivers of these risks, their impact on investment projects, and how firms manage these risks are largely underexplored and continue to evolve (Hartmann & Weißenberger, 2024). The complications in understanding the types of risk and their impact on businesses are further intensified due to the increasing use of heterogeneous (sophisticated, non-sophisticated, and real options) investment decisions. A few decisions help in evaluating risks, their accuracy in assessing profitability, and the total risk factor is arguable (Akalu, 2003). A seminal study deliberated that sophisticated CBDs, described as SCBDs from hereon, may avoid emerging risks in annual investment returns, while non-sophisticated decisions are unable to avoid basic risks in the investment returns of different firms (Haka et al., 1985).
This study unlocks the impact of SCBDs on the FP and RM of two different types of business entities. Generally, the use of advanced RM techniques such as breakeven, scenario, Monte Carlo simulation, risk-adjusted discount rates (RADRs), real options, annualized net present value (ANPV), and capital rationing to avoid risks is common in the CBDs of firms (Cassone, 2024). The efficiency of these techniques is widely debated, as some firms predominantly pursue risky investments. Previous studies highlighted that SMEs prioritize basic techniques in their CBDs over advanced techniques while computing project returns (Nunden et al., 2022). Additionally, most risk-oriented CBDs are computational, finance-based, and become irrelevant while estimating the risks in strategic investment projects of MNCs (Garrison et al., 2021). Recent studies found that it is also difficult for MNCs to estimate the actual returns and total risk of international investment projects due to uncertain changes in exchange rates, political conditions, transfer pricing, and taxation policies (Almeida et al., 2023).
SCBDs have indicated their efficacy in improving the FP and RM of firms. However, some of these methods poorly appraise investment returns for certain projects and industries (Khajavi et al., 2024). The findings of past studies have confirmed the dominance of unconventional techniques such as the rule of thumb, personal experience, and self-intuition among the firms looking to optimize the FP of SMEs and MNCs (Nurullah & Kengatharan, 2015; Sureka et al., 2022). The usage of these methods demands exclusive understanding of complex estimations and the alliance of CBDs to strategic and market trajectories of firms having different sizes (Andrés-Sánchez, 2025; Mota & Moreira, 2023). In addition, value creation in MNCs and profitability maintenance in SMEs are critical for their market survival (Bogsnes, 2023; Danielson et al., 2024). Thus, the question of whether SCBDs are suitable for firms of different sizes remains unresolved. Earlier studies found that the selection of sophisticated decisions is influenced by internal and external factors, including firm size, nature of the project, investment objective, business environment, and competitiveness (Alles et al., 2021; Batra & Verma, 2017; Sureka et al., 2023). Therefore, firms whose decisions are guided by these factors may experience significant changes in their overall profitability and risk profiles. This leads to the inference that sophisticated decisions may exhibit different impacts on the profitability and risk of investment projects. The second research question (RQ2) is proposed as follows.
RQ2: 
How do SCBDs affect the FP and RM of firms of different sizes?
Following the prevalent knowledge gap on the actual CBDs of the firms and their impact on the FP and RM of the firms, our investigations are conducted on Indonesian firms. SMEs and MNCs are recognized as the key economic contributors in Indonesia and are expected to accelerate the progress to achieve the country’s long-term development plans (Asian Development Bank, 2022; OECD, 2022). Recently, the government of Indonesia enacted various legislations requiring SMEs and MNCs to maintain their financial stability and growth through robust CBDs in their investment projects.
This study exhibits three distinct contributions. First, the empirical insight of this study contributes to extending financial management literature by deliberating the analogies of SCBDs taken by SMEs and MNCs operating in a resource-constrained environment of emerging economies. Second, our findings contribute to refining investment strategies for policymakers and business leaders by examining how SCBDs shape and integrate risk assessment in firms of different sizes. Third, this study contributes to achieving the financial sustainability of the firms by mapping the critical role of SCBDs in improving FP and RM.
The remaining study proceeds as follows. Section 2 presents the literature review and research hypotheses, followed by an overview of the materials and methods in Section 3. The empirical findings are presented and discussed in Section 4. Finally, Section 5 concludes this study.

2. Literature Review

2.1. Conceptualizing Capital Budgeting (CB)

The concept of CB evolved from investment appraisal strategies proposed 250 years ago to streamline firms’ investment decisions. Since there is no unified definition of CB, finance scholars have used different logic to conceal its distinct definitions (Kang, 2022). A pioneering study defined CB as ‘efficient investment of available funds in the projects expected to generate perpetual cash flows for the firms’ (Quirin, 1967). Another study conceptualized it as ‘a four-step process used for identifying future investment opportunities, developing a project-specific proposal, evaluating and selecting a feasible project, and controlling ongoing projects to ensure that investment achieves its objectives’ (Segelod, 1998). To some scholars, ‘CB is a long-term investment in tangible (such as property, plant, and equipment) and intangible (novel technologies and trademarks) assets’ (Peterson & Fabozzi, 2002). These long-term investments consume large funds and allow firms to enjoy benefits for an extended period. Beckett-Camarata (2003) viewed CB from a risk lens and defined it as ‘investment decisions risking substantial corporate funds and resources which are likely to influence a firm’s long-term spending’. Verbeeten (2006) conceived CB as ‘systematic approaches and tactics conducted for evaluating and selecting investment projects’. The financial management and policy handbooks defined CB as ‘interconnected managerial activities guiding firms’ long-term investments to maximize their financial performance’ (Garrison et al., 2021).

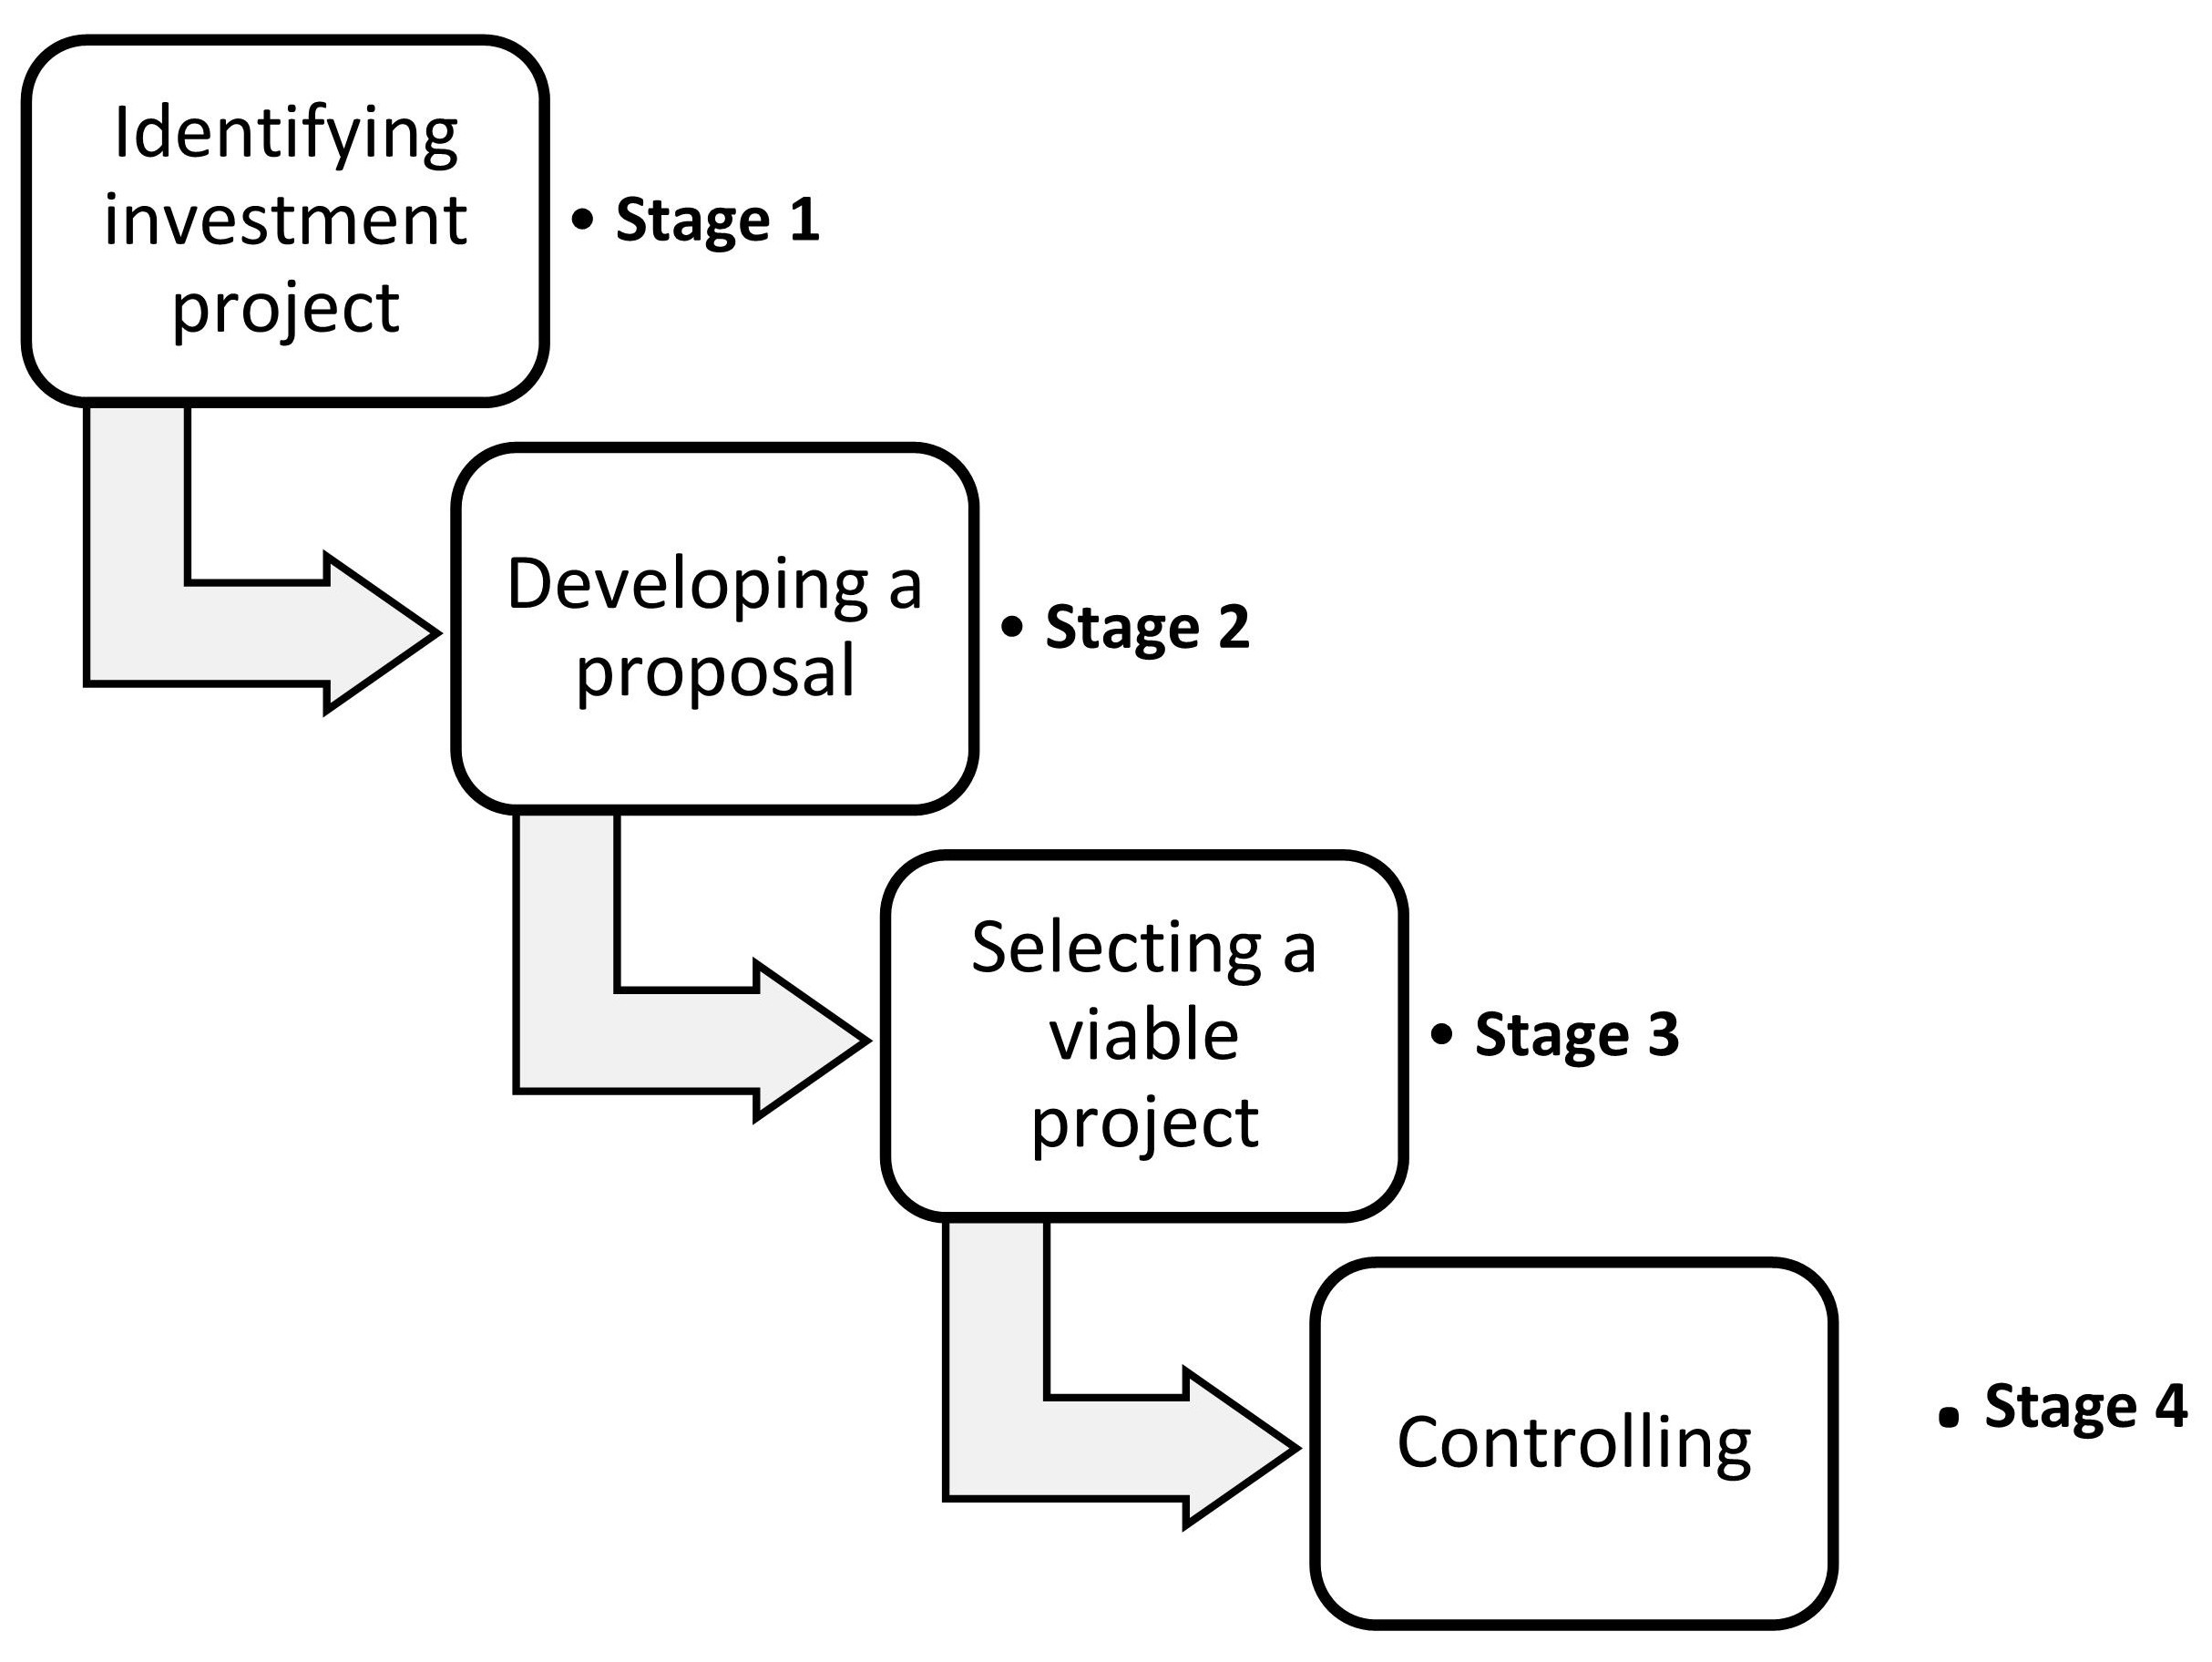
2.2. CB Process and Techniques

The traditional CB literature focuses on two major aspects known as CB approaches and processes. Puwanenthiren (2024) described the CB process as a systematic approach aimed at improving the quality and effectiveness of investment decisions. Following a series of four interlinked stages (Figure 1), a few studies have proposed robust models to mainstream the mechanism of investment decisions in firms (Barbieri et al., 2025). The first stage of the CB process is ‘identifying investment projects’, which involves the recognition of potential investment opportunities. The second stage is ‘developing a proposal’, which is used by the management of firms for screening available investment opportunities to establish the project’s reliability. The ‘selection of a viable project’ is the third stage, encapsulating the critical review and an in-depth analysis of intended investments. After obtaining the reviews and analytical reports, management makes decisions whether to accept or reject the investment proposals. The ‘controlling’ stage charts the implementation plan, progress review, and auditing to ensure that investments fulfill the acceptance criteria.
There are two broad categories of CB known as discounted cash flow (DCF) and non-discounted cash flow (non-DCF). The payback method (PBM) and average/accounting rate of return (ARR) are popular non-DCF techniques, whereas net present value (NPV) and internal rate of return (IRR) are classified as DCF methods. Generally, DCF approaches incorporate the time value of money, while non-DCF techniques ignore this concept (Campbell et al., 2024; Vonlanthen, 2024). A seminal study employed risk factors to separate sophisticated and non-sophisticated CB techniques and classified NPV, IRR, and the profitability index (PI) as sophisticated and placed PBM and ARR as non-sophisticated CB methods (Haka et al., 1985).

2.3. CBDs of Global Firms

The CBDs of global business entities follow blended (sophisticated and non-sophisticated) methods for investment appraisal. Various firms diverge from recommended methods (NPV and real options) due to increasing reliance on PBM and ARR despite the lack of theoretical support for these methods (Yu et al., 2025). Even firms in advanced economies such as the U.S. and Anglo-American countries (Canada, the UK, and Australia) use these non-sophisticated methods to analyze investment projects. The European and Asian firms also follow a similar pattern and deploy PBM and IRR in all of their major investment appraisals (Andrés-Sánchez, 2025). A few studies have examined CBDs in developing (Malaysia, Indonesia, China, and Singapore) and emerging economies of Africa, India, Hong Kong, and the Philippines, and documented that most investments are appraised through non-sophisticated methods (Al-Hashimy, 2025; Lazim et al., 2025; Graham & Sathye, 2020; Vonlanthen, 2024). Some studies highlighted that although ARR theoretically appears inaccurate, SMEs find non-sophisticated methods relatively more flexible in establishing project-specific logic and recognized them as simple, easy to compute, and comparable with the results of different projects (Anwar et al., 2025). Simultaneously, PBM is also acknowledged as a widely used method due to its capability to successfully predict project risk.

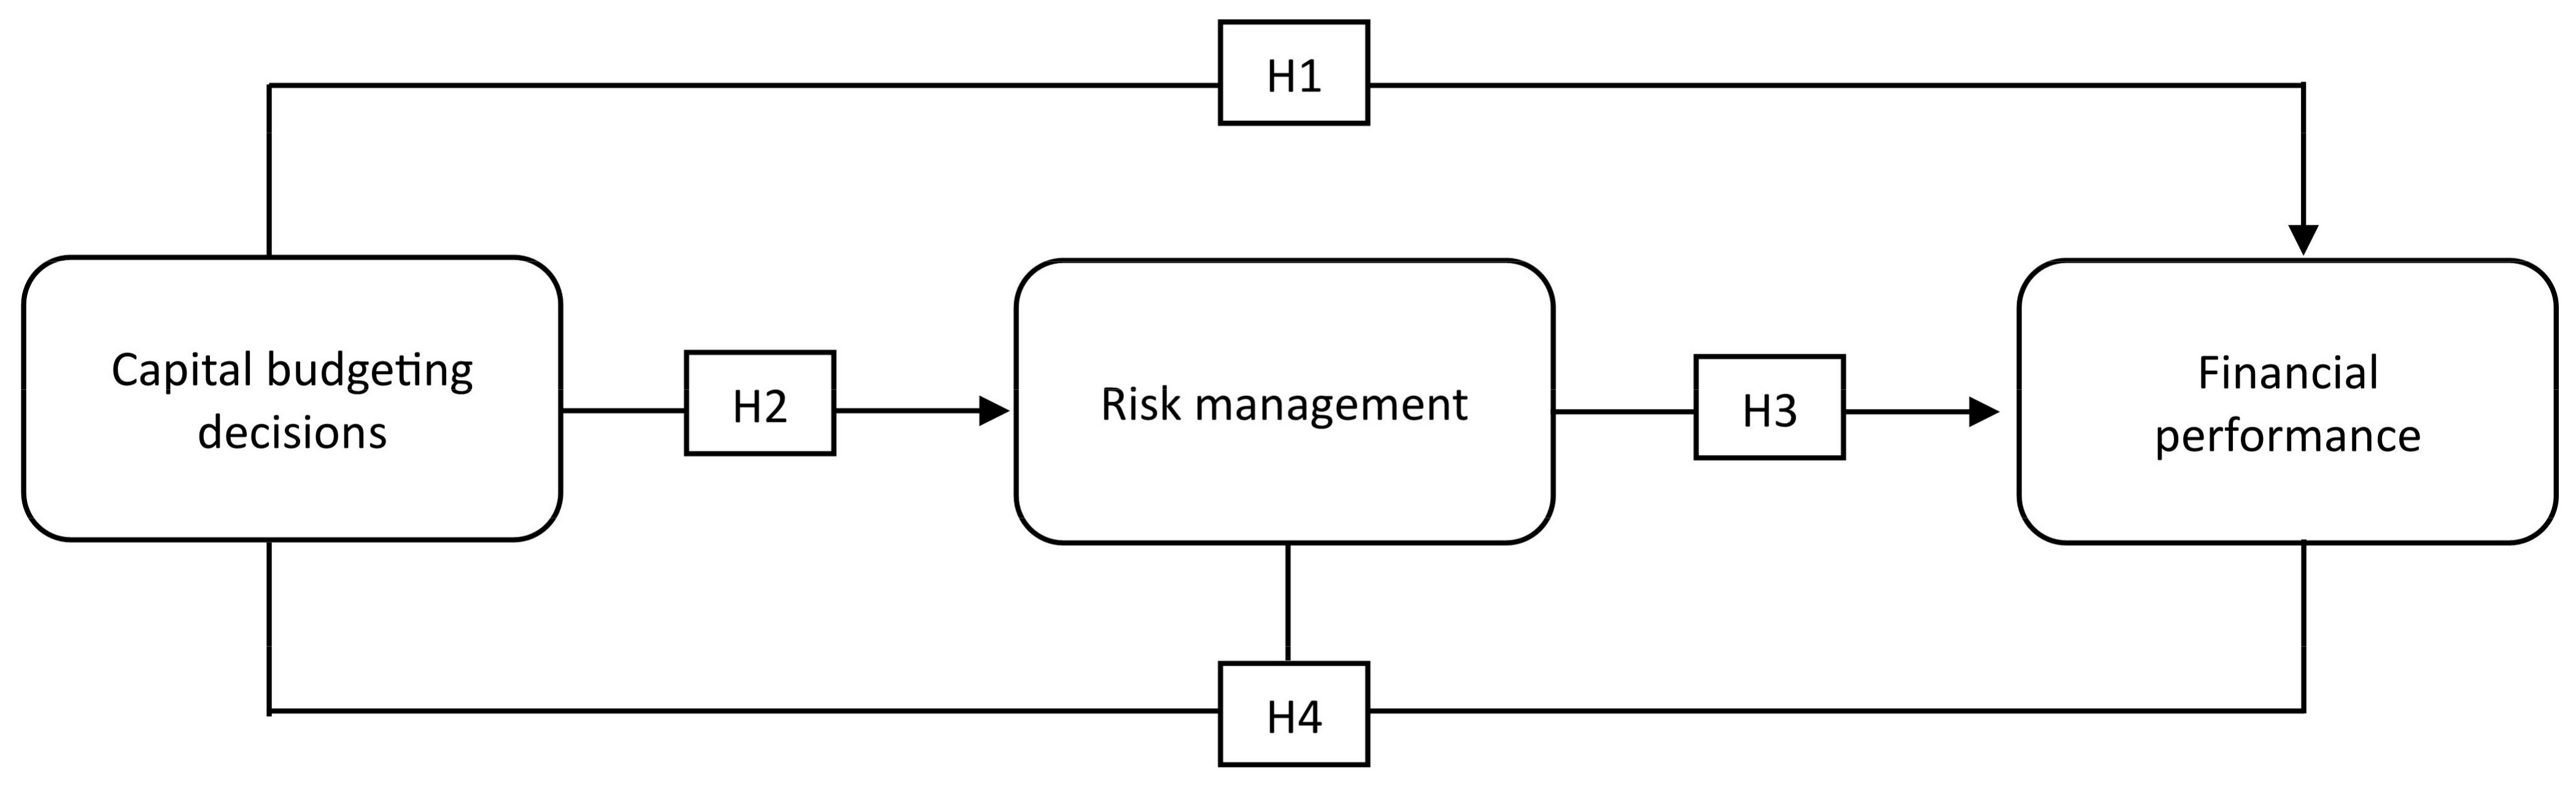
2.4. Hypothesis Development

The present study employs the fundamentals of Barney’s (1991) resource-based view (RBV), Jensen and Meckling’s (1979) agency theories, and the theoretical analysis of the existing literature to construct the conceptual framework (Figure 2).
Following RBV and agency theories’ logic, it is conceptualized that SMEs may resolve agency issues by structuring CBDs in a way that limits resources invested in potentially profitable projects. The viability and significance of CBDs are linked to the FP of SMEs, as it is crucial for their survival and growth (Leitner, 2024). The inherent typologies of SMEs restrict them from leveraging major financing options, creating a shortage of basic and technical expertise, reducing their ability to attract potential investors, and increasing customer retention risk (World Economic Forum, 2021). These composite barriers demand that SMEs remain vigilant in their investment so that such issues are not further intensified. The earlier studies found that non-sophisticated CBDs such as PBM and ARR are suitable for SMEs due to the ease of computation and cost efficiency (Hartmann & Weißenberger, 2024). These types of CBDs also allow SMEs to achieve shareholders’ wealth maximization goals, avoid insolvent projects, and reduce financial loss by shortlisting highly profitable projects (Vonlanthen, 2024). Another study found that non-sophisticated CBDs are useful for SMEs to easily calculate the duration to pay back the bank loans. This realization pushes SMEs to align their business operations with organizational objectives, leading to positive changes in FP. Conversely, some studies deliberated that non-sophisticated CBDs negatively affect the competitive advantage and FP of SMEs (Campbell et al., 2024; Farragher et al., 2001; Graham & Sathye, 2020; Haka et al., 1985). The recent studies also confirmed the negative association between non-sophisticated CBDs and the FP of SMEs (Rao et al., 2021; Shields et al., 2024; Sureka et al., 2023). The negative relationship between non-sophisticated CBDs and the FP of SMEs was supported by the narratives of restricted access to capital markets and the failure to incorporate uncertainty factors.
RBV and agency theory logics are also employed to validate the use of SCBDs in MNCs looking to maximize their FP. These theories asserted that large-scale firms having better resources tend to pursue long-term investments to create sustainable wealth for their extended owners, resolving agency disputes. Past studies have confirmed the use of SCBDs such as NPV and IRR for investment appraisals and linked them to sustainable FP of MNCs (Wolf, 2025; Leon et al., 2008). The proponents of implementing SCBDs in investment appraisal delineated that perspective uncertainties are less likely to affect the FP of MNCs due to improved communication and collaboration between organizational departments (Andon et al., 2024; Batra & Verma, 2017; Ryan & Ryan, 2002). Whereas some studies have also indicated a negative correlation between SCBDs and the FP of MNCs due to complex computation and systematic risks in long-term investment projects (Haka et al., 1985; Anwar et al., 2025). The above arguments infer that the direction and impact of SCBDs on SMEs and MNCs are an ongoing debate and require further investigation. Therefore, the first research hypothesis is proposed as follows.
Hypothesis 1 (H1):
SCBDs have a significant positive impact on the FP of firms.
Hillier initiated and proposed a functional model to compute investment risks through diverging CBDs. His risk evaluation technique recommended comparing the deviation in actual income from the expected income of investment projects. Past studies have operationalized interesting frameworks to propose and analyze the impact of different CBDs on the RM of different entities. A few risk-estimation approaches, namely the Certainty model, Monte Carlo simulation, and Decision Tree model, have confirmed their effectiveness in reducing investment risks. Earlier studies indicated that SCBDs such as NPV and IRR improve the RM in firms having complex business operations (Biondi & Marzo, 2011). The findings of the studies conducted in developing countries highlighted that SCBDs positively affect the RM in MNCs (Mollah et al., 2023; Nurullah & Kengatharan, 2015). Similarly, a few MNCs have also used SCBDs, including risk-adjusted measures, project-dependent cost of capital (PDCC), the weighted average cost of capital (WACC), and the cost of debt (CD) to positively improve their RM (Vonlanthen, 2024). Practically, it is difficult to fully eliminate the risk in CBDs due to the feasibility of different techniques and the nature of the project (Añón Higón et al., 2025). The academic literature has positively associated sophisticated and mixed CBDs such as NPV, expected shortfall, and the NPV risk preference index with RM in SMEs. Whereas some scholars found that SCBDs negatively influence RM in SMEs as these techniques require extensive funding, time, and effort (Anwar et al., 2025; Sureka et al., 2023). Some recent studies have confirmed that besides SCBDs, modern portfolio theories have started improving RM in the firms with different sizes (Cetingoz et al., 2024; Charoenwong et al., 2024; Wang & Lee, 2021). Following these arguments, the second research hypothesis is proposed as follows.
Hypothesis 2 (H2):
SCBDs have a significant positive impact on the RM of firms.
Another striking feature of RBV and agency theory is their ability to suggest strategic pathways for reducing agency conflicts. The management of these conflicts demands optimizing organizational productivity by resolving less conducive issues and risks. Accordingly, a modern-day business ecosystem of SMEs and MNCs exposes them to versatile risks requiring specific RM approaches. The contemporary features of SMEs also persist in RM and negatively affect their FP due to relatively higher exposure to investment risks (Peel & Bridge, 1998; Sureka et al., 2023). Several past studies have confirmed that factors such as increased cost of capital, lack of skilled workforce, small market capitalization, lack of innovation, and disruptions in supply chains exacerbate SMEs’ investment risk profiles that may negatively affect their FP (Alles et al., 2021; Danielson et al., 2024; Nunden et al., 2022; Shields et al., 2024).
MNCs’ structural orientations and CBDs require rendering exclusive RM approaches to achieve sustainable growth and create long-term wealth for shareholders (Kim & Nguyen, 2025). MNCs operating in dynamic political, economic, social, and financial conditions are likely to face higher risks in investment projects and employ effective frameworks for robust RM. Past studies have confirmed the efficacy of sophisticated CBDs in improving RM that may contribute to maximizing the FP of MNCs (Mollah et al., 2023; Nurullah & Kengatharan, 2015). Whereas some studies criticized that SCBDs are unable to capture certain investment risks, such as changes in government policies, exchange rate fluctuations, and the enactment of new business regulations that may reduce the FP of MNCs (Fei et al., 2021). The extant literature found that SMEs employing SCBDs in their investment projects may experience positive changes in their RM and FP (Sureka et al., 2023). The studies have also indicated that implementing SCBDs is equally challenging for SMEs and MNCs as it demands exclusive understanding of various internal and external factors. It is inferred that changes in firms’ business landscape may alter the typologies of CBDs, which may affect their RM and FP. It will be interesting to evaluate whether RM guided by SCBDs increases the FP of firms of different sizes. Thus, the third and fourth research hypotheses are as follows:
Hypothesis 3 (H3):
Sophisticated RM has a significant positive impact on the FP of firms.
Hypothesis 4 (H4):
Sophisticated RM is a significant positive mediator of the relationship between SCBDs and the FP of firms.

3. Materials and Methods

3.1. Research Sampling

To achieve the research objectives of this study, we followed a quantitative methodology and sampled Indonesian firms for data collection. The geographic settings of this study are crucial to reinforce the context of this study. SMEs and MNCs are recognized as critical players in economic development by contributing to achieving Indonesia’s long-term development plans (Asian Development Bank, 2022; OECD, 2022). It is anticipated that sampling formally regulated business entities will offer a synchronized insight into the efficacy of SCBDs in improving the FP and RM of these firms. Another rationale for extending this study to Indonesian firms is the recent regulatory promulgations requiring these firms to exhibit robust risk evaluation approaches, which is likely to shed light on the existing challenges faced in effective RM. Recently, the government of Indonesia has enacted a few regulations for the promotion (Law No. 20/2008), licensing (Regulation No. 83/2014), and development (Presidential Regulation No. 2/2015) of SMEs and MNCs (Asian Development Bank, 2022). These regulations will prove to be a game changer as these firms may start employing SCBDs in their investment projects.
We sampled 590 firms (SMEs = 295; MNCs = 295) for data extraction. These firms were selected following locally established protocols of the Ministry of Cooperatives and SMEs and the Ministry of Finance [Otoritas Jasa Keuangan (OJK)] of the Republic of Indonesia. The Indonesian firms maintain their total assets between IDR 50 million and IDR 10 billion, annual sales between IDR 2.5 billion and IDR 50 billion, number of employees between 1 and 99, and publicly disclose financial statements (once a year). Their total assets listed on the Indonesian Stock Exchange [Pt Bursa Efek Indonesia (BEI)] are classified as SMEs and MNCs. The sampling of firms from various sectors such as energy, oil and gas, real estate, food and beverages, media and entertainment, apparel and luxury goods, agriculture, forestry, and fisheries, manufacturing, transportation and communication, construction, and wholesale and retail trade allows us to diversify the findings. The details of the firms and their respective industries sampled in this study are presented in Table 1.

3.2. Experimental Variables

This study operationalizes three key variables. The accuracy and reliability of data sources were ensured by retrieving data from established databases such as the Asian Development Bank (ADB), the Organisation for Economic Co-operation and Development (OECD), and annual reports. These sources contain reliable information about the financial status of global and regional SMEs and MNCs. The predicting variable (SCBDs) was estimated by an index whose value ranges from 0 to 590. The sampled firms following SCBDs in their investment appraisals are assigned a score of ‘1’ and a score of ‘0’ if otherwise. RM was an outcome variable, and it is represented by two proxy variables known as liquidity risk (LDR) and solvency risk (SLR). The extant literature has verified their effectiveness in decoding the extent of risk in firms, inferring that our variables’ estimation techniques are robust and effective. FP is also an outcome variable and is estimated by two dummy variables called return on assets (ROA) and return on equity (ROE). The use of these dummies and proxies to estimate FP is consistent with recent studies validating our empirical estimations. To enhance the accuracy of the measurement of variables and reduce the influence of externalities, a few control variables such as firm size (SIZE), sales growth (SALE), operational risk (OPR), capital intensity, and the degree of focus (DOF) are incorporated in the analysis of this study. Several contextual studies have indicated the impact of these control variables on CBDs, RM, and FP (Farragher et al., 2001; Graham & Sathye, 2020). The experimental variables of this study are elaborated in Table 2.
This study investigates the impact of SCBDs on the FP and RM of sampled firms as well as the mediating influence of RM on the relationship between SCBDs and FP. Firms seeking to optimize their financial portfolios and minimize risk profiles consider different investment opportunities that are realized following different SCBDs. These assertions are statistically represented in the econometric models below:
F P sit = 0 + 1 S C B D s s i t + 2 S I Z E i t + 3 S A L i t + 4 O P R i t + 5 C I R i t + 6 D O F i t + α i + Ɛ i t
R M sit = 0 + 1 S C B D s s i t + 2 S I Z E i t + 3 S A L i t + 4 O P R i t + 5 C I R i t + 6 D O F i t + α i + Ɛ i t
F P sit = 0 + 1 R M s i t + 2 S I Z E i t + 3 S A L i t + 4 O P R i t + 5 C I R i t + 6 D O F i t + α i + Ɛ i t
RMsit = 0 + 1 S C B D s i t + 2 F P i t + 3 S I Z E i t + 4 S A L i t + 5 O P R i t + 6 C I R i t + 7 D O F i t + α i + Ɛ i t
In Equations (1) and (2), the SCBDs variable is the predictor of FP and RM, whereas RM is the predictor of FP and SCBDs in Equations (3) and (4). The variables SCBDs, FP, and RM are determined by the respective indices and proxies used for evaluating the changes in the sophisticated capital budgeting decisions, profitability, and risk management of the sampled SMEs and MNCs. Further, SIZE, SAL, OPR, CIR, and DOF are the control variables representing firm size, annual sales growth, operational risk, capital intensity, and the degree of focus of sampled firms. The random distribution of the error term is denoted as Ɛit; i represents the firm, and t is a firm’s year-wise observation. The proxies and indicators deployed for measuring independent, dependent, mediating, and control variables are commonly used in corporate finance studies to examine the impact of SCBDs on FP and RM. Thus, our econometric approach is valid and accurate (Mollah et al., 2023; Purnamasari & Adriza, 2024). The econometric settings of the variables allowed creating a panel data model covering the time and cross-sectional characteristics of the data. Thus, the datasets of this study are superior as the heterogeneity problems that often prevail in cross-sectional data analysis are manageable. Additionally, the datasets are attributed as diverse, dynamic, and transparent as they will capture a higher number of observations to generate the findings of this study (Gujarati, 2021).

3.3. Data Analysis

There are different techniques used for analyzing unbalanced panel data. A few popular statistical approaches are ordinary least squares (OLS), 2-stage least squares (2SLS), and generalized methods of moments (GMM). Each technique has its pros and cons. OLS is recognized as an effective technique for capturing useful insight from large datasets through a single regression with a possibility of bias, especially when dealing with time-based data series. These issues may create common heterogeneity and endogeneity issues, which can be resolved through the 2SLS approach (Gujarati & Porter, 2009). To manage these issues, statisticians recommend using the 2SLS technique as it is relatively robust in capturing the relationship between exogenous variables compared to OLS (Bollen, 1996). A major drawback of 2SLS is its ineffectiveness in verifying the dynamism among variables, inferring that it is not relevant to our investigation. Comparatively, GMM regression analysis is more effective in estimating the dynamic nature of latent variables by controlling the endogeneity and heterogeneity problems. Taking together the nature of our panel data and the dynamic attributes of our latent variables, GMM regression is recognized as a suitable approach for this study. Thus, the following GMM regression models were created:
R O A it = 0 + 1 S C B D s i t + 2 S I Z E i t + 3 S A L i t + 4 O P R i t + 5 C I R i t + 6 D O F i t + α i + Ɛ i t
R O E it = 0 + 1 S C B D s i t + 2 S I Z E i t + 3 S A L i t + 4 O P R i t + 5 C I R i t + 6 D O F i t + α i + Ɛ i t
L D R it = 0 + 1 S C B D s i t + 2 S I Z E i t + 3 S A L i t + 4 O P R i t + 5 C I R i t + 6 D O F i t + α i + Ɛ i t
S L R it = 0 + 1 S C B D s i t + 2 S I Z E i t + 3 S A L i t + 4 O P R i t + 5 C I R i t + 6 D O F i t + α i + Ɛ i t
R O A it = 0 + 1 L D R i t + 2 S I Z E i t + 3 S A L i t + 4 O P R i t + 5 C I R i t + 6 D O F i t + α i + Ɛ i t
R O A it = 0 + 1 S L R i t + 2 S I Z E i t + 3 S A L i t + 4 O P R i t + 5 C I R i t + 6 D O F i t + α i + Ɛ i t
R O E it = 0 + 1 L D R i t + 2 S I Z E i t + 3 S A L i t + 4 O P R i t + 5 C I R i t + 6 D O F i t + α i + Ɛ i t
R O E it = 0 + 1 S L R i t + 2 S I Z E i t + 3 S A L i t + 4 O P R i t + 5 C I R i t + 6 D O F i t + α i + Ɛ i t
LDRit = 0 + 1 S C B D s i t + 2 F P s i t + 3 S I Z E i t + 4 S A L i t + 5 O P R i t + 6 C I R i t + 7 D O F i t + α i + Ɛ i t
SLRit = 0 + 1 S C B D s i t + 2 F P s i t + 3 S I Z E i t + 4 S A L i t + 5 O P R i t + 6 C I R i t + 7 D O F i t + α i + Ɛ i t
Equations (5)–(8) ROA, ROE, LDR, and SLR are operationalized as endogenous variables as they are affected by the variance in SCBDs. ROA and ROE are also endogenous in Equations (9)–(12), as they are affected by changes in LDR and SLR, whilst LDR and SLR are exogenous in Equations (13) and (14), as they affect SCBDs and FP. After establishing the validity of econometric models, we followed Arellano and Bond’s (1991) approach and used GMM regression to analyze the panel data. This technique is highly effective in restricting the large amount of panel data (N) into smaller observations (T) and obtaining robust regression outputs without relying on cross-sectional tests. Further, it is also frequently employed in corporate finance studies for investigating the nexus between CBDs, FP, and RM. The contentions about GMM’s robustness are statistically verified by conducting the Sargan and Arellano-Bond tests to observe whether instrumental variables exhibit autocorrelation (AR2) problems. The findings confirmed that our data analysis procedures are valid and effective, as the GMM results do not have AR2 issues.

4. Findings and Discussion

Table 3 reports the baseline findings of operational variables. It is observed that predicting, outcome, and control variable dummies exhibit positive mean, median, and standard deviation values, indicating a significant change in peak distributions of instrumental variables. The maximum (590) and minimum (0) values of SCBDs, LDR (6.35; 1.20), SLR (9.57; 3.52), ROA (4.79; 2.53), and ROE (6.71; 1.47) highlight a substantial difference in the performance of endogenous variables.
The correlation analysis (Table 4) revealed that all instrumental variables have a positive correlation, indicating that firm-specific SCBDs are likely to have a positive influence on the RM and FP of sampled Indonesian firms.
Additionally, the correlation between variables appears weak, implying that multicollinearity issues may not affect the results of this study. This is further confirmed by performing the variance inflation factor (VIF) test (Table 5). It is observed that the mean values of all VIF coefficients are less than the recommended criteria of >10, concluding that the construct used in this study is valid (Bring, 1994).
The self-reported panel data used in this study may contain heterogeneity problems. It is essential to address these problems to ensure that the main findings are unaffected and generate desired results. The independence of cross-sections is often checked by following Driscoll and Kraay’s (1998) approach, which is useful in resolving heterogeneity issues. The findings (Table 6) resonate that variance in cross sections is low, as the cross-section coefficients are less than their respective standard errors.
We also tested the slopes of endogenous variables to reaffirm the heterogeneity and heteroscedasticity problems by analyzing the variance. The findings (Table 7) indicate that the slopes of outcome variables meet the recommended threshold, implying that finalized data are suitable for further analysis. The completion of all the prerequisites elucidated that our datasets can be processed to perform GMM regression. This study deployed 10 GMM regression models on 3038 firm-year observations to empirically verify the effect of SCBDs on FP (H1) and RM (H2) and the impact of RM on FP (H3), as well as the mediating role of RM on the relationship between SCBDs and FP (H4).
Table 8 reports the output of the GMM regression. An overview of this output highlights that SCBDs exhibit a positive impact on FP and RM. Further, RM as a mediator shows a positive linkage with CBD/FP groups. It is also notable that the coefficients of both endogenous variables, FP (ROA and ROE) and RM (LDR and SLR), are positive and range between strong, moderate, and weak.
GMM regression (Models 1 and 3) results (Table 8) show that the standard errors of ROA and ROE are positive and significant, indicating that H1 is supported. Statistically, it interpreted that the coefficients of ROA are significant and positive (β = 0.015, p > 0.01; β = 0.009, p > 0.01) and ROE’s proxy (Models 2 and 4) also follows a similar trend of positive and significant (β = 0.023, p > 0.01; β = 0.017, p > 0.01) influence. This implies that SCBDs significantly increase the FP of sampled firms. The results of SCBD’s significant positive impact on FP are consistent with the findings of recent studies that argued the strategic financial advantages of different CBDs for the firm (Haka et al., 1985; Vonlanthen, 2024). This finding indicates that the debate on SCBDs and its impact on the FP is ongoing and requires further evidence, as past studies have suggested that employing simple approaches in investment appraisals, especially for SMEs, is difficult to implement (Charoenwong et al., 2024; Wang & Lee, 2021).
The findings related to RM (Models 5 and 7) show that standard errors for LDR (β = 0.015, p < 0.01) are insignificant, whereas the SLR dummy shows a significant and positive (β = 0.022; p > 0.01) influence, delineating that H2 is partially supported. It is interpreted that despite resolving solvency issues, SCBDs may increase liquidity crises by affecting SMEs’ and MNCs’ ability to fulfill their short-term liabilities. This result validates the findings of past studies recommending that SMEs remain cautious while pursuing long-term investments, as it may expose them to liquidity risks (Andrés-Sánchez, 2025; Wolf, 2025). This finding also extends the claims of seminal studies suggesting that SMEs in emerging economies employ NPV, IRR, and PI in their investment appraisals (Lazim et al., 2025; Graham & Sathye, 2020; Vonlanthen, 2024).
The findings in Models 6 and 8 (Table 8) depict a significant positive impact of RM on FP as the standard errors of ROA (β = 0.018, p > 0.01) and ROE (β = 0.027, p > 0.01) dummies are significant and positive, indicating that H3 is accepted. This result validates the findings of several past studies, establishing that effective risk management during SCBDs is a key to maximizing shareholders’ wealth as well as improving the profitability of firms (Akalu, 2003; Anwar et al., 2025). Indeed, firms employ diverging CBD typologies to minimize the risk in prospective investments as it guides firms in achieving their strategic objectives (Garrison et al., 2021; Sureka et al., 2023).
The standard errors showing (Models 9 and 10) mediation influence represent LDR (β = 0.012, p > 0.01) and SLR (β = 0.020, p > 0.01) proxies that exhibit a significant positive influence on the SCBDs/FP relationship. Hence, H4 is supported. This result authenticates the findings of seminal and novel studies on SCBDs, elucidating that firms’ internal [size, market competitiveness, and chief financial officers’ (CFOs’) knowledge and awareness of advanced CB methods] and external environments (industry size and economic and political environments) are critical while taking investment opportunities (Anwar et al., 2025; Battalio et al., 2024; Leon et al., 2008; Mollah et al., 2023). Therefore, the SCBDs of both SMEs and MNCs should carefully assess these factors as the failure may expose them to numerous risks that may undermine their financial growth and future survival (Purnamasari & Adriza, 2024).
This study followed Hill et al.’s (2020) technique to address endogeneity problems among SCBDs, FP, and RM variables. The GMM regression technique allowed us to detect serial autocorrelation (AR), which will help in identifying the predictors of FP as well as RM. Thus, the overfitting issues in conceptual models are avoided by resolving endogeneity problems by ensuring that SCBDs are endogenous. Following Li et al.’s (2023) procedures, we used second and third-year lagged values of SCBDs and RM and replaced the missing external instrumental variables. The validity of instrumental variables was confirmed by conducting the Kleibergen and Paap (2006) tests. The results of the reperformed GMM regression highlighted that instrumental variables were correlated with the regression of endogenous variables (p < 0.1).
To reconfirm the robustness of the analytical framework, we switched the dummies of the outcome variables (FP and RM) with Tobin’s Q (TQ) and credit risk (CR). These are also recognized as alternate measures for both outcome variables. TQ is estimated by a ratio between the total market value of the firm divided by the total value of the firm’s assets, whereas CR is represented by the capital adequacy ratio (CAR), estimated by dividing the firm’s total equity by its risk-weighted assets. The robustness results (Table 9) indicated that our findings are consistent with the earlier estimations reported in Table 8. Interestingly, SCBDs indicated a significant positive impact on CAR, representing that SCBDs may significantly improve risk management and FP of SMEs. This finding creates an opportunity for future empirics to further delve into this developing research theme and re-explore the impact of SCBDs on the FP and RM of firms of different sizes operating in developing economies.
The results of GMM regression (Table 8) confirmed that H1 is supported, indicating that SCBDs have a significant (positive) impact on the FP of SMEs and MNCs. H2 findings indicate that it was not fully supported, as SCBDs do not have a significant (positive) impact on liquidity risk. The empirical results of H3 elucidate that it was supported as RM has a significant (positive) impact on FP. The findings of H4 show that it was also supported, as RM has a significant (positive) impact on the SCBDs/FP relationship. The robustness checks (Table 9) further confirmed the accuracy of results, validating our empirical findings.

5. Conclusions

This research attempts to explore the impact of SCBDs on the financial performance and risk management of Indonesian SMEs and MNCs. The empirical findings corroborate that SCBDs have a significant positive impact on the FP of SMEs and MNCs. An in-depth statistical analysis revealed that SCBDs may significantly reduce solvency risk; however, liquidity risks are inevitable in SMEs and MNCs due to the underlying nature of investment. Interestingly, our sampled firms are likely to realize the fruits of effective risk management, as it shows a significant positive impact on financial performance. Finally, the results delineated that Indonesian firms need to overcome the risk factors to maximize the wealth of shareholders and financial portfolios through SCBDs.

5.1. Research Implications

The findings of the present study render important implications for theoretical and practical considerations. From a theoretical lens, our findings have contributed to validating the accuracy of resource utilization and corporate finance and theories to understand the CBDs, financial performance, and risk management. Another theoretical contribution of this study is the validation of existing financial frameworks by structuring them into a single conceptual model, which can be used to evaluate SCBDs and their impact on the FP and RM of firms of different sizes.
From a practical aspect, the results of the present study can be considered by the regulators to create a lucrative business landscape by stabilizing the macroeconomic conditions, such as inflation, interest, and exchange rates, and decent economic conditions in the country, so that firms are able to achieve the goals of CBDs. The findings of this study are also useful for the policymakers of SMEs to propose certain policies to the government bodies to encourage them to design market-enabling legislations requiring SMEs to maintain minimal capital requirements, which will help them in lowering the financial risk and acquire funding from recognized financial institutions at affordable rates. The business managers may use these findings to train and encourage CFOs to employ these methods for the accurate calculation of risk in investment projects. Finally, financial consultants may find our findings efficient in recommending risk mitigation strategies to business firms by adjusting discount rates and annual cash flows.

5.2. Limitations and Future Research

Our findings are subject to certain limitations due to the sample selection, research instrument, and data analysis procedures. The research sample used in this study was carefully selected and statistically verified by checking the difference between responding and non-responding firms to ensure that our findings are generalizable. However, most of the sampled firms are from the manufacturing sector, which may reduce the generalizability of findings. Future studies are highly recommended to use a larger sample size, especially from the service sector, to truly gain an insight into SCBDs, risk management, and the FP of different firms. Another limitation was related to the data collection and analysis procedures, limiting the accuracy of the results due to the recent pandemic affecting the findings of this study. Hence, future empirics are recommended to incorporate the impact of this factor while designing their theoretical frameworks so that findings are contextual. We employed robust data analysis procedures guided by GMM regression to ensure that the findings are consistent. However, endogeneity and heterogeneity problems may still arise due to Halo effects. Thus, additional statistical measures should be considered to ensure the robustness of the results.

Author Contributions

Conceptualization, A.D.; methodology, Q.A. and A.D.; software, S.P.; validation, A.D. and Q.A.; formal analysis, A.D. and S.P.; investigation, Q.A. and S.P.; resources, A.D.; data curation, S.P. and Q.A.; writing—original draft preparation, A.D.; writing—review and editing, Q.A. and S.P.; visualization, Q.A.; supervision, A.D.; project administration, S.P. and Q.A. All authors have read and agreed to the published version of the manuscript.

Funding

This research received no external funding.

Institutional Review Board Statement

Not Applicable.

Informed Consent Statement

Not Applicable.

Data Availability Statement

The datasets of this article are available from the corresponding author upon reasonable request.

Conflicts of Interest

The authors declare no conflicts of interest.

Abbreviations

ANPVAnnualized net present value
ARRAccounting/average rate of return
CBCapital budgeting
CBDsCapital budgeting decisions
FPFinancial performance
GMMGeneralized method of moments
IRRInternal rate of return
RMRisk management
SCBDsSophisticated capital budgeting decisions
SMEsSmall and medium enterprises
MNCsMultinational corporations
NPVNet present value
PBMPayback method
PIProfitability index
RADRsRisk-adjusted discount rates
RBVResource-based view

References

  1. Akalu, M. M. (2003). The process of investment appraisal: The experience of 10 large British and Dutch companies. International Journal of Project Management, 21(5), 355–362. [Google Scholar] [CrossRef]
  2. Al-Hashimy, H. N. H. (2025). The relationship between financial management strategies and firm financial performance: The moderating role of firm size. Journal of Financial Management of Property and Construction. [Google Scholar] [CrossRef]
  3. Alles, L., Jayathilaka, R., Kumari, N., Malalathunga, T., Obeyesekera, H., & Sharmila, S. (2021). An investigation of the usage of capital budgeting techniques by small and medium enterprises. Quality & Quantity, 55, 993–1006. [Google Scholar] [CrossRef]
  4. Almeida, R. P., Ayala, N. F., Benitez, G. B., Kliemann Neto, F. J., & Frank, A. G. (2023). How to assess investments in industry 4.0 technologies? A multiple-criteria framework for economic, financial, and sociotechnical factors. Production Planning & Control, 34(16), 1583–1602. [Google Scholar] [CrossRef]
  5. Andon, P., Baxter, J., & Chua, W. F. (2024). Affect and reason in uncertain accounting settings: The case of capital investment appraisal. Accounting & Finance, 64(2), 1439–1470. [Google Scholar] [CrossRef]
  6. Andrés-Sánchez, J. D. (2025). A systematic overview of fuzzy-random option pricing in discrete time and fuzzy-random binomial extension sensitive interest rate pricing. Axioms, 14(1), 52. [Google Scholar] [CrossRef]
  7. Anwar, J., Butt, I., & Ahmad, N. (2025). SMEs’ strategic orientation through Miles and Snow typology: A synthesis of literature and future directions. Management Research Review, 48(2), 258–286. [Google Scholar] [CrossRef]
  8. Añón Higón, D., Máñez, J. A., Sanchis, A., & Sanchis, J. A. (2025). Digitalisation and global value chain participation: Evidence from Spanish manufacturing firms. Industry and Innovation, 1–36. [Google Scholar] [CrossRef]
  9. Arellano, M., & Bond, S. (1991). Some tests of specification for panel data: Monte Carlo evidence and an application to employment equations. The Review of Economic Studies, 58(2), 277–297. [Google Scholar] [CrossRef]
  10. Asian Development Bank. (2022). ADB Asia SME monitor—Indonesia. Available online: https://data.adb.org/media/13281/download (accessed on 16 April 2024).
  11. Barbieri, G., Vega, A. S., Gutierrez, J., Laserna, J., & Mateus, L. M. (2025). Strategic capital investments in asset management: A value-based approach. Journal of Quality in Maintenance Engineering, 31(5), 1–22. [Google Scholar] [CrossRef]
  12. Barney, J. (1991). Firm resources and sustained competitive advantage. Journal of Management, 17(1), 99–120. [Google Scholar] [CrossRef]
  13. Batra, R., & Verma, S. (2017). Capital budgeting practices in Indian companies. IIMB Management Review, 29(1), 29–44. [Google Scholar] [CrossRef]
  14. Battalio, R. H., Loughran, T., & McDonald, B. (2024). How managers communicate about capital budgeting to investors. Available online: https://ssrn.com/abstract=4766530 (accessed on 24 April 2024).
  15. Beckett-Camarata, J. (2003). An examination of the relationship between the municipal strategic plan and the capital budget and its effect on financial performance. Journal of Public Budgeting, Accounting & Financial Management, 15(1), 23–40. [Google Scholar] [CrossRef]
  16. Biondi, Y., & Marzo, G. (2011). Decision making using behavioral finance for capital budgeting. In K. Baker, & P. English (Eds.), Capital budgeting valuation: Financial analysis for today’s investment decisions (pp. 421–444). John Wiley & Sons. [Google Scholar]
  17. Bogsnes, B. (2023). Beyond budgeting and dynamic resource allocation. Controlling & Management Review, 67(6), 8–17. [Google Scholar] [CrossRef]
  18. Bollen, K. A. (1996). An alternative two stage least squares (2SLS) estimator for latent variable equations. Psychometrika, 61(1), 109–121. [Google Scholar] [CrossRef]
  19. Bring, J. (1994). How to standardize regression coefficients. The American Statistician, 48(3), 209–213. [Google Scholar] [CrossRef]
  20. Campbell, J. Y., Stein, J. C., & Wu, A. A. (2024). Economic budgeting for endowment-dependent universities (No. w32506). National Bureau of Economic Research. [Google Scholar] [CrossRef]
  21. Cassone, D. (2024). Budgeting for your organization. In Leadership concepts for the engineering mindset (pp. 55–64). Springer Nature. [Google Scholar] [CrossRef]
  22. Cetingoz, A. R., Fermanian, J. D., & Guéant, O. (2024). Risk Budgeting portfolios: Existence and computation. Mathematical Finance, 34(3), 896–924. [Google Scholar] [CrossRef]
  23. Charoenwong, B., Kimura, Y., Kwan, A., & Tan, E. (2024). Capital budgeting, uncertainty, and misallocation. Journal of Financial Economics, 153, 103779. [Google Scholar] [CrossRef]
  24. Danielson, M. G., Hogan, K. M., & Olson, G. T. (2024). Shareholder theory, stakeholder theory, and the capital budgeting decision. Corporate Ownership & Control, 21(2), 37–74. [Google Scholar] [CrossRef]
  25. Driscoll, J., & Kraay, A. C. (1998). Consistent covariance matrix estimation with spatially dependent data. Review of Economics and Statistics, 80, 549–560. [Google Scholar] [CrossRef]
  26. Ermasova, N. (2020). 35 years of public capital budgeting: A review and future research agenda. Public Finance and Management, 19(4), 297–326. [Google Scholar] [CrossRef]
  27. Farragher, E. J., Kleiman, R. T., & Sahu, A. P. (2001). The association between the use of sophisticated capital budgeting practices and corporate performance. The Engineering Economist, 46(4), 300–311. [Google Scholar] [CrossRef]
  28. Fei, C., Fei, W., Rui, Y., & Yan, L. (2021). International investment with exchange rate risk. Asia-Pacific Journal of Accounting & Economics, 28(2), 225–241. [Google Scholar] [CrossRef]
  29. Garrison, R. H., Noreen, E. W., & Brewer, P. C. (2021). Managerial accounting. McGraw-Hill. [Google Scholar]
  30. Graham, P. J., & Sathye, M. (2020). The relationship between national culture, capital budgeting systems and firm financial performance: Evidence from Australia and Indonesia. International Journal of Management Practice, 13(6), 650–673. [Google Scholar] [CrossRef]
  31. Gujarati, D. N. (2021). Essentials of econometrics. Sage Publications. [Google Scholar]
  32. Gujarati, D. N., & Porter, D. C. (2009). Basic econometrics. McGraw-Hill. [Google Scholar]
  33. Haka, S. F., Gordon, L. A., & Pinches, G. E. (1985). Sophisticated capital budgeting selection technique and firms’ performance. The Accounting Review, 60(4), 651–669. [Google Scholar]
  34. Hartmann, M., & Weißenberger, B. E. (2024). Decision-making in the capital budgeting context: Effects of type of decision aid and increases in information load. Journal of Business Economics, 94(2), 379–411. [Google Scholar] [CrossRef]
  35. Hill, A. D., Johnson, S. G., Greco, L. M., O’Boyle, E. H., & Walter, S. L. (2020). Endogeneity: A review and agenda for the methodology-practice divide affecting micro and macro research. Journal of Management, 47(1), 105–143. [Google Scholar] [CrossRef]
  36. Hunjra, A. I., Arunachalam, M., Verhoeven, P., Colombage, S., & Bouri, E. (2024). The interplay of CSR, stakeholder interest management, capital budgeting, and firm performance. Journal of Behavioral and Experimental Finance, 43, 100967. [Google Scholar] [CrossRef]
  37. Jensen, M. C., & Meckling, W. H. (1979). Theory of the firm: Managerial behavior, agency costs, and ownership structure. In K. Brunner (Ed.), Economics social institutions. Rochester studies in economics and policy issues (Vol. 1). Springer. [Google Scholar] [CrossRef]
  38. Kang, W. Y. (2022). Internal Capital Budgeting and Allocation in Financial Firms. In C. F. Lee, & A. C. Lee (Eds.), Encyclopedia of finance. Springer. [Google Scholar] [CrossRef]
  39. Khajavi, S., Etemedy Jooriaby, M., & Kermani, E. (2024). Budgeting in healthcare. In T. Allahviranloo, F. Hosseinzadeh Lotfi, Z. Moghaddas, & M. Vaez-Ghasemi (Eds.), Decision making in healthcare systems. Studies in systems, decision and control (Vol. 513). Springer. [Google Scholar] [CrossRef]
  40. Khan, A. (2024). Capital budgeting and improvement process. In Fundamentals of public budgeting and finance. Palgrave Macmillan. [Google Scholar] [CrossRef]
  41. Kim, H. T., & Nguyen, Q. (2025). Managers’ risk preferences and firm investment: The moderating role of early-life war exposure and firm size. International Journal of Finance & Economics. [Google Scholar] [CrossRef]
  42. Kleibergen, F., & Paap, R. (2006). Generalized reduced rank tests using the singular value decomposition. Journal of Econometrics, 133(1), 97–126. [Google Scholar] [CrossRef]
  43. Lazim, N. A. M., Ariffin, S. H. S., & Khair, Z. (2025). Asia’s tiger economies and beyond: Project management views from Asian institutions. In Project management for European, Asian and African practitioners—Theory and technique examples in selected professions (pp. 185–214). Springer Nature. [Google Scholar] [CrossRef]
  44. Leitner, S. (2024). Corporate investment: Advancing theoretical perspectives using agent-based techniques. In F. Wall, S. H. Chen, & S. Leitner (Eds.), The Oxford handbook of agent-based computational management science. Oxford Academic. [Google Scholar] [CrossRef]
  45. Leon, F. M., Isa, M., & Kester, G. W. (2008). Capital budgeting practices of listed Indonesian companies. Asian Journal of Business and Accounting, 1(2), 175–192. [Google Scholar]
  46. Li, W., Li, W., Seppänen, V., & Koivumäki, T. (2023). Effects of greenwashing on financial performance: Moderation through local environmental regulation and media coverage. Business Strategy and the Environment, 32(1), 820–841. [Google Scholar] [CrossRef]
  47. Mollah, M. A. S., Rouf, M. A., & Rana, S. S. (2023). A study on capital budgeting practices of some selected companies in Bangladesh. PSU Research Review, 7(2), 137–151. [Google Scholar] [CrossRef]
  48. Mota, J., & Moreira, A. C. (2023). Capital Budgeting Practices: A Survey of Two Industries. Journal of Risk and Financial Management, 16(3), 191. [Google Scholar] [CrossRef]
  49. Nunden, N., Abbana, S., Marimuthu, F., & Sentoo, N. (2022). An assessment of management skills on capital budgeting planning and practices: Evidence from the small and medium enterprise sector. Cogent Business & Management, 9(1), 2136481. [Google Scholar] [CrossRef]
  50. Nurullah, M., & Kengatharan, L. (2015). Capital budgeting practices: Evidence from Sri Lanka. Journal of Advances in Management Research, 12(1), 55–82. [Google Scholar] [CrossRef]
  51. OECD. (2022). Financing SMEs and entrepreneurs 2022: An OECD scoreboard. Available online: https://www.oecd-ilibrary.org/sites/13753156-en/index.html?itemId=/content/component/13753156-en (accessed on 14 April 2024).
  52. Peel, M. J., & Bridge, J. (1998). How planning and capital budgeting improve SME performance. Long Range Planning, 31(6), 848–856. [Google Scholar] [CrossRef]
  53. Peterson, P., & Fabozzi, F. (2002). Capital budgeting: Theory and practice. John Wiley and Sons. Available online: https://www.wiley.com/en-au/Capital+Budgeting%3A+Theory+and+Practice-p-9780471218333 (accessed on 13 April 2024).
  54. Purnamasari, P., & Adriza. (2024). Capital budgeting techniques and financial performance: A comparison between SMEs and large listed firms. Cogent Economics & Finance, 12(1), 2404707. [Google Scholar] [CrossRef]
  55. Puwanenthiren, P. (2024). National development level effects on capital budgeting practices: A comparative study of nature vs nurture. PSU Research Review, 8(1), 227–247. [Google Scholar] [CrossRef]
  56. Quirin, G. D. (1967). The capital expenditure decision. Irwin, R.D. [Google Scholar]
  57. Rao, P., Kumar, S., Chavan, M., & Lim, W. M. (2021). A systematic literature review on SME financing: Trends and future directions. Journal of Small Business Management, 61(3), 1247–1277. [Google Scholar] [CrossRef]
  58. Ryan, P. A., & Ryan, G. P. (2002). Capital budgeting practices of the Fortune 1000: How have things changed. Journal of Business and Management, 8(4), 355–364. [Google Scholar] [CrossRef]
  59. Seddiki, B. (2025). Revolutionizing project control: Leveraging control theory for integrated cost, schedule, and risk management. Discover Civil Engineering, 2(1), 22. [Google Scholar] [CrossRef]
  60. Segelod, E. (1998). Capital budgeting in a fast-changing world. Long Range Planning, 31(4), 529–541. [Google Scholar] [CrossRef]
  61. Shields, J. F., Bilsky, B. A., & Shelleman, J. M. (2024). SMEs, Sustainability, and Capital Budgeting. Small Business Institute Journal, 20(1), 1–7. [Google Scholar] [CrossRef]
  62. Sureka, R., Kumar, S., Colombage, S., & Abedin, M. Z. (2022). Five decades of research on capital budgeting—A systematic review and future research agenda. Research in International Business and Finance, 60, 101609. [Google Scholar] [CrossRef]
  63. Sureka, R., Kumar, S., Mukherjee, D., & Theodoraki, C. (2023). What restricts SMEs from adopting sophisticated capital budgeting practices? Small Business Economics, 60(1), 265–290. [Google Scholar] [CrossRef]
  64. Verbeeten, F. H. M. (2006). Do organizations adopt sophisticated capital budgeting practices to deal with uncertainty in the investment decision? A research note. Management Accounting Research, 17(1), 106–120. [Google Scholar] [CrossRef]
  65. Vonlanthen, J. (2024). On the determinants of discount rates in discounted cash flow valuations: A counterfactual analysis. Real Estate, 1(2), 174–197. [Google Scholar] [CrossRef]
  66. Wang, S. Y., & Lee, C. F. (2021). A fuzzy real option valuation approach to capital budgeting under uncertainty environment. In C. F. Lee, & A. C. Lee (Eds.), Encyclopedia of finance. Springer. [Google Scholar] [CrossRef]
  67. Wolf, A. (2025). Public support for the roll-out of renewable hydrogen in Europe: A real options perspective. International Journal of Hydrogen Energy, 97, 1440–1452. [Google Scholar] [CrossRef]
  68. World Bank. (2024). Small and medium enterprises (SMEs) finance. Available online: https://www.worldbank.org/en/topic/smefinance (accessed on 20 February 2025).
  69. World Economic Forum. (2021). Five key insights on the future-readiness of SMEs. Available online: https://www.weforum.org/agenda/2021/12/5-key-insights-on-the-future-readiness-of-smes/ (accessed on 20 March 2025).
  70. Yu, J., Zhang, Z., Chen, X., & Boward, R. (2025). Mapping government budgeting research: A systematic literature review. International Journal of Public Administration, 1–16. [Google Scholar] [CrossRef]
Figure 1. Stages of the CB process. Source: (Authors, 2025).
Jrfm 18 00297 g001
Figure 2. Conceptual framework. Source: Authors, 2025.
Jrfm 18 00297 g002
Table 1. Sampled firms.
SMEsMNCs
IndustriesN%IndustriesN%
Agriculture, forestry, and fisheries7425.08Energy, oil, gas, and coal8027.11
Manufacturing5217.62Agriculture and plantation5920.00
Transportation and communication4816.27Real estate management and development4816.27
Construction4515.25Apparel and luxury goods4515.25
Wholesale and retail trade4314.57Food and beverages3311.18
Other services3311.18Media and entertainment3010.16
Total295100Total295100
Table 2. Research variables.
VariablesDiscussionEstimationTypesSymbolEffectSource
Sophisticated capital budgeting decisionsThe theoretical analysis of extant literature established that both SMEs and MNCs implement SCBDs in their investment appraisals.SCBDs of SMEs and MNCs are described and estimated through an index. Firms following SCBDs in their investment appraisals are assigned a score of ‘1’, and firms that do not follow SCBDs are assigned a score of ‘0’. The index value ranges from 0 to 590. A higher SCBD index value indicates the increasing use of SCBDs in investment appraisals.IndependentSCBDs±OECD, ADB, OECD, annual reports
Risk managementRisk management in sampled SMEs and MNCs is represented by evaluating their effectiveness in managing liquidity and solvency risks.Both liquidity and solvency risks are represented by two dummy variables. The dummy variable liquidity risk is estimated by the quick ratio (QR), which is used for analyzing the immediate ability of a firm to pay its short-term liabilities and measured by dividing a company’s most liquid assets, like cash, cash equivalents, marketable securities, and accounts receivable, by total current liabilities. Whilst SLR’s dummy is represented by Debt-to-Equity Ratio (DER) and it is estimated by dividing a firm’s total debt by its total equity. A higher DER implies the possibility of solvency risk.DependentQR, DER±OECD, ADB, OECD, annual reports
Financial performanceFollowing the extant literature review, FP is quantified through ROA and ROE dummies.ROA is evaluated by the ratio of earnings before tax divided by the total assets of the firm. A higher ROA ratio represents better FP, whereas a low ROA ratio implies reduced FP. Similarly, ROE is estimated by a ratio between profit after tax divided by the average core capital. A higher ROE ratio signifies an increase in FP, and a lower ROE ratio is an indicator of a reduction in the FP of a firm.DependentROA, ROE±OECD, ADB, OECD, annual reports
SizeThe extant literature indicates that the size of the firm may affect the CBDs; therefore, it is essential to include this as a control variable in the empirical analysis of this study.Size is measured by a dummy named SIZE, and it is evaluated by a ratio obtained by dividing the firm’s total assets by the average total assets of the respective industry of the firm.ControlSIZE±OECD, ADB, OECD, annual reports
SalesThis control variable is likely to influence the CBDs as well as the FP of firms.Sales are estimated by the dummy of annual growth in sales, represented by (SAL), and it is evaluated by the changes in real sales.ControlSAL±OECD, ADB, OECD, annual reports
Operational riskThis variable may influence the measurement of the RM variable; therefore, it is applied as a control variable. The operational risk (OPR) is represented by a proxy variable, and it is evaluated by the coefficient of changes in a firm’s income.ControlOPR±OECD, ADB, OECD, annual reports
Capital intensityThis control variable is found to influence the RM and FP of firms and may affect the findings related to the relationship between CBDs and FP.It is represented by a dummy of capital intensity ratio (CIR), and it is estimated by dividing a firm’s total assets by its total revenue. A higher CIR implies that a firm has a higher financial leverage, affecting the FP and RM of firms.ControlCIR±OECD, ADB, OECD, annual reports
Degree of focusFirms operating in a saturated industry with a large number of firms are likely to enjoy fewer financial benefits of CBDs, whereas firms operating in an industry with a smaller number of firms may enjoy more financial benefits of CBDs.It is represented by a DOF dummy, and it is estimated by the ratio of the number of industries in which the firm is operating, divided by the average number of segments for the firms in the same industry.ControlDOF±OECD, ADB, OECD, annual reports
Table 3. Descriptive statistics.
VariableMeanMedianMax.Min.SDSkewnessKurtosisJarque–BeraProbability
SCBDs318.4771.095900305.5540.5636.4738.450.001
LDR2.172.766.351.201.6181.1482.7512.1280.011
SLR1.181.379.573.521.2352.4704.3853.6510.001
ROA1.321.444.792.531.811.4082.1572.4750.001
ROE5.255.566.711.474.871.3482.4471.5230.001
SIZE35.6936.6477.8411.2422.5697.4179.62518.7490.001
SAL20.9818.3445.759.488.3949.49411.3948.4030.001
OPR6.496.957.481.391.4840.4540.5840.4940.000
CIR22.4923.2830.456.497.5895.3025.1392.4940.001
DOF3.293.226.371.390.8530.6631.1131.4840.001
Table 4. Correlation matrix.
VariablesSCBDsLDRSLRROAROESIZESALOPRCRIDOF
SCBDs1
LDR0.2341
SLR0.1480.1961
ROA0.3160.3910.3941
ROE0.2180.3210.3480.5531
SIZE0.3870.4900.4750.3740.3791
SAL0.4370.4700.2980.1840.1270.1421
OPR0.3990.1350.3960.1570.1510.3580.4841
CRI0.1550.1840.4640.1940.1040.4300.1850.3511
DOF0.4680.3710.2960.1930.3460.3970.1750.4780.3581
Table 5. VIF test results.
VariablesVIF1/VIF
SCBDs0.432.325
LDR0.511.960
SLR0.541.851
SIZE0.571.754
SAL0.581.724
OPR0.631.587
CRI0.681.470
DOF0.711.408
Mean VIF4.65
Table 6. Cross-sectional dependence results.
LDRSLRROAROESIZESALOPRCRIDOF
Cross-sectional independence0.5100.5210.4750.4320.7650.5480.4180.3080.284
Off-diagonal elements0.4140.2670.4120.3860.3650.4840.3580.2190.135
LDRSLRROAROESIZESALOPRCRIDOF
Cross-sectional independence1.3480.9470.7480.8940.5650.4740.6581.1070.660
Off-diagonal elements0.9280.7320.7130.7350.2940.1980.3890.1050.448
Table 7. Heterogeneity test.
ModelStatisticsCoefficientsp
LDRSlope0.6380.613
Adjusted slope0.7290.702
SLRSlope0.7400.711
Adjusted slope0.7340.690
ROASlope0.8030.781
Adjusted slope0.8110.784
ROESlope0.7290.698
Adjusted slope0.7190.706
Table 8. GMM regression analysis [output variables: FP and RM].
[ROA] [ROE] [LDR] [SLR]
Model (1)Model (2)Model (3)Model (4)Model (5)Model (6)Model (7)Model (8)Model (9)Model (10)
Lagged of dependent variables0.008 ***
(2.53)
0.012 ***
(1.74)
0.022 ***
(1.35)
0.019 ***
(2.85)
0.031 ***
(3.16)
0.006 *** (2.36)0.008 ***
(2.09)
0.011 ***
(1.68)
0.017 *** (2.74)0.021 *** (3.38)
LDR0.015 ***
(2.10)
0.023 **
(2.24)
0.009 *** (1.34)0.017 **
(1.32)
SLR 0.016 ***
(2.18)
0.015 **
(1.15)
ROA 0.018 *** (3.14)0.022 ** (2.44)0.027 *** (3.76)
ROE 0.032 ** (3.77)0.012 *** (3.80)0.020 *** (2.64)
Control variables
SIZE0.022 ***
(3.32)
0.027 ***
(3.65)
0.026 **
(3.57)
0.031 *** (4.01)0.018 *** (3.57)0.016 *** (3.43)0.018 *** (3.54)0.023 ** (3.25)0.021 *** (4.25)0.028 *** (3.47)
SALE0.018 ***
(2.68)
0.026 ***
(3.38)
0.038 **
(4.61)
0.013 ***
(1.86)
0.012 ***
(1.77)
0.027 *** (3.94)0.031 *** (3.87)0.029 ** (3.52)0.024 *** (2.47)0.032 *** (3.68)
OPR0.042 *
(5.55)
0.047 *
(6.06)
0.052 *
(6.28)
0.042 **
(4.90)
0.037 *
(3.81)
0.038 * (3.64)0.034 * (4.73)0.019 * (2.54)0.024 ** (2.52)0.014 * (2.45)
CRI0.047 ***
(4.95)
0.044 ** (5.52)0.015 ** (2.16)0.024 * (3.46)0.017 ** (1.40)0.058 *** (5.90)0.042 ** (4.16)0.056 ** (5.18)0.042 * (4.91)0.039 ** (5.22)
DOF0.010 ***
(1.21)
0.015 **
(2.47)
0.005 **
(1.18)
0.010 *
(1.12)
0.003 **
(1.18)
0.009 *** (1.06)0.014 ** (1.85)0.010 ** (1.65)0.018 * (2.74)0.022 ** (2.30)
Yearly effectYesYesYesYesYesYesYesYesYesYes
IndustryYesYesYesYesYesYesYesYesYesYes
R20.32740.24840.19830.11480.31450.20460.29760.24740.22510.2854
Adjusted R20.31840.43750.47230.34120.21420.48720.59810.40230.28710.3174
* Indicates 10% significance level. ** Indicates 5% significance level. *** Indicates 1% significance level.
Table 9. Robustness checks [output variables: TQ and CAR].
[TQ] [TQ] [CAR] [CAR]
Model (1)Model (2)Model (3)Model (4)Model (5)Model (6)Model (7)Model (8)Model (9)Model (10)
Lagged of dependent variables0.010 *** (2.80)0.011 *** (1.82)0.016 *** (2.41)0.018 *** (2.95)0.022 *** (2.66)0.013 *** (2.34)0.015 *** (2.50)0.008 *** (1.61)0.011 *** (1.55)0.020 *** (3.01)
CAR0.014 *** (1.90)0.032 ** (4.02)0.019 *** (2.64)0.031 *** (3.72)0.018 *** (2.77)
TQ 0.018 *** (2.32)0.007 ** (1.12)0.016 *** (1.84)0.019 *** (2.62)0.022 *** (3.97)
Control variables
SIZE0.020 *** (2.42)0.021 *** (3.23)0.025 ** (3.47)0.032 *** (4.31)0.028 *** (3.84)0.015 *** (2.45)0.023 *** (3.53)0.026 ** (3.87)0.024 *** (3.22)0.025 *** (3.24)
SALE0.028 *** (2.75)0.036 *** (3.92)0.018 ** (2.24)0.023 *** (2.56)0.002 *** (0.87)0.020 *** (3.45)0.031 *** (4.22)0.028 ** (3.09)0.029 *** (3.56)0.035 *** (1.27)
OPR0.032 * (2.61)0.037 * (3.96)0.042 ** (4.37)0.032 ** (3.89)0.027 * (2.70)0.021 ** (2.72)0.016 * (2.55)0.022 *** (2.99)0.041 ** (5.39)0.037 ** (4.70)
CRI0.037 *** (3.51)0.034 ** (4.41)0.025 ** (3.22)0.020 * (2.47)0.027 ** (2.60)0.035 *** (3.82)0.039 ** (3.21)0.024 ** (3.18)0.023 * (2.11)0.013 ** (1.90)
DOF0.011 *** (1.95)0.016 ** (2.87)0.008 ** (2.53)0.012 * (1.40)0.008 ** (1.01)0.017 *** (2.16)0.009 ** (1.44)0.014 ** (2.24)0.021 * (2.10)0.006 ** (1.11)
Yearly effectYesYesYesYesYesYesYesYesYesYes
IndustryYesYesYesYesYesYesYesYesYesYes
R20.57870.38790.40760.39170.42730.20460.29760.24740.22510.2854
Adjusted R20.44500.48780.52380.58130.55230.48720.59810.40230.28710.3174
* Indicates 10% significance level. ** Indicates 5% significance level. *** Indicates 1% significance level.
Disclaimer/Publisher’s Note: The statements, opinions and data contained in all publications are solely those of the individual author(s) and contributor(s) and not of MDPI and/or the editor(s). MDPI and/or the editor(s) disclaim responsibility for any injury to people or property resulting from any ideas, methods, instructions or products referred to in the content.

