Article

How Do Segment Disclosure and Cost of Capital Impact the Investment Efficiency of Listed Firms in Nigeria?

Department of Accountancy, College of Business and Economics, University of Johannesburg, Johannesburg 2006, South Africa
*
Author to whom correspondence should be addressed.
J. Risk Financial Manag. 2025, 18(5), 258; https://doi.org/10.3390/jrfm18050258
Submission received: 21 November 2024 / Revised: 19 April 2025 / Accepted: 22 April 2025 / Published: 9 May 2025

Abstract

:
The demand for improved segment disclosure is driven by the need to address investment inefficiencies and boost investors’ confidence in listed companies around the world. Transparency in corporate activities is essential for investors to determine the parameters of their stock return and investment efficiency across various segments of firms. Previous studies have primarily focused on a broader investment landscape in Nigeria, without paying adequate attention to the impacts of segment disclosure and cost of capital on the investment efficiency of listed firms. Against this backdrop, this study represents the first empirical research to examine the joint impact of segment disclosure and cost of capital on the investment efficiency of listed firms in Nigeria. Using a longitudinal research design, secondary data from 2015 to 2022 were extracted from the annual reports of 85 listed firms on the Nigerian Exchange Group (NGX). The data were analysed through descriptive and inferential statistical methods. Firms that reported their business or geographic segments were purposively selected for this study. The findings show that the cost of capital of the examined firms has a negative and significant impact on their investment efficiency (coefficient = −0.0268, p-value = 0.03079). On the other hand, the segment disclosure of the firms has a positive impact on their investment efficiency (coefficient = 0.0119, p-value = 0.0303). Lastly, total segment disclosure and cost of capital jointly have positive and significant effects (coefficient = 0.0192, p-value = 0.0030) on the investment efficiency of the firms. This study contributes to the growing research on segment disclosure by providing evidence that increased segment disclosure and a lower cost of capital can improve the investment efficiency of listed firms in Nigeria. Thus, this study recommends that the management of firms in Nigeria should disclose more segment information in their annual reports. This could consequently boost investors’ confidence in the reporting practices of firms, reduce the cost of capital of firms, and improve firms’ investment efficiency.

1. Introduction

Investment inefficiency among listed firms tends to raise concern about their profitability, growth, and long-term success (Revsine et al., 1999; Alsayegh et al., 2022; Assad et al., 2023). This is because the separation of ownership in listed firms often results in managers possessing exclusive information, which they might conceal from investors. When this happens, investors may not have enough information to evaluate the probable risks and anticipated returns on their investments (Khan et al., 2024). This information gap might make investors perceive significant risks and refrain from investing in a firm. As a result, firms often turn to debt financing rather than equity financing, ultimately leading to a high cost of capital and investment inefficiency.
Investment efficiency is the effective allocation and utilisation of resources for viable or profitable capital projects (Blanco et al., 2015; Ardianto et al., 2023). This concept is seen as a determining factor of the risk, cost, and overall profitability of an investment, as risks and returns are intervening parameters for measuring the investment efficiency of firms (Biddle et al., 2009). While it is imperative for determining the growth of the firms, managers still find it difficult to balance risks and returns in their approach to taking investment decisions (Biddle et al., 2009; Al-Hadi et al., 2017). Based on this complexity involved in the investment decision process, it is important for managers to select profitable projects that would reach an optimal investment level, specifically devoid of over-investment or under-investment. Therefore, an investment that is worthwhile is one with a higher anticipated yield compared to the cost of capital of the firm (Blanco et al., 2015; Agoraki et al., 2024).
Cost of capital (CoC) is also essential in the investment evaluation process of firms. This is because an investment is considered viable if the anticipated yield on the capital invested is greater than the CoC (Blanco et al., 2015; Cho, 2015; Akinlo & Sule, 2019; Sule, 2025a). Studies have shown that a reduced CoC offers firms diverse alternatives to fund their projects from external sources rather than internal sources or cash flow. This could translate into real opportunity to engage in diverse projects that will generate value (Abbas et al., 2018). In developing economies, including Nigeria, the capital market is marked by a high CoC (Adeyemi & Oboh, 2011; Lucky, 2017; Uremadu & Onyekachi, 2019). Consequently, firms in Nigeria rely on short-term loans for funding projects due to limited access to equity capital. This financial strain might make investors perceive significant risks, which could diminish their interest in purchasing the firms’ shares due to the concerns that earnings will be diverted to debt repayment rather than dividends.
Investors’ loss of confidence in the growth prospects of firms has thus been attributed to inadequate disclosure practices of firms (Revsine et al., 1999; Al-Hadi et al., 2017). Major fraud involving big firms like Enron and Lehman Brothers has affected investor confidence in the disclosure practices of firms (Moncarz et al., 2006; Schwarcz, 2023). As innovations in global business and technology advance, investors need comprehensive and transparent information about firms’ financial performance and business segment to make informed decisions. However, in Nigeria, there has been a growing concern over the inadequate disclosure practices of managers of firms, consequently impacting their performance in the stock market (Opara, 2017; Sule, 2025a).
Empirical findings on segment disclosure in Nigerian companies have largely focused on the determinants of segment disclosure (Odia, 2018; Sule, 2025b), capital market and investment efficiency (Adelegan, 2009; Ajide, 2017), and the impact of segment disclosure on investment efficiency (Sule, 2025a). However, there is a lack of research examining the combined impact of segment disclosure and cost of capital on the investment efficiency of firms in Nigeria. Some extant studies have explored the disclosure practices of firms and their impact on CoC and governance (Yahaya, 2024; Shittu & Che-Ahmad, 2024), but not on the investment efficiency of firms. Other strands of the literature have documented that Nigerian firms often lack transparency in their disclosure practices, yet the impact on investment efficiency remains unexamined (Adeyemi & Fagbemi, 2010; Akinlo & Sule, 2019). In addition, most studies on the benefits of segment disclosure have focused on developed countries, leaving a gap in understanding emerging markets like Nigeria (Blanco et al., 2015; Elberry, 2018; Elsayed et al., 2019). This study aims to bridge these gaps by providing empirical evidence from Nigeria, focusing on how segment disclosure and cost of capital collectively affect the investment efficiency of firms in a high-information-asymmetry market environment. This study also contributes methodologically by utilising longitudinal data from 2015 to 2022, which introduces robust empirical evidence across different sectors in Nigeria. This addresses the limitations of smaller or non-diversified samples in extant studies.

2. Conceptual Review

2.1. Segment Disclosure

Segment disclosure (SD) is defined in the accounting literature as the process of providing economic information about the financial and non-financial activities of firms’ business and geographic segments to investors (Owusu-Ansah, 1998; Shehata, 2014; Botosan et al., 2021). Within this framework, SD emerges as a crucial part of the economic information of firms. It plays an indispensable role in firms’ valuation by providing critical signals that guide capital investment decisions (P. Chen & Zhang, 2003; Elberry, 2018; Gao & Sidhu, 2018; Gisbert et al., 2024). Over the years, users of financial statements, academics, and standard setters have heightened their focus on how firms disseminate information about their operating segments. This is especially important given that there are divergent levels of profitability and growth across different segments within a firm. By understanding segment-specific dynamics, stakeholders can make more informed decisions.
As defined in International Financial Reporting Standard 8 (IFRS 8, 2007), an operating segment is a constituent of a firm that generates revenues and incurs expenditure. Consequently, such a constituent is categorised as a reportable segment only if its revenue or loss accounts for 10 percent or more of its total revenue or loss. An increase in business expansion and diversification, coupled with the demand for transparency from investors, has necessitated revision of former IAS 14 and the consequent application of IFRS 8. The motivation for implementing IFRS 8 was that stakeholders should also have information about the internal operation of firms that managers use in allocating resources to different segments (Mateescu, 2016; Mardini et al., 2023).
IFRS 8 mandates listed firms to disclose economic information, such as its major products, the geographical area in which it operates, management’s assessment of internal control systems, and their main customers. Empirical findings have established that embracing these standards provides an array of benefits (Berger & Hann, 2003; Shehata, 2014; Elberry, 2018). It helps the assessment of firms by stakeholders who continuously demand disaggregated information about business and geographic segments of firms, because growth, opportunities, and risk vary across segments (P. Chen & Zhang, 2003). Also, SD reduces the level of information discrepancies between managers and stakeholders, particularly investors (Botosan, 1997; Cai et al., 2024). This, therefore, reduces a firm’s cost of raising capital and sensitivity to cash flow (Healy & Palepu, 2001; Botosan & Stanford, 2005). It reduces the efforts of shareholders in monitoring the activities of managers and thereby boosts investment efficiency (F. Chen et al., 2011; Biddle & Hilary, 2006). Furthermore, SD decreases the cost of raising capital from external sources, which, in turn, lessens the volatility of investments to cash flows as engendered by internal activities and eventual under-investment problems (Hope & Thomas, 2008). It also enables shareholders to investigate managers’ investment decisions that may sometimes result in unwanted over-investment (Biddle et al., 2009). Consequently, segment information is useful in discovering and discouraging investment choices that do not advance the value of firms (Blanco et al., 2015).
In contrast, firms that disseminate inadequate segment information tend to fund their projects with funds derived or generated internally. This is because these categories of firms see internal funds as a cheaper financial alternative, and such firms may not be able to expand and compete globally. Therefore, comprehensive SD is important not only for transparency and accountability but also for sustainability and growth in a rapidly evolving and competitive business environment.

2.2. Investment Efficiency

Investment efficiency can be defined as a situation in which firms implement all or part of a project that is considered worthwhile (Biddle et al., 2009). This implies that only projects with a positive Net Present Value (NPV) are considered viable. This perspective is in tandem with the position of Biddle et al. (2009), who posited that investment efficiency is the measure of skewness from anticipated investment yields, adopting a model which expresses investment as a determinant of growth prospects. Thus, a negative skew from the anticipated return is considered under-investment, while on the contrary, a positive skew is viewed over-investment. In relation to CoC, Blanco et al. (2015) argue that an investment is considered viable if the anticipated yield on the capital invested is greater than the cost of financing it. Thus, an investor can filter out unviable investments, given a series of investment opportunities to optimise profit and enable the resourceful apportionment of capital in the economy (P. Chen & Zhang, 2003; Lathief et al., 2024).

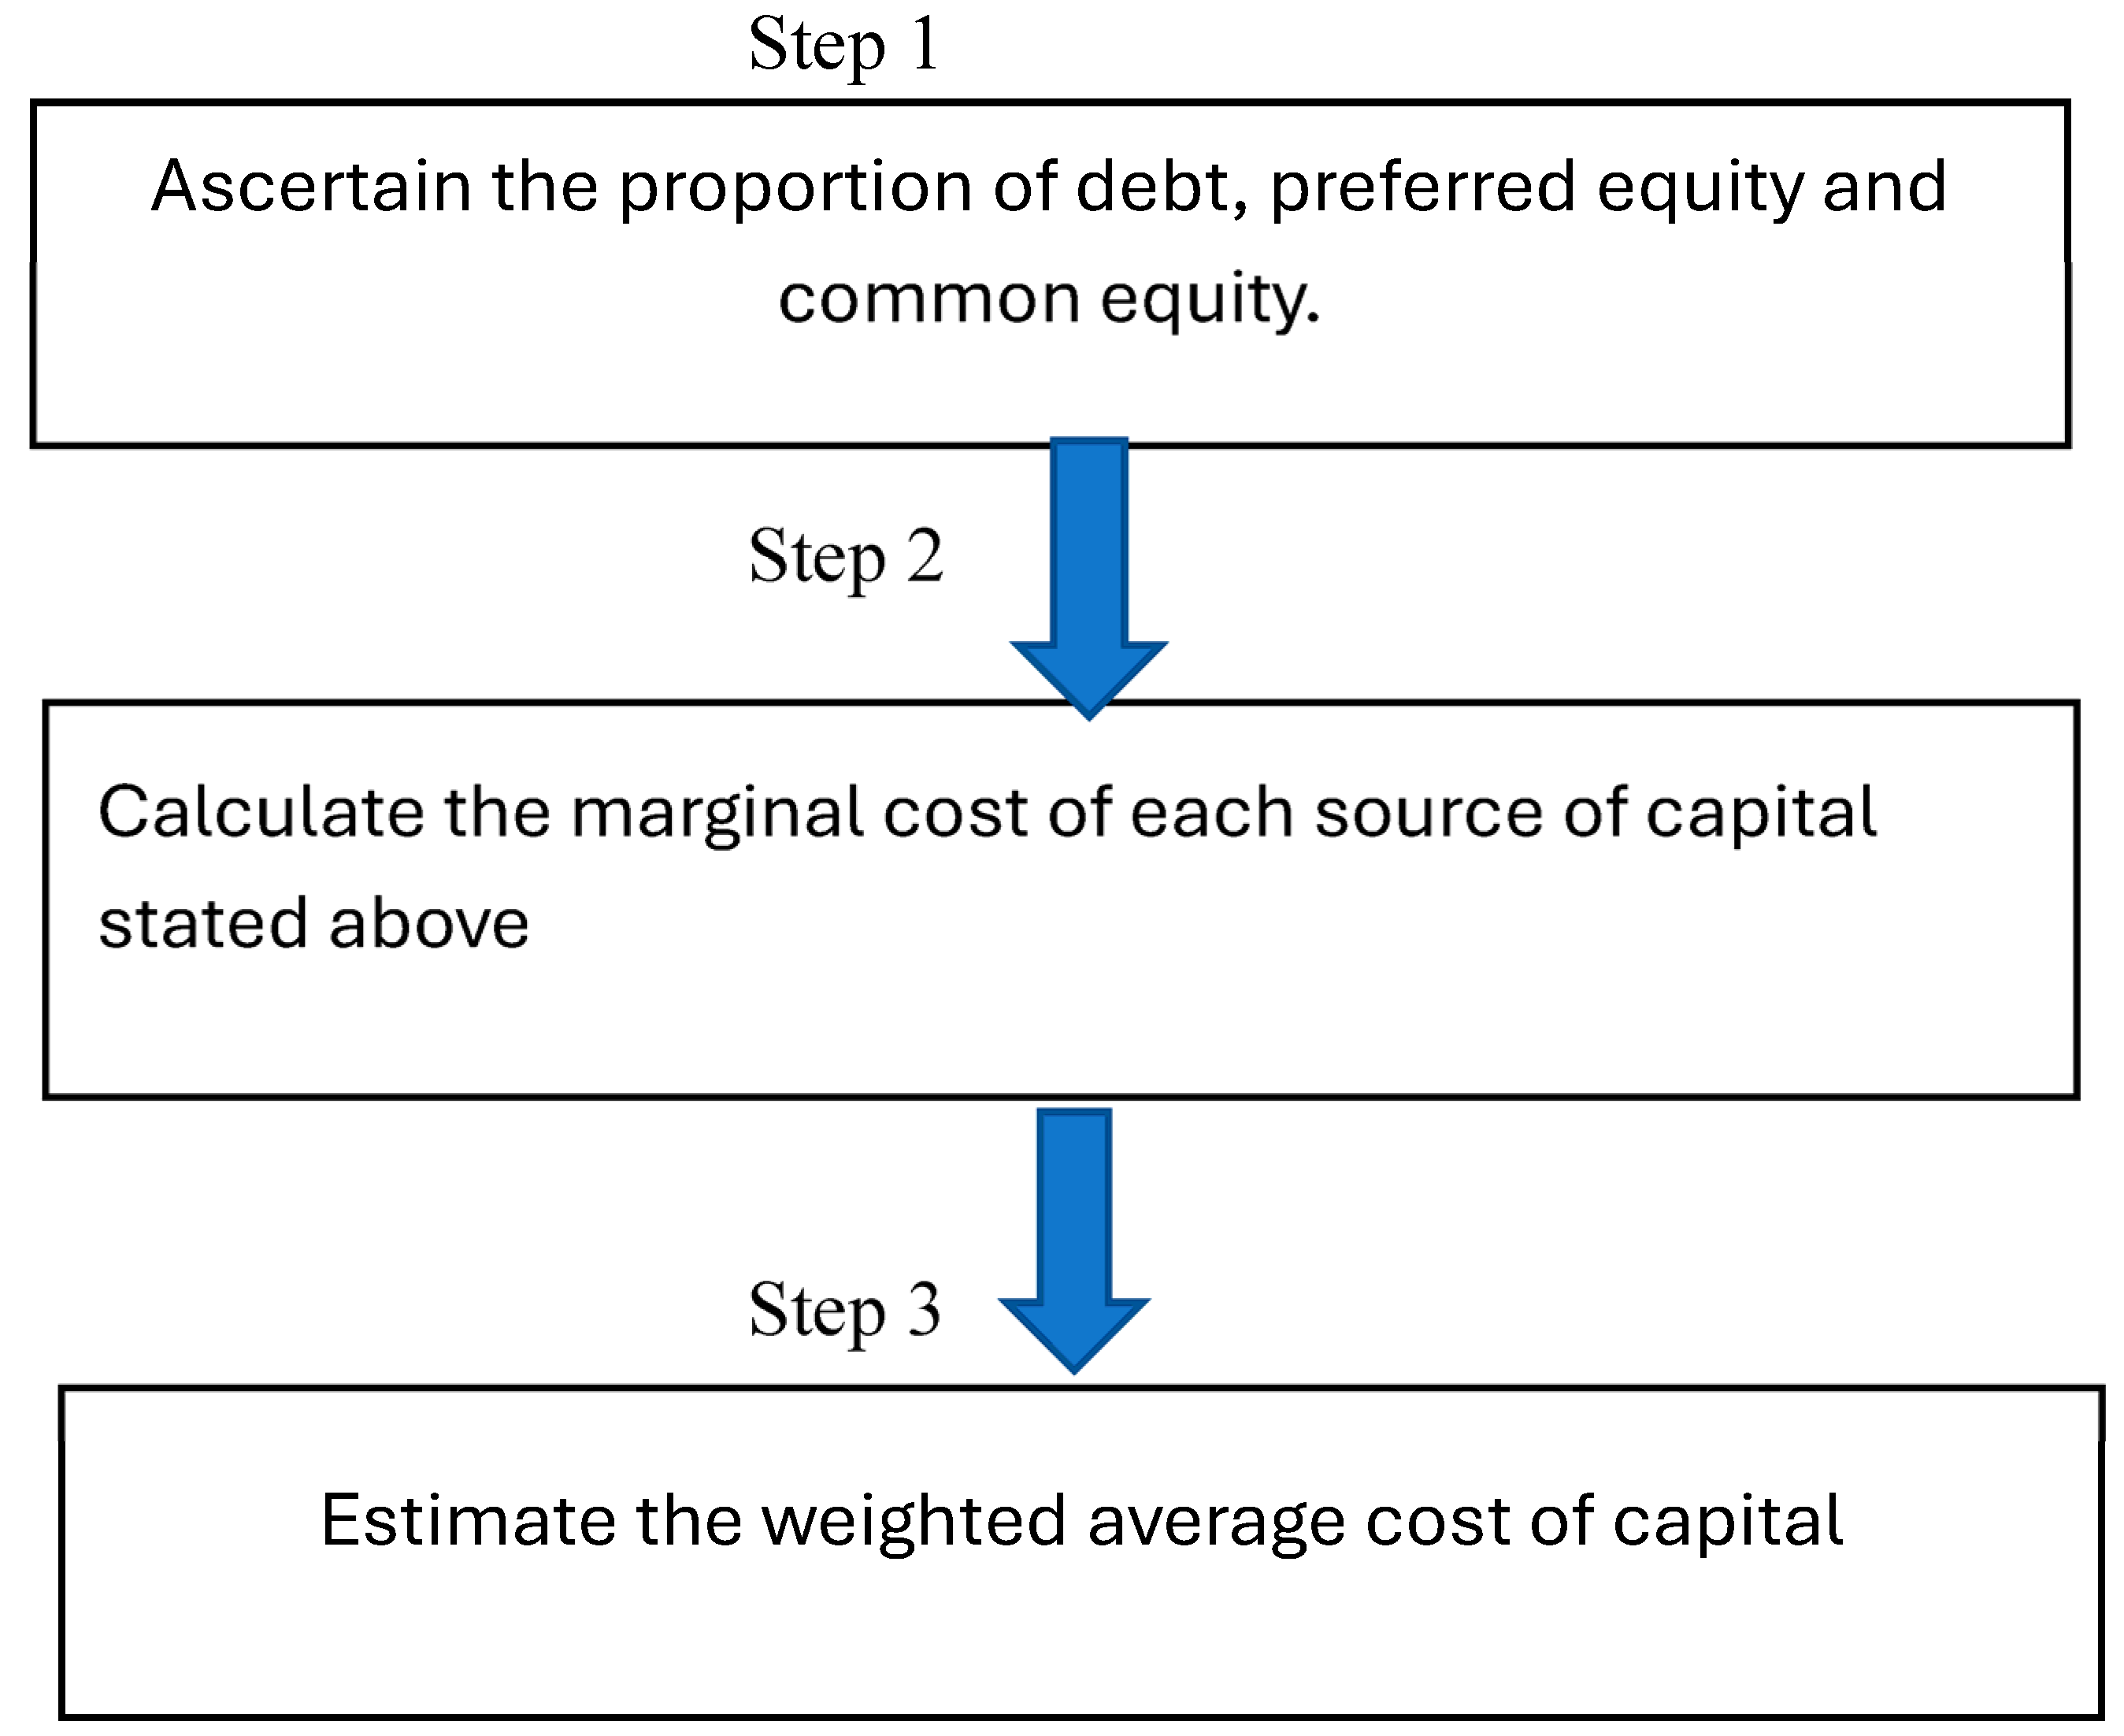
2.3. Cost of Capital

The cost of capital (CoC) is the minimum yield that investors demand for providing capital to a firm (Akinsulire, 2006). This metric is indispensable in corporate decision making and valuation. Also, it influences investment decisions and determines a firm’s growth potential, cash flow stability, and overall value creation (Domantas, 2010). According to Drake (2010), it is a firm’s cost of acquiring capital or funds from creditors and shareholders. Adequate knowledge of the capital blend of firms through financial reports decreases investors’ pessimism regarding the future prospect and profitability of firms. It is therefore logical and reasonable for firms to determine the proportion of their capital mix. Figure 1 displays the steps that can be taken by firms to ascertain their capital mix.

3. Empirical Review

3.1. Extent of Segment Disclosure

Managers serve as custodians of segment information, and their discretion to disclose this information significantly impacts disclosure practices. Studies have revealed that agency and proprietary costs are two main determinants of the rate at which segment information is made available by managers (Prencipe, 2004; Botosan & Stanford, 2005; Bova et al., 2024). Beneath agency intention, managers are inclined to conceal segment information to accomplish selfish motives, leading to selective disclosure, which, one way or the other, tends to defeat the monitoring ability of investors or shareholders (Bens et al., 2011; Aboud & Diab, 2018).
In consonance, Bhattacharya et al. (2022) documented that companies with high proprietary and agency costs seldom comply with disclosure regulations. This is because when potential disclosure could lead to high proprietary costs, managers would prefer to conceal such information (Bhattacharya et al., 2022). Given evidence from multinational companies, Leung and Verriest (2019) posited that managerial incentives, strategic considerations, and proprietary costs influence the disclosure choices of firms.
Other researchers corroborated this view as they revealed that managers often conceal segment information regarding under-performing segments because of agency and proprietary cost (Berger & Hann, 2007; Aboud & Roberts, 2018). This assertion was further given credence by Hope and Thomas (2008) when they opined that firms that tend to conceal segment information regarding their foreign segments do so when such investment is not viable. Given a different perspective, Aboud and Diab (2018) revealed that the reaction of investments to the accessibility of internally generated cash flows is another determinant of SD.
Furthermore, Botosan and Plumlee (2002) investigated managers’ intention to conceal segment information and the consequent effect on analysts’ information environment using stipulated mandatory disclosure requirements in SFAS No. 131. They examined why managers conceal segment information for selected firms that initially reported having single segments. According to them, these categories of firms have tendencies to under-disclose, and analysts will benefit if they are mandated to disclose full segment information. The results revealed that firms might choose to under-disclose to protect profits and avoid competitive harm. However, this strategy can create the perception that the firms are underperforming, potentially allowing their competitors to outshine them in the long run. Furthermore, Cho and Seo (2024) found that disaggregated segment information can improve the observability of managerial actions in internal capital markets and therefore increase implicit incentives for managers to allocate resources as desired by shareholders.

3.2. Segment Disclosure and Cost of Capital

There is a continuous argument in the literature about whether segment disclosure (SD) decreases the cost of capital (CoC) of firms around the world. Many empirical findings provide consistent evidence, with previous studies leading to increased certainty regarding the negative relationship between CoC and SD (Hail, 2000; Mardini et al., 2013; Moldovan, 2015; He et al., 2019). Given the expected negative association between SD and CoC, it is anticipated that the advantages of SD, in terms of the reduced cost of financing, are imperative.
He et al. (2019) examined the link between the CoC of firms and voluntary and mandatory disclosures. Their study is different from previous studies because it further segmented mandatory disclosure into recurring and event-driven disclosure, with a view to profoundly analysing the impact of mandatory and voluntary disclosure on CoC.
Similarly, Hann et al. (2012) documented that multi-segment firms experience reduced CoC, because these firms disseminate more segment information based on business and geographic levels of diversification. According to them, diversified firms tend to provide more segment information compared to stand-alone firms. They also investigated whether organisational arrangement affects firms’ CoC. Differing from conventional views, they affirmed that the likelihood of co-insurance among firms’ segments can mitigate systematic risk via the evasion of recurring deadweight expenditure. They found that multi-segment firms usually have a lower cost of financing compared to a number of stand-alone firms.
Lopes and Alencar (2010) compared disclosure level in a high disclosure environment like the United States (US) to a low-disclosure environment like Brazil based on the impact of disclosure on the CoC of firms in Brazil. They estimated that the connection between disclosed information and CoC as explained in extant studies can be ascribed to the increased level of mandatory disclosure, which is prevalent in the US but not in developing countries. Using a self-developed Brazilian Disclosure Guide to measure the level of disclosed information and Price Earning Growth ratio based on Easton (2004), they measured the CoC, using the Capital Asset Pricing Method (CAPM), of the observed firms. Their findings revealed that disclosure is greatly associated with CoC for Brazilian companies. Brazil presents higher standard deviation compared to other countries observed in the study, with a value of 17.11, while the mean difference was 7.09. Their study therefore concluded that the findings are evidently significant for companies with less analyst monitoring and minimal ownership attention.
In the Nigerian context, Ganiyu et al. (2019) delved into capital mix and firms’ performance. The study advanced the relationship between CoC and firms’ performance from a different viewpoint by considering the influence of agency relationship and debt financing, which deviates from most studies that only considered the monotonic relationship in terms of the impact of capital mix and firms’ performance. Based on the factors introduced, the study used the Generalized Method of Moments to estimate the data extracted from 115 non-financial firms listed on the NGX. They revealed that firms in Nigeria rely on short debt financing to boost capital and this limits their financial performance and investment exploration capacity.

3.3. Segment Disclosure, Cost of Capital, and Investment Efficiency

Improved SD has been shown to reduce CoC by diminishing the estimation risk and information gap while also enhancing investment efficiency (Blanco et al., 2015). According to Andre et al. (2016), SD provides signals that guide capital investments by highlighting profitability variations across segments. A study by Abbas et al. (2018) revealed that quality SD significantly lowers costs of equity capital among listed companies. In consonance, Sule (2025a) revealed that segment disclosure can improve the investment efficiency of firms and recommends that listed companies in Nigeria should disseminate more disaggregated information to investors who would in turn have the necessary information to provide oversight functions in the investment decision process of firms.
Furthermore, enhanced disclosure quality correlates with positive economic outcomes, such as improved investment decisions (Peláez, 2010). However, Bushman and Smith (2001) argue that transparency enhances investment efficiency primarily when agency conflicts are absent. In consonance, Cai et al. (2024) explore how segment disclosure policies affect diversification, cost of capital (CoC), and investment decisions in Australian firms. They documented that increased segment disclosure does not necessarily culminate in a lower cost of capital; rather, a high signal quality tends to lower the cost of capital of firms.
Despite the recognised impact of SD on CoC and investment efficiency, academic research exploring this phenomenon remains diverse and inconclusive. Some research has focused on the relationship between investment efficiency and SD (Cho, 2015; Elberry, 2018; Gao & Sidhu, 2018; F. Chen et al., 2011). Some others have explored the impact of SD on CoC (Blanco et al., 2015; Saini, 2010). Scholars in developed countries like Basu et al. (1999) and F. Chen et al. (2011) have provided insights into firms’ financial reporting practices and investment efficiency. This relationship is well documented in developed economies but requires further exploration in developing contexts like Nigeria. This study, therefore, investigates the relationships between SD and CoC and how they affect the investment efficiency of listed firms in Nigeria.

4. Theoretical Underpinning and Hypothesis Development

4.1. Signalling Theory

Investment inefficiency can trigger a high CoC for firms, as investors may request higher returns to mitigate potential risks (Majeed et al., 2018). To mitigate the CoC, firms must disclose adequate information, particularly in each segment. Extant studies have used several theories to explain the link between the investment efficiency and SD of firms. These theories include, but are not constrained to, agency theory, information asymmetry theory, stakeholder theory, and signalling theory (Komara et al., 2020). The most suitable theories for this study, based on the reviewed literature, are agency and signalling theories. These theories provide theoretical background and elucidation on why firms disclose their investment values and prospects to investors to make informed investment decisions.
Signalling theory postulates that firms deliberately send signals about their plans to investors to avoid information asymmetry (Yasar et al., 2020). These deliberate signals are sent to investors to bridge information gaps between the management who have more information and investors who have less information. By strategically disseminating segment information, firms can signal their growth potential across different business and geographic segments. For instance, if a firm sends positive information about a particular segment, it signifies good management practices, making investors understand and exploit the prospect of the firm’s low-risk investment profile. On the other hand, a negative signal may imply a high-risk investment profile and consequently undermine investing in the firm. Therefore, signalling provides an opportunity for investors to make informed decisions given the perceived value of the firm. This will consequently reduce the CoC of firms as investors are not likely to demand high returns for capital provided if their risk profile is low. By providing adequate SD, firms can boost their credibility and reduce anticipated risks that relate to their business operations. Firms can gain investors’ trust with positive reporting practices and potentially lower their CoC and improve investment efficiency through signalling (Svetek, 2022).

4.2. Agency Theory

This theory was propounded by Jensen and Meckling (1976). This theory posits that divergence of interest arises between managers and investors as managers tend to advance their interests over investors’ interests (Meiryani et al., 2023). An agency relationship exists between managers and investors because investors do not participate in the daily activities of firms. The obligation of the day-to-day activities of a firm rests with the managers. Once shareholders have invested their capital in firms, self-centred managers may take decisions that would give them more incentives, thereby expropriating investors’ resources (Botosan & Plumlee, 2002). The misalignment of interest between managers and investors tends to culminate into inefficiencies in investment decisions, which can only be mitigated by adequate SD (Botosan & Stanford, 2005). Therefore, from the perspective of agency theory, it could be argued that adequate SD potentially reduces CoC and boosts investment efficiency. Against this backdrop, the proposed hypotheses for this study are as follows:
H1. 
There is a positive relationship between segment disclosure and investment efficiency.
H2. 
There is a negative relationship between cost of capital and investment efficiency.

5. Methodology

A total of 85 listed companies were purposively selected for this study. To ensure broad sectoral representation, the firms were selected from 12 major sectors. These sectors include Agriculture, Construction, Consumer Goods, Financial Services, Healthcare, Industrial Goods, Information and Communications Technology, Natural Resources, Oil and Gas, Services, Utilities, and Conglomerates. Economic data on the cost of capital, investment efficiency, and other control variables were sourced from the annual reports of firms listed on the Nigerian Exchange Group (NGX). The firms were selected based on the availability of information about their geographic and business segments throughout the sample period, as well as the consistent trading of their shares on the capital market. The analysis spanned from 2015 to 2022, utilising secondary data and a longitudinal research design. Both descriptive and inferential statistics were applied, including pooled OLS, fixed effects, and random effects estimators. The suitability of these methods was evaluated using the Hausman test, while the t-test was employed to determine the impact of SD and CoC on the investment efficiency of the selected firms.
A total of 42 disclosure items adapted from Mardini et al. (2013) and Blanco et al. (2015) were used to determine the total segment disclosure (TSD) of the firms. Mandatory segment disclosure (MSD), voluntary segment disclosure (VSD), and total segment disclosure (TSD) were calculated using the formulas below:
M S D = i = 1 m m s d i m
V S D = i = 1 p v s d i p
T S D = i = 1 n t s d i n

Model Specification

To determine the investment efficiency of the firms, this study regressed total segment disclosure (TSD), cost of capital (CoC), and other control variables on investment efficiency (INV_EFF).
The model for this relationship is therefore expressed below:
I N V E F F i t = β 0 + β 1 T S D i t + β 2 C O C i t + β 3 T S D C O C i t + β 4 S i z e i t + β 5 T A N G i t + β 6 c a s h f l i t + β 7 M T B i t + β 8 g r o w t h i t + β 9 P r o f i t + β 10 A g e i t + ε i t
The model stated above was adapted from Biddle et al. (2009).
Here, TSDit denotes total segment disclosure (SD) by firm in year i over period t.
INV-EFF is the investment efficiency of firms. CoC is the cost of capital, Sizeit stands for the size of the firm, cashfl is cash flow, Tang is the tangibility of firms, Prof is the profitability of firms, and MTB is the market-to-book ratio.
Table 1 presents the measurement methods for the variables examined in the study. It includes the formulas used to measure the main variables such as total segment disclosure, investment efficiency, cost of capital, and control variables.

6. Findings and Discussions

6.1. Descriptive Statistics

Table 2 presents the descriptive statistics of all of the variables examined in 85 listed firms on the NGX from 2015 to 2022, which culminated in 680 firm-year observations. A total of 42 disclosure items adapted from Mardini et al. (2013) and Blanco et al. (2015) were used to assess the TSD of firms. TSD (total segment disclosure) represents the addition of mandatory and voluntary disclosure of firms from 2015 to 2022. The mean, minimum, and maximum values for TSD, as presented in Table 2, are 18.18, 13.00, and 24.00, respectively. If these values are compared to the total disclosure index (42) used to assess the extent of SD in the study, it is evident that the disclosure level of firms is low, given the mean value of 18.18. The age distribution of the firms ranges from a minimum of 1 year to a maximum of 60 years. This implies that some of the firms have been operating for many years, while others are relatively new. This gives further credence to the difference in the extent of SD by firms as researchers have posited that older firms disclose more segment information since they tend to expand their business, based on their years of operation. Furthermore, the average firm size is 18.78 billion. The firm with the smallest size is worth 5.76 billion, while the biggest firm is worth 35.5 billion, and their SD is 9.40. This denotes that the sample comprises big and small firms as the SD showed a wide disparity among the size of the firms. Furthermore, Table 2 reports the mean investment efficiency of the firms as 0.3367, the minimum as 0.0700, and the maximum as 0.4700. This result implies that the level of investment efficiency of the examined firms can be considered low. This is because a mean of 0.33 imply that only 33% of the firms exhibit efficient investment behaviour while 67% show inefficiencies. This suggests sub-optimal capital allocation (Anwar & Malik, 2020). The MTB of firms on average is 0.88, the maximum is 3.45, and the minimum is 0.20. This means that the stock price of the observed firms is high. Also, the average tangibility of firms is 0.29, while the minimum tangibility of firms is 0.15, and the maximum value of 0.46. This result implies that the examined firms are potentially sensitive to cashflow fluctuations.

6.2. Correlation Matrix Analysis

Table 3 presents the pairwise correlation matrix of the effects of SD and CoC on the investment efficiency of firms. This revealed the kind of association that exists among the dependent variable which is INV_EFF and the independent variables which are CoC, TSD, PROF, SIZE, GROWTH, TANG, MTB, CASHFL, and AGE. The correlation between investment efficiency and CoC is −0.24 (significant at 5%). This implies that CoC has a negative relationship with investment efficiency. In contrast, there is a positive and significant association (Corr = 0.1512, p-value = 0.0001) between investment efficiency and TSD.
Also, profitability showed a positive (0.1269) and significant (0.0009) correlation with investment efficiency. Furthermore, there is a positive and insignificant correlation between investment efficiency and size (Corr = 0.0235, p-value = 0.5402). However, growth and tangibility exhibit a positive and significant correlation with investment efficiency (corr = 0.0512, p-value = 0.0182; corr = 0.0293, p-value = 0.0445, respectively). Similarly, Market-to-book ratio and cash flow are positively and significantly correlated with investment efficiency (corr = 0.0639, p-value = 0.0960 and corr = 0.2619, p-value = 0.0000, respectively). Lastly, AGE is positively but not significantly connected with investment efficiency. This study also presents the variance inflation factors (VIFs) for the variables to check for multicollinearity. The results of the VIF test range from 1.06 to 2.51, which is far below the standard threshold of 5.

6.3. Effect of Segment Disclosure and Cost of Capital on Investment Efficiency

Based on the results in Table 4, the Hausman test yielded a p-value of 0.865 for fixed effects. Since this p-value exceeds the 0.05 threshold, this study opted for the results of the random effect estimation method. The findings from the random effect method indicate that CoC has a negative and statistically significant effect on investment efficiency (coefficient = −0.0268, p-value = 0.03079). This validates Hypothesis 2 by showing that a lower cost of capital will help firms to attain a favourable level of investment. Therefore, managers must prioritise lowering the cost of capital by disseminating more segment information to boost investor confidence in their reporting practices. This result finds support in the studies of Blanco et al. (2015), Biddle et al. (2009), and Elberry (2018). Furthermore, the total segment disclosure (TSD) of the firms examined showed a positive and significant impact on their investment efficiency (coefficient = 0.0119, p-value = 0.0303). This finds support in previous studies conducted by Sule (2025a) and Balakrishnan et al. (2014) which documented that increased SD enhances investment efficiency by providing investors with more information to make management accountable for their investment decisions. It is therefore essential that policy makers continue to mandate and incentivize segment disclosure in listed firms. Furthermore, total segment disclosure and cost of capital jointly have positive and significant effects (coefficient = 0.0192, p-value = 0.0030) on the investment efficiency of firms. This outcome infers that higher segment disclosure coupled with a reduced cost of capital will improve the investment efficiency of firms.
In contrast to many previous studies, profitability, which is a control variable, exhibited a negative and significant effect (coefficient = −0.0126, p-value = 0.0001) on investment efficiency. This indicates that for the firms observed, an increase in profitability did not translate into improved investment efficiency. This could indicate that highly profitable firms may engage in over-investment, culminating in investment inefficiencies. Managers must re-examine profitability and investment strategies to ensure that only projects with viable returns are implemented.
Furthermore, firm size showed a positive and significant effect on investment efficiency (coefficient = 0.004274, p-value = 0.0835), suggesting that larger firms are better positioned to invest optimally. This finding is consistent with Sule (2025b) conclusion that larger firms tend to achieve more efficient investments. Growth also displayed a positive and significant correlation with investment efficiency (coefficient = 0.025811, p-value = 0.0272). This implies that an increase in the growth rate of firms contributes positively to their investment efficiency, corroborating earlier findings that suggest that growth enables firms to diversify and invest in viable projects (Nagar et al., 2003). In terms of tangibility, the analysis revealed a negative and insignificant relationship with investment efficiency (coefficient = −0.025731, p-value = 0.2539).
Furthermore, the findings reveal that MTB positively impacts investment efficiency, but the effect is not significant (coefficient = 0.003543, p-value = 0.2583). In contrast, cash flow positively (coefficient = 0.08035) and significantly (p-value = 0.0016) impacts the investment efficiency of firms. In terms of economic significance, this implies that improved cash flow provides capital for firms to engage in diverse capital projects that would add value to them. This finds support in the study of Huang and Tarkom (2022). Lastly, the age of the firms showed a positive (coefficient = 0.0097) and significant (p-value = 0.0571) relationship with investment efficiency. This implies that older firms tend to have more capital for investment purposes compared to younger firms. This finding is corroborated by the findings of Blanco et al. (2015).

7. Conclusions

This study found that there is a positive and significant relationship between the SD of the observed firms and their investment efficiency. In contrast, CoC negatively impacts the investment efficiency of the sampled firms. Lastly, total segment disclosure and cost of capital jointly have positive and significant effects on investment efficiency of the firms These findings imply that improved SD will, in many cases, boost investors’ confidence, reduce CoC, and consequently enhance investment efficiency for firms. Therefore, management of firms should improve their SD practices. Lastly, standard setters and regulatory bodies should also ensure that firms comply with disclosure regulations to further boost investors’ confidence so that investors can invest in firms that positively impact society.

7.1. Policy Implications

The findings of this study offer valuable empirical insights into the importance of increased segment disclosure in listed firms. First, the positive and significant impact of segment disclosure on investment efficiency suggests that firms that prioritise investors interest, by disseminating segment information, can make more efficient investment decisions. This is possible as investors will be able to monitor investment viability across segments and dissuade managers from making investment decisions that are not in their interest. Additionally, the negative relationship between CoC and investment efficiency indicates that improved SD leads to reduced CoC for firms, which, in many cases, translates into investment efficiency. By increasing segment disclosure, listed firms can attain an optimal level of investment. Lastly, this study is a pointer to standard setters to broaden disclosure requirements for firms and emphasise the importance of compliance with segment disclosure standards by firms.

7.2. Limitations of Study and Future Research Directions

Despite the empirical contributions of this study, there are limitations to be pointed out. This study utilised data of firms from different sectors, which could cause significant variations in the data and eventual outcome. Future research could focus on sector-by-sector analysis using the examined variables in this study. By analysing the data within individual sectors, researchers can reduce variability and allow for an in-depth analysis of firms in the same business environment. Additionally, future research might introduce the influence of other variables, such as auditor influence, listing status, and so on.

Author Contributions

Conceptualization, D.F.S.; methodology, D.F.S. and T.M.; formal analysis, D.F.S.; investigation, D.F.S.; resources, T.M.; data curation, D.F.S.; writing—original draft preparation, D.F.S.; writing—review and editing, D.F.S. and T.M.; visualization, D.F.S. and T.M.; supervision, T.M. All authors have read and agreed to the published version of the manuscript.

Funding

This research received no external funding.

Institutional Review Board Statement

Not applicable.

Informed Consent Statement

Not applicable.

Data Availability Statement

This study utilised secondary data of companies which were downloaded from the Nigerian Exchange Group (NGX) website.

Conflicts of Interest

The authors declare no conflicts of interest.

References

  1. Abbas, N., Ahmed, H., Malik, Q. A., & Waheed, A. (2018). Impact of investment efficiency on cost of equity: An empirical study on Shariah and non-Shariah compliance firms listed on Pakistan Stock Exchange. Administrative Review, 2(3), 307–322. Available online: https://nbn-resolving.org/urn:nbn:de:0168-ssoar-60206-5 (accessed on 12 October 2024).
  2. Aboud, A., & Diab, A. A. (2018). The impact of social, environmental and corporate governance disclosure on firm value evidence from Egypt. Journal of Accounting in Emerging Economies, 8(4), 442–458. [Google Scholar] [CrossRef]
  3. Aboud, A., & Roberts, C. (2018). Managers’ segment disclosure choices under IFRS 8: EU evidence. Accounting Forum, 42(4), 293–308. [Google Scholar] [CrossRef]
  4. Adelegan, O. J. (2009). Capital market development and investment efficiency in Nigeria. Savings and Development, 33, 113–132. Available online: https://aisberg.unibg.it/retrieve/handle/10446/27432/9075/ADELEGAN%202-2009.pdf (accessed on 10 March 2025).
  5. Adeyemi, S. B., & Fagbemi, T. O. (2010). Audit quality, corporate governance and firm characteristics in Nigeria. International Journal of Business and Management, 5(5), 169–179. [Google Scholar] [CrossRef]
  6. Adeyemi, S. B., & Oboh, C. S. (2011). Perceived relationship between corporate capital structure and firm value in Nigeria. International Journal of Business and Social Science, 2(19), 131–143. [Google Scholar]
  7. Agoraki, K. K., Giaka, M., Konstantios, D., & Negkakis, I. (2024). The relationship between firm-level climate change exposure, financial integration, cost of capital and investment efficiency. Journal of International Money and Finance, 141, 102994. [Google Scholar] [CrossRef]
  8. Ajide, M. F. (2017). Firm specific and institutional determinants of corporate investments in Nigeria. Future Business Journal, 3(2), 107–118. [Google Scholar] [CrossRef]
  9. Akinlo, O. O., & Sule, D. F. (2019). Voluntary disclosure and cost of equity capital in Nigerian banks: An empirical study. Ife Journal of Economics and Finance, 8(12), 61–72. [Google Scholar]
  10. Akinsulire, O. (2006). Financial management and evaluation of cost effectiveness (4th ed., Vol. 73, pp. 543–551). El-toda Ventures, Ceemol Nigeria Limited. [Google Scholar]
  11. Al-Hadi, A., Hasan, M. M., Taylor, G., Hossain, M., & Richardson, G. (2017). Market risk disclosures and investment efficiency: International evidence from the Gulf Cooperation Council financial firms. Journal of International Financial Management & Accounting, 28(3), 349–393. [Google Scholar] [CrossRef]
  12. Alsayegh, M., Rahman, R. A., & Homayoun, S. (2022). Corporate sustainability performance and firm value through investment efficiency. Sustainability, 15(1), 305. [Google Scholar] [CrossRef]
  13. Andre, P., Filip, A., & Moldovan, R. (2016). Segment disclosure, quality and quantity under IFRS 8: Determinant and the effects on financial analysts’ earnings forecast errors. International Journal of Accounting, 51(4), 443–461. [Google Scholar] [CrossRef]
  14. Anwar, R., & Malik, J. A. (2020). When does corporate social responsibility disclosure affect investment efficiency? A new answer to an old question. SAGE Open, 10(2). [Google Scholar] [CrossRef]
  15. Ardianto, A., Anridho, N., Ngelo, A. A., Ekasari, W. F., & Haider, I. (2023). Internal audit function and investment efficiency: Evidence from public companies in Indonesia. Cogent Business &Management, 10(2), 2242174. [Google Scholar] [CrossRef]
  16. Assad, N., Jaafar, A., & Zervopoulos, P. D. (2023). The interplay of real earnings management and investment efficiency: Evidence from the U.S. Cogent Business & Management, 10(2), 2237174. [Google Scholar] [CrossRef]
  17. Balakrishnan, K., Core, J. E., & Verdi, R. S. (2014). The relation between reporting quality and financing and investment: Evidence from changes in financing capacity. Journal of Accounting Research, 52(1), 1–36. [Google Scholar] [CrossRef]
  18. Basu, S., Kim, O., & Lim, L. (1999). The usefulness of industry segment information (Working paper). Baruch College-City University of New York. Available online: https://www.researchgate.net/publication/228306664_The_Usefulness_of_Industry_Segment_Information (accessed on 22 September 2024).
  19. Bens, D. A., Berger, P. G., & Monahan, S. J. (2011). Discretionary disclosure in financial reporting: An examination comparing internal firm data to externally reported segment data. Journal of Accounting Review, 86(2), 417–449. [Google Scholar] [CrossRef]
  20. Berger, P., & Hann, R. (2003). The impact of SFAS No. 131 on information and monitoring. Journal of Accounting Research, 41, 163–223. [Google Scholar] [CrossRef]
  21. Berger, P., & Hann, R. (2007). Segment profitability and the proprietary and agency costs of disclosure. The Accounting Review, 82, 869–906. [Google Scholar] [CrossRef]
  22. Bhattacharya, N., Chang, H. S., & Chiorean, R. (2022). Regulatory interventions in response to non-compliance with mandatory derivatives disclosure rules. Review of Accounting Studies, forthcoming, SMU Cox School of Business research paper No. 21-21, Singapore Management University School of Accountancy research paper No. 2022-145. SSRN. Available online: https://ssrn.com/abstract=3979231 (accessed on 10 July 2024). [CrossRef]
  23. Biddle, G. C., & Hilary, G. (2006). Accounting quality and firm-level capital investment. The Accounting Review, 81(5), 963–982. [Google Scholar] [CrossRef]
  24. Biddle, G. C., Hilary, G., & Verdi, R. S. (2009). How does financial reporting quality improve investment efficiency? Journal of Financial Economics, 48, 112–131. [Google Scholar] [CrossRef]
  25. Blanco, B., García, L., Juan, M., Tribo, G., & Joseph, A. (2015). Segment disclosure and cost of capital. Journal of Business Finance & Accounting, 42(3–4), 367–411. [Google Scholar] [CrossRef]
  26. Botosan, C. A. (1997). Disclosure level and the cost of equity capital. The Accounting Review, 72(3), 323. [Google Scholar]
  27. Botosan, C. A., Huffman, A., & Stanford, M. H. (2021). The state of segment reporting by U.S. Public Entities: 1976–2017. Accounting Horizons, 35(1), 1–27. [Google Scholar] [CrossRef]
  28. Botosan, C. A., & Plumlee, M. A. (2002). A re-examination of disclosure level and expected cost of equity capital. Journal of Accounting Research, 40, 21–40. [Google Scholar] [CrossRef]
  29. Botosan, C. A., & Stanford, M. (2005). Managers motives to withhold segment disclosures and the effect of SFAS No. 131 on analysts’ information environment. The Accounting Review, 80, 751–772. [Google Scholar] [CrossRef]
  30. Bova, F., Luo, Z., & Yang, L. (2024). Geographic segment disclosures and proprietary costs. SSRN. Available online: https://ssrn.com/abstract=5022683 (accessed on 23 April 2025). [CrossRef]
  31. Bushman, R. M., & Smith, A. J. (2001). Financial accounting information and corporate governance. Journal of Accounting and Economics, 32(1–3), 237–333. [Google Scholar] [CrossRef]
  32. Cai, C., Cao, V. N., Clinch, G., & Sek, M. (2024). Real effect and segment disclosure policy: Implications for investment decision, cost of capital and firm value. AASB Research Centre Working Paper No. 24-05. Available online: https://ssrn.com/abstract=4957270 (accessed on 23 April 2025). [CrossRef]
  33. Chen, F., Hope, O., Li, Q., & Wang, X. (2011). Financial reporting quality and investment efficiency of private firms in emerging markets. The Accounting Review, 86(4), 1255–1288. [Google Scholar] [CrossRef]
  34. Chen, P., & Zhang, G. (2003). Heterogeneous investment opportunities in multiple-segment firms and the incremental value relevance of segment accounting data. The Accounting Review, 78, 397–428. [Google Scholar] [CrossRef]
  35. Cho, Y. J. (2015). Segment disclosure transparency and internal capital market efficiency: Evidence from SFAS No 131. Journal of Accounting Research, 53(4), 669–723. [Google Scholar] [CrossRef]
  36. Cho, Y. J., & Seo, H. (2024). Segment dissagregation and equity-based pay contracts. Contemporary Accounting Research, 41(2), 1216–1247. [Google Scholar] [CrossRef]
  37. Diamond, D., & Verrecchia, R. (1991). Disclosure, liquidity, and the cost of capital. The Journal of Finance, 46, 1325–1359. [Google Scholar] [CrossRef]
  38. Domantas, S. (2010). Practical approach to estimating cost of capital. University Library of Munich, Germany. Available online: https://econpapers.repec.org/RePEc:pra:mprapa:31011 (accessed on 23 April 2025).
  39. Drake, P. (2010). A reading prepared by Pamela Peterson Drake. J.J Newberry. Available online: https://books.google.com.ng/books?hl=en&lr=&id=4zqgXdITQuAC&oi=fnd&pg=PR13&dq=info:05Js4eVN6N4J:scholar.google.com&ots=jh1xUDFiun&sig=2gwUrubdYYwSJpigshPZFm7MhDQ&redir_esc=y#v=onepage&q&f=false (accessed on 23 April 2025).
  40. Easton, P. D. (2004). PEG ratios and estimating the implied expected rate of return on equity capital. The Accounting Review, 79(1), 73–95. [Google Scholar] [CrossRef]
  41. Elberry, N. S. (2018). Corporate investment efficiency, disclosure practices and governance [Doctoral thesis, University of Portsmouth]. Available online: https://pure.port.ac.uk/ws/portalfiles/portal/13077818/Thesis.pdf (accessed on 14 August 2024).
  42. Elsayed, N., Ammar, S., & Mardini, G. H. (2019). The impact of ERP utilization experience and segmental reporting on corporate performance in the UK context. Enterprise Information Systems, 15(1), 61–86. [Google Scholar] [CrossRef]
  43. Ganiyu, O. Y., Adelopo, I., Rodionova, Y., & Samuel, L. O. (2019). Capital structure and firm performance in Nigeria. African Journal of Economic Review, 7(1), 31–56. [Google Scholar]
  44. Gao, R., & Sidhu, B. K. (2018). The impact of mandatory international financial reporting standards adoption on investment efficiency: Standard enforcement and reporting incentives. Journal of Accounting, Finance and Business Studies, 54(3), 277–318. [Google Scholar] [CrossRef]
  45. Gisbert, A., Navallas, B., & Romero, D. (2024). From IAS 14 to IFRS 8: The role of proprietary and agency costs in shaping financial reporting. Spanish Journal of Finance and Accounting/Revista Española de Financiación y Contabilidad, 53(4), 451–474. [Google Scholar] [CrossRef]
  46. Hail, L. (2000). The impact of voluntary corporate disclosures on the ex-ante cost of capital for Swiss firms. The European Accounting Review, 11(04), 741–773. [Google Scholar] [CrossRef]
  47. Hail, L., & Leuz, C. (2006). International differences in the cost of equity capital: Do legal institutions and securities regulation matter? Journal of Accounting Research, 44(3), 485–531. [Google Scholar] [CrossRef]
  48. Hann, R. N., Ogneva, M., & Ozbas, O. (2012). Corporate diversification and the cost of capital. Journal of Finance, forthcoming, Marshall School of Business working paper No. FBE 32-09, Rock Center for Corporate Governance at Stanford University working paper No. 58, AFA 2011 Denver meetings paper. Available online: https://ssrn.com/abstract=1364481 (accessed on 23 April 2025). [CrossRef]
  49. He, J., Plumlee, M. A., & Wen, H. (2019). Voluntary disclosure, mandatory disclosure and the cost of capital. Journal of Business Finance & Accounting, 46(3–4), 307–335. [Google Scholar]
  50. Healy, P. M., & Palepu, K. G. (2001). Information asymmetry, corporate disclosure, and the capital markets: A review of the empirical disclosure literature. Journal of Accounting and Economics, 31(1-3), 405–440. [Google Scholar] [CrossRef]
  51. Hope, O. K., & Thomas, W. B. (2008). Managerial empire building and firm disclosure. Journal of Accounting Research, 46, 591–626. [Google Scholar] [CrossRef]
  52. Huang, X., & Tarkom, A. (2022). Labor investment efficiency and cash flow volatility. Finance Research Letters, 50, 103227. [Google Scholar] [CrossRef]
  53. IFRS 8. (2007). Operating segments. International Accounting Standards Board. Available online: https://www.ifrs.org/content/dam/ifrs/publications/pdf-standards/english/2022/issued/part-a/ifrs-8-operating-segments.pdf?bypass=on (accessed on 14 August 2024).
  54. Jensen, M. C., & Meckling, W. H. (1976). Theory of the firm: Managerial behavior, agency costs and ownership structure. Journal of Financial Economics, 3(4), 305–360. [Google Scholar] [CrossRef]
  55. Khan, M. A., Yau, J. T. H., Sarang, A. A. A., Gull, A. A., & Javed, M. (2024). Information asymmetry and investment efficiency: The role of blockholders. Journal of Applied Accounting Research, 26(1), 194–221. [Google Scholar] [CrossRef]
  56. Komara, A., Ghozali, I., & Januarti, I. (2020, March). Examining the firm value based on signaling theory. In 1st international conference on accounting, management and entrepreneurship (ICAMER 2019) (pp. 1–4). Atlantis Press. [Google Scholar]
  57. Lathief, J. T. A., Kumaravel, S. C., Velnadar, R., Vijayan, R. V., & Parayitam, S. (2024). Quantifying risk in investment decision-making. Journal of Risk and Financial Management, 17(2), 82. [Google Scholar] [CrossRef]
  58. Leung, E., & Verriest, A. (2019). Does location matter for disclosure? Evidence from geographic segments. Journal of Business Finance and Accounting, 46(5–6), 541–568. [Google Scholar] [CrossRef]
  59. Lopes, A. B., & Alencar, R. C. (2010). Disclosure and cost of equity capital in emerging markets: The Brazilian case. SSRN Electronic Journal, 45(4), 443–464. [Google Scholar] [CrossRef]
  60. Lucky, A. L. (2017). Cost of capital and corporate earning of Nigeria quoted firms: A multi-dimensional analysis of quoted firms in Nigeria. Australian Finance & Banking Review, 1(1), 41–65. [Google Scholar] [CrossRef]
  61. Majeed, M. A., Zhang, X., & Umar, M. (2018). Impact of investment efficiency on cost of equity: Evidence from China. Journal of Asia Business Studies, 12(1), 44–59. [Google Scholar] [CrossRef]
  62. Mardini, G. H., Alkurdi, A., & Ahmed, A. H. (2023). A longitudinal investigation of IFRS-8 implementation: Evidence from Qatar. Afro-Asian Journal of Finance and Accounting, 13(1), 125–145. [Google Scholar] [CrossRef]
  63. Mardini, G. H., Tahat, Y. A., & Power, D. M. (2013). Determinants of segmental disclosures: Evidence from the emerging capital market of Jordan. International Journal of Managerial and Financial Accounting, 5(3), 253–276. [Google Scholar] [CrossRef]
  64. Mateescu, R. (2016). Segment disclosure practices and determinants: Evidence from Romanian listed companies. The International Journal of Management Science and Information Technology (IJMSIT), 20, 40–50. Available online: https://hdl.handle.net/10419/178824 (accessed on 14 August 2024).
  65. Meiryani, H. S., Soepriyanto, G., Jessica, F. M., Grabowska, S., & Aljuaid, M. (2023). The effect of voluntary disclosure on financial performance: Empirical study on manufacturing industry in Indonesia. PLoS ONE, 18(6), e0285720. [Google Scholar] [CrossRef]
  66. Moldovan, R. (2015). Three essays on operating segment disclosure. Essex Business School. [Google Scholar]
  67. Moncarz, E. S., Moncarz, R., Cabello, A., & Moncarz, B. (2006). The rise and collapse of Enron: Financial innovation, errors and lessons. Contaduría y Administración, 218, 17–37. Available online: https://www.redalyc.org/articulo.oa?id=39521802 (accessed on 18 April 2025).
  68. Nagar, V., Nanda, D., & Wysocki, P. (2003). Discretionary Disclosure and Stock-Based Incentives. Journal of Accounting and Economics, 34, 283–309. [Google Scholar] [CrossRef]
  69. Odia, J. O. (2018). The determinants and decision usefulness of ifrs 8 on segment disclosures. Available online: https://www.semanticscholar.org/paper/THE-DETERMINANTS-AND-DECISION-USEFULNESS-OF-IFRS-8-OdiaJ./1cdbce0d8a641d1e36a556794db13196b0dfd99c (accessed on 12 October 2024).
  70. Opara, S. ((2017,, March 5)). 15 firms delisted from Nigerian stock exchange in 2016. Punch Newspaper. Available online: https://punchng.com/15-firms-delisted-from-nigerian-stock-exchange-in-2016-report/#google_vignette (accessed on 12 October 2024).
  71. Owusu-Ansah, S. (1998). The impact of corporate attributes on the extent of mandatory disclosure and reporting by listed companies in Zimbabwe. The International Journal of Accounting, 33(5), 605–631. [Google Scholar] [CrossRef]
  72. Peláez, B. B. (2010). Segment disclosure, cost of capital and investment efficiency [Doctoral thesis, Department de economica de la empressa, Universidad, Carloss III de Madrid]. Available online: https://e-archivo.uc3m.es/rest/api/core/bitstreams/c63f74d2-63b4-4294-a19c-2a9fa4f4dc4b/content (accessed on 12 October 2024).
  73. Prencipe, A. (2004). Proprietary costs and voluntary segment disclosure: Evidence from Italian listed companies. European Accounting Review, 13(2), 319–340. [Google Scholar] [CrossRef]
  74. Raffournier, B. (1995). The determinants of voluntary financial disclosure by Swiss listed companies. The European Accounting Review, 4, 261–280. [Google Scholar] [CrossRef]
  75. Revsine, L., Collins, D., & Johnson, B. (1999). Financial reporting and analysis. Prentice Hall International. Available online: https://books.google.co.za/books/about/Financial_Reporting_and_Analysis.html?id=soEeAQAAIAAJ&redir_esc=y (accessed on 11 September 2024).
  76. Saini, J. S. (2010). Cost of equity capital, information asymmetry, and segment disclosures [Doctoral thesis, Oklahoma State University]. [Google Scholar] [CrossRef]
  77. Schwarcz, S. L. ((2023,, April)). Reexamining Enron’s regulatory consequences. NYU annual survey of American law, 2023, Duke Law School public law & legal theory series No. 2023-28. SSRN. Available online: https://ssrn.com/abstract=4419119 (accessed on 12 October 2024). [CrossRef]
  78. Serghiescu, L., & Văidean, V. L. (2014). Determinant factors of the capital structure of a firm: An empirical analysis. Procedia Economics and Finance, 15, 1447–1457. [Google Scholar] [CrossRef]
  79. Shehata, N. F. (2014). Theories and determinants of voluntary disclosure. Accounting and Finance Research, 3(1), 18–26. Available online: https://ssrn.com/abstract=2442486 (accessed on 12 October 2024). [CrossRef]
  80. Shittu, I., & Che-Ahmad, A. (2024). Corporate governance and equity value: Empirical evidence from Nigerian firms. Corporate Governance, 24(2), 462–484. [Google Scholar] [CrossRef]
  81. Sule, D. F. (2025a). Can segment disclosure improve the investment efficiency of listed companies in Nigeria? African Journal of Business and Economic Research, 20(1), 319–340. Available online: https://hdl.handle.net/10520/ejc-aa_ajber_v20_n1_a14 (accessed on 19 April 2025). [CrossRef]
  82. Sule, D. F. (2025b). The determinants off voluntary segment disclosure by Nigerian Listed Companies: Further Evidence. African Journal of Innovation and Entrepreneurship, 4(1), 311–329. Available online: https://hdl.handle.net/10520/ejc-aa_ajie_v4_n1_a13 (accessed on 19 April 2025). [CrossRef]
  83. Svetek, M. (2022). Signaling in the context of early-stage equity financing: Review and directions. Venture Capital, 24(1), 71–104. [Google Scholar] [CrossRef]
  84. Uremadu, S. F., & Onyekachi, O. (2019). The impact of capital structure on corporate performance in Nigeria: A quantitative study of the consumer goods sector. Current Investigations in Agriculture and Current Research, 5(4), 697–705. [Google Scholar] [CrossRef]
  85. Wang, F., Zhu, Z., & Hoffmire, J. (2015). Financial reporting quality, free cash flow and investment efficiency. EDP Sciences, SHS Web Conferences, 17, 701027. [Google Scholar] [CrossRef]
  86. Yahaya, O. A. (2024). Board characteristics and cost of capital of listed consumer goods companies in Nigeria. SSRN. Available online: https://ssrn.com/abstract=5028900 (accessed on 11 October 2024). [CrossRef]
  87. Yasar, B., Martin, T., & Kiessling, T. (2020). An empirical test of signaling theory. Management Research Review, 43(11), 1309–1335. [Google Scholar] [CrossRef]
Figure 1. Cost of capital estimation steps. Source: Drake (2010).
Jrfm 18 00258 g001
Table 1. Measurement of variables.
VariableMeasurementReferences
TSDA total segment disclosure index of 42 adapted from extant studies
1(0) if segment information is (is not) disclosed
T S D = i = 1 n T s d i n
Mardini et al. (2013) and Blanco et al. (2015)
Investment efficiency ( I N V _ E F F i t ) R e s e a r c h   &   d e v e l o p m e n t   e x p e n d i t u r e s + c a p i t a l   e x p e n d i t u r e s a c q u i s i t i o n   c o s t c a s h   r e c e i p t s   f r o m   s a l e s   o f   p r o p e r t y ,   p l a n t   a n d   e q u i p m e n t × 100  
a n d   s c a l e d   b y   l a g g e d   t o t a l   a s s e t s   o f   f i r m s   i   i n   y e a r   t
Biddle et al. (2009), Wang et al. (2015), and F. Chen et al. (2011)
Cost of capital ( C o C i t ) PEG ratio =
r P E G = e p s 5 e p s 4 P o      
Easton (2004)
Size F i r m   s m a r k e t   v a l u e   ( s h a r e   p r i c e   m u l t i p l i e d   b y   t h e   o u t s t a n d i n g
n u m b e r   o f   s h a r e s )
Hail and Leuz (2006), Diamond and Verrecchia (1991), Wang et al. (2015)
Book-to-market ratio C o m m o n   s h a r e h o l d e r   e q u i t y C u r r e n t   m a r k e t   c a p i t a l i s a t i o n Hail and Leuz (2006); Wang et al. (2015).
Growth L o g a r i t h m   o f   e a c h   f i r m   s b o o k   t o   m a r k e t   v a l u e   a t   t h e   s t a r t   o f  
t h e   f i n a n c i a l   y e a r
Nagar et al. (2003).
Tangibility N o n c u r r e n t   t a n g i b l e     a s s e t s T o t a l   a s s e t s Serghiescu and Văidean (2014)
Cash flow N e t   i n c o m e + D e p r e c i a t i o n   / A m o r t i z a t i o n C h a n g e   i n   W o r k i n g   C a p i t a l C a p i t a l C a p i t a l   e x p e n d i t u r e Biddle et al. (2009), Wang et al. (2015)
Profitability R e t u r n   o n   A s s e t s   R O A = E a r n i n g s   r a t i o   b e f o r e   i n t e r e s t s   a n d   t a x e s T o t a l   A s s e t Raffournier (1995)
Source: Authors’ compilation (2024).
Table 2. Descriptive statistics.
TSDCoCINV_EFFMTBTANGCASHFLGROWTHPROFAGESIZE
Mean18.182.610.350.880.291.420.391.6423.7018.78
Median18.002.480.330.700.271.270.411.3523.0015.60
Maximum24.0023.580.473.450.461.900.714.8860.0035.50
Minimum13.000.020.070.200.151.180.230.991.005.76
Std. Dev.2.281.820.070.490.080.260.080.8214.249.41
Skewness0.452.260.040.870.010.760.512.290.290.42
Kurtosis2.7624.233.264.242.102.044.448.001.981.75
Sum12,366.01780.39228.96601.78200.41965.36269.631121.6316116.0012,770.59
Observations680680680680680680680680680680
Source: Authors’ computation (2024).
Table 3. Pairwise correlation matrix and variance inflation factor (VIF) test.
VIFINV_EFFCoCPROF SIZE GROWTHTANGMTBCASHFL TSDAGE
INV_EFF -1.00
CoC 2.02−0.24 **1.00
PROF 1.120.13 *−0.051.00
SIZE 1.110.020.02 *0.12 *1.00
GROWTH 1.210.05 **−0.00−0.02−0.05 **1.00
TANG 1.160.02 **0.06 **−0.05 **−0.04−0.05 *1.00
MTB 2.510.06 *−0.090.08−0.02−0.00−0.07 *1.00
CASHFL 2.090.26 **−0.18 **0.18 **−0.06 **−0.000.000.08 **1.00
TSD 1.220.15 ***0.13 *0.08−0.060.07 **0.03 *0.050.031.00
AGE 1.060.01−0.01−0.180.01 **0.02 *−0.05−0.03 *−0.19 **0.011.00
Source: Authors’ computation 2024. The table shows the correlation matrix and variance inflation factor of the variables in Equation (1). Investment efficiency (INV-EFF), total segment disclosure (TSD), profitability (Prof), size, Tang (tangibility), market-to-book ratio (MTB), cash flow (cashfl), and age. Note: *, **, and *** represent significance at 10%, 5%, and 1%, respectively.
Table 4. Effect of segment disclosure and cost of capital on investment efficiency.
VariablesPooled OLSFixed EffectRandom Effect
CoC−0.0250
(0.0965) ***
0.0289
(0.3435)
−0.0267
(0.0307) **
TSD0.0192
(0.0089) *
0.0114
(0.0908) ***
0.0119
(0.0303) **
TSD*COC0.0215
(0.0078) *
0.0141
(0.0894) ***
0.0192
(0.0030) *
LOG(PROF)0.0099
(0.8131)
−0.0165
(0.0097) *
−0.0126
(0.0001) *
LOG(SIZE)−0.0036
(0.1990)
0.0075
(0.1244)
0.0042
(0.0835) ***
GROWTH0.0439
(0.0129) **
0.0247
(0.0199) ***
0.0258
(0.0272) **
TANG0.0360
(0.0299) **
−0.0289
(0.2935)
−0.0257
(0.2539)
MTB0.0059
(0.0464) **
0.0036
(0.1466)
0.0035
(0.2583)
CASHFL0.0565
(0.0000) *
0.0793
(0.0076) *
0.0803
(0.0016) *
LOG(AGE)0.0004
(0.8266)
0.013773
(0.00117)
0.009668
(0.0571) ***
C0.1858
(0.0000) *
0.1352
(0.0563) **
0.1517
(0.0051) *
R-square0.13180.81430.8590
Adjusted R-square0.12010.78490.7370
Hausman 7.567
(0.865)
*, **, and *** indicate the level of significance at 1%, 5%, and 10%, respectively. INV-EFF denotes investment efficiency, CoC stands for cost of capital, Prof denotes profitability, Growth denotes growth, Tang stands for tangibility, MTB is the market-to-book ratio, and Cashf represents cash flow.
Disclaimer/Publisher’s Note: The statements, opinions and data contained in all publications are solely those of the individual author(s) and contributor(s) and not of MDPI and/or the editor(s). MDPI and/or the editor(s) disclaim responsibility for any injury to people or property resulting from any ideas, methods, instructions or products referred to in the content.

