Article

Unlock Your Firm Value with ESG Performance? Evidence from ASX-Listed Companies

1
Institute of Innovation, Science, and Sustainability, Federation University, Ballarat, VIC 3350, Australia
2
School of Business and Creative Industries, University of the Sunshine Coast, Sippy Downs, QLD 4556, Australia
3
School of Accountancy, University of the Witwatersrand, Johannesburg 2017, South Africa
*
Authors to whom correspondence should be addressed.
J. Risk Financial Manag. 2025, 18(5), 247; https://doi.org/10.3390/jrfm18050247
Submission received: 13 February 2025 / Revised: 19 April 2025 / Accepted: 25 April 2025 / Published: 1 May 2025
(This article belongs to the Special Issue Emerging Trends and Innovations in Corporate Finance and Governance)

Abstract

:
A research gap exists concerning the moderating roles of corporate governance mechanisms on the nexus of environmental, social, and governance (ESG) performance and firm value. This study aims to address this gap in the Australian corporate context. We examine whether ESG performance can enhance firm value and whether this relationship is moderated by the corporate governance mechanisms to balance stakeholder interests. Drawing on a sample from the ASX, we find that while high ESG performance can increase firm value, this effect diminishes in the presence of the large number of supply chain contracts. We further discovered a negative moderating effect of board independence and audit quality on ESG performance and firm value. Our findings highlight the contingent nature of ESG value creation, indicating that while ESG activities can enhance firm value, their impact depends on firms’ governance context and contractual arrangements that shape shareholders’ outcomes collectively.

1. Introduction

ESG (environmental, social, and governance) performance has increasingly become a key corporate strategy for stakeholders to evaluate a firm’s sustainability performance, maximise shareholders’ wealth, and achieve long-term value creation (Weston & Nnadi, 2023). Corporate ESG disclosure can affect a firm’s value, and the financial consequences of ESG performance can result in significant stock price fluctuation (Z. Wu et al., 2023).
ESG investment can enhance information transparency between firms, investors, and relevant stakeholders, which in turn brings considerable benefits to the world as a whole and alleviates the uncertainty of the financial situation (Cheng et al., 2024). A global institutional investor survey released by Ernst & Young (2021) demonstrated that 90% of investors considered a firms’ ESG performance as part of their investment strategy.
With the increasing importance of ESG investment, there have been many studies conducted, including those that investigate the relationship between ESG performance and firm value. The findings of these studies are mixed. Duan et al. (2023), for example, found that ESG performance has a significant positive impact on firm value in the manufacturing industry, while Cheng et al. (2024) also noted that strong ESG performance can increase firms’ market value. Conversely, Mendiratta et al. (2023) found a negative relationship between ESG activities and firm value, while Behl et al. (2022) and Rastogi et al. (2024) stated that the association of firms’ ESG with their value is insignificant. This study aims to enter the debate by examining the impact of ESG performance on firm value, and these differing findings.
To extend the previous research, this study explores potential moderating mechanisms behind the relationship between ESG and firm value. We focus on the supply chain as the first moderator because it has been shown that this is a significant factor that can influence firms’ firm performance (Liu et al., 2022). As ESG information disclosure can foster collaboration and promote sustainable practices amongst supply chain partners (Ahmed et al., 2023; Gebhardt et al., 2022), firms can implement strategic choices to engage in socially and environmentally responsible behaviour to improve their financial performance, efficiency, and market share and enhance their firm value (Baid & Jayaraman, 2022). By focusing on integrating ESG activities into supply chain partners, firms can build strong relationships with their suppliers and customers and therefore reduce the risk of supply chain disruptions, which helps firms enhance performance and shareholder value (Tsang et al., 2024). However, Zhou et al. (2025) discovered a negative association between ESG performance and supply chain contracts. To the best of our knowledge, no prior studies have implemented supply chain contracts as a moderator to assess the association between firms’ ESG performance and firm value.
This study will also examine a second moderator—corporate governance—between a firm’s ESG performance and its value. With the rapidly evolving ESG landscape, there is a pressing need to understand how well-established corporate governance systems can subsequently influence firm value (Bukari et al., 2024). According to Z. Wu et al. (2023), effective corporate governance can lead to the success of a business and improve its relationships with stakeholders. Good corporate governance is crucial to improving a firm’s reputation, increasing shareholder trust, and promoting ethical activity, leading to increased firm value (Osei et al., 2019). Prior research has demonstrated a strong association between corporate governance and firm value by considering a range of governance attributes (Thenmozhi & Sasidharan, 2020; Singh & Delios, 2017; Velte, 2019; Yu & Xiao, 2022). Some aspects of corporate governance—in particular, board independence and audit quality—has also been shown to influence firm value in a negative way because investors do not value governance practice (Souther, 2021). However, despite substantial scholarly attention, the existing research on assessing the relationship between ESG and firm value reveals several limitations.
First, most existing studies focus on examining the direct relationship between ESG performance and firm financial outcomes, and the findings are mixed. No prior research has considered board independence and audit quality as moderators. Second, although past research has acknowledged governance structure as an important influential moderating factor, the moderating influence of operational factors related to supply chain practices remains largely unexplored. This is a significant oversight because the effectiveness of ESG performance may rely heavily on a firm’s supply chain network. In addition, the few past studies that examined the moderating effect of the governance mechanism on the ESG and firm value relationship examined them in isolation. This indicates that there is limited understanding of how governance mechanisms interact with external operational factors (supply chain network) to collectively influence a firm’s performance and ESG activities. Our research implements an integrative approach by simultaneously examining both external and internal moderators, namely board independence, audit quality, and supply chain contracts. By doing so, it will provide a more comprehensive understanding of the conditions under which ESG performance can enhance firm value. Hence, this will not only fill in a gap in ESG literature but also provide useful insights and practical guidance to management, investors, and policymakers on making strategic ESG decisions to increase firm value.
This research will examine ESG performance and firm value in the context of ASX-listed firms over the period of 2012 to 2021. There have been many ESG studies around the world, and there continue to be more calls for research in ESG and in Australia (Limkriangkrai et al., 2017). In particular, Australia is associated with many challenges related to ESG issues (Le Tran & Coqueret, 2023; Lokuwaduge & de Silva, 2020), as the government has committed to achieving net-zero greenhouse gas emissions by 2050. This requires Australian firms to achieve high ESG performance through the development of a sustainable finance framework (Armour et al., 2023). Meanwhile, the ASX “Corporate Governance Principles and Recommendations,” updated in 2019, is a governance mechanism to ensure a healthy corporate governance structure for public firms. This indicates that an effective corporate governance mechanism can act as a safeguard against ethical lapses and improve firms’ financial performance as well as their reputation and social capital (Dong et al., 2023; Z. Wu et al., 2023).
Our study contributes to the existing literature in the following ways. Firstly, this study uses a sample of Australian listed firms. Secondly, while some moderating mechanisms have been examined on the relationship between ESG performance and firm value, such as ownership structure (S. Wu et al., 2022), geographic international diversification, financial slack (Duque-Grisales & Aguilera-Caracuel, 2021), and employee board representation (Nekhili et al., 2021), to the best of our knowledge, this is the first study to investigate the moderating effect of supply chain contract and to assess the effect of both internal (board independence) and external (audit quality) factors. Finally, the results of this study provide informative conclusions and recommendations to various stakeholders, such as investors, shareholders, regulators, supply chain partners, and firms, to make them aware of the role of ESG in supply chain and corporate governance, as well as its contribution to firm value.
The remainder of this paper is structured as follows. In next section, we provide an overview of the literature review, the conceptual framework, and the development of hypotheses. We will then describe the methodology, data sources, basic models, and summary statistics. Following the data and methodology, this study will present the empirical results. The final section concludes the paper.

2. Literature Review, Conceptual Framework, and Hypotheses

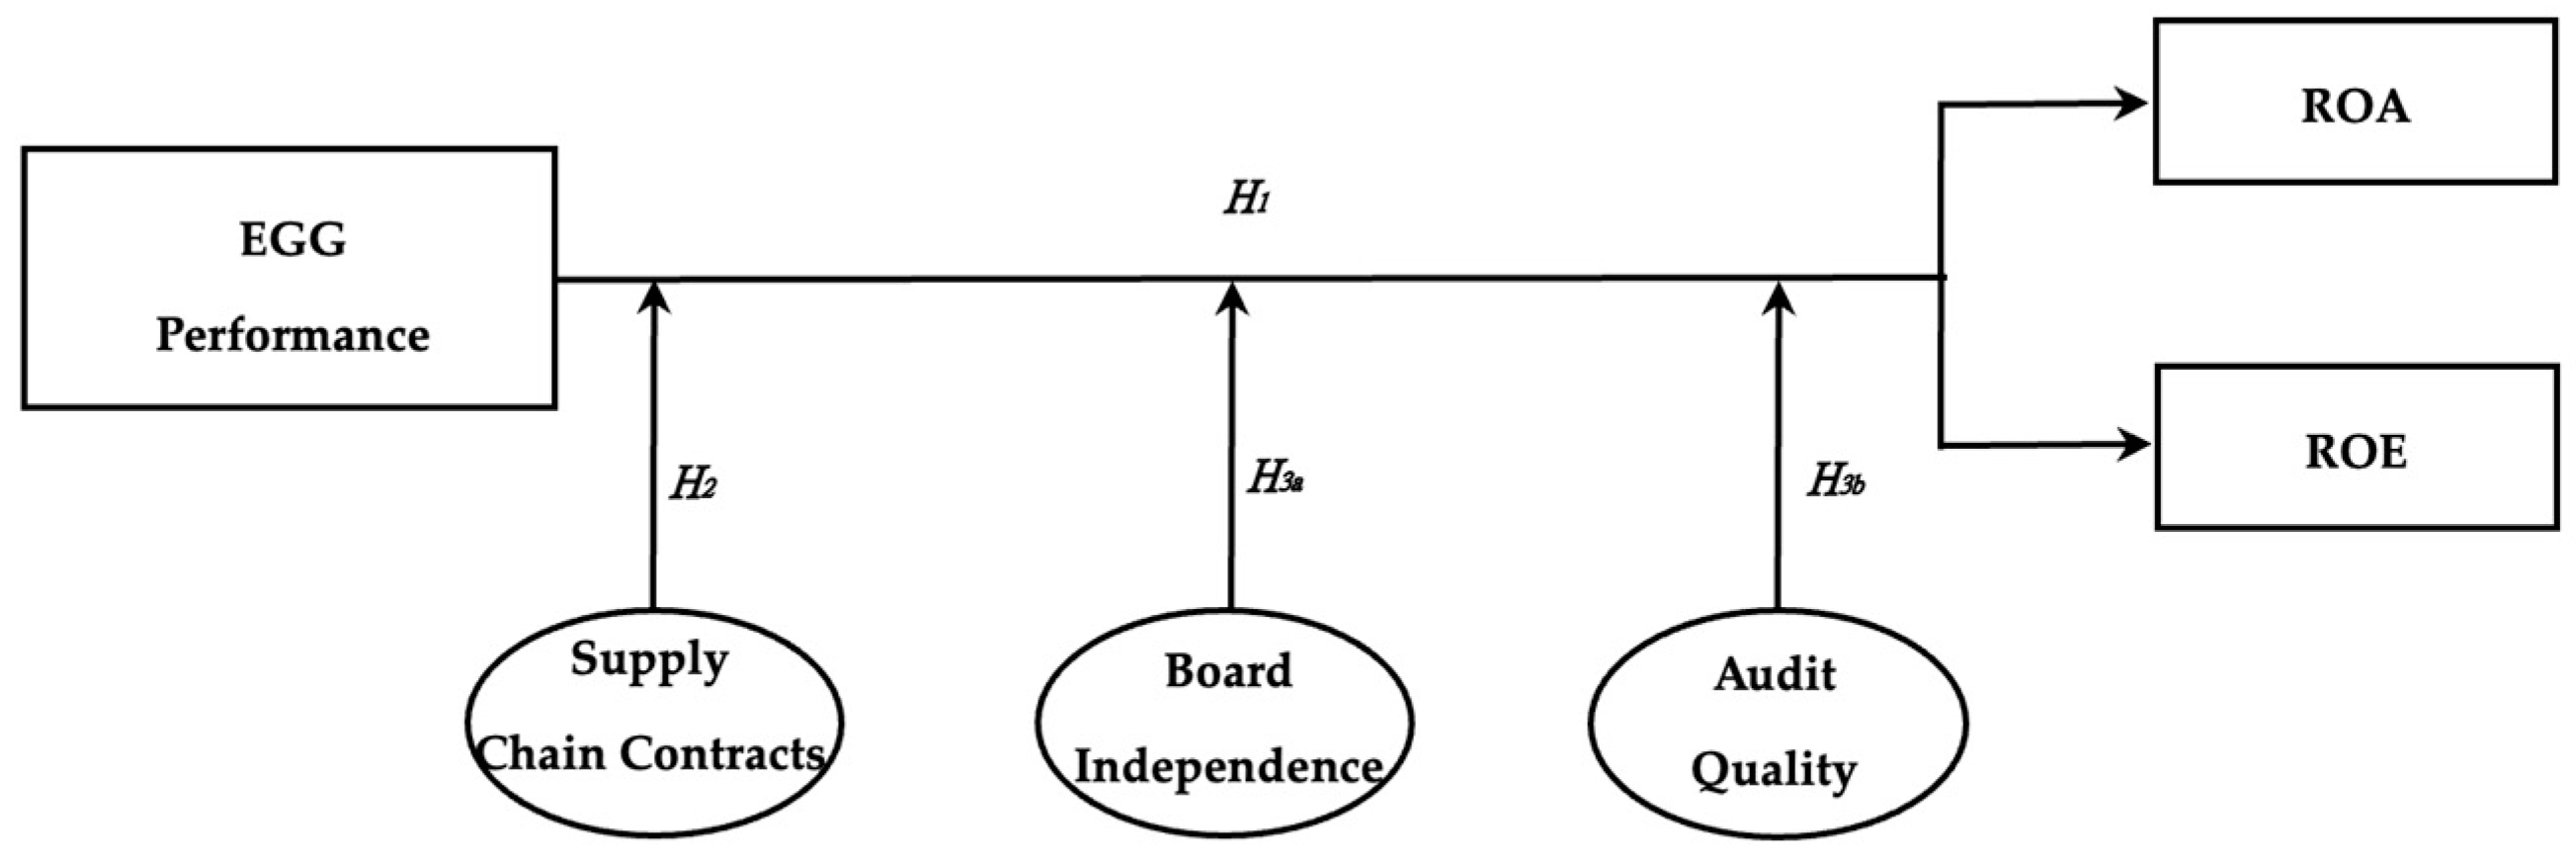
2.1. Conceptual Framework

In today’s business landscape, the growing research on investment decisions based on firms’ ESG principles has elevated the importance of ESG performance (Friede et al., 2015). Drawing on the stakeholder theory, this conceptual framework indicates that firms engaging in ESG activities can gain a competitive advantage in the market, reduce their operational risks, and build trust and strong relationships with stakeholders such as investors, customers, suppliers, and communities (Dincă et al., 2022). As a result, increased ESG performance can attract socially conscious investors and translate into improved financial performance (Fatemi et al., 2018).
However, the effectiveness of ESG performance in driving firm value extends beyond a firm’s internal operation to the entire value chain (Zhou et al., 2025). By incorporating ESG initiatives amongst supply chain contracts, firms can align the supply partners’ ESG activities with their own sustainability goals (Rodríguez-González et al., 2022). Such a monitoring process can encourage firms to work collaboratively and minimise the risks of supply chain disruptions such as environmental and unethical labour issues that could damage the firm’s reputation (Tiwari et al., 2023).
Furthermore, effective corporate governance mechanisms can further enhance the relationship between ESG performance and firm value by reducing agency problems (Fu et al., 2024). Boards, in particular, play an important governance role in approving annual reports and guiding firms to make strategic decisions regarding topics such as ESG activities (Gibbins et al., 1990). A board of directors has the key responsibilities to ensure the firm’s internal control systems are managed at an appropriate level and reduce the firm’s operational risks (de Villiers et al., 2011). In this regard, the board is to act in the best interests of the shareholders and increase the benefit of other stakeholders. However, the board’s capability in connecting the firm to external resources and managing stakeholder relationships to achieve its objectives significantly relies on the degree of board independence, defined by the number of outside independent directors. An independent board can more objectively oversee ESG-related investments and provide independent advice to managers for making decisions with the interests of shareholders in mind (Rashid, 2021). By including a large number of outside directors, firms can ensure that the decisions are made with due diligence, and they can increase investor confidence and enhance firm value (Khoe et al., 2024).
Similarly, audit quality plays a critical role in the governance mechanism to enhance the quality of strategic decisions, including regarding ESG activities (Xiao et al., 2004). It is considered an important governance system to manage agency conflicts between stakeholders and managers to mitigate opportunistic behaviours (Fakhfakh & Jarboui, 2021). It is believed that big audit firms provide assurance that ESG disclosure can accurately represent a firm’s sustainability practices, as they have higher technological and intellectual capabilities (Bacha et al., 2021). Such assurance provides reliability for stakeholders to assess the firm’s performance and will boost their confidence to invest in the firm (Dakhli, 2022). This is highlighted in Figure 1.

2.2. ESG Performance and Firm Value

Stakeholder theory posits that by incorporating the interests and expectations of stakeholders into decision-making processes, firms can foster stronger relationships between management and stakeholders, ultimately generating and distributing value that benefits society and all involved parties (Diez-Cañamero et al., 2020; Freeman et al., 2010). In the context of ESG performance, this theory advocates that firms engage in their ESG activities by prioritizing various stakeholders’ interests (Aouadi & Marsat, 2018; Bashir et al., 2023; Friede et al., 2015; Lev et al., 2010; Malik, 2015). Firms can incorporate ESG factors to enhance their reputation, reduce operational risks, and improve stakeholder relationships, and as a result, strong ESG performance can attract long-term investment (Huang, 2022). Consequently, firms will benefit from positive ESG performance through their social, environmental, and governance activities, thereby increasing market opportunities, which in turn lead to positive firm value (J. Wang, 2012). Prior studies have explored the important impacts of ESG performance on firm value, finding that implementing ESG activities can potentially improve firms’ operating efficiency and firm value (Aouadi & Marsat, 2018; Bashir et al., 2023; Friede et al., 2015; Lev et al., 2010; Malik, 2015). For example, Dam and Scholtens (2015) and Velte (2019) find that firms with higher ESG performance can reduce enterprise risks and enhance firm value. Yu and Xiao (2022) reported that the EGS performance of Chinese listed companies is positively associated with firm value. Krüger (2015) argued that stakeholders’ reactions are strongly associated with the quality of ESG disclosure; that is, stakeholders have positive reactions when a firms’ ESG information is clear, and firm value increases as it attracts shareholder investment. It therefore can synergistically influence firms’ market performance, such as satisfied customers and suppliers, which in turn enhances firms’ reputation and leads to better financial performance (Yu & Xiao, 2022). In addition, when firms produce positive ESG information, they can have access to the benefits generated from ESG activities, their cash flow is expected to increase, and their corporate value is enhanced (E. H. Kao et al., 2018; Pedersen et al., 2021).
While most of the empirical studies on ESG performance and firm value support this positive relationship, only a few studies found a negative association or no association between ESG performance and firm value. For instance, Barnea and Rubin (2010) argue that spending on ESG activities can create only a marginal effect, and that each additional dollar of ESG expenditure will decrease the wealth of shareholders and firm value. Meanwhile, Lima Crisóstomo et al. (2011) found a significant negative correlation between ESG and firm value because shareholders believe that the ESG expenditures are not in their best interests and a waste of business resources, which negatively affects firms’ cash flow. Furthermore, Maccarrone et al. (2024) indicated that the quality of a firm’s ESG performance does not impact its market value.
Although prior research has extensively explored the relationship between ESG performance and firm value, the mixed and inconsistent findings indicate that the ESG and firm value relationship may largely depend on regional, time period-, and industry-specific contexts. To the best of our knowledge, no prior research has specifically explored this relationship within the Australian context. Given that Australia has a different market structure, investor expectations, and regulatory environment, and unique sustainability challenges, we will fill this contextual gap, and our findings will provide more practical insights for Australian firms, investors, policymakers, and stakeholders. Furthermore, as the voluntary ESG reporting environment, investors’ attitudes, social expectations, and market perceptions continuously evolve in Australia, it is essential to reassess the ESG and firm value relationship to gain a deeper understanding of how ESG can directly impact firms’ financial performance. This continued research will provide up-to-date guidance for managerial decision-making and develop effective ESG strategies to enhance firm value. Hence, we developed the following hypothesis:
H1. 
ESG performance has a significant effect on firm value.

2.3. The Moderating Effect of Supply Chain Contracts

Next, we explore how supply chain contracts can moderate the relationship between ESG performance and firm value. This is supported by the resource-based view (Barney, 1991). This theory posits that firms can achieve sustainable and superior performance through unique resources and skills that are valuable, rare, and inimitable (Kozlenkova et al., 2014). When firms can integrate these valuable activities and resources across the firm, it will create competitive advantages (Stevens & Johnson, 2016). The supply chain is valuable because it facilitates the exchange of information to ensure an efficient and effective operational process of firms (Chang et al., 2016). From this perspective, firms can effectively leverage their resources, such as ESG activities, innovative technologies, and governance mechanisms, to achieve high firm value (Kozlenkova et al., 2014).
While the role of the supply chain in the development of business operations has gradually received widespread attention (Zhang et al., 2023), scholars argue that supply chain networks have been experiencing many challenges and disruptions (M. Wang & Yang, 2022). For example, the outbreak of COVID-19 caused a severe impact on the supply chain process (Moosavi et al., 2022). Firms may prioritise costs rather than ESG criteria when choosing supply chain partners (Zhou et al., 2025). Thus, these challenges and complications of managing the global supply chain have required firms to implement effective supply chain management to improve business performance (Baid & Jayaraman, 2022; Longoni & Cagliano, 2018; Tiwari et al., 2023).
Although the supply chain network can promote firm value by fostering collaboration among members, it can create complexity in firm’s management system and expose it to global risks (Christopher et al., 2011). A few studies supported this study with negative findings on the association between supply chain and firm value. Golicic and Smith (2013) found when firms experience unpredictability and imbalances in supply and demand, they may lose the ability to cope with their supply chain, and this could result in poor firm performance (Charles et al., 2010). Similarly, Agyabeng-Mensah et al. (2020) demonstrated a negative relationship between supply chain practice and firm value in the short term due to inexperienced senior management commitment and employee resistance. In addition, Liu et al. (2022) confirmed that the cause of supply chain disruptions can lead to significant financial loss, which consequently reduces a firm’s reputation and value. This indicates that although it could be argued that having strong collaboration and excess resources amongst supply chain partners can help firms cope with disruptions (Wieland et al., 2013), they may not be able to utilise the resources in time, which results in a waste of resources and decreased firm value (Wong et al., 2020). Further, when asymmetric information exists along the supply chain, the cooperative relationship between firms and supply chain partners can become unstable, and it therefore can hurt firms’ performance and value (Hsu et al., 2022).
Despite the extensive exploration of the influence of supply chain on firm value, there is a lack of empirical validation of how the supply chain could be implemented as a moderator to assess firms’ ESG performance and firm value. When a firm already possesses advanced ESG initiatives, supply chain contracts may not provide significant value to the firm. Instead, contracting with supply chain partners may incur higher costs, which takes firm resources from other strategic opportunities and will reduce firm value.
Hence, based on the prior studies mentioned above, we developed the following hypothesis:
H2. 
The relationship between a firm’s ESG performance and value will be weaker when it has a better supply chain contract.

2.4. The Moderating Effect of Corporate Governance (Board Independence and Audit Quality)

Corporate governance is considered a critical factor to influence firms’ financial performance and their social capital (Dong et al., 2023; Sun et al., 2023). This can be explained by agency theory. Agency theory focuses on the principal–agent relationship between shareholders and managers (Meckling & Jensen, 1976). This relationship is defined as a contract entered by one or more individuals (the principal) with another individual (the agent) to perform certain duties on the principal’s behalf (Meckling & Jensen, 1976). They argue that when decisions are not aligned between managers’ and shareholders’ interests, an agency problem arises (Dakhli, 2022). This is because these decisions are driven by a manager’s personal incentives rather than the shareholders’ interests (Sahasranamam et al., 2020).
In the ESG context, spending on ESG activities can create conflicts between firms and shareholders, as shareholders believe it is a waste of resources and that it is not in the best interests of shareholders (Yu & Xiao, 2022). Bhimavarapu et al. (2022) discovered that firms’ ESG performance negatively impacts firm value within the Indian context. This may be due to managers overinvesting in ESG activities for symbolic purposes to gain personal reputation at the expense of shareholders (Barnea & Rubin, 2010). Consequently, although firms may be able to demonstrate outstanding performance, higher investments in ESG can increase costs, which place the firm at a disadvantage in the market and, in turn, reduces its financial performance (Thenmozhi & Sasidharan, 2020; Singh & Delios, 2017). These findings raised the concern of the value of independent directors in a firm (Thenmozhi & Sasidharan, 2020; Souther, 2021). For instance, Souther (2021) found that board independence has a negative impact on firm value. This is because independent directors are outsiders who have a rare understanding of business operations, which leads to poor business strategic decisions that negatively affect firm value (Donaldson & Davis, 1991; Fan et al., 2020). Souther (2021) also stated that firms are more likely to appoint more independent directors when they experience poor performance, in pursuit of social legitimacy. In addition, Fan et al. (2020) noted that the market reacted negatively when firms’ independent director representation increased, as they seem to be more costly and busier compared to non-independent directors. They concluded that the lack of qualification and experience of independent directors can lead to the significant adverse impact on firm value. Similarly, (Moursli, 2020) suggested that director busyness is an important factor that contributes to the relationship between board independence and firm value. They believe that increasing the number of independent directors can increase the overall busyness of a board, which can hurt firm value.
Prior literature has investigated the direct impact of various corporate governance factors on firm value (Bukari et al., 2024; S. Wu et al., 2022). There is also voluminous literature on independent directors’ influence on firm value (Fan et al., 2020; Souther, 2021; Thenmozhi & Sasidharan, 2020). However, few studies investigated the moderating role of how corporate governance components can impact the ESG–firm value relationship. Only Rastogi et al. (2024) found an insignificant moderating influence of the ownership concentration on a firm’s ESG and its value. Within the corporate governance context, board independence is a critical moderator, as the regulations of many countries such as Australia stipulate the minimum number of independent directors on the boards for listed firms, and the proportion of independent directors can impact the evaluation of firms’ strategic decisions, such as those regarding ESG investment; limit managerial opportunistic behaviour; prevent them from manipulating ESG reports; and, consequently, impact firm value (Fan et al., 2020; Richardson, 2006). The above discussion motivates us to empirically investigate the moderating role of board independence for ESG performance. We posit that board independence would indeed moderate the impact of a firm’s ESG on its valuation within the Australian context. However, this needs empirical testing, as research related to ESG’s association within a firm’s value under the board independence moderating effect rarely exists. To fill this gap, we developed the following hypothesis:
H3a. 
The relationship between a firm’s ESG performance and its value will be weaker when its board independence is more effective.
Another important corporate governance mechanism that has been linked to firm value is audit quality. Audit quality is critical to ensuring directors’ responsibility for firm performance by providing reasonable assurance (ASIC, 2022). Among the research conducted, some studies show that audit quality is crucial in reducing opportunistic management behaviour and lowering the agency cost by minimising the information gap between firms and stakeholders (Abraham et al., 2024; Bashir et al., 2023; M.-F. Kao et al., 2019; Kumar, 2024; Omer et al., 2020).
However, past studies argue that large audit firms (such as the Big 4 auditors) may not necessarily provide the reliability of firms’ performance in some countries, and scholars have discovered that Big 4 auditors behave differently in different countries’ economic environments and regulations (Abid et al., 2018). These differences may also lead to an expectation gap amongst audit firms (Olojede et al., 2020), which contradicts S. Chen et al. (2022)’s study, which states that the big audit firms are expected to comply with professional regulations to detect errors and fraud to provide high reasonable assurance. Consequently, this audit expectation gap towards auditors can affect investors’ judgement in the firm’s valuation (Olojede et al., 2020). To support this statement, Piot and Missonier-Piera (2017) found a direct negative association between audit quality and firm value. Meanwhile, Kim et al. (2003) concluded that big audit firms are less effective compared to small audit firms even though they have more resources to leverage professional expertise in order to add service value. Additionally, Al-Gamrh and Al-dhamari (2014) showed that there is no relationship between audit quality and firm value. Later, S. Chen et al. (2023) indicated that audit quality is low for private companies, especially when they contract with the Big 4, as their priority is to focus on tax savings, which can negatively impact their firm value in the long term (Hope et al., 2012). This is also supported by a survey conducted by Resolve that showed that 29 percent of people have a negative view of the Big 4, which highlighted the scepticism about the value of the service they provide (Tadros, 2023).
The above findings examined the direct relationship between ESG and financial performance. It indicates that contracting with big audit firms will not guarantee the quality of the firm’s performance, and therefore, this uncertainty places investors’ trust and firm value in doubt. So far, only a few studies have considered the moderating role played by audit quality and its impact on ESG and firm value (Dakhli, 2022; Samy El-Deeb et al., 2023), and the results show that audit quality positively moderates the ESG and firm value relationship. As ESG performance and its financial impact are becoming increasingly important to investors in various countries, audit quality may play a critical role in managing agency conflicts between stakeholders and managers (Buchanan et al., 2021). Thus, our study extends previous studies to investigate how audit quality as an external governance mechanism could potentially affect the ESG–firm value relationship. Furthermore, to the best of our knowledge, no prior study has examined the moderating role of audit quality within the Australian context. Therefore, this study empirically investigates how audit quality influences the ESG and firm value relationship in the Australian market. To fill this gap, we developed the following hypothesis:
H3b. 
The relationship between a firm’s ESG performance and its value will be weaker when it has a higher-quality auditor.

3. Data and Methodology

3.1. Sample and Data Description

A quantitative research methodology is used to examine the relationship between firms’ ESG performance, firm value, supply chain contracts, and board independence and audit quality. The sample period is from the ASX between 2012 and 2021. The initial sample comprised 3000 companies. Among them, 844 firms reported ESG performance, including corporate governance factors, and disclosed their supply chain partners. All the data were obtained from the Refinitiv Eikon database, which provides world-wide comprehensive financial and non-financial data specifically of environmental, social, and governance indicators. The following section provides the variable measurement.

3.2. Variable Definition and Measurements

3.2.1. Independent Variables

ESG Performance

Following prior studies, we use ESG scores to measure firms’ ESG performance (Refinitiv, 2022; Zhou et al., 2025). ESG is considered a key indicator of a firm’s non-financial performance and is linked to socially responsible investment, which involves promoting innovation and improving a firm’s economic and social reputation by generating shared value (Porter & Kramer, 2018). Following prior studies, we use ESG scores to measure firms’ ESG performance (Refinitiv, 2022; Zhou et al., 2025). ESG scores are designed to capture firms’ ESG indicators of large corporations, particularly public organisations (Drempetic et al., 2020). It plays an important role in assessing the transparency of a firm’s ESG disclosure by implementing multiple indicators (Chouaibi & Affes, 2021). In our study, we focus on the impact of ESG using the three ESG scoring systems from one of the largest ESG agencies, Refinitiv Eikon Asset 4 coverage (Refinitiv, 2022). This database provides full security and reliability of Asset 4 ESG data since 2002 and can be reviewed as scores or raw data of the Asset 4 data framework at all levels in Microsoft Excel format (Ribando & Bonne, 2010).
ESG scores contain three main pillars, with 18 subcategory scores combined with 278 key performance indicators: environmental (e.g., resource use, emissions, innovation), social (e.g., workforce, human rights, community), and corporate governance (board management, shareholders, CSR strategy) (Ribando & Bonne, 2010). Meanwhile, ESG scores represent the quantitative aspect of ESG performance, which is normalised on a scale from 0 to 100. A score of 100 means that firms provide complete ESG information, while a score of 0 is assigned to firms that do not disclose any ESG information (Gholami et al., 2022). Hence, it is believed that this quantitative measure provides an important contribution to a firm’s ESG strategies in terms of capturing firm value (Clément et al., 2023).

3.2.2. Dependent Variables

Firm Value

Firm value (FV) is measured using accounting measures, namely, return on assets (ROA) and return on equity (ROE) (Gull et al., 2022; H. U. Rahman et al., 2023; Z. Wu et al., 2023). ROA is calculated as the ratio of net income divided by the book value of total assets (Gull et al., 2022), and ROE is measured as the ratio between the net income divided by the book value of total equity (Keter et al., 2023). It is logical to use both measurements. ROA indicates how a firm is effectively using its assets to generate profits, and when ROA is higher, investors value the firm more, which leads to higher market capitalisation (H. U. Rahman et al., 2023). On the other hand, ROE is considered an important financial indicator for investors to evaluate how effectively a firm is using shareholders’ equity to generate profits. Higher ROE provides positive signals to investors, as it indicates strong firm performance and can lead to higher share prices or firm value (Keter et al., 2023).

3.2.3. Moderating Variables

Supply Chain Contracting

Supply chain contracting is proxied as the natural logarithm of the number of business suppliers and the number of business customers of each sample firm selected, covering 40 industries. This helps to ensure firms’ ESG score reflects their ESG performance in all fields. The number of business suppliers and customers changes each year according to the Refinitiv database update. Following the prior study conducted by Zhou et al. (2025), the number of suppliers and customers is recorded as zero if no supply chain data were reported during a specific time.

Board Independence

Board independence is measured by the percentage of independent directors on the board each year (Fan et al., 2020). This means the independent board members have no direct relationship with the firm’s executives to ensure objectivity in the decision-making process, such as providing guidance on ESG initiatives.

Audit Quality

The choice of auditor may affect the association between a firm’s ESG performance and firm value, so we use two audit-based variables to test audit quality (Huguet & López Gandía, 2016). Audit quality refers to whether a firm’s ESG reports are audited by the Big 4 auditing firms or not (Zahid et al., 2023). These data are collected based on each year’s record on Refinitiv. Audit quality equals one if a firm’s ESG report is audited by the Big 4, otherwise it is zero (Zahid et al., 2023).

3.2.4. Control Variables

Following previous studies, this study includes several control variables to measure the relationship between ESG and firm value at both the firm and governance levels (Keter et al., 2023; Z. Wu et al., 2023). At the firm level, we control the firm size, firm age, operating cash flow, debt ratio, R&D capital, and ESG report dummy. Firm size is measured as the natural log of total assets. Prior studies indicate that firm size is considered an important factor to determine firm value (Keter et al., 2023; Sudiyatno et al., 2020). Firm size shows firms’ ability to produce more goods and services, and they have a powerful influence on the market, which provides positive signals to investors, leading to an increase in firm value. Firm age is the number of years that a firm has been established (M. J. Rahman & Yilun, 2021). Research showed a strong association between firm age and profitability (H. U. Rahman et al., 2023). When a firm grows older and becomes more mature, it will reduce firms’ uncertainty and risks and therefore will attract more investors so that firm value will increase (Samosir, 2018). We also control firms’ operating cash flow, as it links to a firm’s ability to generate cash and pay its debts directly, which provides a clear picture of predicting future revenues (Barth et al., 2001). A firm’s operating cash flow indicates its ability to meet its short-term obligations (e.g., paying off debts), and a strong operating cash flow can reduce the firm’s financial risks and provide more investment opportunities, which results in a higher firm value (Nikbakht, 2024). The debt ratio is also controlled, as it represents the percentage of a firm’s assets that are financed through debt. Debt ratio directly links to a firm’s capital structure, as the level of debit ratio provides different signals of a firm’s financial risks to investors, so it can affect their investment decisions and future value (Hong, 2017). Research and Development (R&D) expenditure can create intangible assets such as technology, which can significantly increase firm value (Costantiello & Leogrande, 2023). It is also a reflection of a firm’s management strategy and innovation, which signal a long-term commitment to the firm’s continuous growth and can influence their valuation (Manocha & Srai, 2020). R&D cost is measured as the ratio of R&D expenditure to total sales (Costantiello & Leogrande, 2023). In addition, we control the ESG report dummy, which is a binary variable that indicates whether a firm has published an ESG report. Reporting on ESG disclosure is considered a specific element for investors and can impact their investment decisions. It therefore can impact the share value and firm value (Yoon et al., 2018).
To capture governance quality, we control board meetings, board size, and board tenure (Ibrahim & Samad, 2011; Mili & Hashim, 2023). Board meetings refers to the number of board meetings each year. Prior research shows that frequent board meetings provide more opportunities to discuss and implement decisions, and the board can monitor a firm’s performance closely to ensure the directors act in the best interest of shareholders, which can lead to positive firm value (Mili & Hashim, 2023). Board size is proxied as the natural logarithm of the number of directors on the board. Previous research showed a strong association between board size and firm value (Ibrahim & Samad, 2011). Board tenure is another control variable, which is measured as the average time in a year that a firm’s board of directors has served. Prior research shows that longer-tenured directors are more experienced and can provide better advice, which leads to a positive effect on firm value (Livnat et al., 2021). The list of variables is described in Table 1.

3.2.5. Empirical Models

This study used appropriate panel data regression models to examine the impact of ESG on firm value, and the moderating role of supply chain contracts, board independence, and audit quality.
To examine the impact of ESG on firm value (H1), the following regression model is developed:
F i r m V a l u e i , t = α 0 + α 1 E S G i , t 1 + α n C o n t r o l s i , t 1 + I n d u s t r y + Y e a r + ε i , t
where for firm i in year t, firm value is the dependent variable, and ESG score is the independent variable of a firm’s ESG performance. Controls are a set of firm-level and governance-level control variables. Year dummies are included to control for market-wide economic conditions, and industry dummies (based on two-digit SIC codes) are included to control for industry-wide practices. H1 is supported if the coefficient on ESG, α 1 , is expected to be negative and significant.
The following mode is used to examine the moderating role of supply chain contracts on the ESG–firm value nexus (H2):
F i r m V a l u e i , t = α 0 + α 1 E S G i , t 1 + α 2 S C i , t 1 + α 3 E S G i , t 1 S C i , t 1 + α n C o n t r o l s i , t 1   + I n d u s t r y + Y e a r + ε i , t
The influence of the board independence of ESG on firm value (H3a) is examined in the following regression model:
F i r m V a l u e i , t = α 0 + α 1 E S G i , t 1 + α 2 B o a r d I n d e p e n d e n c e i , t 1 + α 3 E S G i , t 1 B o a r d I n d e p e n d e n c e i , t 1 + α n C o n t r o l s i , t 1 + I n d u s t r y + Y e a r + ε i , t
Then, to test the hypothesis that audit quality moderates the relations between ESG and firm value (H3b), our model is developed as follows:
F i r m V a l u e i , t = α 0 + α 1 E S G i , t 1 + α 2 A u d i t Q u a l i t y + α 3 E S G i , t 1 A u d i t Q u a l i t y i , t 1 + α n C o n t r o l s i , t 1 + I n d u s t r y + Y e a r + ε i , t

4. Results and Discussion

4.1. Descriptive Statistics

Table 2 demonstrates the descriptive statistics and correlation matrix for the variables used in this study. The average value of the ESG score is 5.27, which is consistent with prior ESG studies (Priem & Gabellone, 2024). We also calculate variance inflation factors (VIF) for each variable to test for multicollinearity. The mean VIF value is 1.74 (ranging from 1.04 to 4.11), indicating that multicollinearity is not a concern for our sample.

4.2. Empirical Results

4.2.1. ESG and Firm Value (H1)

Table 3 demonstrates the results of the ESG impact on firm performance. The results indicate that each incremental improvement in ESG score corresponds to a 0.7 percentage point increase in ROA. This relationship is even stronger and more evident for ROE, where a single unit improvement in ESG score translates to a 1.7 percentage point increase in ROE, which continues to support our prediction of H1 that there is a positive association between ESG and firm value. Hence, our results are consistent with the findings of prior studies (Dam & Scholtens, 2015; Velte, 2019). This indicates that firms with strong ESG performance have a better understanding and better strategies to manage environmental and social issues, as well as governance scandals, which minimise potential operational risks and costs and thus positively influence firm value (Aouadi & Marsat, 2018). When firms experience efficient operation, their reputation increases, and as a result, firms have better access to capital by attracting more investment from investors, particularly those with high ESG initiatives. Hence, this can translate into increased trust from stakeholders and demand for shares, which increases firm value (Yu & Xiao, 2022).
With control variables, we have observed some noteworthy relationships between operational metrics and firm performance. Operating cash flow indicates a powerful influence on a firm’s financial success, showing the strongest relationship among all control variables. The coefficient for ROA is 0.338, while the coefficient ROE is even higher, at 0.387, which demonstrates a high significance level. Similarly, R&D capital is also highly associated with ROA and ROE, with positive effects, with coefficients of 0.403 and 1.202 for ROE. This relationship indicates that a strong supply chain can amplify the benefits of innovation, reduce risks, and ultimately contribute to long-term sustainable growth (Kong et al., 2023).
Meanwhile, our results showed subtle and complex relationships for firm size, board meetings, board size, and board tenure. Firm size is positively related to firm performance, particularly in ROE (0.025), compared to ROA (0.010). This finding is consistent with the findings of previous studies (Keter et al., 2023; Sudiyatno et al., 2020). In contrast, firm age provides a different result. Older firms showed an insignificant negative relationship with firm value, with −0.006 for ROA and –0.021 for ROE. This could be due to mature firms possibly demanding higher operational and maintenance costs, which can significantly reduce firm value (C. X. Chen et al., 2012). Interestingly, control variables such as board meetings, board size, and board tenure at governance level showed minimal impact on firm value, which is supported by previous studies (Siagian et al., 2013).
The findings of H1 demonstrate the fact that both ROA and ROE share similar patterns and relationships with firms’ ESG performance. The stronger impact on ROE compared to ROA provides useful insights to firms about how ESG performance can impact how effectively a firm can utilise shareholders’ equity.

4.2.2. Moderating Effect of Supply Chain Partners (H2)

Table 4 presents the results to examine the moderating impact of supply chain partners on firms’ ESG performance and firm value, testing H2. The results indicate that while ESG performance can positively affect firm performance, this effect varies across organisational contexts. In particular, the strength of a firm’s supply chain contracts plays a crucial role in determining the amount of benefit the firm can receive from its ESG investment.
Table 4 also shows that ESG performance has a significant positive relationship with both return on assets (ROA) and return on equity (ROE), at (0.006, p < 0.05) and (0.014, p < 0.05), respectively. This indicates that firms that invest in strong ESG practices tend to receive better financial results (S. Wu et al., 2022). In addition, supply chain has a negative impact on ROA (−0.029, p < 0.01) and ROE (−0.062, p < 0.05), suggesting that contracting with supply chain partners adds complexity to the firm’s management system, which exposes it to global risks (Christopher et al., 2011). However, among the moderating variables, we have noticed that the significant positive impact of ESG performance diminishes when the number of supply chain contracts increases. Table 4, Panel A, Column 1 shows that for every unit increase in supply chain contract, the positive effect of ESG and ROA decreases by 1.3%, while its effect on ROE decreases by 2.3%, as shown in Table 4, Panel A, Column 2. This result is consistent with prior studies, which indicate that managing a large number of supply contracts may cause imbalanced supply and demand of firms, which can dilute the impact of ESG activities (Golicic & Smith, 2013). If a firm resorts to less sustainable practices to maintain the supply chain, the positive relationship between ESG and firm value might weaken, particularly at the higher levels of the moderator variable (Tsang et al., 2024). As a result, firms may struggle to provide a high level of ESG performance to investors, which could decrease firm value. Therefore, H2 is supported.

4.2.3. Moderating Effect of Board Independence (H3a)

Table 5 presents the results of the moderating impact of board independence on firms’ ESG performance and firm value, testing H3a. The results show a positive relationship between firms’ ESG performance and ROA and ROE, and the strongest effect is indicated in ROA, Column 2, at 0.017 (p < 0.01) and ROE, Column 4, at 0.037 (p < 0.01). This finding is consistent with prior studies (Fan et al., 2020), which indicate that highly independent directors focus on short-term financial returns rather than long-term strategic decisions, which can negatively affect firm value.
In addition, it can be observed that the moderating role of board independence significantly reduces the effectiveness of the relationship between ESG performance and firm value, with the coefficient of the interaction term ESGScore*Board independence being negative and significant for ROA at −0.111 (p < 0.05) and being negative and marginally significant for ROE at −0.212 (p < 0.1). This suggests that when the negative effect of board independence is strong, it moderates the relationship between ESG performance and firm value. This finding is consistent with prior studies, which indicate that highly independent directors focus on short-term financial returns rather than long-term strategic decisions, which can negatively affect firm value (Fan et al., 2020). The negative moderating effect also demonstrates that independent directors may lack ESG expertise, which may undervalue the long-term benefit of strong ESG efforts. As a result, it can dilute the positive influence of ESG performance on firms’ long-term valuation (Souther, 2021). Thus, H3a is supported.

4.2.4. Moderating Effect of Audit Quality (H3b)

Table 6 lists the descriptive statistics for all variables to examine the moderating impact of audit quality on firms’ ESG performance and firm value, testing H3b. The moderating outcomes from Table 6 reveal similar findings as board independence in Table 5. When we measure the effect of audit quality on ROA and ROE, the results of ROA Column 1 and ROE Column 3 show a strong negative impact on firm performance (−0.026 and −0.052, p < 0.05), while ROA Column 2 and ROE Column 4 show a positive relationship with firm performance, although insignificant (0.038 and 0.072). These outcomes demonstrate that firm value can be affected by the quality of the audit (Sattar et al., 2020).
Furthermore, our findings indicate that audit quality has significantly reduced the positive relationship between ESG performance and firm value for both ROA and ROE. The negative effects of audit quality on ESG performance and ROA is −0.012 (p < 0.01) and on ESG performance and ROE is −0.023 (p < 0.05). This finding supports previous studies by Kim et al. (2003) that indicate that big audit firms may be less efficient compared to small companies, which provides firms opportunities to selectively disclose their ESG activities, which will reduce the firm value in the long term. Thus, H3b is supported.

4.3. Robustness and Endogenity Tests

In this section, we perform several robustness tests to further validate our results. The control variables are comparable to the main tests, so, we do not include our control variables.

4.3.1. Alternative Measure of Supply Chain Contacts

To corroborate the results for the moderating effect of supply chain contracts, we additionally examine whether the numbers of suppliers and the number of customers have different impacts. Panel A of Table 7 indicates that ESG performance has a significant positive effect on ROA (0.007, p < 0.01) and ROE (0.033, p < 0.01), which indicates that when firms have high-quality ESG performance, it can lead to successful business operations with sustainable returns, so firm value will increase (S. Chen et al., 2023). Meanwhile, we also find that the number of suppliers is also positively related to ROA (0.034, p < 0.05) and ROE (0.091, p < 0.01), suggesting that contracting with more suppliers can reduce firms’ costs by negotiating a better price among diversified supplier. This can improve the efficiency of their working capital, which directly contributes positively to ROA and ROE, and, consequently, firm value (Chatain, 2011).
However, the positive relationship between ESG performance and ROA and ROE becomes weaker when the number of suppliers increases, at −0.006 and −0.017, respectively, as shown in Panel A, Panel B. This finding indicates that a diverse supplier network can hinder firms’ ability to collaborate with suppliers to ensure transparency in ESG performance. Consequently, this can result in higher monitoring costs for firms, a decline in reputation, and a corresponding decrease in firm value (Diego & Montes-Sancho, 2024).
Panel B of Table 7 indicates a positive association between ESG performance and firm value when the influence of customers is considered. It can be seen from ROA Columns 1 and 2) that ESG performance and ROA are significantly positively related at (0.006, p < 0.05; 0.008, p < 0.01). Similarly, ROE Columns 3 and 4 also demonstrate a strong positive relationship with ESG performance, at 0.014, p < 0.05, and 0.017, p < 0.05, respectively. This is consistent with prior studies that indicate that when firms have better access to generated benefits from ESG activities, their ROA and ROE are increased, and therefore, firm value is increased (E. H. Kao et al., 2018; Pedersen et al., 2021). This result also aligns with prior studies that indicate that firms with strong ESG performance can improve stakeholders’ and shareholders’ trust, reduce risks, and enhance firm performance (Yu & Xiao, 2022).
Interestingly, our research finds that when the number of customers increases, it harms both ROA and ROE. Similarly, the large diversity of customers also negatively moderates the relationship between EGS and firm value, at −0.003 for both ROA and ROE. This result is statistically insignificant, and it indicates that a large number of business customers may increase the risk and inefficiency of producing high-quality ESG reports for firms, which can harm firm performance (Xie et al., 2019). Our results also demonstrate that although the increased number of customers can lead to increased sales revenue, if firms cannot invest the revenue efficiently, it can lower their valuation.

4.3.2. Excluding the COVID-19 Period

The recession period might heighten concerns about time-series aggregation, as firms may exhibit different levels of marketing efforts during this time (Cheng et al., 2024). To ensure the robustness of our results, we re-analyse our main regressions after excluding the recession period, especially the period for the COVID-19 years of 2020 and 2021. We find that the results in Table 8 remain unaffected by the recession environment.

4.3.3. Weighted Least Squares

Our sample is an unbalanced panel dataset, and is unevenly distributed across industries and years, potentially driving estimation bias. To address the concern related to the unbalanced sample, we employed the weighted least squares to maximise our parameter estimation. The results in Table 9 show that our results are largely consistent with our main findings.

4.3.4. Propensity Score-Matching Method

To provide further evidence that our results are not driven by observable firm characteristics, we employ a propensity score-matching (PSM) method developed by Rosenbaum and Rubin (1983) and widely used by many accounting and finance studies (Cheng et al., 2024; Shipman et al., 2017). We conduct the matching procedure on our treatment group, defined as firms with higher ESG scores (ESGScoreDum = 1), versus a control group of firms with lower ESG scores (ESGScoreDum = 0). The matching procedure consists of the following steps. First, we estimate a Probit model to calculate the probability of treatment for firms with higher ESG scores. We then use the coefficients from the Probit model to calculate a propensity score for each firm, indicating the likelihood of treatment conditional on a set of covariates (the same control variables reported in our main analysis). Second, we employ one-to-one nearest-neighbour matching without replacement, pairing each firm-year observation in the treatment group with a firm-year observation in the control group that has the closest propensity score. Panel A of Table 10 displays the average treatment effect on the treated (ATT), which is the average difference between the ROA (or ROE) of the treatment group and the control group. The values of ATT are positive and significant, indicating that the treatment firms with higher ESG scores are associated with higher firm value compared to the control firms with lower ESG scores. Panels B and C of Table 10 reports the results of the post-match regression analysis. Our findings remain largely unchanged, suggesting that potential omitted control variables do not significantly impact our main findings.

5. Conclusions, Limitations, and Future Research

5.1. Theoretical Contributions

This study examined the ESG–firm value relationship and the moderating effect of supply chain contracts and the corporate governance mechanism on this relationship. The regression model was used to examine data obtained from 751 firm-year observations from ASX-listed firms. It has been revealed that firms’ ESG performance can positively contribute to the improvement of firm value. The positive relationship between firms’ ESG performance and firm value is consistent with many other studies that advocate for improving ESG activities (Dam & Scholtens, 2015; E. H. Kao et al., 2018; Pedersen et al., 2021; Velte, 2017; Yu & Xiao, 2022). The study confirms that by adopting stakeholder theory, firms should be actively and strategically focused on improving non-financial performance from a broader perspective, such as employees, customers, suppliers, and communities, in addition to shareholders (Diez-Cañamero et al., 2020; Freeman et al., 2010). This will reinforce trust and collaboration amongst all stakeholders, and increase the firm’s reputation by building a long-term relationship, which can translate the benefit into the firm’s financial value. Consequently, firms can invest in ESG activities such as technologies, employee satisfaction, and governance practices and integrate them into their business strategies, with the subsequent promotion of firms’ ESG processes (Samad et al., 2021). When firms can demonstrate a high level of ESG performance to various stakeholders, it will attract more investors to contribute more capital to the business and hence increase firm value.
We also examined whether this positive relationship between firms’ ESG performance and firm value was moderated by supply chain contracting and corporate governance. Little research has taken the moderating effects of both factors into account, which is particularly true in the Australian context (Le Tran & Coqueret, 2023). The combination of both moderators led to a better understanding of the associations of both internal and external governance, along with firms’ overall ESG performance, while examining the application of supply chain contracts. The results reveal that the positive relationship between firms’ ESG performance and firm value is diluted when a firm’s supply chain network is extensive. In addition, the negative moderating effect of suppliers is significantly impacted by a firm’s ESG performance and firm value, while the moderating effect of customers is insignificant.
Finally, our research found that the association between firms’ ESG reporting and their performance is negatively moderated by board independence and audit quality. While a high level of ESG performance usually tends to indicate that a firm is committed to the best interests of its stakeholders, board independence and audit quality have limited the ability of managers to translate ESG initiatives into financial benefits. From the stakeholder theory perspective, our findings suggest that although firms adopt stakeholder-orientated strategies, not all governance structures can create value for firms.

5.2. Practical Contributions

This study provides some practical implications for managers, firms, investors, and policymakers to better enhance firm value.
ESG performance provides valuable insights for boards and executives to navigate ESG activities more effectively to meet stakeholder expectations. Our findings highlight that while ESG investments are beneficial to firm performance, managers should recognise that both internal and external governance practices such as board independence and audit quality can constrain their financial returns. The findings suggest that managers should develop ESG strategies that balance firms’ ESG initiatives and governance mechanisms to enhance firm value. Meanwhile, our findings provide useful suggestions to firms to broaden their performance evaluation structures to balance financial benefits with ESG outcomes by establishing ESG committees or recruiting directors with ESG backgrounds to keep all board members updated on best ESG practice (Gutterman, 2023).
Our findings also provide important practical insights for firms to ensure the transparency of ESG performance among the supply chain partners. This suggests that firms should focus on improving the effectiveness of business relationships with suppliers to gain better access to new resources and thereby increase their competitive advantage and business value.
Moreover, as strong ESG performance sends a positive signal to investors, it is useful for them to develop and implement criteria for evaluating firm performance that take into account the nature of firms’ supply chains and governance arrangements. This is because our results show that these factors can influence the effectiveness of ESG performance and how it can translate into shareholder value. Similarly, policymakers can also consider these factors when implementing regulations and guidelines to promote a fair and transparent ESG reporting system to help firms and investors better understand these moderating effects.

5.3. Limitations and Future Research

This study focuses on ASX-listed firms within the Australian market dynamics and ESG framework. However, stakeholders’ expectations, investor preferences, cultural expectations, and regulatory environment for ESG disclosure standards may vary compared to other countries. Therefore, similar studies in other countries or the comparative market are recommended to enhance the generalisability of the findings. Another limitation of this study is that we did not explicitly investigate specific sectors in ESG performance. Industries may differ in terms of environmental and social impacts, stakeholder expectations, and regulatory pressures, resulting in various ESG and firm value relationships. Future research could investigate industries in detail to gain a clear understanding of industry-specific ESG performance and provide deeper insights and recommendations. In addition, our study is limited in establishing a definitive causal direction between ESG performance and firm value. While our theoretical framework and analysis indicate that ESG activities can enhance firm value, there is a possibility of reverse causality; that is, firms with higher financial performance may have better access to resources to invest in ESG activities. Hence, future research could implement methods such as instrumental variable approaches or Granger causality tests to clearly identify the causality. In addition, this research primarily used the quantitative analysis methodology, so future research could implement other research methodologies such as qualitative methods to conduct analysis by considering different industries to track how changes in ESG activities could affect firm performance over time within the same supply chain and corporate governance context. Additionally, future studies could adopt qualitative methodologies such as interviews or in-depth case studies to provide a deeper understanding of how managers can maintain and maximise the best interests of stakeholders within the constraints of governance mechanisms and supply chain contracts.
Meanwhile, while this study applied stakeholder theory to explain the relationship between ESG performance and firm value, this relationship can also be examined from other theoretical perspectives. Hence, for future research, adopting alternative theories such as resource dependence theory, legitimacy theory, institutional theory, and signalling theory could broaden the understanding of firms’ ESG performance as well as how this can be influenced by the moderating factors (board independence, audit quality, and supply chain contracts).
Furthermore, the moderating effects on the weaker relationship between ESG performance and firm value may also be influenced by other factors, making it difficult to conclude whether supply chain contracts, board independence, and audit quality can limit firm value independently. Future research could examine other factors such as executive characteristics, industry background, or innovation in supply chain strategies to gain a more comprehensive understanding of how ESG performance and firm value may be affected under different environments.

Author Contributions

Conceptualization, J.Z., W.H.S., A.K.H. and H.S.; methodology, J.Z., W.H.S. and H.S.; software, J.Z. and W.H.S.; validation, J.Z., W.H.S. and S.C.; formal analysis, J.Z.; investigation, J.Z. and A.K.H.; resources, J.Z.; data curation, J.Z., W.H.S., H.S. and S.C.; writing—original draft preparation, J.Z.; writing—review and editing, J.Z., W.H.S., A.K.H. and H.S.; visualization, J.Z.; supervision, A.K.H., W.H.S., H.S. and S.C.; project administration, J.Z. All authors have read and agreed to the published version of the manuscript.

Funding

This research received no external funding.

Institutional Review Board Statement

Not applicable.

Informed Consent Statement

Not applicable.

Data Availability Statement

The data used in this study is available from the Refinitiv (now named LSEG) at https://www.lseg.com.

Conflicts of Interest

The authors declare no conflicts of interest.

Abbreviation

The following abbreviation is used in this manuscript:
ESGEnvironment, social, and governance

References

  1. Abid, A., Shaique, M., & Anwar ul Haq, M. (2018). Do big four auditors always provide higher audit quality? Evidence from Pakistan. International Journal of Financial Studies, 6(2), 58. [Google Scholar] [CrossRef]
  2. Abraham, R., El Chaarani, H., & Tao, Z. (2024). The impact of audit oversight quality on the financial performance of U.S. firms: A subjective assessment. Journal of Risk and Financial Management, 17(4), 151. [Google Scholar] [CrossRef]
  3. Agyabeng-Mensah, Y., Ahenkorah, E., Afum, E., Nana Agyemang, A., Agnikpe, C., & Rogers, F. (2020). Examining the influence of internal green supply chain practices, green human resource management and supply chain environmental cooperation on firm performance. Supply Chain Management: An International Journal, 25(5), 585–599. [Google Scholar] [CrossRef]
  4. Ahmed, W., Khan, M. A., Najmi, A., & Khan, S. A. (2023). Strategizing risk information sharing framework among supply chain partners for financial performance. Supply Chain Forum: An International Journal, 24(2), 233–250. [Google Scholar] [CrossRef]
  5. Al-Gamrh, B., & Al-dhamari, R. (2014). Firm characteristics and corporate social responsibility disclosure in Saudi Arabia [Working Paper (International Business Management)]. Available online: https://ssrn.com/abstract=2907396 (accessed on 24 April 2025).
  6. Aouadi, A., & Marsat, S. (2018). Do ESG controversies matter for firm value? Evidence from international data. Journal of Business Ethics, 151(4), 1027–1047. [Google Scholar] [CrossRef]
  7. Armour, C., Hunt, D., & Lwin, J. ((2023,) September Quarter). Green and sustainable finance in Australia; Reserve Bank of Australia Bulletin. Available online: https://rba.gov.au/publications/bulletin/2023/sep/pdf/bulletin-2023-09.pdf (accessed on 24 April 2025).
  8. ASIC. (2022). Improving and maintaining audit quality. Available online: https://asic.gov.au/regulatory-resources/financial-reporting-and-audit/auditors/improving-and-maintaining-audit-quality/#why (accessed on 24 April 2025).
  9. Bacha, S., Ajina, A., & Ben Saad, S. (2021). CSR performance and the cost of debt: Does audit quality matter? Corporate Governance, 21(1), 137–158. [Google Scholar] [CrossRef]
  10. Baid, V., & Jayaraman, V. (2022). Amplifying and promoting the “S” in ESG investing: The case for social responsibility in supply chain financing. Managerial Finance, 48(8), 1279–1297. [Google Scholar] [CrossRef]
  11. Barnea, A., & Rubin, A. (2010). Corporate social responsibility as a conflict between shareholders. Journal of Business Ethics, 97(1), 71–86. [Google Scholar] [CrossRef]
  12. Barney, J. (1991). Special theory forum the resource-based model of the firm: Origins, implications, and prospects. Journal of Management, 17(1), 97–98. [Google Scholar] [CrossRef]
  13. Barth, M. E., Cram, D. P., & Nelson, K. K. (2001). Accruals and the prediction of future cash flows. The Accounting Review, 76(1), 27–58. [Google Scholar] [CrossRef]
  14. Bashir, Y., Zhao, Y., Qiu, H., Ahmed, Z., & Yau, J. T.-H. (2023). Environmental, social, and governance performance and value creation in product market: Evidence from emerging economies. Journal of Risk and Financial Management, 16(12), 517. [Google Scholar] [CrossRef]
  15. Behl, A., Kumari, P. S. R., Makhija, H., & Sharma, D. (2022). Exploring the relationship of ESG score and firm value using cross-lagged panel analyses: Case of the Indian energy sector. Annals of Operations Research, 313(1), 231–256. [Google Scholar] [CrossRef]
  16. Bhimavarapu, V. M., Rastogi, S., Gupte, R., Pinto, G., & Shingade, S. (2022). Does the impact of transparency and disclosure on the firm’s valuation depend on the ESG? Journal of Risk and Financial Management, 15(9), 410. [Google Scholar] [CrossRef]
  17. Buchanan, J. L., Commerford, B. P., & Wang, E. (2021). Auditor actions and the deterrence of manager opportunism: The importance of communication to the board and consistency with peer behavior. The Accounting Review, 96(3), 141–163. [Google Scholar] [CrossRef]
  18. Bukari, A., Agyemang, A. O., & Bawuah, B. (2024). Assessing the moderating role of ESG performance on corporate governance and firm value in developing countries. Cogent Business & Management, 11(1). [Google Scholar] [CrossRef]
  19. Chang, W., Ellinger, A. E., Kim, K., & Franke, G. R. (2016). Supply chain integration and firm financial performance: A meta-analysis of positional advantage mediation and moderating factors. European Management Journal, 34(3), 282–295. [Google Scholar] [CrossRef]
  20. Charles, A., Lauras, M., Van Wassenhove, L., Tatham, P., & Pettit, S. (2010). A model to define and assess the agility of supply chains: Building on humanitarian experience. International Journal of Physical Distribution & Logistics Management, 40(8/9), 722–741. [Google Scholar] [CrossRef]
  21. Chatain, O. (2011). Value creation, competition, and performance in buyer-supplier relationships. Strategic Management Journal, 32(1), 76–102. [Google Scholar] [CrossRef]
  22. Chen, C. X., Lu, H., & Sougiannis, T. (2012). The Agency problem, corporate governance, and the asymmetrical behavior of selling, general, and administrative costs. Contemporary Accounting Research, 29(1), 252–282. [Google Scholar] [CrossRef]
  23. Chen, S., Krishnan, G. V., Li, W., & Zhang, Y. (2022). Do big 4 auditors enhance audit quality in China? A “behind the scenes look”. Journal of International Accounting Research, 21(2), 31–56. [Google Scholar] [CrossRef]
  24. Chen, S., Song, Y., & Gao, P. (2023). Environmental, social, and governance (ESG) performance and financial outcomes: Analyzing the impact of ESG on financial performance. Journal of Environmental Management, 345, 118829. [Google Scholar] [CrossRef] [PubMed]
  25. Cheng, R., Kim, H., & Ryu, D. (2024). ESG performance and firm value in the Chinese market. The Investment Analysts Journal, 53(1), 1–15. [Google Scholar] [CrossRef]
  26. Chouaibi, S., & Affes, H. (2021). The effect of social and ethical practices on environmental disclosure: Evidence from an international ESG data. Corporate Governance, 21(7), 1293–1317. [Google Scholar] [CrossRef]
  27. Christopher, M., Mena, C., Khan, O., & Yurt, O. (2011). Approaches to managing global sourcing risk. Supply Chain Management, 16(2), 67–81. [Google Scholar] [CrossRef]
  28. Clément, A., Robinot, É., & Trespeuch, L. (2023). The use of ESG scores in academic literature: A systematic literature review. Journal of Enterprising Communities, 19(1), 92–110. [Google Scholar] [CrossRef]
  29. Costantiello, A., & Leogrande, A. (2023). The impact of research and development expenditures on ESG model in the global economy. Available online: https://ssrn.com/abstract=4414232 (accessed on 24 April 2025). [CrossRef]
  30. Dakhli, A. (2022). The impact of corporate social responsibility on firm financial performance: Does audit quality matter? Journal of Applied Accounting Research, 23(5), 950–976. [Google Scholar] [CrossRef]
  31. Dam, L., & Scholtens, B. (2015). Toward a theory of responsible investing: On the economic foundations of corporate social responsibility. Resource and Energy Economics, 41, 103–121. [Google Scholar] [CrossRef]
  32. de Villiers, C., Naiker, V., & van Staden, C. J. (2011). The effect of board characteristics on firm environmental performance. Journal of Management, 37(6), 1636–1663. [Google Scholar] [CrossRef]
  33. Diego, J., & Montes-Sancho, M. J. (2024). Nexus supplier transparency and supply network accessibility: Effects on buyer ESG risk exposure. International Journal of Operations & Production Management, 45(4), 895–924. [Google Scholar] [CrossRef]
  34. Diez-Cañamero, B., Bishara, T., Otegi-Olaso, J. R., Minguez, R., & Fernández, J. M. (2020). Measurement of corporate social responsibility: A review of corporate sustainability indexes, rankings and ratings. Sustainability, 12(5), 2153. [Google Scholar] [CrossRef]
  35. Dincă, M. S., Vezeteu, C.-D., & Dincă, D. (2022). The relationship between ESG and firm value. Case study of the automotive industry. Frontiers in Environmental Science, 10, 1059906. [Google Scholar] [CrossRef]
  36. Donaldson, L., & Davis, J. H. (1991). Stewardship theory or agency theory: CEO governance and shareholder returns. Australian Journal of Management, 16(1), 49–64. [Google Scholar] [CrossRef]
  37. Dong, Y., Liang, C., & Wanyin, Z. (2023). Board diversity and firm performance: Impact of ESG activities in China. Economic Research-Ekonomska Istraživanja, 36(1), 1592–1609. [Google Scholar] [CrossRef]
  38. Drempetic, S., Klein, C., & Zwergel, B. (2020). The influence of firm size on the ESG score: Corporate sustainability ratings under review. Journal of Business Ethics, 167(2), 333–360. [Google Scholar] [CrossRef]
  39. Duan, Y., Yang, F., & Xiong, L. (2023). Environmental, social, and governance (ESG) performance and firm value: Evidence from Chinese manufacturing firms. Sustainability, 15(17), 12858. [Google Scholar] [CrossRef]
  40. Duque-Grisales, E., & Aguilera-Caracuel, J. (2021). Environmental, social and governance (ESG) scores and financial performance of multilatinas: Moderating effects of geographic international diversification and financial slack. Journal of Business Ethics, 168(2), 315–334. [Google Scholar] [CrossRef]
  41. Ernst & Young. (2021). Is your ESG data unblocking long-term value? E. Young. Available online: https://www.ey.com/en_gl/insights/assurance/is-your-esg-data-unlocking-long-term-value (accessed on 24 April 2025).
  42. Fakhfakh, I., & Jarboui, A. (2021). The moderating role of audit quality on the relationship between auditor reporting and earnings management: Empirical evidence from Tunisia. EuroMed Journal of Business, 16(4), 416–430. [Google Scholar] [CrossRef]
  43. Fan, Y., Jiang, Y., Kao, M.-F., & Liu, F. H. (2020). Board independence and firm value: A quasi-natural experiment using Taiwanese data. Journal of Empirical Finance, 57, 71–88. [Google Scholar] [CrossRef]
  44. Fatemi, A., Glaum, M., & Kaiser, S. (2018). ESG performance and firm value: The moderating role of disclosure. Global Finance Journal, 38, 45–64. [Google Scholar] [CrossRef]
  45. Freeman, R. E., Harrison, J. S., Wicks, A. C., Purnell, L., & de Colle, S. (2010). Stakeholder theory: The state of the art. The Academy of Management Annals, 4(1), 403–445. [Google Scholar] [CrossRef]
  46. Friede, G., Busch, T., & Bassen, A. (2015). ESG and financial performance: Aggregated evidence from more than 2000 empirical studies. Journal of Sustainable Finance & Investment, 5(4), 210–233. [Google Scholar] [CrossRef]
  47. Fu, H., Jiang, Q., Cifuentes-Faura, J., & Chen, Q. (2024). Corporate environmental governance and firm value: Beyond greenwashing for sustainable development. Environment, Development and Sustainability, 26, 1–18. [Google Scholar] [CrossRef]
  48. Gebhardt, M., Beck, J., Kopyto, M., & Spieske, A. (2022). Determining requirements and challenges for a sustainable and circular electric vehicle battery supply chain: A mixed-methods approach. Sustainable Production and Consumption, 33, 203–217. [Google Scholar] [CrossRef]
  49. Gholami, A., Sands, J., & Shams, S. (2022). The impact of corporate ESG performance disclosure across australian industries [Article]. Australasian Accounting, Business and Finance Journal, 16(4), 180–200. [Google Scholar] [CrossRef]
  50. Gibbins, M., Richardson, A., & Waterhouse, J. (1990). The management of corporate financial disclosures: Opportunism, ritualism, policies, and processes. Journal of Accounting Research, 28(1), 121. [Google Scholar] [CrossRef]
  51. Golicic, S. L., & Smith, C. D. (2013). A meta-analysis of environmentally sustainable supply chain management practices and firm performance. Journal of Supply Chain Management, 49(2), 78–95. [Google Scholar] [CrossRef]
  52. Gull, A. A., Saeed, A., Suleman, M. T., & Mushtaq, R. (2022). Revisiting the association between environmental performance and financial performance: Does the level of environmental orientation matter? Corporate Social Responsibility and Environmental Management, 29(5), 1647–1662. [Google Scholar] [CrossRef]
  53. Gutterman, A. (2023). Board oversight of sustainability: A practical guide for directors and advisors. SSRN Electronic Journal. [Google Scholar] [CrossRef]
  54. Hong, S. (2017). The effect of debt choice on firm value. Journal of Applied Business Research, 33(1), 135–140. [Google Scholar] [CrossRef]
  55. Hope, O.-K., Langli, J. C., & Thomas, W. B. (2012). Agency conflicts and auditing in private firms. Accounting, Organizations and Society, 37(7), 500–517. [Google Scholar] [CrossRef]
  56. Hsu, B.-X., Chen, Y.-M., & Chen, L.-A. (2022). Corporate social responsibility and value added in the supply chain: Model and mechanism. Technological Forecasting & Social Change, 174, 121302. [Google Scholar] [CrossRef]
  57. Huang, D. Z. X. (2022). Environmental, social and governance factors and assessing firm value: Valuation, signalling and stakeholder perspectives. Accounting and Finance, 62(S1), 1983–2010. [Google Scholar] [CrossRef]
  58. Huguet, D., & López Gandía, J. (2016). Audit and earnings management in Spanish SMEs. BRQ Business Research Quarterly, 19(3), 171–187. [Google Scholar] [CrossRef]
  59. Ibrahim, H., & Samad, F. A. (2011). Agency costs, corporate governance mechanisms and performance of public listed family firms in Malaysia. South African Journal of Business Management, 42(3), 17–26. [Google Scholar] [CrossRef]
  60. Kao, E. H., Yeh, C.-C., Wang, L.-H., & Fung, H.-G. (2018). The relationship between CSR and performance: Evidence in China. Pacific-Basin Finance Journal, 51, 155–170. [Google Scholar] [CrossRef]
  61. Kao, M.-F., Hodgkinson, L., & Jaafar, A. (2019). Ownership structure, board of directors and firm performance: Evidence from Taiwan. Corporate Governance (Bradford), 19(1), 189–216. [Google Scholar] [CrossRef]
  62. Keter, C. K. S., Cheboi, J. Y., Kosgei, D., & Chepsergon, A. K. (2023). Financial performance and firm value of listed companies: Financial performance measure ROA versus ROE. Journal of Business, Economics and Management Research Studies, 1(3), 1–11. [Google Scholar]
  63. Khoe, J. P., Sutejo, B. S., & Murhadi, W. R. (2024). Corporate governance of firm performance in the non-financial sector for the 2017–2021 period. In Proceedings of the 20th international symposium on management (INSYMA 2023) (pp. 93–98). Atlantis Press. [Google Scholar] [CrossRef]
  64. Kim, J.-B., Chung, R., & Firth, M. (2003). Auditor conservatism, asymmetric monitoring, and earnings management. Contemporary Accounting Research, 20(2), 323–359. [Google Scholar] [CrossRef]
  65. Kong, Y., Agyemang, A., Alessa, N., & Kongkuah, M. (2023). The moderating role of technological innovation on environment, social, and governance (ESG) performance and firm value: Evidence from developing and least-developed countries. Sustainability, 15(19), 14240. [Google Scholar] [CrossRef]
  66. Kozlenkova, I. V., Samaha, S. A., & Palmatier, R. W. (2014). Resource-based theory in marketing. Journal of the Academy of Marketing Science, 42(1), 1–21. [Google Scholar] [CrossRef]
  67. Krüger, P. (2015). Corporate goodness and shareholder wealth. Journal of Financial Economics, 115(2), 304–329. [Google Scholar] [CrossRef]
  68. Kumar, P. (2024). Corporate disclosure and firm value: Do audit quality and foreign listing matter? Journal of Accounting & Organizational Change, 21, 312–334. [Google Scholar] [CrossRef]
  69. Le Tran, V., & Coqueret, G. (2023). ESG news spillovers across the value chain. Financial Management, 52(4), 677–710. [Google Scholar] [CrossRef]
  70. Lev, B., Petrovits, C., & Radhakrishnan, S. (2010). Is doing good good for you? how corporate charitable contributions enhance revenue growth. Strategic Management Journal, 31(2), 182–200. [Google Scholar] [CrossRef]
  71. Lima Crisóstomo, V., de Souza Freire, F., & Cortes de Vasconcellos, F. (2011). Corporate social responsibility, firm value and financial performance in Brazil. Social Responsibility Journal, 7(2), 295–309. [Google Scholar] [CrossRef]
  72. Limkriangkrai, M., Koh, S., & Durand, R. B. (2017). Environmental, social, and governance (ESG) profiles, stock returns, and financial policy: Australian evidence. International Review of Finance, 17(3), 461–471. [Google Scholar] [CrossRef]
  73. Liu, F., Kim, B. C., & Park, K. (2022). Supplier-base concentration as a moderating variable in the non-linear relationship between R&D and firm value. Asian Journal of Technology Innovation, 30(2), 342–363. [Google Scholar] [CrossRef]
  74. Livnat, J., Smith, G., Suslava, K., & Tarlie, M. (2021). Board tenure and firm performance. Global Finance Journal, 47, 100535. [Google Scholar] [CrossRef]
  75. Lokuwaduge, C., & de Silva, K. (2020). Emerging corporate disclosure of environmental social and governance (ESG) risks: An Australian study. Australasian Accounting, Business & Finance Journal, 14(2), 35–50. [Google Scholar] [CrossRef]
  76. Longoni, A., & Cagliano, R. (2018). Inclusive environmental disclosure practices and firm performance: The role of green supply chain management. International Journal of Operations & Production Management, 38(9), 1815–1835. [Google Scholar] [CrossRef]
  77. Maccarrone, P., Illuzzi, A., & Inguanta, S. (2024). Does a change in the ESG ratings influence firms’ market value? Evidence from an event study. Journal of Risk and Financial Management, 17(8), 340. [Google Scholar] [CrossRef]
  78. Malik, M. (2015). Value-enhancing capabilities of CSR: A brief review of contemporary literature. Journal of Business Ethics, 127(2), 419–438. [Google Scholar] [CrossRef]
  79. Manocha, P., & Srai, J. S. (2020). Exploring environmental supply chain innovation in M&A. Sustainability, 12(23), 10105. [Google Scholar] [CrossRef]
  80. Meckling, W. H., & Jensen, M. C. (1976). Theory of the firm: Managerial behavior, agency costs and ownership structure. Social Science Research Network, 3(4), 205–360. [Google Scholar] [CrossRef]
  81. Mendiratta, A., Singh, S., Yadav, S. S., & Mahajan, A. (2023). When do ESG controversies reduce firm value in India? Global Finance Journal, 55, 100809. [Google Scholar] [CrossRef]
  82. Mili, S. A., & Hashim, F. (2023). Board attributes and firm value: The moderating role of board meeting frequency. Global Business and Management Research, 15(3), 337–352. [Google Scholar]
  83. Moosavi, J., Fathollahi-Fard, A. M., & Dulebenets, M. A. (2022). Supply chain disruption during the COVID-19 pandemic: Recognizing potential disruption management strategies. International Journal of Disaster Risk Reduction, 75, 102983. [Google Scholar] [CrossRef] [PubMed]
  84. Moursli, R. M. (2020). The effects of board independence on busy directors and firm value: Evidence from regulatory changes in Sweden. Corporate Governance: An International Review, 28(1), 23–46. [Google Scholar] [CrossRef]
  85. Nekhili, M., Boukadhaba, A., Nagati, H., & Chtioui, T. (2021). ESG performance and market value: The moderating role of employee board representation. International Journal of Human Resource Management, 32(14), 3061–3087. [Google Scholar] [CrossRef]
  86. Nikbakht, Z. (2024). The relationship between cash flows of operating, investments, and financing activities with the firm value. International Journal of Finance & Managerial Accounting, 9(33), 101–112. [Google Scholar]
  87. Olojede, P., Erin, O. A., Asiriuwa, O., & Usman, M. (2020). Audit expectation gap: An empirical analysis. Future Business Journal, 6(1), 1–12. [Google Scholar] [CrossRef]
  88. Omer, W. K. H., Aljaaidi, K. S., & Habtoor, O. S. (2020). Board quality, audit quality and economic firm value: The case of manufactured Saudi’s listed companies. Calitatea, 21(178), 96–102. [Google Scholar]
  89. Osei, A. A., Yusheng, K., Casar, A. E., Tawiah, V. K., & Angelina, T. K. (2019). Collapse of big banks in Ghana: Lessons on its corporate governance. International Institute for Science, Technology, and Education, 10(10), 27–36. [Google Scholar]
  90. Pedersen, L. H., Fitzgibbons, S., & Pomorski, L. (2021). Responsible investing: The ESG-efficient frontier. Journal of Financial Economics, 142(2), 572–597. [Google Scholar] [CrossRef]
  91. Piot, C., & Missonier-Piera, F. (2017). Corporate governance reform and the cost of debt financing of listed french companies. SSRN Electronic Journal. [Google Scholar] [CrossRef]
  92. Porter, M. E., & Kramer, M. R. (2018). Creating shared value: How to reinvent capitalism—And unleash a wave of innovation and growth. In Managing sustainable business: An executive education case and textbook (pp. 323–346). Springer. [Google Scholar]
  93. Priem, R., & Gabellone, A. (2024). The impact of a firm’s ESG score on its cost of capital: Can a high ESG score serve as a substitute for a weaker legal environment. Sustainability Accounting, Management and Policy Journal (Print), 15(3), 676–703. [Google Scholar] [CrossRef]
  94. Rahman, H. U., Zahid, M., & Al-Faryan, M. A. S. (2023). ESG and firm performance: The rarely explored moderation of sustainability strategy and top management commitment. Journal of Cleaner Production, 404, 136859. [Google Scholar] [CrossRef]
  95. Rahman, M. J., & Yilun, L. (2021). Firm size, firm age, and firm profitability: Evidence from China. Journal of Accounting, Business & Management, 28(1), 101. [Google Scholar] [CrossRef]
  96. Rashid, A. (2021). Board independence and corporate social responsibility reporting: Mediating role of stakeholder power. Management Research Review, 44(8), 1217–1240. [Google Scholar] [CrossRef]
  97. Rastogi, S., Singh, K., & Kanoujiya, J. (2024). Firm’s value and ESG: The moderating role of ownership concentration and corporate disclosures. Asian Review of Accounting, 32(1), 70–90. [Google Scholar] [CrossRef]
  98. Refinitiv. (2022). Environmental, social and governance (ESG) scores from refinitiv. Available online: https://www.refinitiv.com (accessed on 8 November 2024).
  99. Ribando, J. M., & Bonne, G. (2010). A new quality factor: Finding alpha with ASSET4 ESG data. T. Reuters. [Google Scholar]
  100. Richardson, S. (2006). Over-investment of free cash flow. Review of Accounting Studies, 11(2–3), 159–189. [Google Scholar] [CrossRef]
  101. Rodríguez-González, R. M., Maldonado-Guzmán, G., Madrid-Guijarro, A., & Garza-Reyes, J. A. (2022). Does circular economy affect financial performance? The mediating role of sustainable supply chain management in the automotive industry. Journal of Cleaner Production, 379, 134670. [Google Scholar] [CrossRef]
  102. Rosenbaum, P. R., & Rubin, D. B. (1983). The central role of the propensity score in observational studies for causal effects. Biometrika, 70(1), 41–55. [Google Scholar] [CrossRef]
  103. Sahasranamam, S., Arya, B., & Sud, M. (2020). Ownership structure and corporate social responsibility in an emerging market. Asia Pacific Journal of Management, 37(4), 1165–1192. [Google Scholar] [CrossRef]
  104. Samad, S., Nilashi, M., Almulihi, A., Alrizq, M., Alghamdi, A., Mohd, S., Ahmadi, H., & Syed Azhar, S. N. F. (2021). Green supply chain management practices and impact on firm performance: The moderating effect of collaborative capability. Technology in Society, 67, 101766. [Google Scholar] [CrossRef]
  105. Samosir, F. C. (2018). Effect of cash conversion cycle, firm size, and firm age to profitability. Journal of Applied Accounting and Taxation, 3(1), 50–57. [Google Scholar]
  106. Samy El-Deeb, M., Ismail, T. H., & El Banna, A. A. (2023). Does audit quality moderate the impact of environmental, social and governance disclosure on firm value? Further evidence from Egypt. Journal of Humanities and Applied Social Science, 5(4), 293–322. [Google Scholar] [CrossRef]
  107. Sattar, U., Javeed, S. A., & Latief, R. (2020). How audit quality affects the firm performance with the moderating role of the product market competition: Empirical evidence from Pakistani manufacturing firms. Sustainability, 12(10), 4153. [Google Scholar] [CrossRef]
  108. Shipman, J. E., Swanquist, Q. T., & Whited, R. L. (2017). Propensity score matching in accounting research. The Accounting Review, 92(1), 213–244. [Google Scholar] [CrossRef]
  109. Siagian, F., Siregar, S. V., & Rahadian, Y. (2013). Corporate governance, reporting quality, and firm value: Evidence from Indonesia. Journal of Accounting in Emerging Economies, 3(1), 4–20. [Google Scholar] [CrossRef]
  110. Singh, D., & Delios, A. (2017). Corporate governance, board networks and growth in domestic and international markets: Evidence from India. Journal of World Business: JWB, 52(5), 615–627. [Google Scholar] [CrossRef]
  111. Souther, M. E. (2021). Does board independence increase firm value? Evidence from closed-end funds. Journal of Financial and Quantitative Analysis, 56(1), 313–336. [Google Scholar] [CrossRef]
  112. Stevens, G. C., & Johnson, M. (2016). Integrating the supply chain … 25 years on. International Journal of Physical Distribution & Logistics Management, 46(1), 19–42. [Google Scholar] [CrossRef]
  113. Sudiyatno, B., Puspitasari, E., Suwarti, T., & Asyif, M. (2020). Determinants of firm value and profitability: Evidence from Indonesia. The Journal of Asian Finance, Economics and Business, 7(11), 769–778. [Google Scholar] [CrossRef]
  114. Sun, G., Agyemang, A., Wiredu, I., & Saeed, U. F. (2023). Green innovation and sustainable products in small and medium-sized enterprises in China: The moderating and mediating roles of technology and work engagement. Environmental Engineering and Management Journal, 22(12), 2165–2176. [Google Scholar] [CrossRef]
  115. Tadros, E. (2023, December 20). One in two want government to cut use of big four firms: Survey. The financial review: Australia edition. Available online: https://www.afr.com/companies/professional-services/one-in-two-want-government-to-cut-use-of-big-four-firms-survey-20231214-p5erhe (accessed on 24 April 2025).
  116. Thenmozhi, M., & Sasidharan, A. (2020). Does board independence enhance firm value of state-owned enterprises? Evidence from India and China. European Business Review, 32(5), 785–800. [Google Scholar] [CrossRef]
  117. Tiwari, M., Tiwari, T., Sam Santhose, S., Mishra, L., Mr, R., & Sundararaj, V. (2023). Corporate social responsibility and supply chain: A study for evaluating corporate hypocrisy with special focus on stakeholders. International Journal of Finance and Economics, 28(2), 1391–1403. [Google Scholar] [CrossRef]
  118. Tsang, Y. P., Fan, Y., Feng, Z. P., & Li, Y. (2024). Examining supply chain vulnerability via an analysis of ESG-Prioritized firms amid the Russian-Ukrainian conflict. Journal of Cleaner Production, 434, 139754. [Google Scholar] [CrossRef]
  119. Velte, P. (2017). Does ESG performance have an impact on financial performance? Evidence from Germany. Journal of Global Responsibility, 8(2), 169–178. [Google Scholar] [CrossRef]
  120. Velte, P. (2019). The bidirectional relationship between ESG performance and earnings management—Empirical evidence from Germany. Journal of Global Responsibility, 10(4), 322–338. [Google Scholar] [CrossRef]
  121. Wang, J. (2012). Do firms’ relationships with principal customers/suppliers affect shareholders’ income? Journal of Corporate Finance, 18(4), 860–878. [Google Scholar] [CrossRef]
  122. Wang, M., & Yang, Y. (2022). An empirical analysis of the supply chain flexibility using blockchain technology. Frontiers in Psychology, 13, 1004007. [Google Scholar] [CrossRef] [PubMed]
  123. Weston, P., & Nnadi, M. (2023). Evaluation of strategic and financial variables of corporate sustainability and ESG policies on corporate finance performance. Journal of Sustainable Finance & Investment, 13(2), 1058–1074. [Google Scholar] [CrossRef]
  124. Wieland, A., Wallenburg, C. M., Juuso, T., Harri, L., & Ojala, L. (2013). The influence of relational competencies on supply chain resilience: A relational view. International Journal of Physical Distribution & Logistics Management, 43(4), 300–320. [Google Scholar] [CrossRef]
  125. Wong, C. W. Y., Lirn, T.-C., Yang, C.-C., & Shang, K.-C. (2020). Supply chain and external conditions under which supply chain resilience pays: An organizational information processing theorization. International Journal of Production Economics, 226, 107610. [Google Scholar] [CrossRef]
  126. Wu, S., Li, X., Du, X., & Li, Z. (2022). The impact of ESG performance on firm value: The moderating role of ownership structure. Sustainability, 14(21), 14507. [Google Scholar] [CrossRef]
  127. Wu, Z., Lin, S., Chen, T., Luo, C., & Xu, H. (2023). Does effective corporate governance mitigate the negative effect of ESG controversies on firm value? Economic Analysis and Policy, 80, 1772–1793. [Google Scholar] [CrossRef]
  128. Xiao, J. Z., Yang, H., & Chow, C. W. (2004). The determinants and characteristics of voluntary Internet-based disclosures by listed Chinese companies. Journal of Accounting and Public Policy, 23(3), 191–225. [Google Scholar] [CrossRef]
  129. Xie, J., Nozawa, W., Yagi, M., Fujii, H., & Managi, S. (2019). Do environmental, social, and governance activities improve corporate financial performance? Business Strategy and the Environment, 28(2), 286–300. [Google Scholar] [CrossRef]
  130. Yoon, B., Lee, J. H., & Byun, R. (2018). Does ESG performance enhance firm value? Evidence from Korea. Sustainability, 10(10), 3635. [Google Scholar] [CrossRef]
  131. Yu, X., & Xiao, K. (2022). Does ESG performance affect firm value? Evidence from a new ESG-scoring approach for Chinese enterprises. Sustainability, 14(24), 16940. [Google Scholar] [CrossRef]
  132. Zahid, R. M. A., Saleem, A., & Maqsood, U. S. (2023). ESG performance, capital financing decisions, and audit quality: Empirical evidence from Chinese state-owned enterprises. Environmental Science and Pollution Research, 30(15), 44086–44099. [Google Scholar] [CrossRef] [PubMed]
  133. Zhang, L., Dou, Y., & Wang, H. (2023). Green supply chain management, risk-taking, and corporate value—Dual regulation effect based on technological innovation capability and supply chain concentration. Frontiers in Environmental Science, 11, 1096349. [Google Scholar] [CrossRef]
  134. Zhou, J. T., Sharpe, W. H., Halabi, A. K., & Song, H. (2025). ESG performance and supply chain contracts: Evidence from ASX-listed companies. In E. Koç (Ed.), Developing dynamic and sustainable supply chains to achieve sustainable development goals (p. 38). IGI Global. [Google Scholar] [CrossRef]
Figure 1. Conceptual model of the moderating effect of supply chain contracts, board independence, and audit quality on the ESG–firm value performance (ROA and ROE) relationship.
Jrfm 18 00247 g001
Table 1. Variables’ definitions and measures.
VariableDefinition and Measurement
Firm value (FV)Firm value is measured using accounting-based indicators: return on assets (ROA) and return on equity (ROE).
R O A = N e t   I n c o m e T o t a l   A s s e t s
R O E = N e t   I n c o m e T o t a l   E q u i t y
ESG scoreESG performance scores derived from Asset4 ESG data, available annually since 2002. ESG data can be used as standardized scores (0–100) or raw indicators covering environmental, social, and governance dimensions, accessible in Microsoft Excel format.
Supply chain contractsBinary indicator capturing the strength and clarity of ESG-related clauses in supply chain contracts. Coded 1 if robust ESG standards are explicitly stated, otherwise 0.
Board independencePercentage of independent directors on the board, calculated annually.
Audit qualityBinary variable indicating audit quality based on auditor choice. Equals 1 if ESG disclosures were audited by Big 4 auditors (Deloitte, EY, KPMG, PwC), otherwise 0, calculated annually (2012–2021).
Firm sizeFirm size is measured as the natural logarithm of total assets.
Firm ageFirm age refers to the number of years since a firm’s establishment.
R&D costR&D cost is measured as the ratio of R&D expenditure to total sales.
Operating cash flowOperating cash flow = net income + non-cash expenses + changes in working capital.
Debit ratioThe debt ratio represents the percentage of a firm’s assets financed through debt.
ESG report dummyBinary variable indicating whether a firm has published an ESG report. Equals 1 if firms publicly disclose an ESG report, otherwise 8.
Board meetingThis variable is measured by the number of board meetings held each year.
Board sizeBoard size is measured as the natural logarithm of the number of directors on the board.
Board tenureBoard tenure is measured as the average number of years a firm’s board of directors has served.
Table 2. Descriptive statistics and correlation matrix.
VariablesNMeanSTD1234567
1.ROA8440.0370.0931.000
2. ROE8440.0760.2080.832 *1.000
3. ESG Score8445.2682.5280.030−0.0091.000
4. Supply-chain contracts8440.5520.498−0.087 **−0.088 **−0.1231.000
5.Board independence8440.1020.034−0.086 **−0.062 *0.172 ***−0.091 ***1.000
6.Audit quality8440.8500.358−0.049−0.050−0.033−0.093 ***0.0201.000
7.Firm size 8448.4241.833−0.0020.076 **−0.699 ***0.099 ***−0.371 ***0.0521.000
8.Firm age8443.4780.7220.0100.010−0.209 ***0.042−0.0850.083 **0.231 ***
9.Operating cash flow8440.0950.0880.548 ***0.411 ***0.092 ***−0.0450.054−0.087 **−0.194 ***
10.Debt ratio 8440.0380.050−0.187 ***−0.105 ***−0.035−0.156 ***0.063 *0.062 *0.107 ***
11.R&D capital 8440.0040.0190.169 ***0.164 ***−0.0450.152 ***−0.021−0.075 **−0.020
12.ESG report dummy8440.7230.448−0.025−0.015−0.617 ***0.139 ***−0.090 ***0.0500.473 ***
13.Board meetings84412.2504.547−0.158 ***−0.108 ***−0.009−0.0460.133 ***0.091 ***0.089 ***
14.Board size8442.0090.2660.0400.073 **−0.553 ***0.108 ***−0.693 ***0.0470.724 ***
15. Board tenure8441.7550.3790.099 ***0.063 *0.016−0.166 ***0.0260.001−0.099 ***
Variables 891011121314
8.Firm age 1.000
9.Operating cash flow 0.0081.000
10.Debt ratio 0.025−0.194 ***1.000
11.R&D capital −0.0060.128 ***−0.0551.000
12.ESG report dummy 0.158 ***−0.0550.0030.0051.000
13.Board meetings −0.010−0.097 ***0.111 ***−0.084 **0.101 ***1.000
14.Board size 0.180 ***−0.129 ***−0.0430.0430.359 ***−0.061 *1.000
15. Board tenure 0.0280.100 ***0.0030.114 ***0.003−0.081 **−0.054
Note: p-value in parentheses. *** p < 0.01, ** p < 0.05, * p < 0.1.
Table 3. Results of ESG and firm value (H1).
DV = ROADV = ROE
Variables(1)(2)
ESG Score (H1)0.007 **0.017 **
(0.015)(0.017)
Firm size 0.0100.025 *
(0.138)(0.088)
Firm age−0.006−0.021
(0.567)(0.361)
Operating cash flow0.338 ***0.587 ***
(0.000)(0.000)
Debt ratio 0.0430.272
(0.736)(0.418)
R&D capital 0.403 **1.202 ***
(0.013)(0.001)
ESG report dummy0.0050.011
(0.659)(0.690)
Board meetings−0.000−0.003
(0.655)(0.173)
Board size0.0160.041
(0.505)(0.452)
Board tenure−0.015−0.022
(0.322)(0.531)
Constant−0.081−0.145
(0.289)(0.435)
Year dummies YESYES
Industry dummies YESYES
Observations765765
R-squared0.2690.264
Note: p-value in parentheses. *** p < 0.01, ** p < 0.05, * p < 0.1.
Table 4. Moderating role of supply chain partners (H2).
DV = ROADV = ROADV = ROEDV = ROE
Variables(1)(2)(3)(4)
ESG Score 0.006 **0.012 ***0.014 **0.025 ***
(0.022)(0.000)(0.017)(0.000)
Supply-chain contracts−0.029 ***0.043 **−0.062 **0.068
(0.007)(0.043)(0.013)(0.165)
ESG Score * Supply-chain contracts (H2) −0.013 *** −0.023 ***
(0.000) (0.002)
Firm size 0.010 **0.0060.027 **0.019 *
(0.038)(0.218)(0.018)(0.092)
Firm age−0.003−0.003−0.014−0.015
(0.753)(0.723)(0.514)(0.494)
Operating cash flow0.316 ***0.332 ***0.539 ***0.569 ***
(0.000)(0.000)(0.000)(0.000)
Debt ratio 0.0330.0280.2510.243
(0.675)(0.716)(0.159)(0.171)
R&D capital 0.4400.4671.280 *1.329 **
(0.130)(0.104)(0.054)(0.045)
ESG report dummy0.0040.0050.0090.010
(0.676)(0.622)(0.710)(0.667)
Board meetings−0.001−0.000−0.004 *−0.003
(0.370)(0.556)(0.061)(0.102)
Board size0.0130.0230.0340.052
(0.551)(0.283)(0.500)(0.296)
Board tenure−0.015−0.019 *−0.023−0.030
(0.152)(0.072)(0.333)(0.210)
Constant−0.044−0.065−0.066−0.103
(0.540)(0.368)(0.690)(0.534)
Year dummies YESYESYESYES
Industry dummies YESYESYESYES
Observations765765765765
R-squared0.2820.2890.2720.276
Note: p-value in parentheses. *** p < 0.01, ** p < 0.05, * p < 0.1.
Table 5. Moderating role of board independence (H3a).
DV = ROADV = ROADV = ROEDV = ROE
Variables(1)(2)(3)(4)
ESG Score 0.005 *0.017 ***0.014 *0.037 ***
(0.078)(0.002)(0.051)(0.003)
Board independence−0.574 ***0.175−0.927 **0.549
(0.002)(0.654)(0.024)(0.543)
ESG Score * Board independence (H3a) −0.111 ** −0.212 *
(0.041) (0.077)
Firm size 0.0100.011 *0.026 *0.029 **
(0.127)(0.071)(0.082)(0.049)
Firm age−0.005−0.006−0.018−0.021
(0.664)(0.577)(0.424)(0.359)
Operating cash flow0.334 ***0.338 ***0.579 ***0.588 ***
(0.000)(0.000)(0.000)(0.000)
Debt ratio 0.0300.0260.2500.242
(0.816)(0.838)(0.462)(0.469)
R&D capital 0.486 ***0.481 ***1.345 ***1.335 ***
(0.003)(0.004)(0.000)(0.000)
ESG report dummy0.0080.0090.0150.017
(0.500)(0.450)(0.566)(0.522)
Board meetings−0.000−0.000−0.003−0.003
(0.821)(0.642)(0.233)(0.160)
Board size−0.054−0.045−0.081−0.063
(0.113)(0.185)(0.284)(0.400)
Board tenure−0.013−0.011−0.020−0.015
(0.354)(0.441)(0.566)(0.662)
Constant0.1120.0060.188−0.016
(0.193)(0.951)(0.325)(0.939)
Year dummies YESYESYESYES
Industry dummies YESYESYESYES
Observations765765765765
R-squared0.2820.2890.2720.276
Note: p-value in parentheses. *** p < 0.01, ** p < 0.05, * p < 0.1.
Table 6. Moderating role of corporate governance (audit quality H3b).
DV = ROADV = ROADV = ROEDV = ROE
Variables(1)(2)(3)(4)
ESG Score 0.008 ***0.018 ***0.018 ***0.037 ***
(0.002)(0.000)(0.001)(0.000)
Audit quality−0.026 **0.038−0.052 **0.072
(0.015)(0.111)(0.031)(0.188)
ESG Score * Audit quality (H3b) −0.012 *** −0.023 **
(0.003) (0.012)
Firm size 0.010 **0.010 **0.026 **0.026 **
(0.041)(0.048)(0.020)(0.023)
Firm age−0.0010.000−0.011−0.008
(0.918)(0.975)(0.639)(0.722)
Operating cash flow0.330 ***0.312 ***0.569 ***0.534 ***
(0.000)(0.000)(0.000)(0.000)
Debt ratio 0.0510.0610.2890.309 *
(0.515)(0.431)(0.106)(0.083)
R&D capital 0.3920.4011.180 *1.197 *
(0.176)(0.165)(0.076)(0.071)
ESG report dummy0.0050.0050.0110.009
(0.613)(0.670)(0.651)(0.700)
Board meetings−0.000−0.001−0.003−0.003 *
(0.559)(0.428)(0.111)(0.077)
Board size0.0150.0220.0390.052
(0.481)(0.312)(0.438)(0.301)
Board tenure−0.016−0.013−0.025−0.020
(0.132)(0.202)(0.302)(0.404)
Constant−0.084−0.156 **−0.151−0.290 *
(0.236)(0.037)(0.355)(0.091)
Year dummies YESYESYESYES
Industry dummies YESYESYESYES
Observations765765765765
R-squared0.2750.2840.2690.275
p-value in parentheses. *** p < 0.01, ** p < 0.05, * p < 0.1.
Table 7. Alternative measures of supply chain contracts.
Panel A: The number of suppliers.
DV = ROADV = ROADV = ROEDV = ROE
Variables(1)(2)(3)(4)
ESG Score 0.007 ***0.013 ***0.017 ***0.033 ***
(0.003)(0.000)(0.002)(0.000)
Number of suppliers0.0040.034 **0.0090.091 ***
(0.664)(0.023)(0.650)(0.008)
ESG Score * Number of suppliers −0.006 ** −0.017 ***
(0.015) (0.004)
Control variables YESYESYESYES
Year dummies YESYESYESYES
Industry dummies YESYESYESYES
Observations765765765765
R-squared0.2690.2750.2640.273
Panel B: The number of customers.
DV = ROADV = ROADV = ROEDV = ROE
Variables(1)(2)(3)(4)
ESG Score 0.006 **0.008 ***0.014 **0.017 **
(0.017)(0.008)(0.013)(0.018)
Number of customers −0.023 ***−0.011−0.048 **−0.035
(0.005)(0.376)(0.010)(0.218)
ESG Score * Number of customers −0.003 −0.003
(0.207) (0.551)
Control variables YESYESYESYES
Year dummies YESYESYESYES
Industry dummies YESYESYESYES
Observations765765765765
R-squared0.2770.2790.2710.271
Note: p-value in parentheses. *** p < 0.01, ** p < 0.05.
Table 8. Excluding the COVID-19 period.
Panel A: ROA regressions
DV = ROADV = ROADV = ROADV = ROADV = ROADV = ROADV = ROA
Variables(1)(2)(3)(4)(5)(6)(7)
ESG score0.010 ***0.008 **0.015 ***0.009 **0.017 ***0.011 ***0.020 ***
(0.006)(0.035)(0.000)(0.015)(0.006)(0.004)(0.004)
Supply-chain contracts −0.044 **0.049 **
(0.011)(0.045)
ESG score * supply-chain contracts −0.016 ***
(0.001)
Board independence −0.372 *0.143
(0.064)(0.752)
ESG score * board independence −0.075
(0.210)
Audit quality −0.028 *0.030
(0.097)(0.427)
ESG score * audit quality −0.011 *
(0.076)
ControlsYESYESYESYESYESYESYES
Year dummies YESYESYESYESYESYESYES
Industry dummies YESYESYESYESYESYESYES
Observations605605605605605605605
R-squared0.2730.2890.3120.2790.2820.2810.288
Panel B: ROE regressions
DV = ROEDV = ROEDV = ROEDV = ROEDV = ROEDV = ROEDV = ROE
Variables(1)(2)(3)(4)(5)(6)(7)
ESG score0.023 ***0.017 **0.031 ***0.020 **0.036 ***0.023 ***0.040 ***
(0.009)(0.035)(0.001)(0.015)(0.007)(0.007)(0.004)
Supply-chain contracts −0.090 **0.075
(0.013)(0.169)
ESG score * supply-chain contracts −0.028 ***
(0.003)
Board independence −0.5270.510
(0.240)(0.624)
ESG score * board independence −0.151
(0.255)
Audit quality −0.065 **0.042
(0.044)(0.563)
ESG score * audit quality −0.019 *
(0.091)
ControlsYESYESYESYESYESYESYES
Year dummies YESYESYESYESYESYESYES
Industry dummies YESYESYESYESYESYESYES
Observations605605605605605605605
R-squared0.2820.2960.3110.2850.2870.2910.296
Note: p-value in parentheses. *** p < 0.01, ** p < 0.05, * p < 0.1.
Table 9. Weighted least squares method.
Panel A: ROA regressions
DV = ROADV = ROADV = ROADV = ROADV = ROADV = ROADV = ROA
Variables(1)(2)(3)(4)(5)(6)(7)
ESG score0.006 ***0.005 ***0.009 ***0.005 **−0.0040.006 ***0.013 ***
(0.002)(0.009)(0.000)(0.012)(0.302)(0.001)(0.000)
Supply-chain contracts −0.025 **0.015
(0.018)(0.383)
ESG score * supply-chain contracts −0.009 ***
(0.003)
Board independence −0.131−0.783 ***
(0.293)(0.003)
ESG score * board independence 0.108 ***
(0.004)
Audit quality 0.0070.054 ***
(0.295)(0.000)
ESG score * audit quality −0.010 ***
(0.001)
ControlsYESYESYESYESYESYESYES
Year dummies YESYESYESYESYESYESYES
Industry dummies YESYESYESYESYESYESYES
Observations744744744744744744744
R-squared0.9790.9800.9800.9790.9800.9790.980
Panel B: ROE regressions
DV = ROEDV = ROEDV = ROEDV = ROEDV = ROEDV = ROEDV = ROE
Variables(1)(2)(3)(4)(5)(6)(7)
ESG score0.0070.0060.013 **0.0070.032 ***0.0070.027 ***
(0.134)(0.165)(0.024)(0.134)(0.000)(0.115)(0.001)
Supply-chain contracts −0.0260.035
(0.271)(0.378)
ESG score * supply-chain contracts −0.012 *
(0.058)
Board independence 0.0171.486 ***
(0.951)(0.002)
ESG score * board independence −0.284 ***
(0.000)
Audit quality 0.0200.139 ***
(0.285)(0.001)
ESG score * audit quality −0.025 ***
(0.002)
ControlsYESYESYESYESYESYESYES
Year dummies YESYESYESYESYESYESYES
Industry dummies YESYESYESYESYESYESYES
Observations744744744744744744744
R-squared0.8050.8050.8070.8050.8090.8050.808
Note: p-value in parentheses. *** p < 0.01, ** p < 0.05, * p < 0.1.
Table 10. PSM method.
Panel A: The average treatment effect on the treated sample
DV = ROAATT (t-stat) Treated groupControl group
ESGScoreDum 0.020 * (1.82)0.0510.031
DV = ROEATT (t-stat) Treated groupControl group
ESGScoreDum 0.070 *** (2.84)0.0990.029
Panel B: ROA regressions based on the matched sample
DV = ROADV = ROADV = ROADV = ROADV = ROADV = ROADV = ROA
Variables(1)(2)(3)(4)(5)(6)(7)
ESG score0.008 **0.006 *0.015 ***0.006 *0.020 ***0.009 ***0.019 ***
(0.012)(0.058)(0.001)(0.060)(0.002)(0.006)(0.005)
Supply-chain contracts −0.039 **0.063 **
(0.037)(0.039)
ESG score * supply-chain contracts −0.016 ***
(0.002)
Board independence −0.624 ***0.234
(0.002)(0.595)
ESG score * board independence −0.126 **
(0.036)
Audit quality −0.032 *0.031
(0.062)(0.429)
ESG score * audit quality −0.011 *
(0.061)
ControlsYESYESYESYESYESYESYES
Year dummies YESYESYESYESYESYESYES
Industry dummies YESYESYESYESYESYESYES
Observations644644644644644644644
R-squared0.2720.2840.3010.2880.2950.2800.288
Panel C: ROE regressions based on the matched sample
DV = ROEDV = ROEDV = ROEDV = ROEDV = ROEDV = ROEDV = ROE
Variables(1)(2)(3)(4)(5)(6)(7)
ESG score0.020 **0.016 **0.032 ***0.016 **0.044 ***0.022 ***0.039 ***
(0.010)(0.033)(0.001)(0.033)(0.001)(0.006)(0.003)
Supply-chain contracts −0.077 **0.119 *
(0.040)(0.079)
ESG score * supply-chain contracts −0.031 ***
(0.004)
Board independence −1.111 **0.660
(0.014)(0.512)
ESG score * board independence −0.260 **
(0.046)
Audit quality −0.065 **0.046
(0.045)(0.531)
ESG Score * Audit quality −0.020 *
(0.076)
ControlsYESYESYESYESYESYESYES
Year dummies YESYESYESYESYESYESYES
Industry dummies YESYESYESYESYESYESYES
Observations644644644644644644644
R-squared0.2740.2820.2950.2830.2890.2800.285
Note: p-value in parentheses. *** p < 0.01, ** p < 0.05, * p < 0.1.
Disclaimer/Publisher’s Note: The statements, opinions and data contained in all publications are solely those of the individual author(s) and contributor(s) and not of MDPI and/or the editor(s). MDPI and/or the editor(s) disclaim responsibility for any injury to people or property resulting from any ideas, methods, instructions or products referred to in the content.

