1. Introduction
Global agricultural markets have become more exposed to climate-induced volatility, with El Niño–Southern Oscillation (ENSO) events appearing as a major cause of extreme weather patterns. ENSO not only affects crop production but also disrupts supply systems, resulting in price volatility for all market participants. Climate-related supply shocks pose a threat to food security and financial stability in many economies, especially those that rely on maize. This study investigates the influence of ENSO events on maize price transmission; specifically, it considers the way that global market integration exacerbates the effects of climate variability in key futures markets.
ENSO is an important driver of climatic variability that has a direct impact on agricultural production (
McPhaden et al., 2020). ENSO events can be divided into three distinct phases: El Niño (characterised by warmer sea surface temperatures), La Niña, (cooler sea surface temperatures), and neutral conditions. Each of these phases has different impacts on agricultural conditions.
El Niño phases are typically observed to have below-average rainfall and drought conditions in Southern Africa. This results in a substantial reduction in crop yield, particularly for maize, which is a staple crop for many African countries. Southern African maize yields can be reduced by up to 50% during extreme El Niño events (
Sazib et al., 2020;
Setimela et al., 2018), causing significant food inflation and increasing reliance on imports. The opposite occurs in Southern Africa during La Niña events, where favourable climatic conditions lead to higher yields (
Bradshaw et al., 2022). ENSO-related climatic events influence production levels, which can disrupt supply chains and alter market expectations, thus affecting commodity prices.
South Africa’s unique geographical and climatic conditions render it especially vulnerable to the effects of ENSO. South Africa experiences a distinct pattern of droughts during El Niño events and increased rainfall during La Niña events. This variability has a significant impact on agricultural productivity, especially for maize, which is a staple crop. The country’s reliance on both domestic and international maize markets complicates the situation, as global maize price fluctuations can worsen the local effects of ENSO. Understanding these distinct dynamics is critical to establishing effective mitigation and adaptation strategies.
The South African maize market is integrated into the global market with its pricing mechanisms influenced by both local and international supply and demand conditions, as well as the rand–dollar exchange rate. South African maize prices often follow prices set by the Chicago Mercantile Exchange (CME), which serves as a global benchmark for maize prices (
Zelingher et al., 2020). The South African maize price trades between import and export parity price levels, where import parity reflects the price at which maize can be landed in South Africa and export parity represents the price at which South African maize can compete internationally (
Geyser, 2013). Maize is imported by South Africa when local supply is not enough to meet regional demand and is exported with surplus maize harvest. This dynamic creates opportunities for arbitrage, as arbitrage traders can exploit price differences between the international and the South African market to maximise profits.
Understanding how price changes are transmitted across different markets during ENSO events is important for all commodity market participants. Our objective is to investigate how ENSO-related events impact maize price transmission between the CME and the JSE and to analyse how price interactions between white and yellow maize in South Africa respond to ENSO-related events. It can also aid in formulating strategies for arbitrage, hedging, and speculative trading by allowing market participants to exploit price differences between these markets (
Du Toit & Krige, 2014). This research adds to current knowledge by explaining how ENSO events impact price transmission and the significance of these changes for food security, trading, and hedging strategies. In doing so, our goal is to provide market participants with actionable insights into mitigating the financial risks associated with climate-induced price risk.
2. Review of the Literature
ENSO is an important driver of climate variability, affecting global temperature and precipitation patterns (
Cai et al., 2021), which in turn influence agricultural supply (
Stein, 2020) and commodity price dynamics (
Cai & Sakemoto, 2022). For example, Southeast Asia, Australia, and Southern Africa normally experience drier conditions during El Niño events, with wetter conditions in parts of America and South America (
Cai et al., 2020;
Freund et al., 2021).
Rembold et al. (
2016) found that lower maize yields are more frequent during El Niño seasons, with South Africa experiencing the largest drop in maize yield among Southern African countries. Recognising the changing relationship between climate change and ENSO is crucial to establish responsive agricultural strategies to mitigate the risks posed by these climate events, as these weather anomalies affect crop yields and food prices (
Baudoin et al., 2022).
Various recent studies (
Cai & Sakemoto, 2022;
Muza, 2017;
Hadunka & Janzen, 2023;
Owusu et al., 2019;
Peri, 2017;
Ubilava, 2018) analysed the effect of ENSO on agricultural commodity prices and all found that ENSO has, although not uniform (
Ubilava & Abdolrahimi, 2019), economically important and statistically significant effects on commodity prices. Nonuniformity is mainly due to the inability of lower-income countries to adapt to climate variability (
Ubilava & Abdolrahimi, 2019).
Cai and Sakemoto (
2022) used partial wavelet coherence analysis to demonstrate the time-varying nonlinear relationship between ENSO events and commodity prices and determined that ENSO exhibits associations with commodity prices, which appear to be more pronounced since 2000.
Ubilava (
2018) determined that price responses are more pronounced during El Niño events than during La Niña events, suggesting differential impacts based on the nature of the ENSO event. A study by
Sun et al. (
2023) explored the correlation between El Niño and agricultural commodity markets. The study established bidirectional causality and found that there are positive and negative impacts on prices. This highlights how agricultural commodity markets can even reflect global climate conditions in advance.
Both the South African government and the private sector have developed several strategies to mitigate the impact of ENSO-related maize production shocks. The South African Weather Service provides early warning systems and climate forecasts to prepare farmers and policymakers for ENSO-related events. Other strategies include import tariff adjustments, climate-resilient crop initiatives (
Baudoin et al., 2022), and weather-indexed insurance and agricultural hedging strategies. Previous research has confirmed ENSO’s consequences for South Africa’s agricultural sector.
Anderson et al. (
2023) assessed how domestic weather shocks influence maize price fluctuations in Southern Africa, and
Baudoin et al. (
2022) highlighted South Africa’s policy challenges in responding to ENSO-induced droughts.
Sazib et al. (
2020) used Earth observation data to assess the impact of ENSO on agriculture across Africa. Their study emphasized the importance of improved early warning systems and adaptive strategies. These studies highlight the importance of regional and local efforts in addressing the challenges posed by ENSO.
ENSO events not only affect the price and yield of agricultural commodities but also influence price volatility. Price volatility makes it difficult to predict future price patterns and creates considerable price risks for market participants (
Chavas et al., 2019) and impacts food security.
Peri (
2017) found that extreme ENSO events influence the price volatility of maize and soybeans, but with varying dynamics between the two. Maize showed an increase in price volatility during the spring and summer months of El Niño events and a decrease in soybean price volatility during the autumn and winter months. Understanding the impact of ENSO events on agricultural commodity prices sets the stage for investigating the underlying price transmission mechanisms, which play a crucial role in determining market responses and policy interventions during such climatic irregularities. A study by
Sayed and Auret (
2020) used a multivariate GARCH model to examine volatility transmission in the South African futures market. Their results indicate that the South African futures market is highly interrelated and that significant volatility transmission is observed.
Spatial price linkages between agricultural commodity markets refer to the way in which prices of agricultural goods are linked across different geographical areas. It is a market integration metric that measures how quickly and fully price signals from one area are passed on to another. This notion is critical for understanding how exogenous shocks, such as ENSO-induced events, affect prices in various places. Arbitrage is essential in spatial price transmission and in the context of maize markets. It acts as a mechanism that stops the potential for risk-free profits by leveraging pricing differences between geographically separated markets, such as the United States and South Africa. The basic concept of arbitrage ensures that prices do not vary dramatically (except for trade barriers, transporting, and handling costs) between different markets, as arbitrage traders will buy in the cheaper market and sell in the more expensive market until price parity is reached. This method helps to align prices across regions, allowing greater spatial price transmission.
Although
Guo and Tanaka (
2020) determined that a long-run equilibrium relationship exists between maize prices in the US and other countries, a study conducted by
Abidoye and Labuschagne (
2014) found that the relationship between South African and world maize prices is nonlinear and that only large changes in world prices are transmitted to the South African market. Although nonlinearity was found, the study also revealed that price transmission adjustments occur at a faster pace when the South African maize price trades closer to import parity price levels, and adjustments are slower during periods when the price trades closer to export parity levels. Recent studies, such as those by
von Cramon-Taubadel and Goodwin (
2021) determined that spatial price transmission differs between geographical regions, with African countries showing a lower degree of price transmission compared to other regions. The lower degree of price transmission is due to physical barriers and infrastructural gaps. The degree of price transmission also varies by commodity, with cereals exhibiting higher and faster transmission rates compared to oilseeds and livestock products (
von Cramon-Taubadel & Goodwin, 2021). However, these studies did not address price transmission during ENSO events, which underscores the importance of this research.
Price transmission during ENSO events displays nonlinear dynamics and asymmetries across various commodity types and across different geographical regions. A study conducted by
Ubilava (
2017) found that wheat prices usually increase after La Niña events and decrease after El Niño events. The results also indicated that wheat prices exhibit increased responsiveness during low inventory regimes. Similar results were found by
Abidoye and Labuschagne (
2014) for low maize stock levels. These studies suggest that the opportunity cost of food aid increases during periods of lower stock levels. ENSO events also have asymmetric effects on other agricultural commodities. Vegetable oil prices, in particular coconut and palm kernel oils, show an increase in prices with positive shocks (
Rainone, 2015).
Research on maize and wheat price transmission in South Africa shows that there is a bidirectional causality between the two commodities, with maize prices influencing wheat prices (
Ramoroka & Muchopa, 2022). Domestic weather disturbances in Southern Africa also influence the price of maize in the region (
Anderson et al., 2023). These studies emphasize the importance of local climate conditions in predicting agricultural prices, especially during drought periods. Although spatial price transmission in agricultural markets has been extensively researched, little attention has been given to how ENSO-driven climatic shocks influence price transmission between the US and South African maize markets. With South Africa’s exposure to and reliance on international markets, combined with South Africa’s importance as a maize producer in the Southern African region, and South Africa’s vulnerability to ENSO-related production shocks, understanding how South African prices are influenced by the CME is essential. This research addresses this gap and examines the impact of ENSO events on spatial price linkages and therefore provides valuable policy and trading recommendations for agribusinesses and policy makers. This research contributes to a more resilient strategy towards the ENSO-driven price risk and to maximising strategy under production uncertainty.
3. Data
In order to conduct the empirical analysis, daily price data, from 1997 to 2024, were obtained from the Chicago Mercantile Exchange (CME) and the Johannesburg Stock Exchange (JSE). The CME data cover corn prices in US cents per bushel, whereas the JSE data indicate the price in South African rand per ton for white and yellow maize. The CME data were converted in terms of exchange rate and weight to also reflect the daily trading price in rand per ton. Daily data were further converted to weekly data, with the weekly value for the three indicators representing the average of the values reported for the five trading days per week. The sample therefore consists of 1427 weekly observations over the time period of 20 January 1997 to 20 May 2024. Starting in 1937, South Africa had a long history of price control and control boards that controlled conditions for various agricultural commodities (
Geyser et al., 2024). Legislation in place since 1996 replaced control boards with free market pricing. The dataset of trading prices therefore only starts in 1997, justifying the chosen sample period.
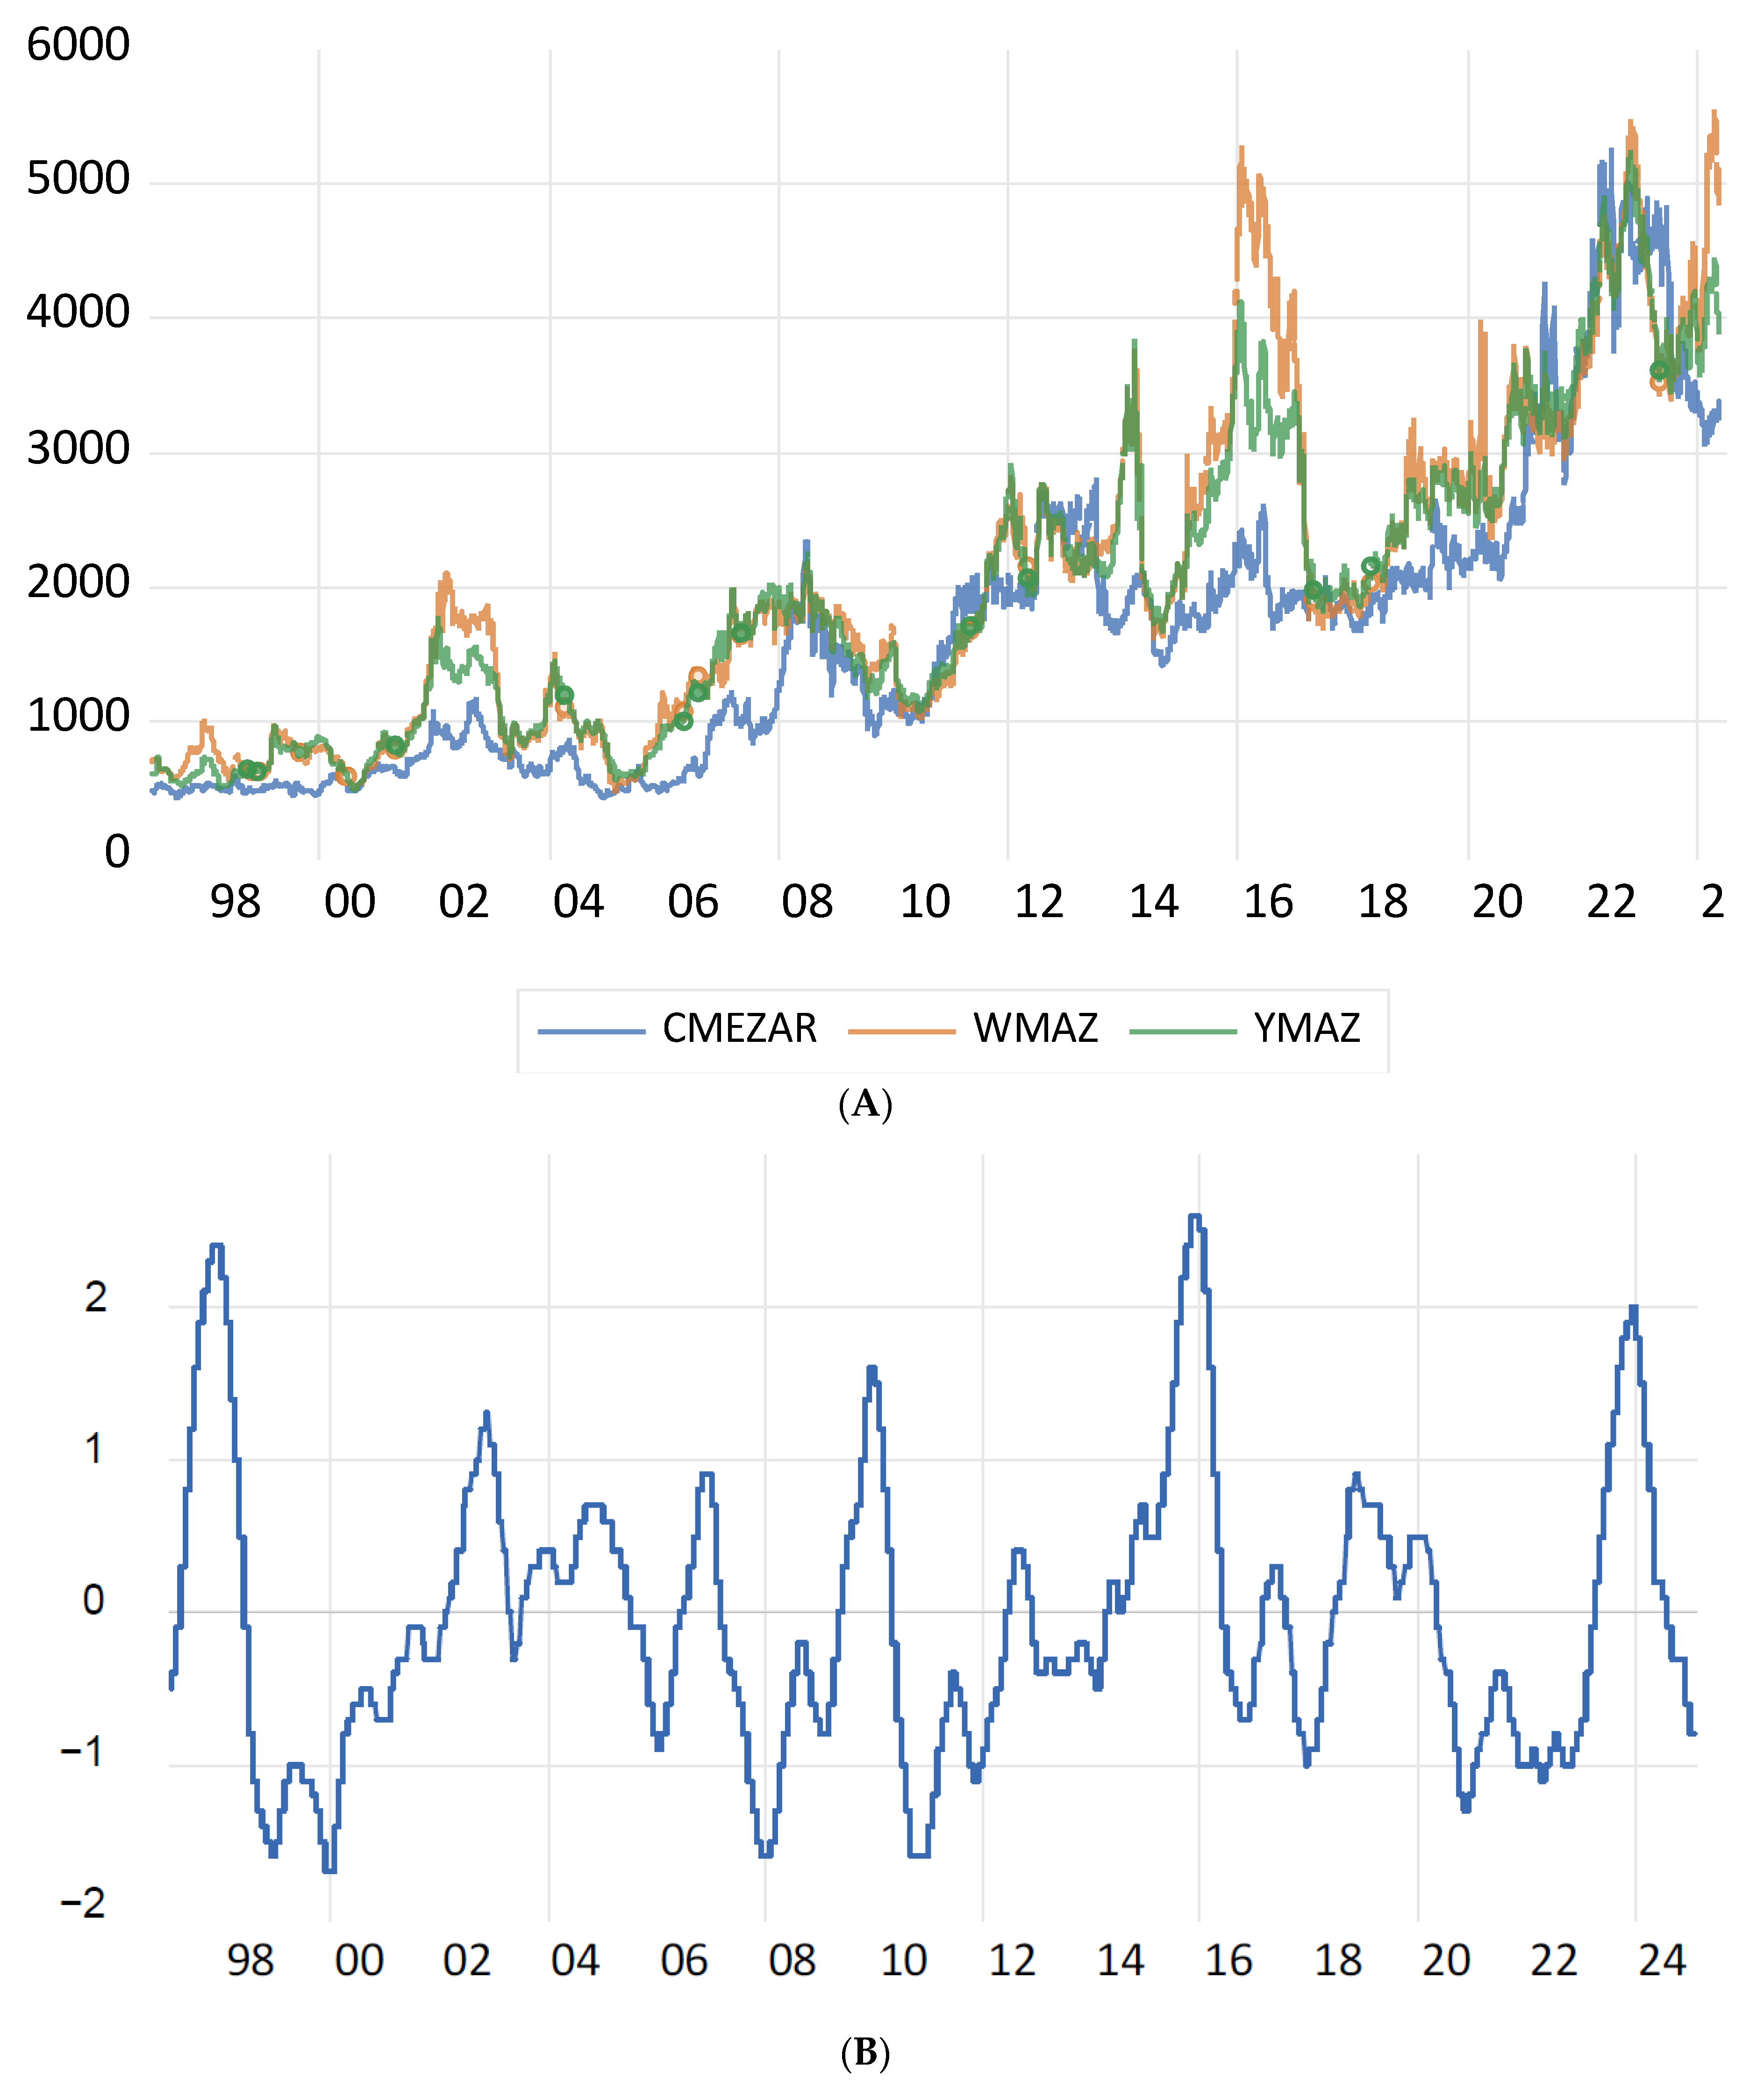
Figure 1 (panel A) plots the weekly price values of the three variables—CME corn price (CMEZAR), JSE white maize price (WMAZ), and JSE yellow maize price (YMAZ)—all measured in South African rand per ton. Panel B plots the deviations in the ONI. Temperatures of at least 0.5 degrees Celsius warmer than the 30-year average indicate El Niño events and temperatures of at least 0.5 degrees Celsius colder than the 30-year average indicate La Niña events.
The prices of white and yellow maize in South Africa are generally closely related. However, the instances where prices diverge substantially (during 2002/03, 2015/16, and 2023/24) correspond to El Niño events, as illustrated in panels A and B in
Figure 1. The higher price of the JSE white maize compared to yellow maize during the above periods can be attributed to the primary use of white maize for human consumption. During the past decade, the average human consumption of white maize in South Africa has been approximately 3.3 million tons, with 91% consumed as maize meal (
South African Grain Information Service, 2025). Consequently, the price of white maize is more sensitive to supply shocks, which are often associated with El Niño events. During these periods, the demand for white maize products also increases, with large amounts exported to neighbouring countries. This surge in demand further drives up the price of white maize. Panel B in
Figure 1 depicts animalities in the Oceanic Nino Index (ONI) (
Climate Prediction Centre, 2024) over the sample period. The values on the vertical axis represent anomalies in the index in terms of degrees Celsius deviation from the 30-year average (base periods)—which is indicative of ENSO events, as discussed above.
Panel A in
Figure 1 shows that South African white and yellow maize prices generally exhibit the same trends as the CME corn price. This suggests a clear interconnection between the markets, with the smaller South African market influenced by the larger CME market. A mere visual inspection of the trend lines in
Figure 1 draws attention to three specific periods when the JSE prices were much higher than the CME price; see panel A. The first is around 2002, then 2015 and 2016, and finally 2023 and 2024. These three periods correspond with the higher-than-average ONI values reported in panel B. The link between South African price levels and ENSO events is evident. Prices tend to spike (trade is substantially higher than the corresponding CME price) during El Niño periods, reflecting a smaller supply and a greater dependence on imports. Conversely, during La Niña periods JSE prices trade closer to the CME price, reflecting larger local supply. Although not as distinct, three periods are observed, when the CME price exceeded the JSE prices: 2008, 2013, and 2021 to 2022. As shown in panel B, these were periods when the ONI values were colder than average. These periods usually correspond to above-average rainfall and above-average South African crops. The additional supply forces the JSE price to trade below the CME price to stimulate export demand. This first visual inspection suggests a clear link between anomalies in sea temperatures and the relationship between US and South African maize prices.
4. Results and Discussion
The formal empirical analysis starts with the calculation of the correlations between the South African maize prices and the US corn price.
Table 1 reports the correlation coefficients between the CME and JSE prices calculated over periods of similar ENSO events. Throughout the sample period, there is a higher correlation between US corn prices and South African yellow maize prices, captured as 0.938264 and 0.876836. The rest of the correlations are calculated over a neutral period (deviation of 0.5 °C in both directions): weak El Niño (0.5 to 1 °C warmer), moderate El Niño (1 to 1.5 °C warmer), strong El Niño (1.5 to 2 °C warmer), very strong El Niño (more than 2 °C warmer), weak La Niña (0.5 to 1 °C colder), moderate La Niña (1 to 1.5 °C colder), and strong La Niña (1.5 to 2 °C colder). Relatively, the correlations seem to be more affected by El Niño compared to La Niña events.
The correlation between the CME and JSE maize prices and El Niño events shows a general increase as the strength of El Niño increases. During weak events, production levels are lower, prices higher, and the correlations lower. However, during very strong El Niño events (>2), the correlation between the CME and the price of white maize from the JSE increases to 0.96, and between the CME and the price of yellow maize from the JSE, it increases to 0.99. This suggests that El Niño has a significant impact on maize prices. This can be attributed to reduced yields and a greater dependence on imports to meet local demand. It is interesting to note that although white maize follows a similar pattern, the correlation is slightly lower. This suggests that consumers are less likely to switch to substitute products, even during periods of high prices.
The correlation during weak and moderate La Niña periods is weaker than the El Niño correlations for the same ENSO intervals. The correlation is even weaker during strong La Niña events. This suggests that the South African maize price is sensitive to supply levels and that during periods of high supply, the correlation is less pronounced.
A more formal way than relying on correlation coefficients, to determine whether two time series display a stable long-run relationship, is to test for cointegration. But before testing for cointegration, the order of integration of the series must be determined.
Table 2 summarises the test statistics for the three series. As expected, all three variables turned out to be I(1) with unit roots in levels and to be stationary in the first differences. This is true for the prices in South African rand as well as in logarithmic format. Test results for the logarithmic format are reported, as the regression analysis will include the variables in logs.
Table 2 reports on the results for unit root tests over the whole sample period. Although not reported here, all three series were also found to be I(1) over the different sub-samples relating to specific ENSO events.
Once it is confirmed that all three series are nonstationary and I(1), tests for cointegration can proceed.
Table 3 reports on the results of the Engle–Granger cointegration test. The initial null hypothesis of no cointegration can be rejected in both cases at a 1% level of significance, and it can be concluded that US corn prices are cointegrated with both indicators of South African maize prices.
The last phase of the empirical analysis is to determine whether there exists a long-run relationship between the US and South African prices. For this purpose, a vector error correction model is estimated, and the sign and significance of the error correction term are evaluated.
Table 4 reports the estimates for the whole sample period.
The first two columns deal with the relationship between South African white maize prices and US corn prices. The error correction term (reported at the bottom) is negative and statistically significant, indicating that any short-term deviations from the estimated long-run equation will eventually adjust towards the estimated long-run equation. The yellow maize equation also exhibits a negative error correction term. It is slightly less significant but still significant at 10%. Over the sample period, there seems to be a long-run cointegration relationship between US corn prices and South African maize prices. Therefore, the unanswered question that remains is whether these relationships hold over different ENSO events.
To empirically address the question, smaller sample periods corresponding to El Niño or La Niña events are identified. Consecutive weeks of deviations of more than 0.5 °C in the ONI—as shown in panel B in
Figure 1—are classified as El Niño sample periods (May 1997–May 1998, October 2014–April 2014, May 2023–April 2024) and deviations of less than 0.5 °C as La Niña sample periods (July 1998–February 2001, June 2007–June 2008, May 2010–May 2011, August 2011–April 2012, August 2020–May 2021, August 2021–January 2023). Over each of these distinct periods, vector error correction models, similar to those in
Table 4, are reported.
Table 5 summarises the El Niño results. The upper half of the table refers to the white maize models and the lower half to yellow maize.
None of the estimated error correction terms is statistically significant, although five do display the expected negative sign. The estimates point towards the absence of long-run equilibrium relationships between US corn prices and South African maize prices during El Niño events. This suggests a decoupling of the two markets, likely due to supply shocks in the smaller South African market that is not reflected in the US market. Drought conditions lead to lower maize crop yields, and South African prices trade closer to or at import parity levels—which do not adjust towards or converge to US corn prices. These results mirror the lower correlations between US and South African prices reported in
Table 1. A possible explanation, particularly related to the price of white maize, could be found in the preference that South African consumers display towards white maize. To name only one study,
Khumalo et al. (
2011) concluded that South African consumers, especially from rural areas, prefer white over yellow maize. If local consumers do not switch to alternative products, local prices could remain high and fail to adjust towards international levels.
As a last contribution,
Table 6 reports the estimates for six La Niña sub-samples. All the estimated error correction terms are negative, with varying levels of statistical significance. The most significant results, for white and yellow maize, are reported for the periods June 2007 to June 2008 and August 2020 to May 2021.
In both cases, the speed of adjustment is relatively high. Almost 36% of the deviations of white maize prices are adjusted toward the long-run estimate within a week, compared to 23% for yellow maize. In the second period, 25% of the white maize deviation is adjusted per week compared to 26% for yellow maize. Although not included in the regression analysis, two factors could potentially explain this observation. The first relates to the severity of the ENSO event—are we dealing with weak, moderate, or strong ENSO events? The second potential explanation deals with stock levels.
The average deviation from the long-term average temperature was −1.09 °C for the period June 2007 to June 2008. In the second period under review, August 2020 to May 2021, the average deviation was −0.91 °C. The second would be classified as weak episodes and the first period just bridging the threshold into a moderate period. Out of the six La Niña periods these two also reflect some of the lowest stock levels. Under these circumstances, it makes sense that the speed of adjustment is quicker. Both the first and second La Niña periods fall into the moderate category—but the stock levels were higher. Higher stock levels in South Africa would dampen domestic prices for a longer period of time and could prevent adjustment or prolong the period. The remaining two periods can be classified as weak El Niño events.
5. Conclusions
South Africa is one of the top ten world’s largest maize exporters. However, its exports account for only 1.46% of global maize exports (
Geyser et al., 2024). Consequently, domestic prices are to a great extent influenced by international corn prices. The empirical results confirm this and suggest that in general, a long-run cointegration relationship exists between US corn prices and South African maize prices.
However, this relationship differs during ENSO events. During El Niño episodes, South African prices do not adjust toward this equilibrium relationship. During La Niña episodes, the speed of adjustment is quick but influenced by the strength of the anomaly and the levels of domestic maize stock. These findings support the study by
Abidoye and Labuschagne (
2014), who found a nonlinear price transmission between South African and global maize prices, with faster price adjustments near import parity and slower convergence closer to export parity. Price adjustments can be explained by the role of South Africa as a producer and exporter of white maize to Africa. The surplus maize can be exported, leading to higher local prices and convergence to international prices.
Proactive procurement strategies are recommended during El Niño events to increase food security and affordability in South Africa. This will prevent prolonged higher prices and counteract the slower price adjustments observed in South Africa. Food prices can be stabilised and food security enhanced by strategically securing stock in advance and by using forward and derivative contracts to lock in more favourable maize prices. Both the government and the private sector should adopt proactive measures to cushion the economy against ENSO events. Early warning systems must be strengthened and crop insurance programs expanded to help mitigate price volatility. Rainfall-based index contracts can be used to mitigate the financial risks associated with ENSO-related price volatility. These financial instruments can be used to hedge market participants against the adverse effect of the weather caused by ENSO. These strategies can mitigate the financial risks associated with climate-induced price volatility.
This study improves our understanding of ENSO’s impact on the transmission of maize prices between the US and South Africa by combining the dynamics of nonlinear price transmission with proactive risk mitigation, thus improving decision-making frameworks for policymakers and market participants. Our investigation of ENSO’s impact on maize price transmission highlights the vulnerability of global maize markets to climate-induced shocks. Furthermore, our findings highlight the need for better risk management strategies, measures such as proactive procurement practices, weather-based index contracts, and diverse trade networks, to reduce price volatility. These insights are especially useful for policymakers, traders, and agricultural stakeholders striving to improve market resilience to future climate disruptions. The study also underlines the importance of regional collaboration in guaranteeing food security, particularly for net-importing Southern African nations that bear the brunt of ENSO-induced supply disruptions.


