Abstract
This study examines the financial behavior of university students in Economics, Business Administration, and Accounting in Tegucigalpa, Honduras, using the FB–13 instrument. Exploratory and confirmatory factor analyses validate a three-dimensional structure: (1) financial planning and control, (2) savings and financial preparation, and (3) fulfillment of obligations, with high internal consistency (α = 0.915), supporting its psychometric robustness in Latin American academic contexts. Based on a sample of 714 students with diversity in gender, age, work experience, and parental status, the analyses confirmed that the FB–13 model best fits a three-factor structure. Significant correlations were identified between financial behavior and experiential variables such as age, work experience, and parenthood, while traditional sociodemographic attributes such as gender, residence, marital status, employment, and educational level showed limited associations. These findings suggest that personal experiences have a greater influence on the configuration of financial practices than conventional demographic categories. The study acknowledges limitations related to cross-sectional design, non-probabilistic sampling, and self-reported data, yet these do not diminish its contributions. By validating the FB–13 in Honduras, the research offers comparative evidence and promotes cultural diversity in financial behavior literature. Future research should move toward longitudinal and qualitative studies that explore the role of family dynamics, work contexts, and personal aspirations in responsible financial behaviors.
1. Introduction
Financial behavior can be defined as the set of decisions, habits, and strategies that individuals, households, couples, and businesses adopt to manage their economic resources, aiming to achieve financial well-being, optimize investments, and assess risks (Faturohman et al., 2024; Pham & Le, 2023; B. Li & Liu, 2025). This construct transcends simplistic notions of spending or saving, encompassing a complex interplay of cognitive, emotional, psychological, social, educational, technological, and institutional factors (Fernández-Guadaño, 2015). Its multidimensional nature demands a contextualized understanding that accounts for demographic and socioeconomic differences, as these directly shape how financial practices are perceived, internalized, and executed. In this regard, it is essential to ask: does the context of financial behavior vary from one country to another? Such a question invites reflection on how cultural norms, regulatory frameworks, and economic conditions influence the ways in which financial decisions are made and interpreted across diverse national settings.
Empirical evidence underscores the influence of variables such as gender, education, social status, and age in generating differentiated financial behavior patterns. For instance, Abril-Teatin et al. (2022) demonstrate that financial knowledge is significantly higher among individuals with university education and those belonging to higher socioeconomic strata. Interestingly, women exhibit slightly higher levels of financial education than men, challenging traditional stereotypes and suggesting a shift in gendered financial competencies (Cwynar, 2021).
At the individual level, financial behavior functions as a mediator between personal traits and economic outcomes. Constructs such as financial self-efficacy, literacy, and locus of control influence how individuals engage with digital tools and social media to optimize financial decisions (Faturohman et al., 2024). Early financial education, particularly among young women, enhances understanding of interest rates, portfolio diversification, and savings habits (Bae et al., 2022; Abril-Teatin et al., 2022). However, knowledge alone is insufficient; responsible financial practices require the translation of theoretical understanding into sustainable, context-sensitive actions (Bhatia & Singh, 2024; Cwynar, 2021).
The contextual dimension becomes particularly salient in culturally diverse and underrepresented populations. Pham and Le (2023), for example, reveal that among young Vietnamese individuals, formal financial education exerts divergent effects on short- and long-term financial behavior. While financial literacy positively influences investment and retirement planning, it may inadvertently encourage unsustainable consumption in the short term. This duality highlights the importance of not only imparting knowledge but also fostering the capacity to apply it judiciously within specific socio-cultural contexts.
Further emphasizing the cultural embeddedness of financial behavior, Patrisia et al. (2023) introduce the concept of Islamic Financial Literacy (IFL), illustrating how religious beliefs and family communication patterns shape risk tolerance and financial decision-making among Generation Z in Indonesia. Such findings reinforce the necessity of adapting measurement instruments to local normative frameworks and cultural values.
Despite growing theoretical sophistication, there remains a notable gap in the empirical validation of financial behavior constructs across culturally diverse populations, particularly in regions such as Central America (B. Li & Liu, 2025; Faturohman et al., 2024; Patrisia et al., 2023). Addressing this gap is essential for developing inclusive financial education policies and tools that resonate with the lived realities of diverse communities.
Family and social factors exert a decisive influence on financial behavior, particularly through financial socialization. From early childhood, interactions within the family and close social circles shaped financial habits, attitudes, and decision-making patterns. Studies in Indonesia and Malaysia during the COVID-19 pandemic underscore the importance of family communication and religious financial education in influencing risk tolerance and economic well-being (Patrisia et al., 2023; Sabri et al., 2024). Patrisia et al. (2023) highlight that Islamic Financial Literacy, integrating Sharia principles such as the prohibition of interest (ribā) and speculative transactions (maysir), enhances financial outcomes and moderates the relationship between risk perception and behavior. Although Sabri et al. (2024) do not explicitly address IFL, their research demonstrates the mediating role of financial behavior between literacy, family socialization, self-control, and the adoption of financial technologies.
Observational learning, particularly through parental and peer modeling, reinforces autonomy and self-efficacy in financial decision-making (Vijaykumar, 2022; Kreiner et al., 2020). Yet, the intergenerational transmission of financial habits remains insufficiently explored in Latin American contexts. This is a significant omission, given the region’s distinct cultural and institutional dynamics, which may influence how financial behaviors are learned and sustained across generations. Integrating religious, normative, and contextual dimensions into explanatory models could therefore enrich our understanding of financial socialization and support culturally responsive educational strategies that promote financial well-being in Latin America.
From a psychological and biological perspective, factors such as self-control, emotions, optimism, hormones, and neurotransmitters modulate decision-making and risk perception (Ghazali et al., 2025; Beytollahi, 2020; Viktorovna & Mikhailovna, 2020). These findings challenge the notion of purely rational financial behavior and underscore the importance of affective and cognitive processes. In socially vulnerable populations, biographical factors like detention length and perceived control influence financial intentions (Mielitz & MacDonald, 2021). In Brazil and Colombia, sociodemographic variables have shown measurable effects on financial behavior (dos Santos & Barros, 2011; Abril-Teatin et al., 2022). However, how these psychological dimensions interact with sociodemographic variables among young Latin Americans remains underexplored.
A critical and understudied dimension in the literature is the relationship between financial behavior and sociodemographic variables, whose influence varies across cultural and institutional contexts (Long & Tue, 2024; dos Santos & Barros, 2011; Xiao & Meng, 2024; Cwynar, 2021). Age, gender, education, and income shape behavioral patterns, but these effects are not uniform across countries. While older adults and women often exhibit structured financial habits, younger individuals with high financial literacy engage more actively in investment and savings. However, comparative evidence, especially from Central America, remains scarce.
Empirical findings from Asia, Europe, and South America confirm that financial behavior does not follow universal patterns but is shaped by a complex interplay of sociodemographic and contextual factors. In Japan, Long and Tue (2024) found that financial knowledge enhances both short- and long-term financial behavior, and that women, despite investing less, act more responsibly. In Poland, Cwynar (2021) found no significant gender-based differences, suggesting that socially imposed gender roles may be diluted in certain settings. In Brazil, dos Santos and Barros (2011) reported that age, gender, and education significantly influence the presence of cognitive biases in decision-making, while Xiao and Meng (2024) revealed that financial behavior protected low- and middle-income groups from financial anxiety during the COVID-19 pandemic in USA.
These findings collectively reinforce the need for culturally sensitive and regionally grounded analyses. Time horizons also mediate financial behavior, with short- and long-term decisions differing by age and knowledge levels (Pham & Le, 2023), challenging the effectiveness of uniform financial education policies. In Vietnam and peri-urban communities, integrated approaches combining family socialization and technology have proven more effective than purely theoretical instruction (Kumar et al., 2024; Pham & Le, 2023). Whether similar strategies apply in Honduras remains an open and unexplored question.
The digital context adds further complexity. Online platforms reshape the relationship between trust, knowledge, and behavior, particularly affecting vulnerable populations sensitive to perceived security, privacy, and transparency (Xiong et al., 2022; Rahman et al., 2021). Meanwhile, evidence on financial literacy programs remains mixed: early and family-centered interventions promote autonomy and gender equity, but traditional models often fail to capture behavioral complexity (Kislitsyn, 2020; Bae et al., 2022).
Finally, financial behavior evolves with institutional and economic changes. Corporate financialization, credit access, and market fluctuations reflect the interplay between individual and collective decisions (Van Gunten & Navot, 2018; Davis, 2016; Clayton et al., 2007). Heuristics and emotions further modulate rationality, producing variations by gender, age, and income (dos Santos & Barros, 2011). Thus, a multidimensional approach is essential, one that incorporates cultural diversity, emerging technologies, and institutional structures.
In summary, although financial behavior has been widely studied, most empirical validations of measurement instruments, such as the FB–13 scale, have been conducted in Asian and European contexts, including Indonesia and Malaysia (Patrisia et al., 2023), assuming cultural equivalence that remains untested in Latin American or Central American populations. This study addresses that gap by describing and analyzing the financial behavior of undergraduate students in economics, administrative sciences, and accounting programs in Tegucigalpa, Honduras, and by testing the factorial validity and sociodemographic correlations of the FB–13 scale. The novelty of this research lies in providing the first empirical validation of the FB–13 model in a Central American context, thereby extending the cross-cultural applicability of financial behavior constructs discussed by Xiao and Porto (2022) and Warchlewska (2024). By doing so, it contributes original evidence to the comparative literature and strengthens the empirical foundations for understanding how sociodemographic variables shape financial behavior in culturally diverse and emerging settings.
2. Materials and Methods
2.1. Participants
The study was conducted in Tegucigalpa, the capital of Honduras, with the aim of describing and analyzing the financial behavior of university students studying economics, administrative, and accounting sciences. These programs last five academic years and belong to a faculty that, in the University City of Tegucigalpa, has an on-campus undergraduate enrollment of 8260 male (45.11%) and 10,049 female (54.89%). A total of 714 undergraduate students from the National Autonomous University of Honduras (UNAH) participated (37% men and 63% women), aged between 16 and 45, residing in rural (19%) and urban (81%) areas.
The students were in their first to fifth year of their bachelor’s degree and were selected using non-probabilistic convenience sampling, ensuring representation by age, gender, and residence. The inclusion criteria considered current undergraduate enrollment at UNAH in economics, administrative sciences, and accounting, and the absence of cognitive or physical conditions that would hinder comprehension or application of the instruments.
2.2. Context
Honduras is classified as a lower-middle-income country by the World Bank and has a population of around 9.6 million. Its age structure is markedly young, with almost 28% under the age of 15, just 6% over the age of 65, and a median age of 25.3, which represents a potential demographic dividend but also significant challenges in terms of employment, education, and migration. Although nearly 60% of the population lives in urban areas, mainly in Tegucigalpa, the political and administrative capital, and in San Pedro Sula and Choloma, industrial hubs, there is still a large rural population characterized by poverty, informality, and limited access to services. This urban concentration, together with territorial inequalities, violence, and climate vulnerability, drives both internal migration to cities and international emigration, especially to the United States (Central Intelligence Agency, 2025).
2.3. Instruments
A validated instrument was used to collect information on financial behavior consisting of 13 items (FB–13, see Appendix A). Each item is answered using a 5-point Likert scale: never, rarely, sometimes, often, and always. This questionnaire was self-administered in digital format, after obtaining informed consent from each student, and without collecting identifiable information. The instrument was created in Spanish in Ecuador and validated in university students, demonstrating high reliability (α = 0.857), adequate psychometric validity, and factor loading reported in Table 1 (Méndez-Prado et al., 2022).

Table 1.
FB–13 and Factor Loading in Méndez-Prado et al. (2022).
2.4. Data Analysis and Processing Procedures
The research aim established in the previous section has been accompanied by two types of hypotheses, which are detailed below.
Hypothesis of the factors:
H11.
(Alternative hypothesis): The FB–13 scale has a factorial structure composed of single factor that fits the theoretical model well, showing acceptable fit indices in both exploratory and confirmatory factor analysis in undergraduate in Tegucigalpa, Honduras.
H01.
(Null hypothesis): The factor structure of the FB–13 scale does not fit the theoretical model of single factor, showing significant differences in factor configuration or inadequate fit indices in exploratory and/or confirmatory factor analysis in undergraduate in Tegucigalpa, Honduras.
Hypothesis of the correlations:
H12.
(Alternative hypothesis, Expanded): There are significant and differentiated correlations between the sociodemographic variables (gender, age, residential area, marital status, parental status, work experience, employment status, and undergraduate level) and the FB–13 scale factors (Financial planning and control, Saving and financial preparation, and Compliance with financial obligations) such that the intensity and direction of financial behavior scores vary according to the personal and experiential characteristics of undergraduate students in Tegucigalpa, Honduras. These correlations are expected to reflect the influence of life stage, family responsibilities, and labor participation on the configuration of responsible financial practices.
H02.
(Null hypothesis, Expanded): There are no statistically significant correlations between the sociodemographic variables and any of the three factors of the FB–13 scale, indicating that variations in financial behavior are independent of students’ demographic or experiential characteristics.
Using SPSS version 23 software (IBM, New York, NY, USA), the 13 items of the FB–13 were analyzed by evaluating their psychometric properties (Méndez-Prado et al., 2022; Hughes, 2018). First, a univariate descriptive statistical analysis was executed, focusing on variance (>0), skewness (|≤1|), and kurtosis (|≤1|) (Ferrando et al., 2022). We find it necessary to give a slack of decimal points over 1, especially to the kurtosis in which we will allow a maximum of 1.8 (Ho & Yu, 2015).
To measure confidence levels, the authors applied the measurement of sampling adequacy (MSA) by anti-image correlation matrix (Kaiser & Cerny, 1979), and Kaiser–Meyer–Olkin (KMO) measure of sampling adequacy. Furthermore, the authors used Bartlett’s test of sphericity to identify items that belonged to factors within the scale as a form of exploratory factor analysis (EFA) with extraction method unweighted least squares (ULS), and rotation method Oblimin with Kaiser normalization (Lloret-Segura et al., 2014), identifying through EFA the underlying structure of the data at the factor level, as a preliminary step to conducting a more structured analysis. The unweighted least squares (ULS) method was used to estimate the factor parameters, given its suitability in contexts with ordinal variables and possible deviations from multivariate normality. ULS minimizes the discrepancy between the observed and estimated correlation matrices without weighting the residuals, which favors a more flexible factor extraction that is less sensitive to extreme values. This decision is based on empirical evidence supporting its superior performance compared to methods such as maximum likelihood in moderate samples and asymmetric distributions (Krijnen, 1996; Ximénez & García, 2005; C.-H. Li, 2016; Morata-Ramírez et al., 2015).
The authors then analyzed the exploratory factors using confirmatory factor analysis (CFA) developed with FACTOR version 12.01.02 software (Rovira i Virgili University, Tarragona, Spain) (Ferrando & Lorenzo-Seva, 2017). In the first stage, to ensure equivalence between subsamples used in exploratory factor analysis (EFA) and confirmatory factor analysis (CFA), the SOLOMON method (Lorenzo-Seva, 2022) was used, implemented using FACTOR software. This procedure projects participants into a two-dimensional space using principal component analysis (PCA), calculates a weighted score based on the explained variance, and alternately assigns cases to each subsample, optimizing the representation of common variance and reducing the bias associated with random divisions. The quality of the division was evaluated using the communality index (S), defined as the ratio between the KMO values of both subsamples. An S value close to 1 indicates high structural equivalence between the halves, ensuring optimal conditions for cross-validation of the factorial model.
Then, using FACTOR software, a confirmatory factor analysis (CFA) is performed with polychoric correlation using Hull’s method and Robust Unweighted Least Squares (RULS) (Yang-Wallentin et al., 2010) and Rotation Normalized Direct Oblimin, revising the Measure of Sampling Adequacy (MSA) (Lorenzo-Seva & Ferrando, 2021), and choosing a set of factors that feature high communalities, strong factor loadings relative to the sample size, and a minimal number of items per factor (MIF) (Velicer & Fava, 1998; Lorenzo-Seva et al., 2011; Kyriazos, 2018; Sun, 2005). Reporting the indicators detailed in Table 2 (Schermelleh-Engel et al., 2003): Chi-square ratio/degree of freedom (χ2/df), root mean square error of approximation (RMSEA), adjusted goodness-of-fit index (AGFI), goodness-of-fit index (GFI), comparative fit index (CFI), non-normed fit index (NNFI), and root mean square root of residuals (RMSR) (Kalkan & Kelecioğlu, 2016). Thus, the CFA, based on the results of the EFA, makes it possible to confirm whether a theoretical factor structure fits the data well, verifying whether the proposed theoretical model of factors has empirical validity.
Table 2.
Validation and reliability parameters.
In addition, the internal reliability of the resulting instrument will be validated by calculating Cronbach’s Alpha using SPSS 23 software (Bonett & Wright, 2015).
Finally, once the empirical validity of the factors has been proven by the CFA, the resulting score of the FB–13 questionnaire will be obtained, to be analyzed in contrast with some relevant sample characteristics, identifying possible differences that affect socially responsible behavior results. Thus, the weighted financial behavior levels, given the latent factors, resulting from the evaluation of the students, will be analyzed by means of cross-tabulations between financial behavior and the variables: Gender (GEN), Age (AGE), Residential area (RSD), Marital status (MAS), Parental status (PAS), Work experience (WEP), Employed (EMP), Undergraduate level (UGL), using Chi-Square tests between these variables (Williams, 1950; Albrecht, 1980; Wuensch, 2025).
In cases where the expected frequencies in contingency tables are low, the χ2 test of independence may be unreliable, as its asymptotic approximation is not adequately fulfilled. The exact test by Freeman and Halton (1951) will be used as a nonparametric alternative. This test is an extension of Fisher’s exact test for RxC tables (more than two rows or columns) and maintains the probabilistic accuracy of the original test, although it may be more computationally demanding for large tables. According to Contreras-Cristán and González-Barrios (2009), this test is a robust tool for comparing discrete distributions and is applied as a symmetry test in bivariate data by constructing a symmetric grid and counting frequencies in corresponding cells. In addition, Ruxton and Neuhäuser (2010) recommend its use as a reliable alternative to the χ2 test when the expected frequencies are less than five, noting that its mid-p version offers better control of type I error without sacrificing power. In SPSS, this test is not explicitly identified as Freeman-Halton, but it can be applied using the exact tests option in contingency tables, which automatically reports the exact p-value corresponding to this extension of Fisher’s test.
2.5. Ethical Procedures
The study was carried out in accordance with the ethical principles outlined in the Declaration of Helsinki for research involving human subjects. Written informed consent was obtained from the participating students (see Informed Consent Statement).
As this was a non-interventional observational study based on anonymous and non-invasive questionnaires, approval by a formal ethics committee, in accordance with the institutional regulations in force at the time of data collection.
3. Results
3.1. Sample Characterization
The financial behavior scale (FB–13) (Méndez-Prado et al., 2022) was applied in the first academic semester 2025 to a set of 714 effective participants (≥200, overcoming small sample sizes for factorial analysis) (Wolf et al., 2013). The 714 participants are characterized as shown in Table 3.
Table 3.
Students sample characterization.
Although the feminization rate of the Faculty at the University City of Tegucigalpa is 55%, given that our convenience sampling is 63% female, we have reported the differences in the distribution of variables by gender using the Mann–Whitney U test (see Table 4).
Table 4.
Analysis of differences in the distribution of variables by gender using the Mann–Whitney U test.
In all comparisons performed using the Mann–Whitney U test (FB1–FB13 vs. GND), the significance values obtained were greater than 0.05. Therefore, in all cases, the null hypothesis was retained, indicating that there are no statistically significant differences in the distribution of the FB1–FB13 variables according to gender (GND). The results closest to the significance threshold were FB9 (p = 0.053) and FB6 (p = 0.081), although they did not reach statistically relevant levels.
3.2. Validation by Exploratory and Confirmatory Factor Analysis
First, the possible prevalence single factor identified by Méndez-Prado et al. (2022) in Ecuador was investigated. When performing the univariate descriptive statistical analysis, none of the ordinal variables showed a variance of zero, indicating that they all contribute to the common variance. And the variables present adequate skewness and kurtosis, as detailed in Table 5.
Table 5.
Univariate descriptive statistical analysis.
Therefore, 13 reported items can be considered for exploratory factor analysis (EFA) of the FB–13 questionnaire (Méndez-Prado et al., 2022). No items were lost due to having a factor loading below 0.40, see the scree plot in Figure 1 (Elbow point indicated in red and clipping line (eigenvalue = 1) in red dashed line.). The presence of three factors within FB–13 is valid exclusively for this research and does not correspond to a version officially standardized by the original authors.
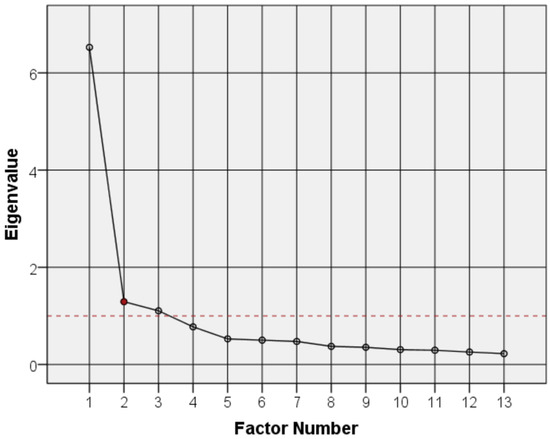
Figure 1.
Scree plot. Elbow point indicated in red and clipping line (eigenvalue = 1) in red dashed line.
Table 6 shows the result of the exploratory factor analysis preserving 13 variables (items) with Cronbach’s Alpha 0.915 (>0.8) and determining with SPSS 23 a KMO of 0.917 and Bartlett’s test with a Chi-square of 5247.199 with 78 degrees of freedom and a significance level of 0.000 for the three factors of the FB–13 instrument (Saving and financial preparation, Compliance financial obligations, and Financial planning and control). We obtained 59.715% of the variance explained. It should also be noted that all factors meet the minimum suggested number of items per factor (≥3) (Velicer & Fava, 1998; Wolf et al., 2013; Kyriazos, 2018). (See Anti-image correlation matrix in Table A1, Appendix A).
Table 6.
Exploratory factor analysis for three factors.
The authors also conducted a confirmatory factor analysis (CFA) on a dataset comprising 13 variables using the FACTOR software. Applying the SOLOMON method implemented in FACTOR, the original sample was divided into two equivalent sub-samples (N = 357), allowing for both exploratory and confirmatory factor analyses. The obtained KMO values (0.9098 and 0.9133), together with the communality index (S = 0.9962), indicate high structural equivalence, thus validating the effectiveness of the partitioning procedure. Furthermore, the Measure of Sampling Adequacy (MSA) (Lorenzo-Seva & Ferrando, 2021) did not suggest the elimination of any items, as all confidence intervals at the 90% level showed minimum values above 0.5.
Then, the CFA applied for a sample of 714 obtained a good KMO (Kaiser–Meyer–Olkin) equal to 0.91567 (>0.8) and Bartlett’s test of sphericity equal to 6726.4 with 190 degrees of freedom and a significance level of 0.000010. Those results are significant and good enough to present the adequacy of the polychoric correlation matrix (see Table 6). The authors then reduced the FB–13 questionnaire in terms of its latent variables into three factors (see Table 7), using the Hull method, implemented by performing an adequacy of the polychoric correlation matrix.
Table 7.
Confirmatory factor analysis for three factors.
Table 8 sets out the proposed model results for the χ2/df, RMSEA, AGFI, GFI, CFI, NNFI (TLI), and RMSR indicators by FACTOR software with a good fit. The proposed 3-factor model shows a clearly superior fit compared to the original 1-factor contrast model. Although both have the same internal reliability (α = 0.915), the goodness-of-fit indices show significant differences:
Table 8.
Validation and reliability versus parameters (Schermelleh-Engel et al., 2003).
- The χ2/df in the proposed model (1.35) is within the expected values for a good fit, while in the contrast model it is excessively high (7.06).
- The RMSEA of the proposed model (0.067, ci 0.047–0.077) is within the acceptable range, in contrast to that of the 1-factor model (0.124, ci 0.109–0.133), which indicates a poor fit.
- The incremental and absolute fit indices (CFI, NNFI, GFI, AGFI) are consistently higher in the 3-factor model, exceeding 0.98 in most cases, while the contrast model remains at lower values, some just above the acceptable threshold of 0.95.
- The RMSR also favors the proposed model (0.032 vs. 0.091), showing a lower level of residuals.
Thus, although both models are reliable, the proposed three-factor model is the one that truly represents a solid and parsimonious fit, confirming that the differentiated factor structure better reflects the nature of the data than a one-dimensional solution.
Finally, Table 9 shows the instrument’s inaternal reliability by SPSS 23 software, with a total Cronbach’s Alpha of 91.5% for the set of 13 items (See details in Table 8), and Figure 2 presents a histogram of the resulting scales: 2a histogram F1, 2b histogram F2, 2c histogram F3, and 2d histogram FT.
Table 9.
Reliability statistics.
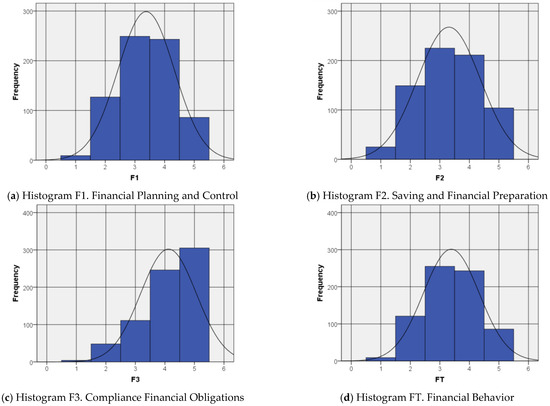
Figure 2.
Histogram of factors in FB–13 scale. (a) F1, (b) F2, (c) F3, and (d) F4. The blue bars represent the frequency distribution of the data grouped into class intervals, while the black curve depicts the theoretical normal distribution fitted to the observed data.
Consequently, it is possible to assert that the proposed theoretical model of the factors has empirical validity:
- F1: “I take notes and keep track of my expenses (e.g., spreadsheet of expenses and income)” (FB1), “Before buying something, I compare prices of similar products” (FB2), “I have a spending plan or budget” (FB4), and “I am very competent in managing my finances” (FB5). Thus, F1 → Financial Planning and Control.
- F2: “I save part of the money I receive to cover future needs” (FB3), “I save at least a minimum percentage of my income every month” (FB7), “I save regularly to achieve long-term financial goals” (FB10), “I save more when I receive a pay raise” (FB11), “I have a financial reserve of at least three times my monthly income, which I can use in unexpected circumstances” (FB12), and “In the last 12 months, I have been able to save money” (FB13). Thus, F2 → Saving and Financial Preparation.
- F3: “I pay my bills without delay” (FB6), “I analyze my financial situation before making a major purchase” (FB8), and “I always pay my debts on time to avoid extra charges” (FB9). Thus, F3 → Compliance Financial Obligations.
3.3. Resulting Scale Analysis
The confirmed scale with 13 items (FB–13) is analyzed using means of cross-tables with the variables: Gender (GEN), Age (AGE), Residential area (RSD), Marital status (MAS), Parental status (PAS), Work experience (WEP), Employed (EMP), Undergraduate level (UGL), using the Pearson Chi-Square Tests are reported and Freeman–Halton (F-H) extension of Fisher’s Exact Tests (see Table 10).
Table 10.
Pearson Chi-Square Tests and Freeman–Halton (F-H) extension of Fisher’s Exact Tests.
Considering the valid tests, it can be concluded that there is an acceptable correlation between the factor “Financial planning and control” (F1) and age (AGE) and work experience (WEP) variables, factor “Saving and financial preparation” (F2) and the parental status (PAS) variable, and factor “Financial behavior” (FT) and age (AGE). There is also a good correlation between work experience (WEP) and the factor “Financial behavior” (FT). These three results are reinforced by the set of Figure 3 showing the association between these pairs of variables (see Figure 3).
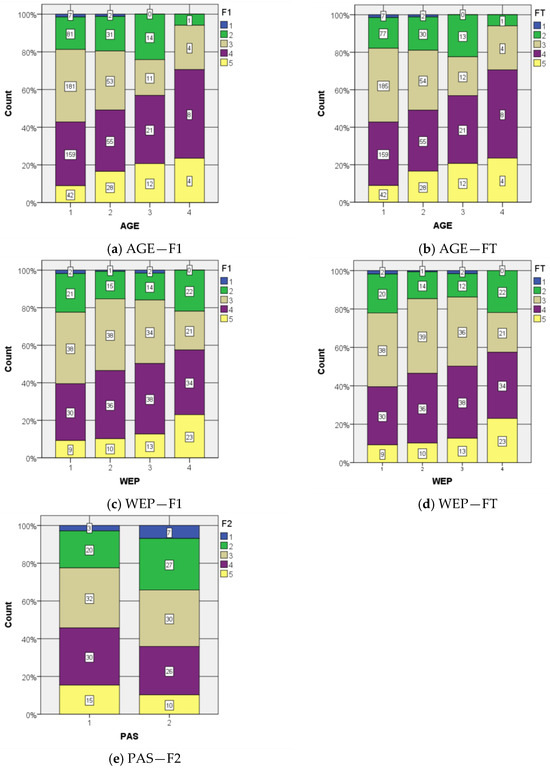
Figure 3.
Correlations between (a) AGE—F1, (b) AGE—FT, (c) WEP—F1, (d) WEP—FT, and (e) PAS—F2.
To conclude Section 3, statistical analyses allowed us to test the proposed hypotheses. Regarding the factor structure, the null hypothesis (H01), which proposed that the FB–13 did not fit the theoretical unidimensional model, was accepted, while the alternative hypothesis (H1) was rejected. Exploratory and confirmatory analyses showed adequate fit indices and high internal reliability, for a model with 3 factors (Financial Planning and Control, Saving and Financial Preparation, and Compliance Financial Obligations) for the study population.
In relation to the correlation hypotheses, statistically significant associations were identified between the FB–13 and certain sociodemographic variables, specifically age, parental status and work experience. Conversely, no statistically significant relationships were observed between the FB–13 and the variables gender, residential area, marital status, employment status, or undergraduate level.
4. Discussion
The finding that conceptualizes financial behavior as a latent structure composed of financial planning and control, saving and preparation, and compliance with obligations is reflected in a fragmented but significant way in the studies reviewed. Ramli et al. (2023) identify budgeting, debt repayment, and emergency preparedness as key behavioral indicators among millennials, aligning with the dimensions of planning and saving. Herrador-Alcaide et al. (2021), from a structural perspective, link financial behavior with literacy, retirement goals, and risk tolerance, showing how financial management and resource availability shape long-term planning. Hallsworth et al. (2024), from a behavioral lens, demonstrate that framing inaction as an active decision increases tax compliance, empirically validating the dimension of financial obligations. Although these studies approach the construct from sociocultural, structural, and behavioral angles, they collectively reinforce the conceptual triangulation that supports the proposed model. However, most of this evidence stems from non-Latin American contexts, leaving a gap in understanding how these dimensions manifest in culturally distinct populations.
The relationship between age and financial planning and behavior factors reflects a natural evolution in how people manage their resources throughout the life cycle. Studies such as those by Okamoto and Komamura (2021) and Weissberger et al. (2025) show that, although financial knowledge tends to increase with age, its cognitive impact stabilizes or declines in later stages, while subjective confidence continues to grow. Long and Tue (2024) confirm that older adults practice more responsible financial behaviors, although the effect of knowledge on such practices diminishes over time. In youth contexts, Cedeño et al. (2021) and Pham and Le (2023) show that financial education can significantly improve financial behavior, especially in vulnerable populations. Finally, Blay et al. (2024) highlights that age, together with work experience, positively influences financial participation, reinforcing the need for generationally tailored educational interventions.
The correlation between savings and financial preparation (F2) and parental status (PAS) reveals how parenting reshapes household financial strategies. West et al. (2017) show that family composition influences financial priorities: single-parent households tend to focus on immediate needs, while two-parent households with higher incomes can plan for the long term. Garrison et al. (2022) document heightened financial stress in families with children during the pandemic, and Collins et al. (2023) describe how low-income parents adopt alternative strategies to overcome institutional barriers. Validating this relationship in Honduran university students provides original evidence on how parenthood influences financial preparedness during life transitions.
Work experience (WEP) also emerges as a key variable in shaping financial behavior. Johan et al. (2021) show that young people with work experience demonstrate greater financial knowledge and responsible habits such as saving and planning. Rabadan (2025) complements this by pointing out that teachers with more professional experience manage their finances better, especially in paying debts and prioritizing expenses. Rahman et al. (2021) emphasize that financial behavior—especially saving and budgeting—is a better predictor of economic well-being than income, particularly in vulnerable populations. These findings support the theory of financial socialization (Gudmunson & Danes, 2011), which argues that experiential learning in dynamic contexts surpasses theoretical instruction. By examining this relationship in a Honduran academic population, the study provides comparative perspectives on how work experience fosters financial resilience in culturally specific settings.
Álvarez-Padilla et al. (2025) add a valuable dimension by showing that family conversations about money, especially between parents and adolescents, reinforce the impact of work experience. Exposure to open dialogue not only transfers practical knowledge but also strengthens confidence in financial management. This intergenerational dialogue complements learning on the job, suggesting that financial education should be understood as a multidimensional process rooted in both family and professional contexts.
It should be noted that this study was conducted among undergraduate students in economics, administration, and accounting sciences, a population that combines academic training with varying degrees of parental and work experience. This context enriches the interpretation of the results by reflecting the intersection between theoretical knowledge and lived financial realities. Furthermore, by validating the FB–13 scale in Honduras, the study contributes to the international literature by incorporating culturally diverse evidence and broadening the comparative scope of research on financial behavior.
Taken together, these findings invite us to rethink financial education strategies. Beyond formal instruction, they suggest integrating work environments and family interactions as key spaces for developing sound and sustainable financial habits. In doing so, this study not only addresses methodological gaps, but also promotes the inclusion of Latin American perspectives in the global understanding of financial behavior.
5. Conclusions
This study provides empirical evidence on the validity of the FB–13 instrument for assessing financial behavior among university students studying economics, administration, and accounting in Tegucigalpa, Honduras. The identification of a three-dimensional structure—financial planning and control, savings and financial preparation, and fulfillment of obligations—not only deepens our understanding of everyday practices among young people but also reinforces the theoretical coherence of the scale in Latin American contexts. The results reveal that experiential variables such as parenting and career trajectory have a greater impact on financial behavior than traditional sociodemographic attributes, inviting a rethinking of educational approaches focused on static categories. While the cross-sectional design and non-probabilistic sampling limit generalization, this validation provides a solid basis for the development of inclusive and culturally situated policies. We recommend moving toward longitudinal and qualitative studies that explore the role of family dynamics, personal aspirations, and digital tools in the formation of responsible financial habits. For decision-makers, this validated instrument represents an opportunity to design educational strategies adapted to youth diversity, strengthening resilience, equity, and financial autonomy in the region.
Supplementary Materials
The following supporting information can be downloaded at: https://www.mdpi.com/article/10.3390/jrfm18100581/s1, Table S1: FB.csv.
Author Contributions
Conceptualization, I.M.-Á. and A.V.-M.; methodology, A.V.-M.; validation, G.S.-S., D.C. and N.C.-B.; formal analysis, I.M.-Á. and A.V.-M.; investigation, I.M.-Á.; data curation, A.V.-M.; writing—original draft preparation, D.C., G.S.-S., I.M.-Á., N.C.-B. and A.V.-M.; writing—review and editing, I.M.-Á. and A.V.-M.; visualization, A.V.-M.; supervision, A.V.-M.; project administration, I.M.-Á.; funding acquisition, A.V.-M. and D.C. All authors have read and agreed to the published version of the manuscript.
Funding
This research was funded by Agencia Nacional de Investigación y Desarrollo (ANID—Chile), grant number Fondecyt Regular 1221063.
Institutional Review Board Statement
The study was conducted in accordance with the Declaration of Helsinki, approved by the Ethics Committee of the Doctoral Program in Business Management of POSFACE—UNAH (protocol code N. 100311, on 5 March 2025). All respondents have signed an informed consent form, and the data presented are completely anonymized.
Informed Consent Statement
Informed consent was obtained from all subjects involved in the study.
Data Availability Statement
The original contributions presented in this study are included in the Supplementary Materials. Further inquiries can be directed to the corresponding author.
Acknowledgments
We would like to thank the Graduate Unit of the Facultad de Ciencias Económicas, Administrativas y Contables (POSFACE), Universidad Nacional Autónoma de Honduras (UNAH).
Conflicts of Interest
The authors declare no conflicts of interest.
Appendix A
Table A1.
Anti-image correlation matrix.
Table A1.
Anti-image correlation matrix.
| FB1 | FB2 | FB3 | FB4 | FB5 | FB6 | FB7 | FB8 | FB9 | FB10 | FB11 | FB12 | FB13 | |
|---|---|---|---|---|---|---|---|---|---|---|---|---|---|
| FB1 | 0.912 * | −0.110 | 0.070 | −0.307 | −0.135 | −0.018 | −0.036 | 0.056 | 0.013 | −0.008 | −0.034 | −0.088 | −0.003 |
| FB2 | −0.110 | 0.918 * | −0.188 | −0.091 | −0.081 | −0.057 | −0.006 | −0.258 | 0.001 | 0.105 | −0.094 | 0.099 | 0.007 |
| FB3 | 0.070 | −0.188 | 0.944 * | −0.132 | −0.076 | 0.097 | −0.220 | −0.105 | −0.064 | −0.155 | 0.019 | −0.014 | −0.166 |
| FB4 | −0.307 | −0.091 | −0.132 | 0.904 * | −0.323 | −0.003 | −0.015 | −0.069 | 0.021 | 0.068 | −0.127 | −0.143 | 0.068 |
| FB5 | −0.135 | −0.081 | −0.076 | −0.323 | 0.942 * | −0.079 | −0.041 | −0.172 | −0.036 | −0.095 | 0.051 | −0.045 | −0.012 |
| FB6 | −0.018 | −0.057 | 0.097 | −0.003 | −0.079 | 0.834 * | −0.130 | −0.040 | −0.588 | 0.030 | 0.064 | −0.011 | −0.037 |
| FB7 | −0.036 | −0.006 | −0.220 | −0.015 | −0.041 | −0.130 | 0.931 * | −0.043 | 0.067 | −0.329 | −0.056 | −0.040 | −0.271 |
| FB8 | 0.056 | −0.258 | −0.105 | −0.069 | −0.172 | −0.040 | −0.043 | 0.932 * | −0.251 | −0.101 | −0.092 | 0.092 | 0.031 |
| FB9 | 0.013 | 0.001 | −0.064 | 0.021 | −0.036 | −0.588 | 0.067 | −0.251 | 0.848 * | −0.081 | −0.056 | 0.012 | −0.030 |
| FB10 | −0.008 | 0.105 | −0.155 | 0.068 | −0.095 | 0.030 | −0.329 | −0.101 | −0.081 | 0.925 * | −0.269 | −0.099 | −0.161 |
| FB11 | −0.034 | −0.094 | 0.019 | −0.127 | 0.051 | 0.064 | −0.056 | −0.092 | −0.056 | −0.269 | 0.947 * | −0.162 | −0.081 |
| FB12 | −0.088 | 0.099 | −0.014 | −0.143 | −0.045 | −0.011 | −0.040 | 0.092 | 0.012 | −0.099 | −0.162 | 0.926 * | −0.303 |
| FB13 | −0.003 | 0.007 | −0.166 | 0.068 | −0.012 | −0.037 | −0.271 | 0.031 | −0.030 | −0.161 | −0.081 | −0.303 | 0.929 * |
* Measures of Sampling Adequacy (MSA).
Table A2.
Financial Behavior FB–13 scale.
Table A2.
Financial Behavior FB–13 scale.
| Items ID | Items (In Spanish) | Items (In English) |
|---|---|---|
| FB1 | Tomo notas y controlo mis gastos (por ejemplo, hoja de cálculo de gastos e ingresos). | I take notes and keep track of my expenses (e.g., spreadsheet of expenses and income). |
| FB2 | Antes de comprar algo, comparo precios de productos similares. | Before buying something, I compare prices of similar products. |
| FB3 | Guardo/Ahorro parte del dinero que recibo para cubrir necesidades futuras. | I save part of the money I receive to cover future needs. |
| FB4 | Tengo un plan de gastos o presupuesto. | I have a spending plan or budget. |
| FB5 | Soy muy competente en el manejo de mis finanzas. | I am very competent in managing my finances. |
| FB6 | Pago mis facturas sin demora. | I pay my bills without delay. |
| FB7 | Ahorro mensualmente al menos un porcentaje mínimo de mis ingresos. | I save at least a minimum percentage of my income every month. |
| FB8 | Analizo mi situación financiera antes de una compra importante. | I analyze my financial situation before making a major purchase. |
| FB9 | Siempre pago mis deudas a tiempo para evitar cargos extras. | I always pay my debts on time to avoid extra charges. |
| FB10 | Ahorro regularmente para lograr objetivos financieros a largo plazo. | I save regularly to achieve long-term financial goals. |
| FB11 | Ahorro más cuando recibo un aumento de sueldo. | I save more when I receive a pay raise. |
| FB12 | Tengo una reserva financiera de al menos tres veces mis ingresos mensuales, que puedo utilizar en circunstancias inesperadas. | I have a financial reserve of at least three times my monthly income, which I can use in unexpected circumstances. |
| FB13 | En los últimos 12 meses he podido ahorrar dinero. | In the last 12 months, I have been able to save money. |
References
- Abril-Teatin, A. J., Saavedra-Najar, R., Blanco-Mesa, F., & Romero, J. M. (2022). Financial education knowledge assessment index. Cuadernos del Cimbage, 24(2), 1–16. [Google Scholar]
- Albrecht, P. (1980). On the correct use of the chi-square goodness-of-fit test. Scandinavian Actuarial Journal, 1980(3), 149–160. [Google Scholar] [CrossRef]
- Álvarez-Padilla, Y., Loibl, C., & Boone, B. (2025). Money talks: Testing a series of financial literacy modules to encourage financial conversations in middle school families. Journal of Family and Economic Issues, 46, 1–20. [Google Scholar] [CrossRef]
- Bae, K., Jang, G. Y., Kang, H. G., & Tan, P. (2022). Early financial education, financial literacy, and gender equity in Finance. Asia-Pacific Journal of Financial Studies, 51(3), 372–400. [Google Scholar] [CrossRef]
- Beytollahi, A. (2020). Chemistry of financial behaviors: A mini review of hormones effect on financial behaviors (2010–2019). Eurasian Chemical Communications, 2(8), 916–937. [Google Scholar] [CrossRef]
- Bhatia, S., & Singh, S. (2024). Exploring financial well-being of working professionals in the Indian context. Journal of Financial Services Marketing, 29(2), 474–487. [Google Scholar] [CrossRef]
- Blay, M. W., Musah, A., Ayariga, C., & Okyere, D. O. (2024). Determinants of financial literacy and its effect on stock market participation among university students in Ghana. International Journal of Economics and Financial Issues, 14(2), 15–25. [Google Scholar] [CrossRef]
- Bonett, D. G., & Wright, T. A. (2015). Cronbach’s alpha reliability: Interval estimation, hypothesis testing, and sample size planning. Journal of Organizational Behavior, 36(1), 3–15. [Google Scholar] [CrossRef]
- Cedeño, D., Lannin, D. G., Russell, L., Yazedjian, A., Kanter, J. B., & Mimnaugh, S. (2021). The effectiveness of a financial literacy and job-readiness curriculum for youth from low-income households. Citizenship, Social and Economics Education, 20(3), 197–215. [Google Scholar] [CrossRef]
- Central Intelligence Agency. (2025). The world factbook: Honduras. Available online: https://www.cia.gov/the-world-factbook/countries/honduras/ (accessed on 2 September 2025).
- Clayton, J., Gordon, J., Fabozzi, F., Giliberto, S. M., Liang, Y., & Hudson-Wilson, S. (2007). Real estate comes of age. Journal of Portfolio Management, 33, 15–26. [Google Scholar] [CrossRef]
- Collins, J. M., Halpern-Meekin, S., Harvey, M., & Hoiting, J. (2023). “I don’t like all those fees” pragmatism about financial services among low-income parents. Journal of Family and Economic Issues, 44, 807–820. [Google Scholar] [CrossRef]
- Contreras-Cristán, A., & González-Barrios, J. M. (2009). A nonparametric test for symmetry based on freeman and halton’s ideas on contingency tables. Communications in Statistics—Simulation and Computation, 38(9), 1856–1869. [Google Scholar] [CrossRef]
- Cwynar, A. (2021). Do women behave financially worse than men? Evidence from married and cohabiting couples. Central European Business Review, 10(5), 81–98. [Google Scholar] [CrossRef]
- Davis, L. E. (2016). Identifying the financialization of the nonfinancial corporation in the US economy: A decomposition of firm-level balance sheets. Journal of Post Keynesian Economics, 39(1), 115–141. [Google Scholar] [CrossRef]
- dos Santos, J. O., & Barros, C. A. S. (2011). What determines the financial decision-making: Reason or emotion? RBGN-Revista Brasileira de Gestao de Negocios, 13(38), 7–20. [Google Scholar] [CrossRef]
- Faturohman, T., Megananda, T. B., & Ginting, H. (2024). Improving financial wellbeing in Indonesia: The role of social media as a mediating factor in financial behavior. Cogent Social Sciences, 10(1), 2319374. [Google Scholar] [CrossRef]
- Fernández-Guadaño, J. (2015). Measuring the economic performance of socially responsible companies. Zbornik Radova Ekonomskog Fakulteta U Rijeci-Proceedings of Rijeka Faculty of Economics, 33(2), 207–233. [Google Scholar] [CrossRef]
- Ferrando, P. J., & Lorenzo-Seva, U. (2017). Program FACTOR at 10: Origins, development and future directions. Psicothema, 29(2), 236–240. [Google Scholar] [CrossRef]
- Ferrando, P. J., Lorenzo-Seva, U., Hernández-Dorado, A., & Muñiz, J. (2022). Decalogue for the factor analysis of test items. Psicothema, 34(1), 7–17. [Google Scholar] [CrossRef]
- Freeman, G. H., & Halton, J. H. (1951). Note on an exact treatment of contingency, goodness of fit and other problems of significance. Biometrika, 38(1/2), 141–149. [Google Scholar] [CrossRef]
- Garrison, S. T., Rampold, S. D., Vasquez, K., Gillen, M., & Baker, L. M. (2022). Parents’ employment, income, and finances before and during the COVID-19 pandemic. Journal of Consumer Affairs, 56(1), 276–291. [Google Scholar] [CrossRef] [PubMed]
- Ghazali, M. S., Idris, N. H., Alwi, S. F. S., Osman, I., & Mansor, F. (2025). Exploring financial well-being among emerging adults in the Malaysian workforce: A family resource management perspective. Journal of Nusantara Studies-Jonus, 10(2), 273–299. [Google Scholar] [CrossRef]
- Gudmunson, C. G., & Danes, S. M. (2011). Family financial socialization: Theory and critical review. Journal of Family and Economic Issues, 32(4), 644–667. [Google Scholar] [CrossRef]
- Hallsworth, M., List, J. A., Metcalfe, R. D., Rotaru, K., & Vlaev, I. (2024). The making of Homo Honoratus: From omission to commission. Journal of Consumer Psychology, 34(4), 588–600. [Google Scholar] [CrossRef]
- Herrador-Alcaide, T. C., Hernández-Solís, M., & Topa, G. (2021). A model for personal financial planning towards retirement. Journal of Business Economics and Management, 22(2), 482–502. [Google Scholar] [CrossRef]
- Ho, A. D., & Yu, C. C. (2015). Descriptive statistics for modern test score distributions: Skewness, kurtosis, discreteness, and ceiling effects. Educational and Psychological Measurement, 75(3), 365–388. [Google Scholar] [CrossRef]
- Hughes, D. J. (2018). Psychometric validity. In P. Irwing, T. Booth, & D. J. Hughes (Eds.), The Wiley handbook of psychometric testing (pp. 751–779). Wiley. [Google Scholar] [CrossRef]
- Johan, I., Rowlingson, K., & Appleyard, L. (2021). The effect of personal finance education on the financial knowledge, attitudes and behaviour of university students in Indonesia. Journal of Family and Economic Issues, 42, 351–367. [Google Scholar] [CrossRef]
- Kaiser, H. F., & Cerny, B. A. (1979). Factor analysis of the image correlation matrix. Educational and Psychological Measurement, 39(4), 711–714. [Google Scholar] [CrossRef]
- Kalkan, Ö. K., & Kelecioğlu, H. (2016). The effect of sample size on parametric and nonparametric factor analytical methods. Educational Sciences: Theory & Practice, 16(1), 153–171. [Google Scholar] [CrossRef][Green Version]
- Kislitsyn, D. V. (2020). Financial literacy training programs and financial behaviour: Why people do not become financially literate? Voprosy Ekonomiki, 9, 80–93. [Google Scholar] [CrossRef]
- Kreiner, C. T., Leth-Petersen, S., & Willerslev-Olsen, L. C. (2020). Financial trouble across generations: Evidence from the universe of personal loans in Denmark. Economic Journal, 130(625), 233–262. [Google Scholar] [CrossRef]
- Krijnen, W. P. (1996). Algorithms for unweighted least-squares factor analysis. Computational Statistics & Data Analysis, 21(2), 133–147. [Google Scholar] [CrossRef]
- Kumar, P., Ahlawat, P., Deveshwar, A., & Yadav, M. (2024). Do villagers’ financial socialization, financial literacy, financial attitude, and financial behavior predict their financial well-being? Evidence from an emerging India. Journal of Family and Economic Issues, 46, 802–820. [Google Scholar] [CrossRef]
- Kyriazos, T. A. (2018). Applied psychometrics: Sample size and sample power considerations in factor analysis (EFA, CFA) and SEM in general. Psychology, 9(8), 2207–2230. [Google Scholar] [CrossRef]
- Li, B., & Liu, Y. P. (2025). Household aging, commercial insurance participation, and risky asset allocation. International Review of Financial Analysis, 104, 104291. [Google Scholar] [CrossRef]
- Li, C.-H. (2016). The performance of ML, DWLS, and ULS estimation with robust corrections in structural equation models with ordinal variables. Psychological Methods, 21(3), 369–387. [Google Scholar] [CrossRef]
- Lloret-Segura, S., Ferreres-Traver, A., Hernández-Baeza, A., & Tomás-Marco, I. (2014). Exploratory item factor analysis: A practical guide revised and updated. Annals of Psychology, 30(3), 1151–1169. [Google Scholar] [CrossRef]
- Long, T. Q., & Tue, N. D. (2024). Financial knowledge and short- and long-term financial behavior across gender and generations: Evidence from Japan. Sage Open, 14(4), 21582440241295846. [Google Scholar] [CrossRef]
- Lorenzo-Seva, U. (2022). SOLOMON: A method for splitting a sample into equivalent subsamples in factor analysis. Behavior Research Methods, 54, 2665–2677. [Google Scholar] [CrossRef]
- Lorenzo-Seva, U., & Ferrando, P. J. (2021). MSA: The forgotten index for identifying inappropriate items before computing exploratory item factor analysis. Methodology, 17(4), 296–306. [Google Scholar] [CrossRef]
- Lorenzo-Seva, U., Timmerman, M. E., & Kiers, H. A. L. (2011). The Hull method for selecting the number of common factors. Multivariate Behavioral Research, 46(2), 340–364. [Google Scholar] [CrossRef]
- Méndez-Prado, S. M., Chiluiza, K., Everaert, P., & Valcke, M. (2022). Design and evaluation among young adults of a financial literacy scale focused on key financial decisions. Education Sciences, 12(7), 460. [Google Scholar] [CrossRef]
- Mielitz, K., & MacDonald, M. (2021). Post-release financial behavioral intentions of transitional center participants. Journal of Financial Counseling and Planning, 32(1), 173–186. [Google Scholar] [CrossRef]
- Morata-Ramírez, M. A., Holgado-Tello, F. P., Barbero-García, I., & Méndez, G. (2015). Confirmatory factor analysis: Recommendations for underweighted least squares method related to chi-square and RMSEA type I error. Acción Psicológica, 12(1), 79–90. [Google Scholar] [CrossRef]
- Okamoto, S., & Komamura, K. (2021). Age, gender, and financial literacy in Japan. PLoS ONE, 16(11), e0259393. [Google Scholar] [CrossRef] [PubMed]
- Patrisia, D., Abror, A., Dastgir, S., & Rahayu, R. (2023). Generation Z’s financial behaviour: The role of Islamic financial literacy. Isra International Journal of Islamic Finance, 15(2), 20–37. [Google Scholar] [CrossRef]
- Pham, K. D., & Le, V. L. T. (2023). Nexus between financial education, literacy, and financial behavior: Insights from Vietnamese young generations. Sustainability, 15(20), 14854. [Google Scholar] [CrossRef]
- Rabadan, E. J. G. (2025). Assessment on financial practices among teachers in the District of Bacuag, Division of Surigao Del Norte: Bases for intervention. International Journal of Science and Research Archive, 16(02), 808–825. [Google Scholar] [CrossRef]
- Rahman, M., Isa, C. R., Masud, M. M., Sarker, M., & Chowdhury, N. T. (2021). The role of financial behaviour, financial literacy, and financial stress in explaining the financial well-being of B40 group in Malaysia. Future Business Journal, 7(1), 52. [Google Scholar] [CrossRef]
- Ramli, Z., Muhamad Yusof, N., Md. Sum, S., & Awang, A. H. (2023). Hubungan pengetahuan dan tingkah laku kewangan dengan perancangan kewangan persaraan dalam kalangan generasi milenial. Akademika, 93(1), 373–387. [Google Scholar] [CrossRef]
- Ruxton, G. D., & Neuhäuser, M. (2010). Good practice in testing for an association in contingency tables. Behavioral Ecology and Sociobiology, 64, 1505–1513. [Google Scholar] [CrossRef]
- Sabri, M. F., Anthony, M., Law, S. H., Rahim, H. A., Burhan, N. A. S., & Ithnin, M. (2024). Impact of financial behaviour on financial well-being: Evidence among young adults in Malaysia. Journal of Financial Services Marketing, 29(3), 788–807. [Google Scholar] [CrossRef]
- Schermelleh-Engel, K., Moosbrugger, H., & Müller, H. (2003). Evaluating the fit of structural equation models: Tests of significance and descriptive goodness-of-fit measures. Methods of Psychological Research, 8(2), 23–74. [Google Scholar] [CrossRef]
- Sun, J. (2005). Assessing goodness of fit in confirmatory factor analysis. Measurement and Evaluation in Counseling and Development, 37(4), 240–256. [Google Scholar] [CrossRef]
- Van Gunten, T., & Navot, E. (2018). Varieties of indebtedness: Financialization and mortgage market institutions in Europe. Social Science Research, 70, 90–106. [Google Scholar] [CrossRef] [PubMed]
- Velicer, W. F., & Fava, J. L. (1998). Affects of variable and subject sampling on factor pattern recovery. Psychological Methods, 3(2), 231–251. [Google Scholar] [CrossRef]
- Vijaykumar, J. H. (2022). The association of financial socialization with financial self-efficacy and autonomy: A study of young students in India. Journal of Family and Economic Issues, 43(2), 397–414. [Google Scholar] [CrossRef]
- Viktorovna, B. T., & Mikhailovna, Z. E. (2020). Field dependence/field independence as a factor of financial decision making with varying degrees of risk among students. International Journal of Cognitive Research in Science Engineering and Education-IJCRSEE, 8, 113–120. [Google Scholar] [CrossRef]
- Warchlewska, A. (2024). Interdisciplinary approach to consumer financial behavior: Developing a conceptual framework. International Journal of Consumer Studies, 48(6), e13091. [Google Scholar] [CrossRef]
- Weissberger, G. H., Nguyen, A. L., Lim, A. C., Fenton, L., Mosqueda, L., & Han, S. D. (2025). The cognitive correlates of financial literacy in older adults. Clinical Gerontologist, 48(3), 459–467. [Google Scholar] [CrossRef]
- West, S., Banerjee, M., Phipps, B., & Friedline, T. (2017). Coming up short: Family composition, income, and household savings. Journal of the Society for Social Work and Research, 8(3), 355–377. [Google Scholar] [CrossRef]
- Williams, C. A. (1950). The choice of the number and width of classes for the chi-square test of goodness of fit. Journal of the American Statistical Association, 45(249), 77–86. [Google Scholar] [CrossRef]
- Wolf, E. J., Harrington, K. M., Clark, S. L., & Miller, M. W. (2013). Sample size requirements for structural equation models: An evaluation of power, bias, and solution propriety. Educational and Psychological Measurement, 73(6), 913–934. [Google Scholar] [CrossRef]
- Wuensch, K. L. (2025). Chi-square tests. In M. Lovric (Ed.), International encyclopedia of statistical science (pp. 466–468). Springer. [Google Scholar] [CrossRef]
- Xiao, J. J., & Meng, K. X. (2024). Financial capability and financial anxiety: Comparison before and during the COVID-19 pandemic. International Journal of Bank Marketing, 42(6), 1348–1369. [Google Scholar] [CrossRef]
- Xiao, J. J., & Porto, N. (2022). Financial capability and wellbeing of vulnerable consumers. Journal of Consumer Affairs, 56(2), 1004–1018. [Google Scholar] [CrossRef]
- Ximénez, M. C., & García, A. G. (2005). Comparison of maximum likelihood and unweighted least squares estimation methods in confirmatory factor analysis by Monte Carlo simulation. Psicothema, 17(3), 528–535. Available online: https://www.psicothema.com/pii?pii=3140 (accessed on 10 October 2025).
- Xiong, T. L., Ma, Z. S., Li, Z. Z., & Dai, J. Q. Y. (2022). The analysis of influence mechanism for internet financial fraud identification and user behavior based on machine learning approaches. International Journal of System Assurance Engineering and Management, 13(Suppl. 3), 996–1007. [Google Scholar] [CrossRef]
- Yang-Wallentin, F., Jöreskog, K. G., & Luo, H. (2010). Confirmatory factor analysis of ordinal variables with misspecified models. Structural Equation Modeling: A Multidisciplinary Journal, 17(3), 392–423. [Google Scholar] [CrossRef]
Disclaimer/Publisher’s Note: The statements, opinions and data contained in all publications are solely those of the individual author(s) and contributor(s) and not of MDPI and/or the editor(s). MDPI and/or the editor(s) disclaim responsibility for any injury to people or property resulting from any ideas, methods, instructions or products referred to in the content. |
© 2025 by the authors. Licensee MDPI, Basel, Switzerland. This article is an open access article distributed under the terms and conditions of the Creative Commons Attribution (CC BY) license (https://creativecommons.org/licenses/by/4.0/).