You are currently viewing a new version of our website. To view the old version click .
Journal of Risk and Financial Management
  • Article
  • Open Access

Published: 8 October 2025

Bitcoin Supply, Demand, and Price Dynamics

and
Satoshi Action Education, Portland, OR 97214, USA
*
Author to whom correspondence should be addressed.
This article belongs to the Section Financial Technology and Innovation

Abstract

We refine a bottom-up, quantity-clearing framework of Bitcoin price formation that couples its fixed 21-million-coin cap with plausible demand growth and execution behavior. This approach relies on first-principles economic supply-and-demand dynamics rather than assumptions about anticipated Bitcoin price appreciation, its price history, or its potential effectiveness in demonetizing other asset classes. We considered five key high-level factors that may affect price determination: level of market demand; intertemporal investment preferences; fiat-denominated withdrawal sensitivity; initial liquid supply; and daily withdrawal levels from liquid supply. With a goal of both increasing understanding of the impacts of price drivers and developing probabilistic forecasts, we show two models: (1) a baseline to assess the impacts of parameter changes, alone and in combination, on Bitcoin price trajectories and liquid supply over time and (2) a Monte Carlo simulation that incorporates uncertainty across a range of uncertain parameterizations and presents probabilistic price and liquid supply forecasts to 2036. Our baseline model highlighted the importance of liquid supply and withdrawal sensitivity in price impacts. The Monte Carlo simulation results suggest a 50% likelihood that Bitcoin price will exceed USD 5.17 M by April 2036. Generally, prices from the low single millions to the low tens of millions per Bitcoin by 2036 emerge under broad parameter sets; hyperbolic paths to higher price levels are relatively rare and concentrate when liquid supply falls near or below BTC 2 M and withdrawal sensitivity is low. Our results help locate where right-tail risk and disorderly market outcomes concentrate and suggest that policy tools are available to help guide trajectories.

1. Introduction

Bitcoin introduced absolute digital scarcity in an electronic currency, capping issuance at 21 M coins (). What began as an open-source experiment evolved into a global asset that is currently being integrated into the world’s financial system (; ). Fifteen years on, listed companies, pension funds, university endowments, and several sovereign wealth funds have entered the market (), seeking a store of value that hedges against inflation, currency debasement, and a variety of economic and political risks (; ; ).
Bitcoin’s fixed 21 M supply cap and growing role in global finance have prompted efforts to understand the mechanisms that drive long-term price formation (e.g., ; ). Much of the existing literature relies on top-down approaches, such as estimating Bitcoin’s potential share of global asset markets, or on curve-fitting techniques that extrapolate from its historical price path. While such methods provide broad heuristics, they obscure the underlying economic processes that determine how price responds to shifts in demand and supply.
A quantity-clearing framework offers a bottom-up alternative (). Supply- and demand-oriented research on Bitcoin price determination is relatively rare (but see ; ). (), however, modeled daily Bitcoin price formation based only on supply-and-demand dynamics, using a constant-elasticity-of-substitution (CES) demand function and inelastic supply. By modeling Bitcoin as a good with a perfectly inelastic supply at each time step, price emerges endogenously as demand interacts with supply. This allows researchers to assess how long-term trajectories unfold under different assumptions about demand growth, investor preferences, and execution behavior, rather than presupposing specific adoption targets or reversion patterns.
() found that moderate daily purchases by institutions could trigger hyperbolic price appreciation once liquid supply drops below about BTC 2 M. Three uncertainties, however, constrain their findings: the true level of liquid supply held permanently by price-inelastic investors; uncertainties in the functional form and distributions of some key model parameters (e.g., market demand growth, CES elasticity, withdrawal rates to long-term Bitcoin reserves), and the absence of a behavioral brake on Bitcoin purchases as its price appreciated in USD terms.
We refine this approach by using the Epstein–Zin (“EZ”) recursive utility function () to capture intertemporal investment tradeoffs and by explicitly parameterizing execution behavior with a fiat-denominated withdrawal-sensitivity term. The EZ utility function seems particularly well-suited for Bitcoin modeling because of the mix of short-term traders and speculators in a market that also contains long-term holders who appear willing to buy and withdraw Bitcoin from circulating supply even as prices increase. These choices extend beyond representative-agent constant-elasticity specifications, making it possible to explore how preferences and discipline interact with Bitcoin’s finite supply. Our model further incorporates initial liquid supply conditions and daily withdrawal rates to capture the mechanics of market depth.
Our analysis proceeds in stages. First, in a baseline model, we examine the impacts of individual parameters across a wide range of values to identify which variables exert the greatest influence on price outcomes. Second, we explore paired interactions to evaluate how combinations of key conditions, such as low supply and weak execution discipline, concentrate risk in specific regions of the parameter space. Third, we used a Monte Carlo simulation to estimate probabilistic bands around price and market capitalization forecasts.
The objective of this research is not to deliver a single point forecast but to clarify the mechanisms that generate steep-but-bounded price appreciation as the baseline and hyperbolic repricing as a contingent outcome. By linking trajectories to potentially quantifiable factors—including liquid supply balances, execution behavior, and the pace and composition of growing market demand—the framework provides an economically grounded basis for interpreting Bitcoin’s transition to a global asset class and identifying policy-salient levers to reduce potential risks.

2. Background

2.1. Bitcoin’s Fixed Supply

Precious metals, agricultural products, and other commodities all have some degree of supply elasticity. When market demand rises, increasing prices, suppliers respond: producers currently idled, because their marginal costs of production exceed market price, again become profitable. New producers are enticed to enter the market, existing producers expand production, and, over time, increasing supply puts downward pressure on market prices, resulting in now-familiar commodity boom-bust price cycles ().
None of the traditional commodities, however, have an absolutely capped supply; Bitcoin, on the other hand, is by design capped at 21 M coins that are slowly minted and enter the global market through an energy-intensive “mining” process (; ). Miners cannot find a new Bitcoin source to mine: they can only expand operations and improve mining efficiency to become more competitive and capture a bigger slice of the fixed Bitcoin pie. However, block reward levels are pre-determined by the protocol (): additional computing power that comes online triggers a bi-weekly difficulty adjustment that reduces the rewards for each producer, keeping newly minted Bitcoin rolling out, on average, every 10 min.
Every 210,000 blocks (≈4 years), new issuance of Bitcoin is cut in half, and by the year 2140, the final remnants of Bitcoin will be mined. As of the 20 April 2024 halving, the fourth in Bitcoin’s history, block rewards were cut to BTC 3.125, limiting daily production to BTC 450. By 29 July 2025, a total of BTC 19.90 M had been mined (https://ycharts.com/indicators/bitcoin_supply, accessed on 21 August 2025), leaving 1.1 M to be added to circulating supply over the next 115 years.

2.2. Liquid Supply

Headline figures overstate liquidity because not all 19.90 M of currently circulating Bitcoin created is available to trade. About BTC 1 M attributed to Satoshi Nakamoto’s early mining has never moved and is assumed to be inaccessible. Further, some estimates suggest that as much as BTC 3.7 M is lost, though a more modest estimate puts the total at around 1.57 M (https://river.com/learn/what-happens-to-lost-bitcoin/, accessed on 21 August 2025).
The Bitcoin balances of individuals and institutions can be stored in either custodied centralized exchanges or self-custodied offline. Each Bitcoin migrating out of an exchange into self-custody is often destined for HODLing (HODL is a term used in the Bitcoin community to denote “hold on for dear life”), resulting in long-term or permanent withdrawal from liquid supply.
Bitcoin that is held for over 155 days in offline cold wallets has a low propensity to re-enter the market (https://insights.glassnode.com/quantifying-bitcoin-hodler-supply/, accessed on 21 August 2025). On-chain data cannot, however, be used to help understand the motives of long-term holders, nor the likelihood that holdings are HODLed “forever” as a generational savings account or are being used passively, as part of the credit base.

2.3. Market Demand

Institutional demand has become the primary Bitcoin sink. US spot Bitcoin exchange-traded funds (ETFs), which represent the investments of thousands of individuals and firms, now have custody of about BTC 1,250,000 (5.9% of total supply). BlackRock’s popular Bitcoin ETF on its own holds >BTC 730,000 (https://www.blackrock.com/us/individual/products/333011/ishares-bitcoin-trust-etf, accessed on 21 August 2025). Soon after their launch, ETFs were removing about BTC 10,000 per day from liquid supply (), although a portion of that appears to have been from institutional holders simultaneously opening long ETF positions and short Bitcoin futures in a basis trade.
Among the top 100 public Bitcoin treasury companies, holdings exceeded BTC 923,000 by 28 July 2025 (https://bitcointreasuries.net/; https://bitbo.io/treasuries/, accessed on 21 August 2025). MicroStrategy (now rebranded as “Strategy”) dominates, holding >BTC 607,000 at that time. Private corporations account for about another BTC 285,000, and firms around the globe are adopting new corporate treasury strategies, suggesting there could be substantial additions to balance sheets in the coming year.
Bitcoin miners can also retain production: Marathon mined BTC 950 and sold none in May 2025, increasing its treasury to BTC 49,179 (https://www.nasdaq.com/press-release/mara-announces-bitcoin-production-and-mining-operation-updates-may-2025-2025-06-03, accessed on 21 August 2025): that accounts for about BTC 31 per day being withheld from other market buyers. Some smaller listed miners follow the same playbook, holding back Bitcoin to strengthen their balance sheets.
Sovereign actors are joining the queue, and their acquisitions have the potential to absorb thousands of Bitcoin daily, much of which may never return to exchanges, in compressed timeframes. Bhutan already holds Bitcoin (https://intel.arkm.com/explorer/entity/druk-holding-investments, accessed on 21 August 2025) that it mined with hydroelectric power. The US is mulling over the formation of a Bitcoin strategic reserve (), with some elected officials advocating for the purchase of up to BTC 1 M over the next five years (https://www.lummis.senate.gov/wp-content/uploads/BITCOINAct.pdf, accessed on 21 August 2025). Other nations are less transparent, but they could already hold >BTC 900,000 (https://www.ccn.com/news/crypto/bhutan-top-crypto-nations-full-list-of-countries/, accessed on 21 August 2025).
A large proportion of Bitcoin holders remain unknown, with >BTC 13.7 M held in wallets that cannot be clearly identified by ownership type (https://bitcointreasuries.net/, accessed on 21 August 2025). Table 1 shows a 29 July 2025 snapshot of Bitcoin distribution, based on current data from various tracking firms.
Table 1. Assumed distribution of Bitcoin as of 29 July 2025 (value calculations based on USD 117, 900 per BTC; see text above for data sources).
Complicating this snapshot, the mix of liquid and illiquid Bitcoin cuts across holder types. Illiquid Bitcoin supply was estimated to have reached 14.4 M by late-June 2025, leaving about 3.0 M liquid supply from the 17.4 M of circulating supply (https://sg.finance.yahoo.com/news/bitcoin-illiquid-supply-climbs-over-100639316.html, accessed on 21 August 2025). However, it is unclear what proportion of the 14.4 M is truly illiquid. Some could be dormant but accessible, with the potential to return to market if the price is high enough to entice long-term HODLers to re-activate their wallets and cash out some “lifestyle chips.” In the baseline model calibration below, we initially assume that 40% of illiquid supply (BTC 5.76 M) will never come back to the market; in the Monte Carlo model, we later completely relax that assumption.

2.4. Market Outflows

Current evidence suggests that there is BTC 5000 to 6000 being removed from liquid supply daily. Illiquid supply climbed from BTC 13.9 M on 1 January 2025 to 14.37 M by 26 June 2025, a change of BTC 470,000 (about BTC 2650 per day). Recent daily ETF inflows (https://www.fxleaders.com/news/2025/07/21/bitcoin-etfs-add-2-39b-in-weekly-inflows-as-holdings-hit-152-4-billion/, accessed on 21 August 2025) of about BTC 2900, plus Strategy’s current cadence of roughly BTC 1000, already alone remove BTC 3900 every day (almost nine times new issuance). Add miner retention, episodic corporate block buys, retail investor purchases, and occasional sovereign purchases, and a withdrawal rate of BTC 6000 or more per day becomes very plausible.

3. Methodology

3.1. Previous Bitcoin Supply-and-Demand Model

() constructed a discrete supply-and-demand equilibrium model anchored on Bitcoin’s immutably fixed supply and a flexible CES demand function. The framework used 20 April 2024, the date of the fourth halving, as its starting date, with known issuance of BTC 19.69 M and a market price of USD 64,858. It projected supply, demand, and equilibrium price through 16 April 2036, the anticipated date for the seventh halving. Supply was represented by a perfectly vertical curve: mining rewards added a pre-set trickle of new coins and liquid supply was updated each day, accounting for any withdrawals to long-term reserves. By using flexible daily withdrawal rates and other assumptions, their model generated price paths based on how quickly the liquid supply might shrink. They used the model to explore how changes in adoption curves, increasing market demand, and withdrawal rates up to BTC 4000 per day from liquid supply affected price trajectories: outcomes included both orderly and hyperbolic price appreciation pathways.
() acknowledged several limitations in their first-generation model. Of particular relevance for this paper, they noted that the appearance of hyperbolic price paths may stem from uncertainty regarding functional forms of key variables, suggesting the need for further testing with alternative specifications. Many inputs—the proportion of current illiquid coins that will never return to market, lost coin counts, HODL behavior, and future adoption rates—all carry deep uncertainty, so routine recalibrations and new stochastic simulations are needed to stress-test parameter space.

3.2. Modeling Context

The CES demand function () expresses quantity demanded as Q = APε, where the shift term A governs the overall scale of demand and the elasticity parameter ε measures the percentage change in quantity demanded for a 1% change in price. CES utility offers a tractable way to model how demand becomes more or less price-sensitive over time by letting A and ε evolve exogenously. In utility terms, CES implicitly treats risk and time as second-order concerns: agents care only about price–quantity tradeoffs in the current period.
The constant relative risk aversion (CRRA) utility specification (; ), U = (Q1−γ)/(1 − γ), links directly to asset demand via the first-order condition Q = APγ. Mathematically, this is identical to a CES demand curve with ε = −γ; economically, the parameter γ can be interpreted as investors’ coefficient of relative risk aversion. A high γ describes risk-averse agents who quickly cut quantity when price rises, whereas a low γ captures more risk-tolerant, price-insensitive buyers. CRRA curves have been used in Bitcoin modeling (), including BlackRock’s Bitcoin portfolio allocation research (), and embed risk preferences in the same single parameter that drives price elasticity. CRRA and other utility functions that consider human risk tolerance suggest that some agents may hold preferences for high-risk payouts, potentially leading to upward skew in prices, a potential catalyst for hyperbolic price rallies. Like CES utility models, CRRA models assume agents trade only within the current period, ignoring explicit intertemporal considerations.
The EZ framework separates risk aversion from the elasticity of intertemporal substitution (EIS, defined as 1/ρ). Solving the EZ first-order conditions yields a one-parameter demand curve Q = AP−ρ. Behind the simplicity lies richer structure: ρ is related to time preferences, governing how aggressively investors shift purchasing between today and the future. This separation makes EZ particularly well-suited for Bitcoin. Momentum traders can be represented by low ρ (high EIS/time preference), implying fast, price-sensitive rebalancing, while HODLers map to high-ρ (low EIS/time preference) behavior that dampens short-run volatility yet supports long-run price appreciation. By varying ρ, an EZ-based model can compare and contrast Bitcoin’s transition from a speculative risk-on asset toward a strategic, reserve-like store of value without conflating risk aversion and motives about spend timing with investors’ desire to hold for long-term benefits.
Note the mathematical similarity between the three functional forms, which implies similarly shaped demand curves, all of which point to the potential for steep price increases as supply is constrained and lead to hyperbolic price increases as supply approaches zero. While risk preferences may influence the timing of hyperbolic price appreciation, our view is that fundamental supply–demand dynamics can drive hyperbolic events within any of these three utility options. Our choice to use the EZ functional form was grounded in its advantages for distinguishing trading and HODLing time preferences and investor behavior, a particularly salient feature for Bitcoin given its cultural roots (; ).

3.3. Model Structure

3.3.1. Supply

Bitcoin’s circulating supply (q0 = 19,687,500 as of 20 April 2024) and future emissions are known for any particular date due to Bitcoin’s algorithmic issuance structure. In the baseline model, we deducted Bitcoin thought to be held in Satoshi’s wallets (968,000), a relatively conservative estimate of lost Bitcoin (1.57 M), and assumed that 40% of illiquid supply—5.76 M Bitcoin—was permanently HODLed. The remaining qilliquid (8.64 M) and 3.0 M known liquid supply combine to set liquid supply at BTC 11.64 M (we later relax these assumptions in the Monte Carlo model). Miners currently bolster the flow to liquid supply by qemissions (currently BTC 450 per day, but less after future halvings), while withdrawals to reserves and offline storage decrease liquid supply:
q l ( t ) = q 0 + t = 1 T q e m i s s i o n s ( t ) q s a t o s h i q l o s t q i l l i q u i d t = 1 T q r e s e r v e ( t )
When plugging in the assumptions, it becomes
q l ( t ) = 19,687,500 + t = 1 T q e m i s s i o n s ( t ) 968,000 1,570,000 5,760,000 t = 1 T q r e s e r v e ( t )

3.3.2. Demand Function

The EZ recursive utility function introduces three key parameters: β is the subjective discount factor, which determines pure time preference by weighting continuation utility relative to current consumption; ρ governs the elasticity of intertemporal substitution (where EIS = 1/ρ), capturing willingness to shift consumption across time; and γ is the coefficient of relative risk aversion, shaping attitudes toward uncertainty in future payoffs. The recursive utility for a representative investor is
U t = ( ( 1 β ) Q t 1 ρ + β ( E t [ U t + 1 1 γ ] ) 1 ρ 1 γ ) 1 1 ρ
where Ut = utility at time t; Qt = Bitcoin consumption at time t; and Et[Ut+1] = expected continuation utility, reflecting investors’ forward-looking beliefs and behavior.
To obtain a Bitcoin demand function, we impose three standard simplifications: (1) the investor allocates a fixed share of total wealth, Wt, to Bitcoin versus a composite “all other assets,” (2) price risk enters only through the expected return premium, and (3) consumption today is proportional to current wealth. Under these conditions, the demand curve collapses to a deterministic first-order condition:
Q t = A P t ρ
with
A β 1 ρ W t P t
In this deterministic one-good setting, the risk-aversion parameter γ drops out because no stochastic consumption or multi-asset choice generates risk premia, while the discount factor β appears only as a scaling constant in A, leaving demand dependent solely on ρ; total wealth is also absorbed in A.
When ρ is chosen and Qt known, the demand-shift parameter, A, is determined. In the case of the baseline model developed in Section 3.4, forecast price only reached a maximum of USD 115,937 by 16 April 2036 when using the range of A generated by reasonable ρ values and the known circulating supply, Q0. Given that Bitcoin’s price is currently >USD 118,000 (10 August 2025), there is a need to calibrate the demand-shift parameter, bringing it up to realistic ranges that align with empirical price history to date. Conceptually, changing the demand-shift parameter acknowledges exogenous factors that affect market demand; more detailed demand-side modeling could further clarify how rapid shifts in market sentiment affect both upward and downward price movements.
We followed the procedure used by (), creating a demand expansion parameter, A’, which incorporated a logistic adoption curve over time. The first step was to use a logistic transformation to define Bitcoin adoption over time:
A ( θ t ) = A ( 1 + e r ( t t i ) )
where A′ = transformed logistic EZ demand-shift parameter; A = original demand-shift parameter; r = daily growth rate; t = time (days) since t0 (20 April 2024, fourth halving); ti = inflection time; and theta (θt) = logistic transformation parameter that increases over time.
The midpoint, ti, of a logistic curve defines the inflection point, when growth rate decelerates. The shape of a logistic function is very flexible and can be adapted by choosing parameter T*, the time horizon to market saturation (T* = [6, 8, 10, 12, 14, 16 years]) and L_min, the logistic function minimum, where the closer to zero, the earlier in the logistic adoption curve (L_min = [0.01, 0.02, 0.03, 0.04, 0.05, 0.06, 0.07, 0.08]).
First, we calculated daily growth rate as
r d a i l y = [ l n ( 1 L _ m a x   ) 1 ] [ l n ( 1 ( 1 L _ m a x   ) 1 ] ( 365 T * )
where rdaily = daily growth rate, L_max = (1 − L_min).
A logistic transformation function, γ, was calculated using the upper saturation target and daily growth rate:
γ = L _ m a x ( 1 + e r d a i l y ( 10 365 / 2 ) )
We then applied a further EZ demand multiplier, D, to reflect exogenous market demand. This was calibrated on a zero–one scale to integrate seamlessly into the modified demand function in the Bitcoin price calculation:
A = 1 + ( ( D 1 ) ( L _ m a x   ( 1 L _ m a x   ) ) ) ( γ ( 1 L _ m a x ) )
In the baseline model, we included a range of possible values, D = [10, 20, 30, 40, 60, 80, 100]. Whenever D is >1, A′ grows proportionally in size, impacting market demand and price. The combination of D and ρ allows for differentiating the impacts of pure HODL strategies relative to increasing market demand.

3.3.3. Withdrawals from Liquid Supply

In the () model, withdrawal of Bitcoin from liquid supply continued at a steady rate even when price appreciated substantially. This does not seem particularly realistic because, irrespective of the functional form of the demand function, investors face budget constraints and market friction. To address this, we place a price-elastic execution throttle on reserve accumulation:
q r e s e r v e   ( t ) =   q b a s e 1 + α ( p ( t ) p 0 1 )
where p(t) is the simulated Bitcoin price on day t, p0 is the initial price at t = 0, and α is a user-set sensitivity parameter. As the market price rises above p0, the denominator grows, proportionally tapering the number of coins removed from circulation; when price falls, the adjustment relaxes.
The EZ parameter ρ governs investors’ willingness to pay, while α governs how that demand is implemented under fiat budget constraints, risk limits, and execution frictions. The specification means that at α = 0 purchase decisions are for a fixed number of Bitcoin per day, and at α = 1, decisions are for a fixed number of dollars per day. Preferences shape the demand curve, while withdrawal sensitivity regulates how fast Bitcoin leaves liquid supply as price changes.
When price doubles, the denominator in the sensitivity parameter becomes 1/α. By setting qreserve = 0.5(qbase), a simple closed-form relationship defines a “half life” for withdrawals:
p ( t ) p 0 =   1 + 1 α
A low value of α = 0.025 minimally throttles withdrawals by 50% when Bitcoin price increases 40×; with α = 0.10, daily withdrawals fall by 50% after an 11× price increase; and a more aggressive α = 0.50 halves withdrawals after a 3× price increase.

3.4. Baseline Model: Calibration

The purpose of the baseline model is to help build understanding about the impacts of particular parameterization choices on Bitcoin price trajectory and liquid supply depletion. We calibrated the model using prior market performance, where the goal is to identify reasonable parameter values that give plausible real-world starting points to use prior to relaxing our assumptions in the Monte Carlo model.
Following (), we set 20 April 2024, the date of the fourth halving, as the framework’s starting point, with q0 = BTC 19,687,500 and p0 = USD 64,858 (all prices henceforth are in US dollars). We used 29 July 2025 as the calibration end date (qt = BTC 19,899,097 and pt = USD 117,951). The calibration provides possible parameter combinations that closely track observed prices at the beginning and end of that period: these help us understand “reasonable” parameter values based on Bitcoin’s performance to date. The process involved the following:
  • The logistic adoption curve parameters were initially fixed at T* = 14 years and L_min = 0.05, giving a relatively slow rate of growth over the model’s time horizon, not reaching the saturation point until two years after the framework’s April 2036 (7th halving) time horizon.
  • The demand multiplier was restricted to a choice of D = [10, 20, 30] because higher multiples seemed implausible over 2024–2025.
  • The EZ parameter ρ was set to 2.0, a value that suggests the majority of allocators have relatively low time preferences. Given the continual flows into illiquid supply and the ancient 5+ year cohort, this seems consistent with market conditions since the 2024 halving.
  • Baseline withdrawals, qbase, were limited to seemingly plausible 2024–2025 values of qbase = [1000, 2000, 3000].
  • The withdrawal-sensitivity parameter, α, was set to 0.10, providing a modest reduction in daily Bitcoin purchase volume as price appreciates (11× price appreciation leads to 50% reduction in purchases).

3.5. Baseline Model: Exploration of Parameterization Impacts

After the initial baseline model calibration, we relaxed the parameterization assumptions, testing how a wider range of parameterization options affected price trajectory and liquid supply projections over the entire modeling time frame.

3.5.1. Demand Multiplier

The demand multiplier options were expanded to D = [10, 20, 30, 40, 60, 80, 100], reflecting the potential for widespread institutional investment by 2036.

3.5.2. Epstein–Zin Intertemporal Substitution Parameter

The EZ parameter was relaxed to choices drawn ρ = [0.5, 1.0, 1.5, 2.0, 2.5]. These values represent agents with a high time preference and strong trading orientation (ρ = 0.5) to low time preference investors with a very strong HODL orientation (ρ = 2.5).

3.5.3. Withdrawal Options

We used a range of daily Bitcoin withdrawals, qbase = [1000, 2000, 3000, 4000, 5000, 6000, 7000, 8000], that appear consistent with current and plausible future withdrawal rates (recall Section 2.3).

3.5.4. Withdrawal Sensitivity

The withdrawal-sensitivity parameter was drawn from α = [0.025, 0.05, 0.10, 0.20, 0.30, 0.40, 0.50]. This represented a range of behavior from a “buy the top forever” mentality (α = 0.025) to a price-sensitive buyer (α = 0.50) who halves withdrawals after a 3× price increase.

3.5.5. Two-Way Interactions

One important unknown arising from ’s () analysis was whether hyperbolic price increases are inevitable for Bitcoin, even at relatively modest levels of daily withdrawals from Bitcoin’s liquid supply. To address that issue, we simultaneously varied (1) withdrawal sensitivity, α, and baseline withdrawal, qbase, across the full range of parameter options, and (2) withdrawal sensitivity and the EZ intertemporal substitution parameter, ρ. The goal was to identify supply-side parameter combinations that could lead to hyperbolic Bitcoin price appreciation.

3.6. Compound Annual Growth Rate

In addition to price trajectories and liquid supply balances, we used compound annual growth rate (CAGR) as an additional performance metric for all models:
C A G R = ( ( p T p 0 ) 1 T 365 ) 1
where p0 and pT are prices at the beginning and end of the calibration model’s 12-year time horizon. Note that CAGR is often reported on a 4- or 10-year rolling basis, so the 12-year estimate may not be directly comparable.

3.7. Monte Carlo Simulation with Uniform Parameter Distributions

Understanding how multiple parameters interact is crucial for Bitcoin price modeling. The parameters we use in this framework capture the potentially most important factors influencing Bitcoin liquid supply and price trajectories. The ranges for each of the parameters seem reasonable, likely overlapping with their real-world values. However, there are currently no a priori preferred functional forms to specify how any of the parameters are distributed.
Given the uncertainty regarding the functional form of each variable used in simulations so far (T*, L_min, D, ρ, α, qbase, ql(t)), we used uniform distributions—10,000 random draws from across the entire range of presumably feasible values—in a Monte Carlo simulation. For the first six parameters, we used the maximum and minimum of the baseline ranges as the boundaries for the random draw.
We also relaxed our assumptions regarding liquid supply. First, there is a high level of uncertainty regarding how much Bitcoin is lost or otherwise inaccessible. Second, there is a possibility that quantum computing will eventually be able to decrypt older wallets, where most inaccessible Bitcoin is stored (). Third, the availability of derivatives and rehypothecation can act as a buffer, flattening the supply curve locally () and allowing “paper Bitcoin” to temporarily alleviate supply shortages. Fourth, as Bitcoin’s role as financial collateral strengthens and it becomes more feasible to lock Bitcoin permanently in corporate and sovereign treasuries, Layer 2 protocols, bridges, and decentralized finance applications, liquid supply might be reduced substantially.
Given the uncertainties, we drew from a uniform range of illiquid supply, q0 = U [1 M, 16.5 M], to assess a range of price trajectory forecasts in the Monte Carlo simulation. With an initial float of q0 = BTC 19,687,500 at the fourth halving, this translates to an initial liquid supply ranging from 3.19 M to 18.69 M. Note that Monte Carlo simulations can lead to much different price forecasts for both 24 April 2024 and 29 July 2025, the calibration dates for the baseline model: many of the parameter combinations would be inappropriate choices for short-term modeling. The Monte Carlo sampling, however, ensures that all parts of parameter space are explored.

4. Results

4.1. Baseline Model

We found 34 different parameter combinations that came within USD 5000 of the 29 July 2025 price (pt = USD 117,951) and could be used to calibrate the baseline model; from those, we show eight in Table 2 to illustrate the range of combinations. All modeling data are available as supporting information (https://doi.org/10.6084/m9.figshare.30167659).
Table 2. Forecast prices for 21 April 2024 and 29 July 2025 for eight parameterization combinations (* and bold denote the baseline model).
The forecast price trajectories of four scenarios (2, 4, 5, 7) illustrate the general price trend, although Bitcoin price is volatile, with extended periods above and below the predicted price trajectory due to short-run fluctuations in market demand (Figure 1).
Figure 1. Comparison of forecast price trajectories compared to actual Bitcoin prices over calibration period.
The scenarios differ little over the 15-month calibration period: over the full duration of the model, however, parameterization differences would become apparent should these parameter values hold over the longer term. Scenario 2 results in relatively steady Bitcoin price appreciation with logistic curve parameters (L_min = 0.05 and T* = 14 years) that favor slower, steadier Bitcoin adoption and modest withdrawals of qbase = BTC 1000 per day. Scenario 5 (L_min = 0.06 and T* = 16 years) uses an even more conservative adoption curve parameters but increases daily withdrawals to reserves to BTC 2000 per day. Scenario 7 (L_min = 0.03 and T* = 12 years) features a more aggressive S-shaped price appreciation curve, resulting from relatively rapid Bitcoin adoption.
The parameterization in Scenario 2 provides a conservative take on Bitcoin adoption over time, but it assumes very modest withdrawals from liquid supply, taking liquid supply down only slightly, to 9.92 M, at the end of the modeling time horizon. It forecasts a Bitcoin price of USD 1.39 M and market capitalization of USD 29.0 T by 16 April 2036. The real-world level of withdrawals to reserves appears, however, to be >1000 per day over the 2024–2025 period, suggesting that it may be more realistic to increase assumed withdrawals to qbase = BTC 2000 per day (the amount estimated in ’s () CES model) for a baseline model. Scenario 4 has this parameter combination, which we adopted as the baseline for the sensitivity simulations that follow.
Table 3 shows headline results for the four scenarios. None exhibit hyperbolic price appreciation, which only becomes clear at around 2 M liquid supply. Market capitalization ranges from USD 29 to USD 41 T: for comparison, gold is currently (29 July 2025) valued at USD 22.4 T and Bitcoin at USD 2.3 T (https://companiesmarketcap.com/assets-by-market-cap/, accessed on 21 August 2025). CAGR estimates (29–33%, based on a 12-year time horizon) are in the same range as current CAGR (29.3% based on a 4-year rolling time horizon over the past four years). The USD 1 M per Bitcoin price milestone is forecast to occur between August 2030 and February 2032.
Table 3. A comparison of important outcomes for 4 (of 32) baseline model candidates (* and bold denote the chosen baseline model).

4.2. Variations on the Baseline Model

4.2.1. Changes in the Demand-Shift Parameter

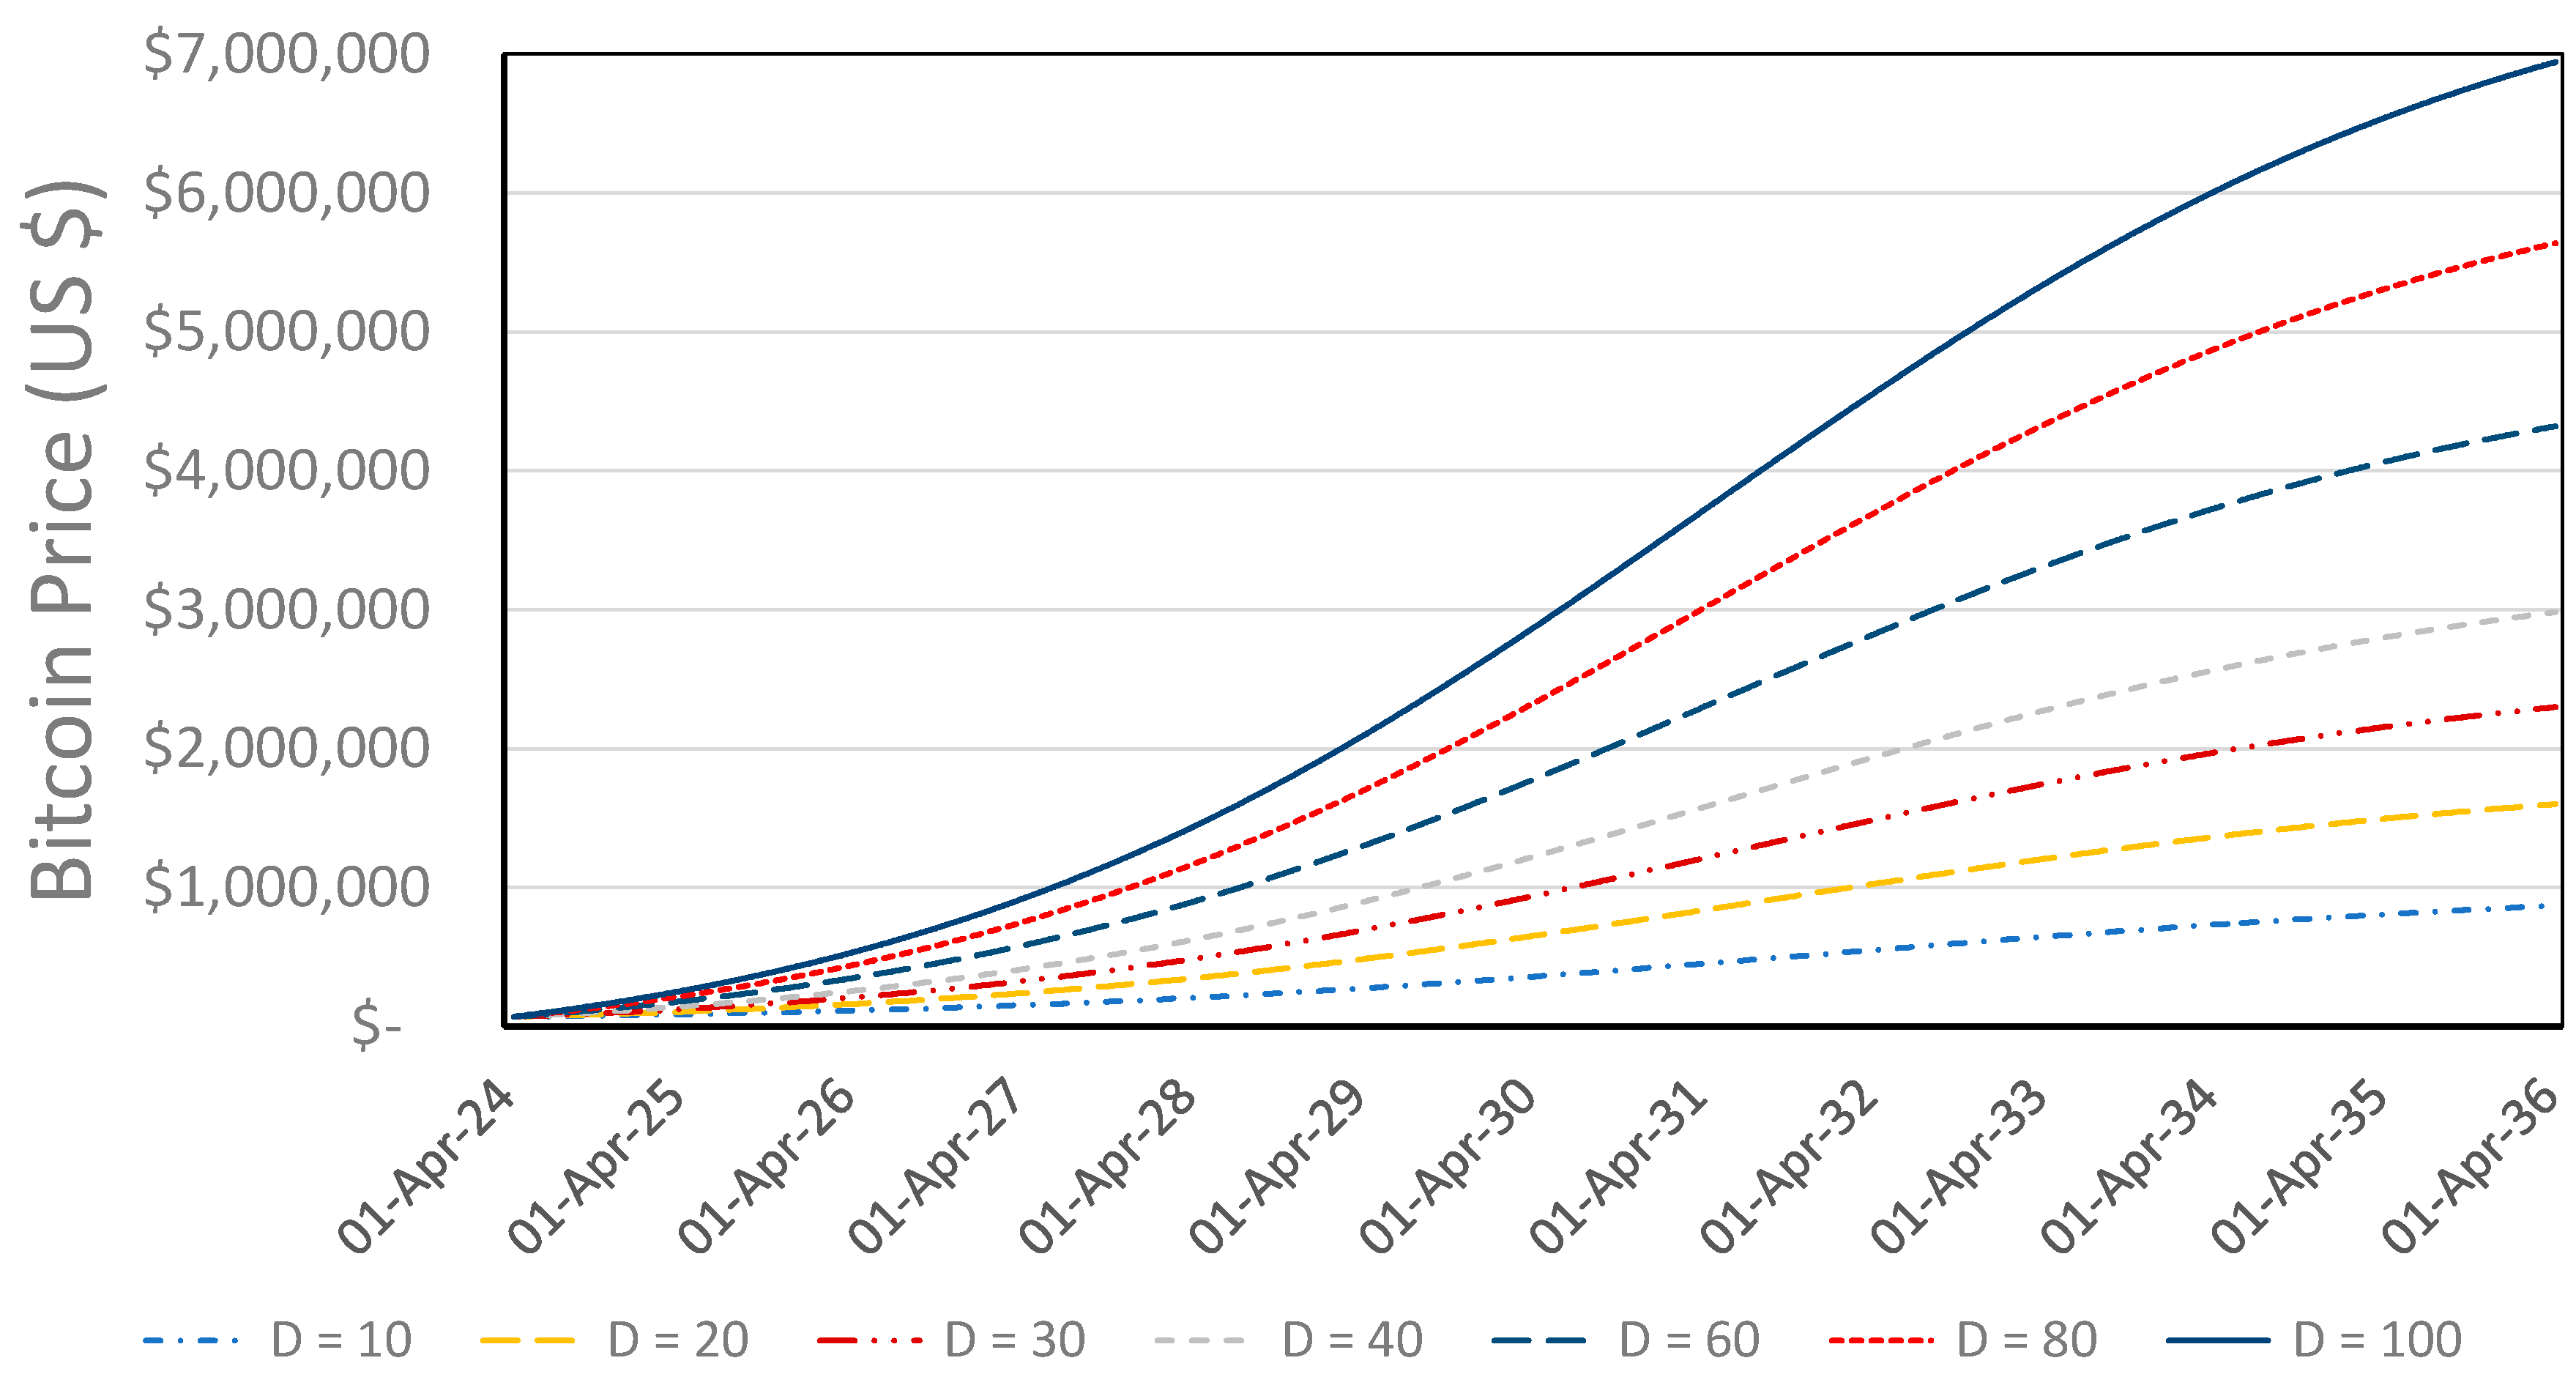
For all parameterization tests in Section 4.2 and Section 4.3, we held the shape of the adoption curve steady (L_min = 0.05; T* = 14 years). We first varied D from 10 to 100 while holding the daily withdrawal flow at BTC 2000 and the withdrawal-sensitivity coefficient, α, at 0.10 (Table 4). Forecast prices for 16 April 2036 rise from USD 869,843 when D = 10 to nearly USD 6.94 M when D = 100. Compound annual growth accelerates from 24.2% to 47.6%, and the USD 1 M milestone accelerates from February 2032 when D = 20 to June 2027 in the most aggressive variation. Market capitalization follows the same pattern, climbing from USD 18 T to USD 145 T.
Table 4. Key model outputs when the demand shifter, D, varies.
Note that stronger demand does not pull more coins out of circulation. With D = 10, liquid supply contracts to 6.4 M, while at D = 100 it still exceeds 9.8 M. The withdrawal function’s price elasticity discourages marginal buyers from removing additional Bitcoin once price climbs quickly, so the demand shock expresses itself mainly through steeper price paths, not tighter supply. Because withdrawals remain capped at BTC 2000 per day, none of these simulations enters the hyperbolic regime seen when we later raise the withdrawal flow.
Figure 2 shows the resulting price trajectories over the model’s complete time horizon. Each curve launches from the calibrated 2024 baseline and arches upward in proportion to D, then flattens (slowing as the logistic adoption curve passes the inflection point in year 7 and is two years from saturation by 2036). Even the D = 100 path bends rather than turns vertical, implying that growing market demand alone cannot trigger runaway prices, as liquid supply levels remain above BTC 6 M. Together, Table 4 and Figure 2 suggest that larger demand shifts compress the timetable for price milestones but leave the underlying supply intact, preventing the self-reinforcing scarcity spiral that emerges when withdrawals rise.
Figure 2. Bitcoin price trajectory forecasts when the demand multiplier, D, varies from the baseline scenario.

4.2.2. Changes in the Epstein–Zin Intertemporal Substitution

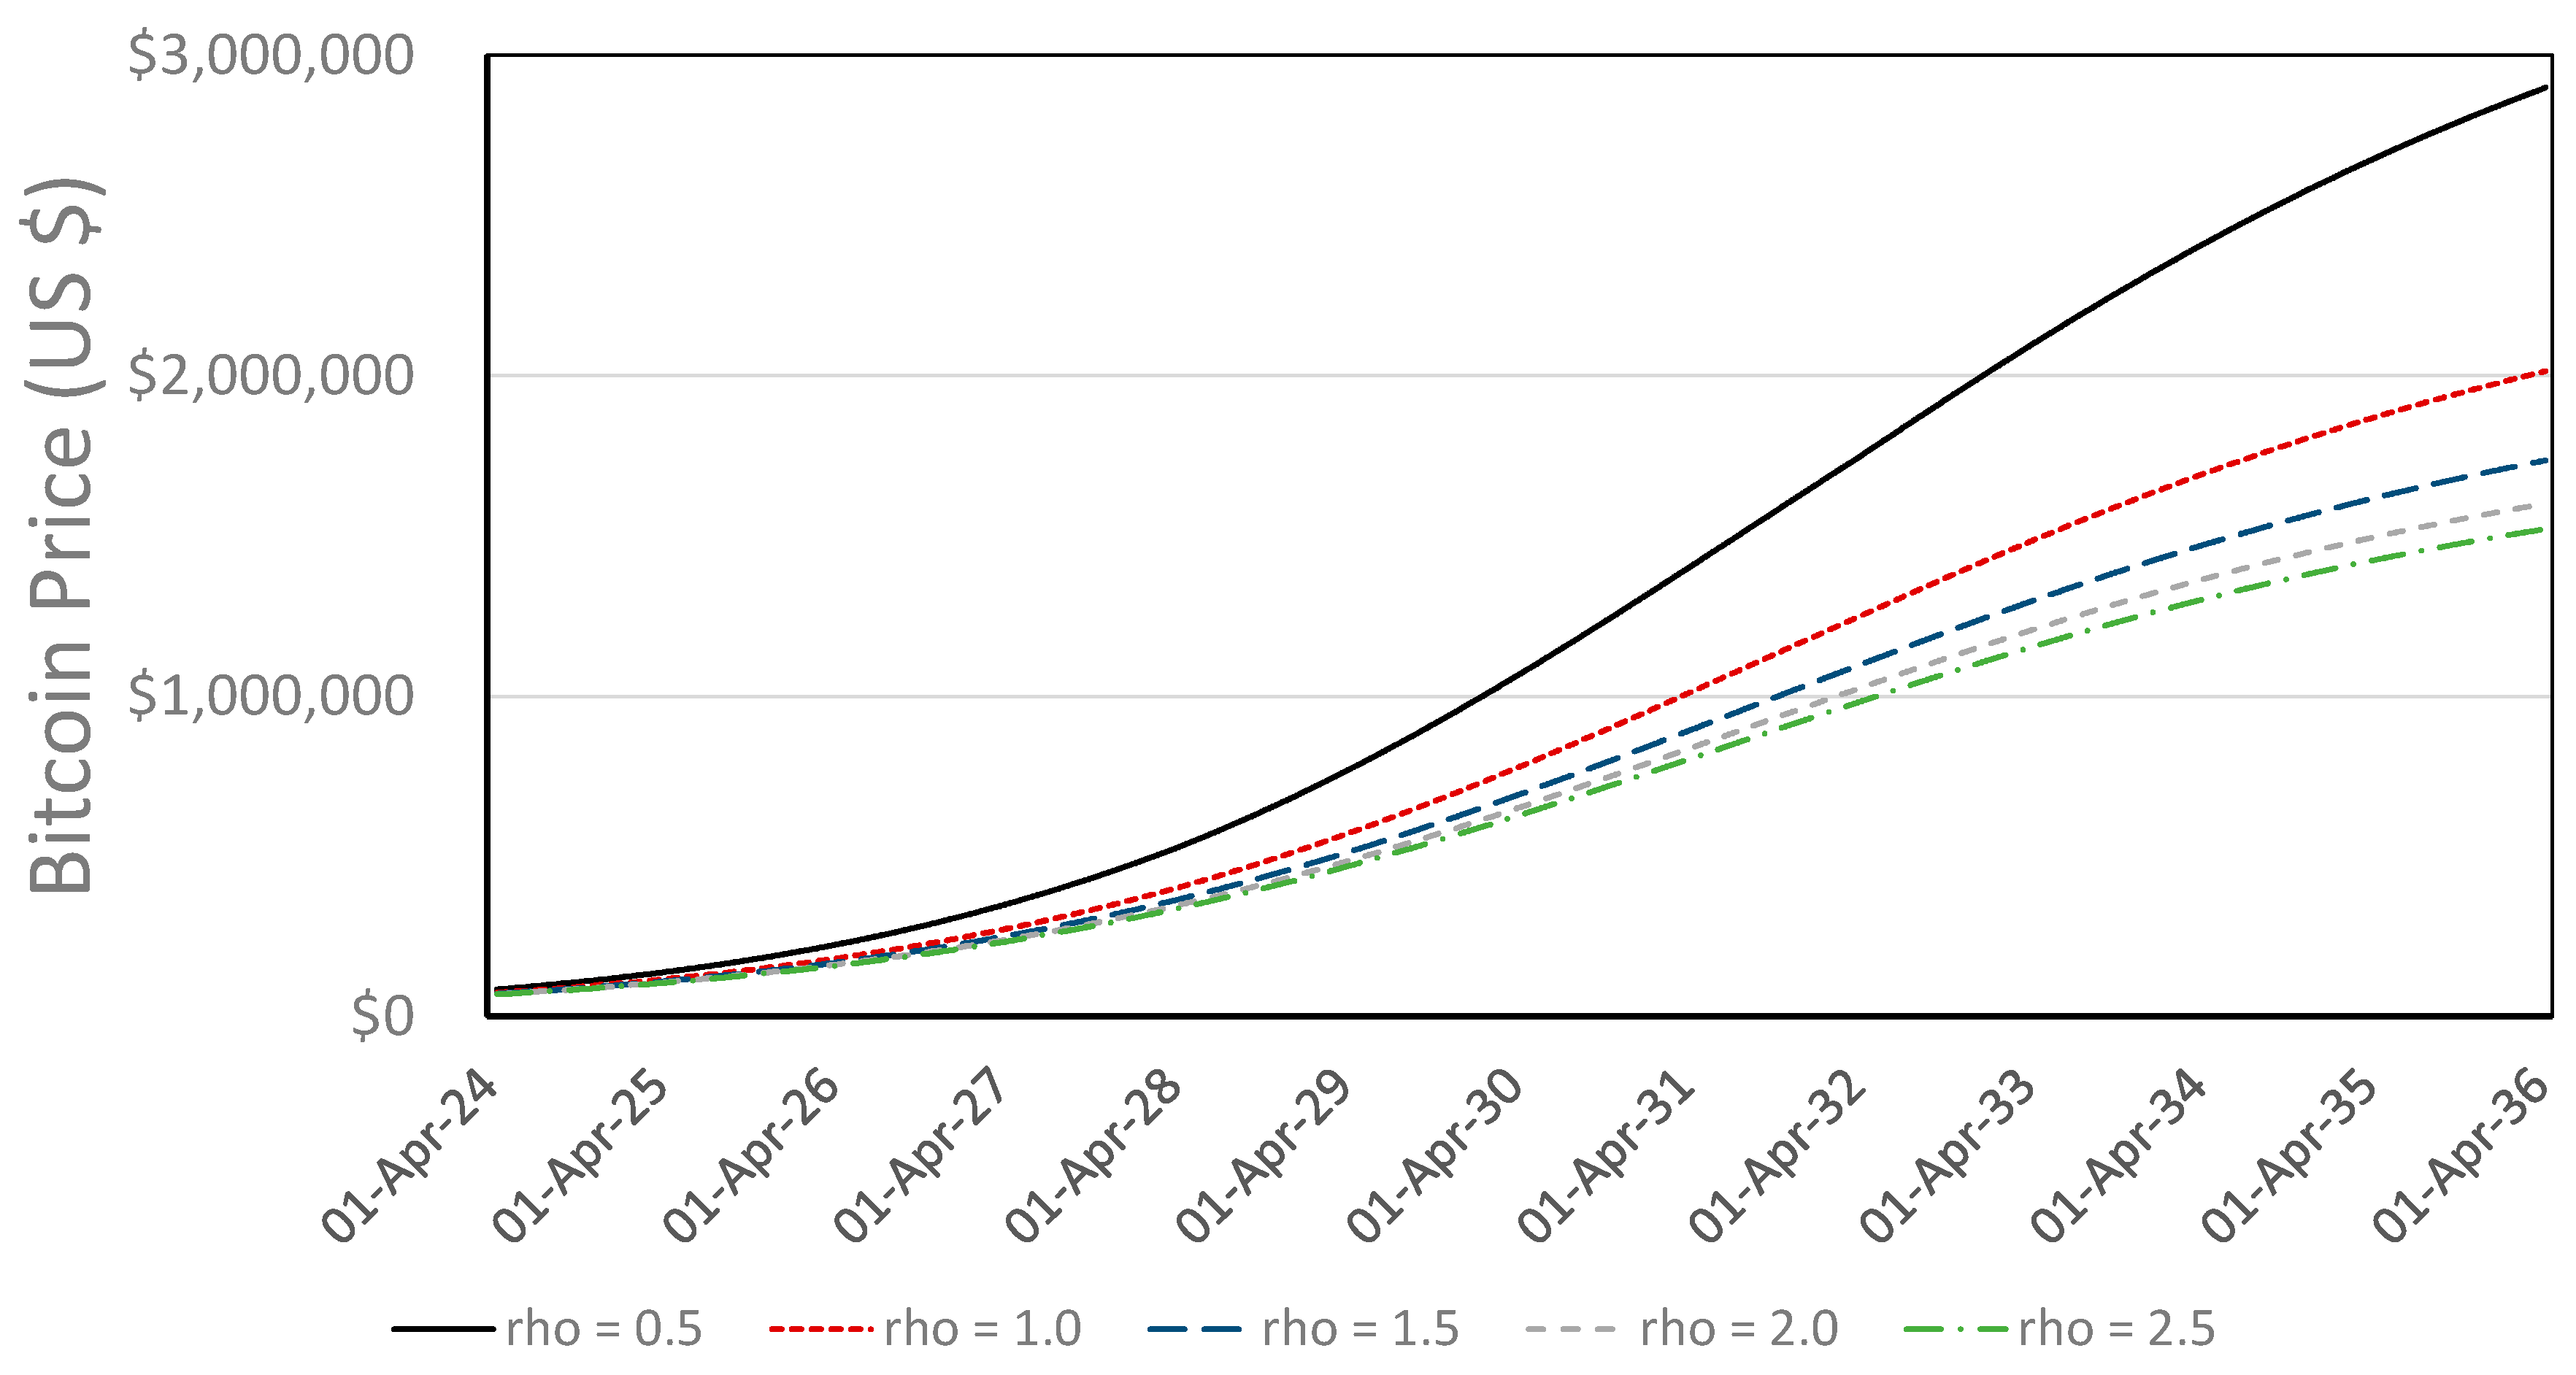
The EZ framework separates risk aversion from elasticity of intertemporal substitution, a function of ρ. We varied ρ from 0.5 to 2.5 while holding the demand shifter at D = 20, the daily withdrawal flow at BTC 2000, and the withdrawal-sensitivity coefficient at α = 0.10. Relative to the baseline scenario with ρ = 2.0, lowering ρ to 0.5 increases the 16 April 2036 price from USD 1.60 M to USD 2.90 M and expands market capitalization from USD 33 T to USD 60 T (Table 5). The effect fades as ρ rises: at 1.0 the price retreats to USD 2.01 M, at 1.5 to USD 1.74 M, and at 2.5 to USD 1.52 M. Liquid supply moves in the opposite direction. The trading-oriented ρ = 0.5 scenario leaves 8.39 M coins in circulation, whereas the HODL-oriented setting retains 7.41 M. Lower ρ boosts headline valuations by enabling rapid turnover yet simultaneously maintains a deeper pool of liquid Bitcoin.
Table 5. Key model outputs when the EZ parameter, ρ, varies.
Figure 3 shows the resulting price trajectories. The ρ = 0.5 curve is steepest, reaching USD 1 M by January 2030. Each successive increase in ρ delays that milestone: 29 March 2031 (ρ = 1.0); 21 October 2031 (ρ = 1.5); 24 February 2032 (ρ = 2.0); and 19 May 2032 (ρ = 2.5).
Figure 3. Bitcoin price trajectory forecasts when the EZ intertemporal substitution parameter, ρ, varies within the baseline model.
All curves retain >BTC 7 M at the end of the forecast horizon, well above any scarcity threshold that drives the hyperbolic outcomes observed in the later withdrawal flow simulations.

4.2.3. Changes in the Daily Withdrawals from Liquid Supply

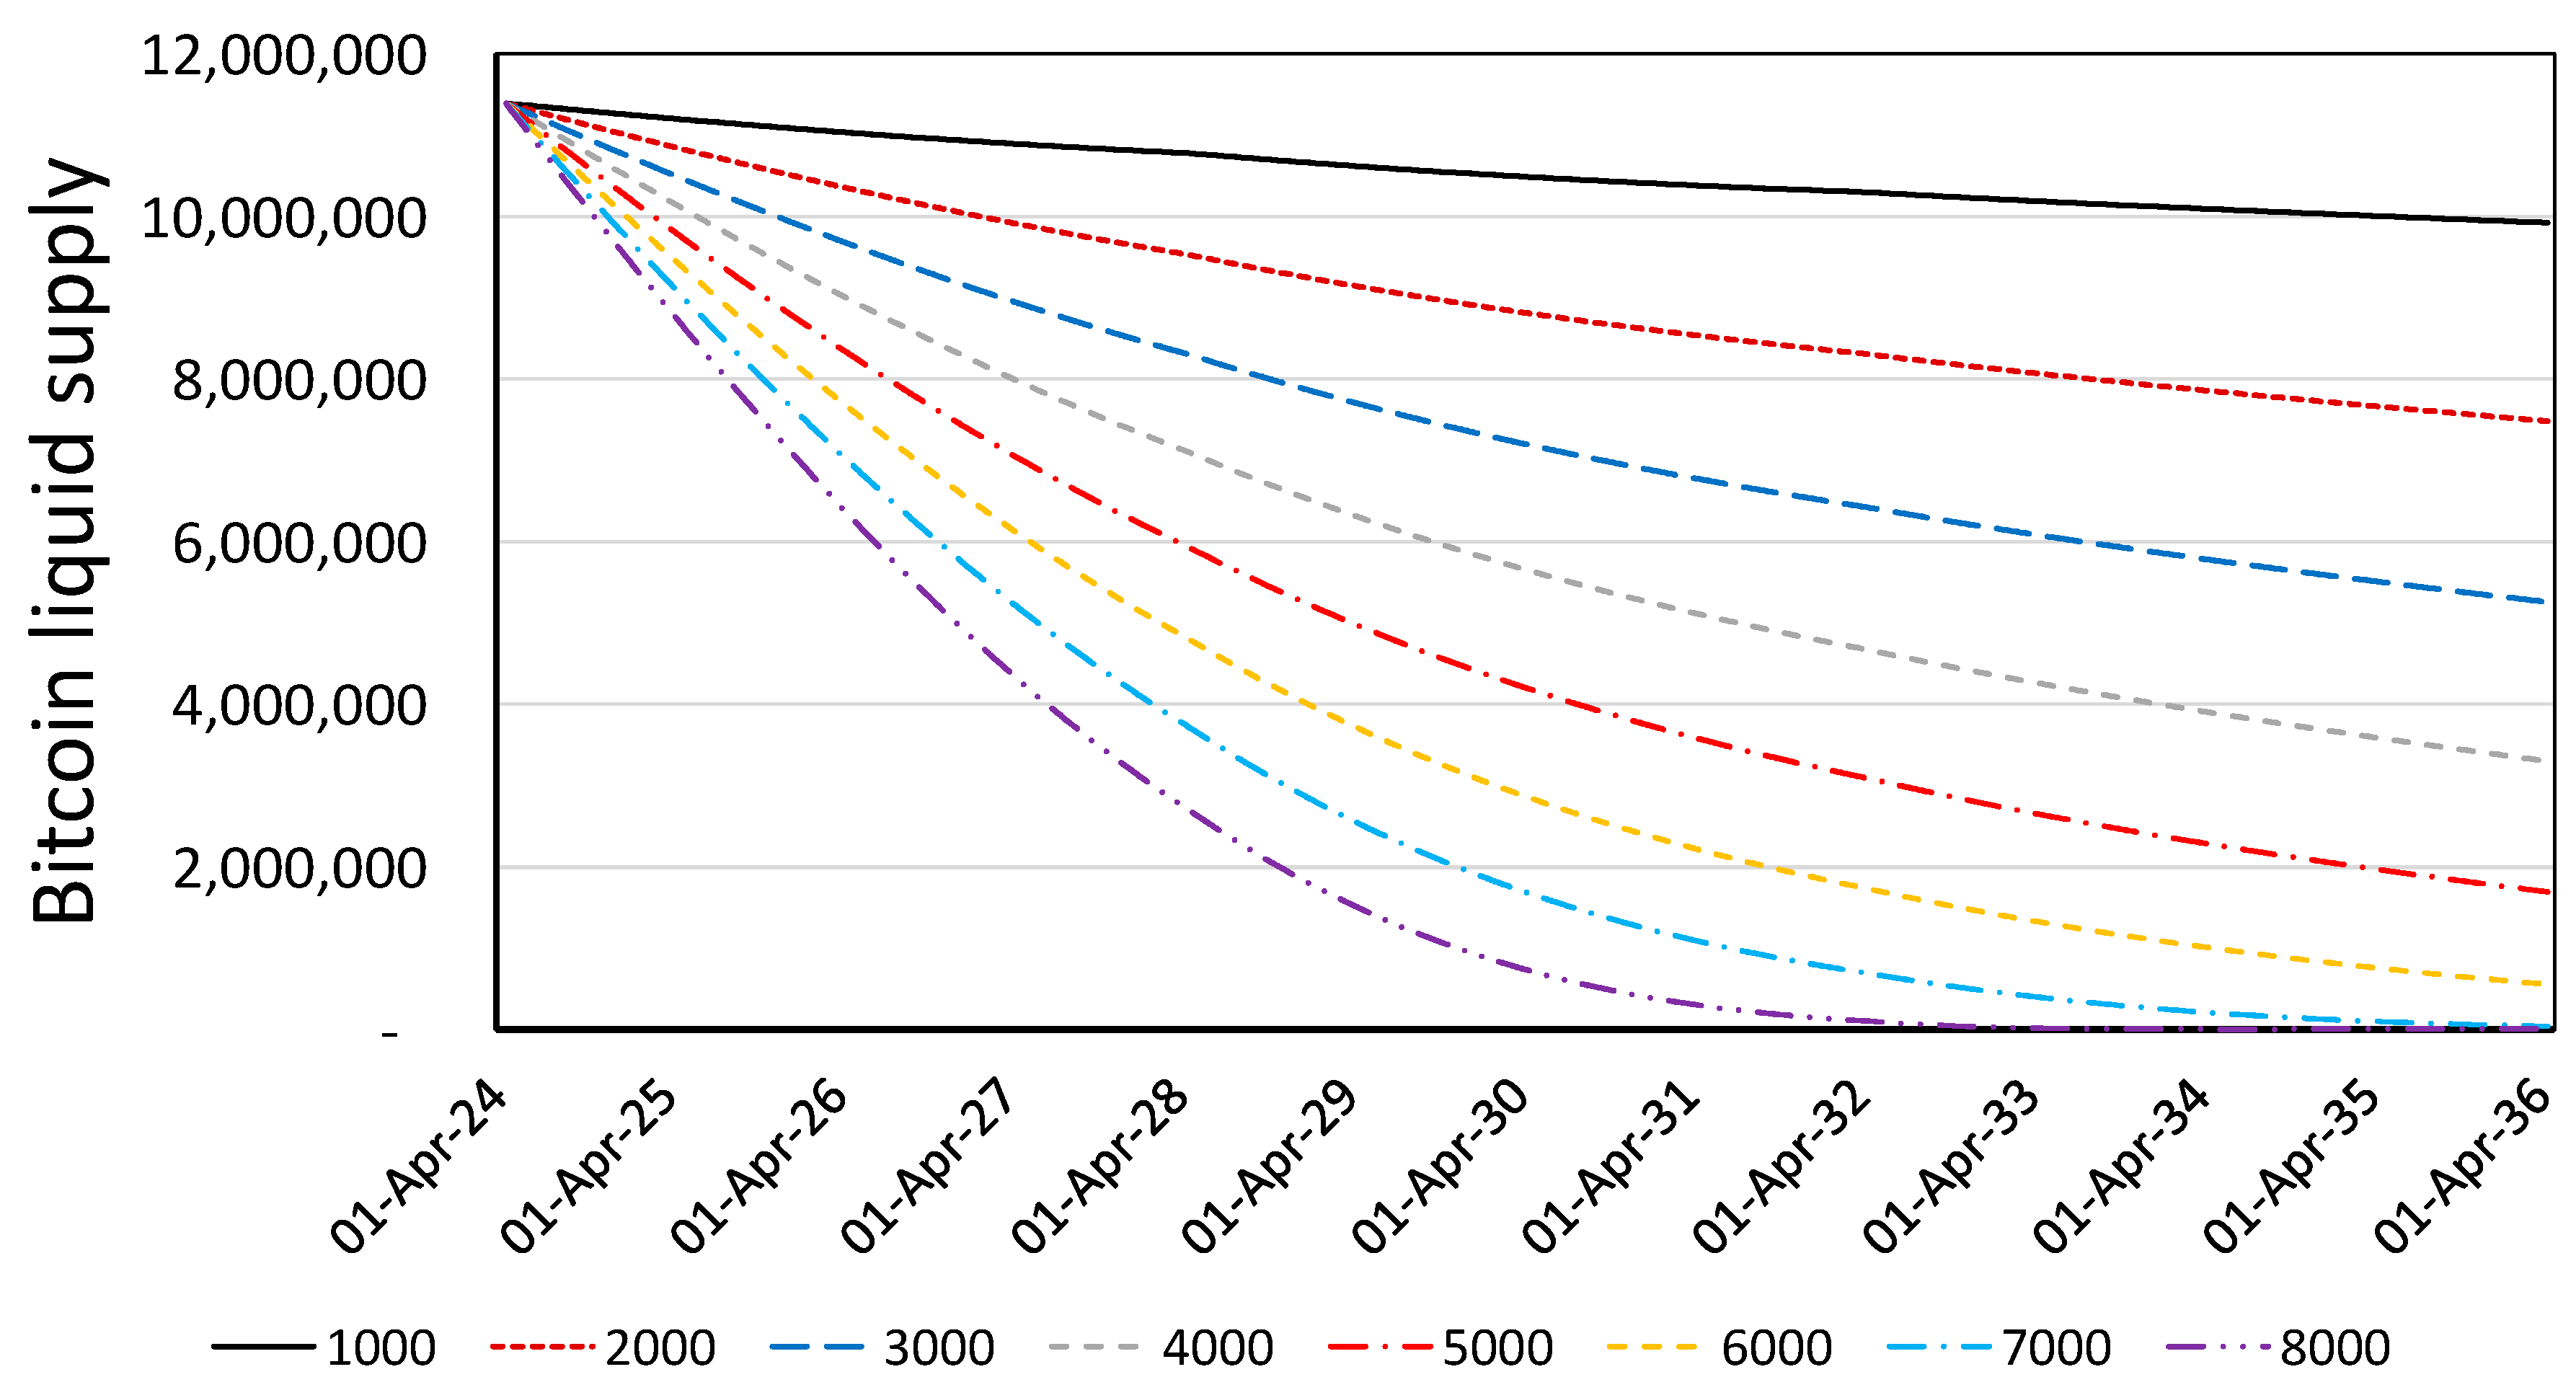
Next, we varied the baseline withdrawal flow, qbase, from 1000 to 8000 Bitcoin per day while keeping D = 20 and α = 0.10. Table 6 shows that as withdrawals are constrained to BTC 1000, the model projects a USD 1.39 M price on 16 April 2036 and leaves nearly 9.9 M coins in circulation. As the withdrawal levels rise, liquid supply drains rapidly and price responds in kind: at BTC 3000, the forecast price is USD 1.91 M with just 5.26 M left in liquid supply, and at BTC 5000, the price tops USD 3.36 M and liquid supply contracts to 1.70 M.
Table 6. Key model outputs when daily withdrawals, qbase, vary.
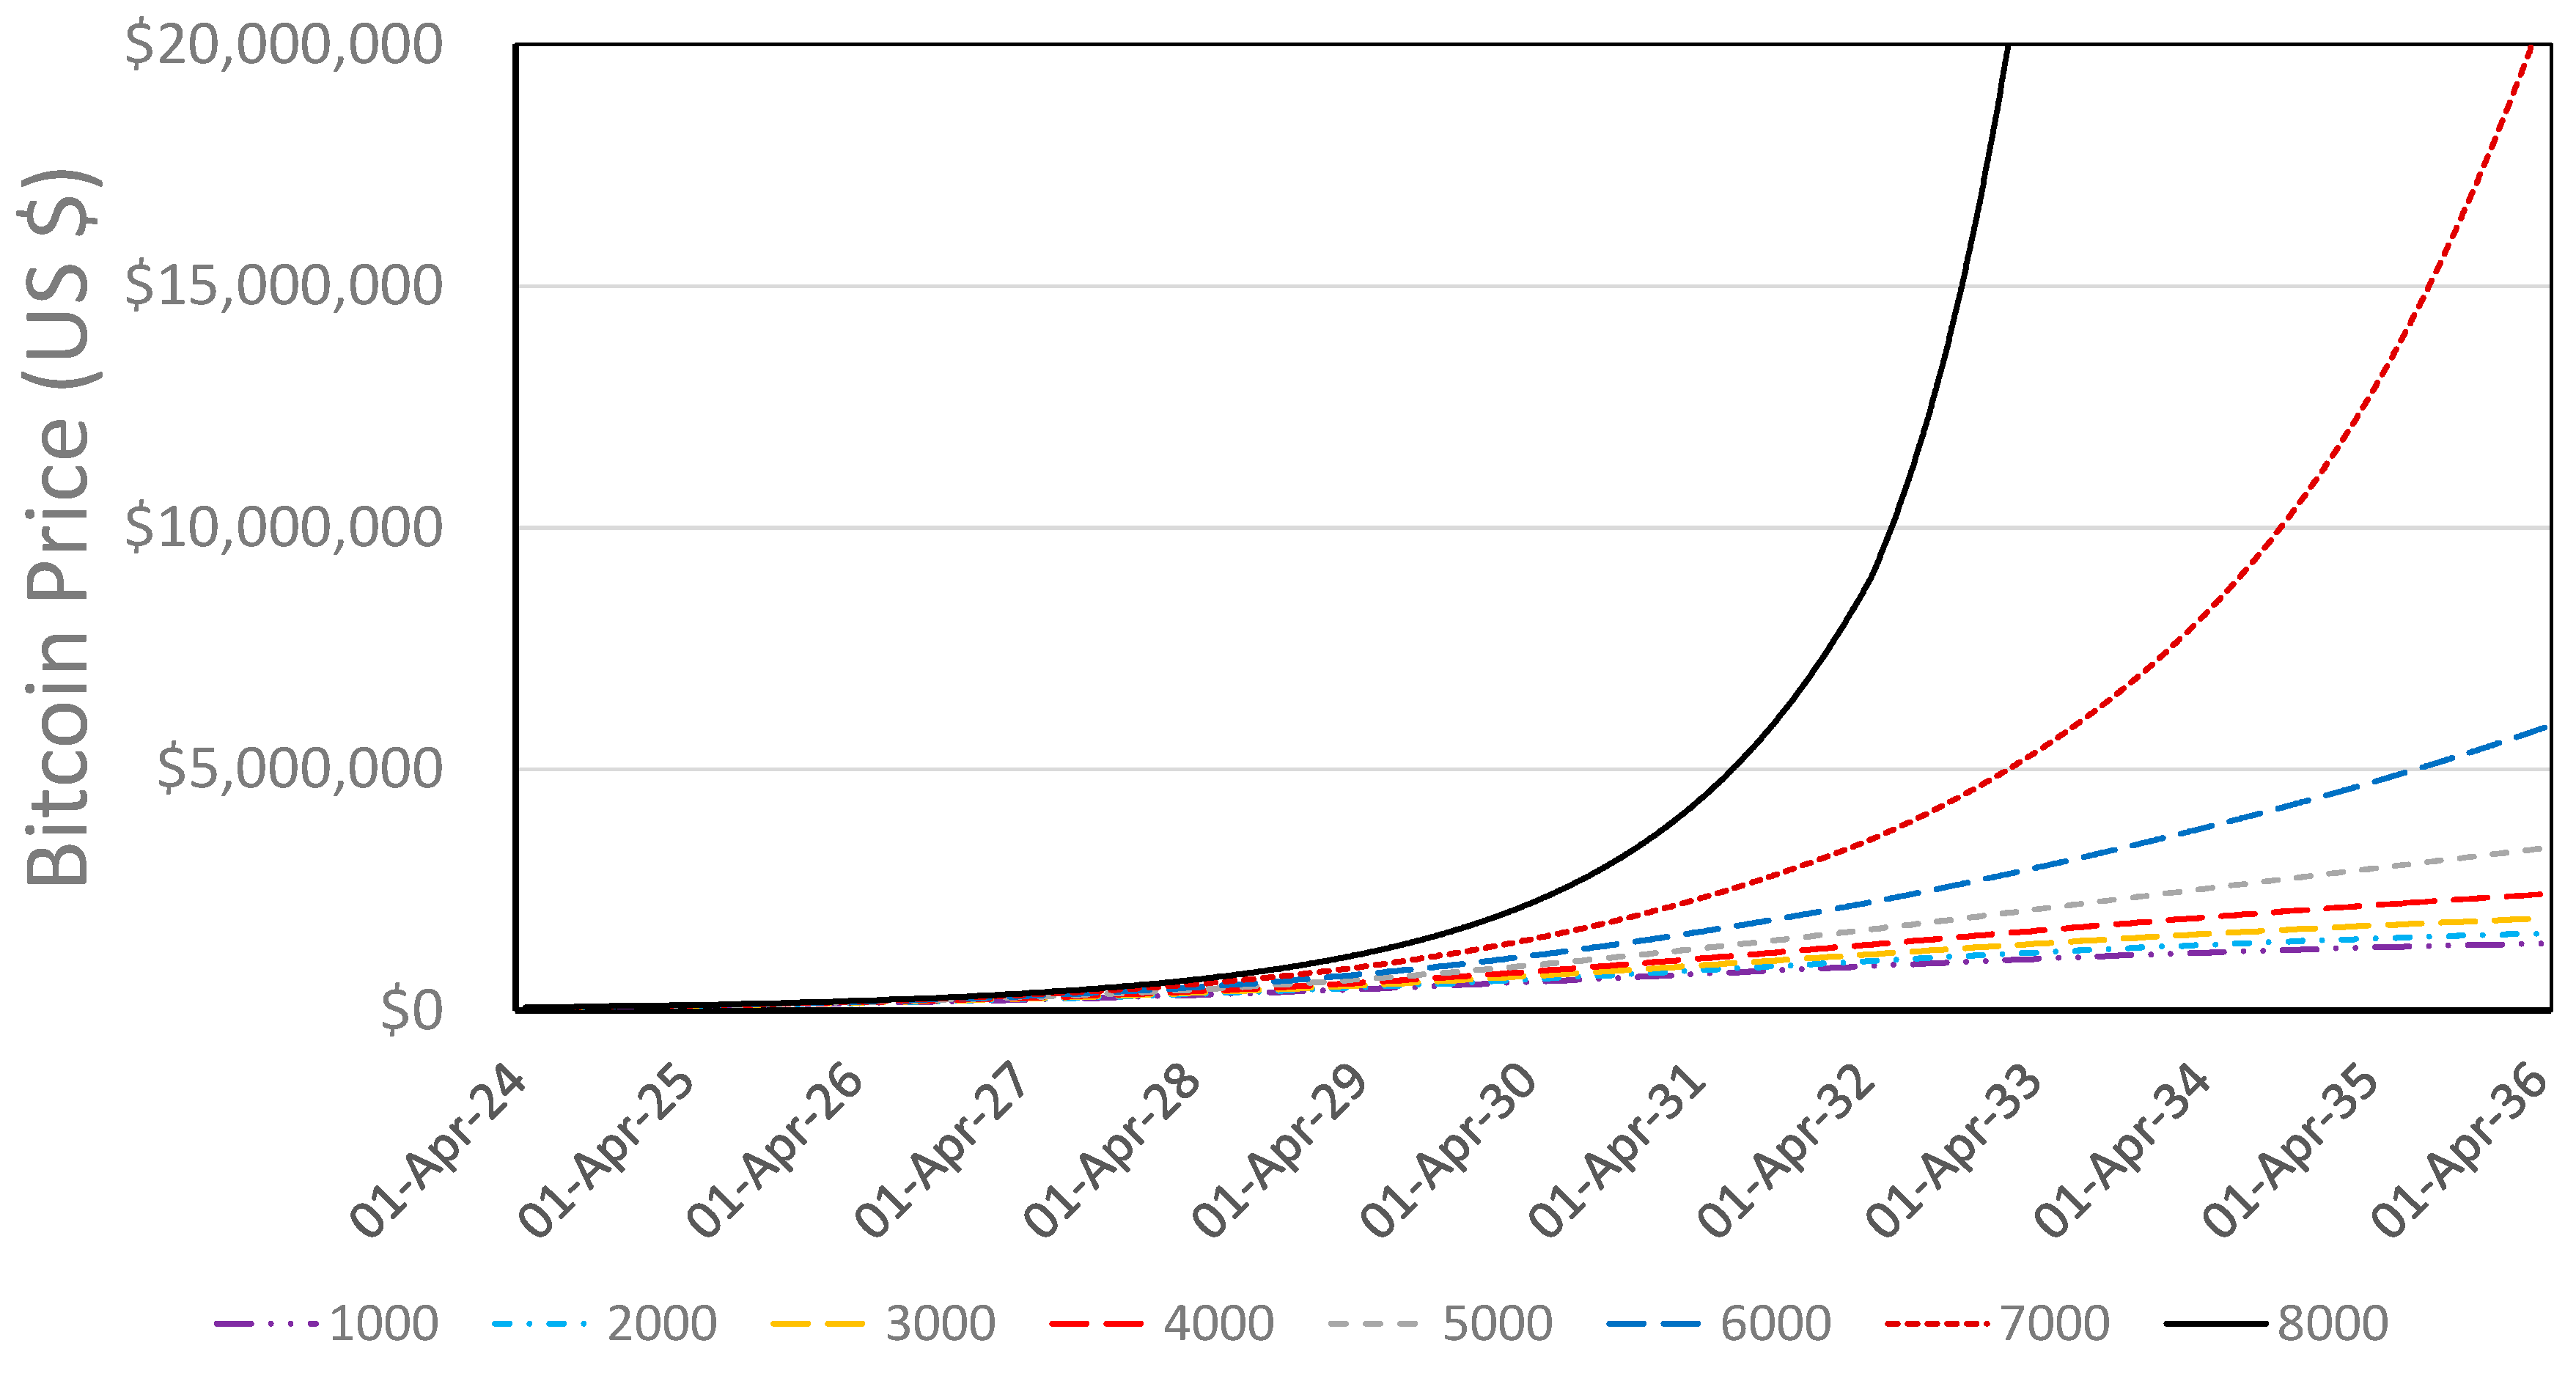
A clear tipping zone emerges between BTC 5000 and 7000 per day. The BTC 6000 run ends with 0.56 M coins and a USD 5.86 M price, a 45.6% CAGR, and the USD 1 M milestone in December 2029. Pushing the draw to BTC 7000 collapses liquid supply to roughly 40,000 coins and triggers hyperbolic price appreciation: the model suggests a USD 20.7 M price and a 61.7% CAGR, with the USD 1 M mark arriving in June 2029. At BTC 8000 the scarcity spiral tightens further, leaving virtually no Bitcoin for trade (<10,000). This level of withdrawal leads to a USD 46.6 M Bitcoin price and pushes the USD 1 M milestone forward into the first days of 2029.
Figure 4 shows how these withdrawal schedules erode liquid supply. The curves for BTC 1000–4000 descend steadily but stay above the 2-million-coin threshold through 2036; the BTC 5000 and 6000 paths breach that line before the end of the model’s time horizon, foreshadowing accelerated price appreciation even though they stop short of true hyperbolic acceleration by April 2036.
Figure 4. Forecast levels of Bitcoin liquid supply under various levels of daily withdrawals to reserves.
Figure 5 overlays the price paths for the full sweep of withdrawal options and pinpoints when each scarcity shock breaks away from the logistic baseline. Removing BTC 8000 per day pulls the curve clear of the BTC 6000 trajectory by late 2030; it accelerates higher through 2031 before a full hyperbolic surge during 2032. The BTC 7000 series follows the same arc on a slower clock: the first unmistakable acceleration appears in 2032–2033, with a decisive turn to hyperbolic growth by the end of the forecast window in 2036. The BTC 6000 series hints at a hyperbolic price rise coming beyond the model’s April 2036 time horizon. Lower withdrawal curves stay nested, illustrating how a seemingly modest uptick in the daily draw has the potential to flip the market from a steep but orderly climb into an unbounded price singularity.
Figure 5. Price appreciation trajectories for various levels of daily Bitcoin withdrawal.

4.2.4. Changes in the Withdrawal-Sensitivity Parameter

Table 7 varies the withdrawal-sensitivity coefficient, α, from 0.025 to 0.50 while holding D = 20, ρ = 0.20, and daily withdrawals at BTC 2000. Easing price discipline has a visible but limited effect: at α = 0.025, the 16 April 2036 forecast reaches USD 1.87 M and liquid supply falls to 5.50 M coins; raising α to 0.05 trims the price to USD 1.73 M and leaves 6.42 M coins. Beyond the baseline value of α = 0.10, the curve flattens quickly. Prices cluster near USD 1.5 M, liquid supply hovers around 9 M, and the USD 1 M milestone shifts only from 24 February 2032 (α = 0.10) to September 17, 2032 (α = 0.50). In short, a tepid withdrawal response (α < 0.10) can hasten supply depletion and price appreciation, but further increases in sensitivity yield diminishing returns and, alone, never lead to a hyperbolic surge.
Table 7. Key model outputs when the withdrawal-sensitivity parameter, α, varies.

4.3. Combined Supply Parameter Changes

4.3.1. Changes in the Withdrawal-Sensitivity Parameter and Level of Withdrawal

Table 8 explores two-dimensional variability as the daily draw from liquid supply, qbase, rises from BTC 2000 to 4000 and then 8000, while the withdrawal-sensitivity coefficient varies from α = 0.025 to α = 0.50 (parameters D = 20 and ρ = 0.20 are held steady). Even modest adjustments to either lever can push the market across the scarcity line that triggers hyperbolic price growth.
Table 8. Key model outputs when both daily Bitcoin withdrawals, qbase, and the withdrawal-sensitivity parameter, α, vary simultaneously while other parameters held steady (D = 20, ρ = 0.2).
When daily withdrawals remain at BTC 2000, outcomes echo those in Section 4.2.4. A low level of withdrawal sensitivity (α = 0.025) reduces the liquid pool to 5.50 M coins and lifts the 16 April 2036 price to USD 1.87 M, but the system remains stable. Each 0.025–0.050 step up in α shifts a further 0.9–1.0 M coins back into circulation and trims the forecast price by roughly USD 140,000, so by α = 0.50, the price has eased to USD 1.39 M and 9.89 M coins remain in liquid supply.
Doubling the draw to BTC 4000 exposes a sharp change. With α = 0.025, the model exhausts liquid supply—only 220,000 coins survive—and registers hyperbolic price and market capitalization outputs; the USD 1 M threshold arrives on 20 June 2030. Increasing α to 0.050 might restore enough liquidity (1.55 M coins) to maintain stability, yet the April 2036 price still reaches USD 3.52 M. As α approaches 0.30, price and supply converge toward the upper-right corner of the BTC 2000 panel: USD 1.60–1.75 M with 6–7 M coins in liquid supply.
At the highest level of daily draw, qbase = BTC 8000, hyperbolic behavior appears at every α less than 0.10. Reducing sensitivity only slightly, to α = 0.20, retains a meager float of BTC 720,000, hinting at hyperbolic price appreciation just beyond the model’s 2036 endpoint, and yields a USD 5.17 M forecast price along with a 44.0% CAGR. Only the two most conservative settings, α = 0.40 and α = 0.50, leave over BTC 2 M in liquid supply: the α = 0.50 model still projects USD 2.28 M with only 3.70 M coins liquid, implying that a scarcity spiral could still emerge at a later time.
Taken together, the table maps a clear boundary. Hyperbolic outcomes emerge whenever the daily draw exceeds roughly BTC 4000 and α falls below 0.05, or when the draw reaches BTC 8000 with α below 0.10. Even outside those zones, any combination that drives liquid supply below about 2 M coins accelerates prices into multi-million-dollar territory and shortens the timeline to incremental million-dollar price milestones.
Table 9 repeats the two-way sweep but boosts the demand shift to its maximum, D = 100. The higher baseline pushes every price target up by roughly an order of magnitude—USD 6.45 M even in the most conservative case (α = 0.20, BTC 2000 draw)—yet hyperbolic outcomes appear only in two cells, where α is 0.025 or 0.050 with BTC 8000 withdrawn each day. Everywhere else, liquid supply remains above 3.5 M coins, and the model returns finite, albeit lofty, prices. With withdrawals of BTC 4000 daily, the lowest-α run still leaves 3.90 M coins in liquid supply, while price reaches USD 11.06 M; the same α under a BTC 2000 draw preserves 7.87 M coins and forecasts a USD 7.79 M Bitcoin price.
Table 9. Key model outputs when both daily Bitcoin withdrawals and the withdrawal-sensitivity parameter, α, vary simultaneously (D = 100, ρ = 0.2).
The counterintuitive stability arises from the price-elastic withdrawal function. A larger demand multiplier lifts price sooner, which immediately scales back additional reserve buying; coins that would have migrated into cold storage at lower price levels remain on exchanges, cushioning the liquid pool. Supply exhaustion therefore depends more on the interaction of withdrawal volume and α than on demand itself. Only when a high-demand environment coincides with both strong daily withdrawal and lenient price discipline does the feedback loop break, driving liquid supply below the BTC 2 M threshold, sending prices hyperbolic.
This pattern underscores a central modeling insight developed earlier: demand shocks accelerate price trajectories but do not, by themselves, appear to precipitate hyperbolic scarcity. Instead, the runaway regime requires simultaneous stress on both levers that drain liquidity: large daily withdrawals and a tepid withdrawal response to rising price.

4.3.2. Changes in the Withdrawal-Sensitivity and EIS Parameters

Table 10 shows results when holding daily withdrawals at BTC 4000 and demand at its maximum (D = 100) while moving two levers together: withdrawal sensitivity, α, from 0.025 to 0.50 and the EIS parameter, ρ, from 0.05 to 0.25. Every run yields a finite outcome—no hyperbolic price increases appear—because the two mechanisms that help return Bitcoin to the market reinforce each other. Low ρ captures a trading mindset, so coins re-enter the order book after price rallies; higher α curbs fresh withdrawals as price climbs.
Table 10. Key model outputs when both daily Bitcoin withdrawals and the withdrawal-sensitivity parameter, α, and ρ vary simultaneously, with demand set to its maximum value, D = 100.
The most aggressive combination, α = 0.025 and ρ = 0.05, still leaves BTC 6.17 M liquid in 2036 and projects a USD 26.7 M price. Raising α in 0.025-point increments steadily restores supply and trims price, so by α = 0.50, the forecast settles at USD 8.71 M with 10.81 M coins available. Increasing ρ to 0.25 has a similar dampening effect: at each α level, price falls by roughly one-third and liquid supply grows by BTC 1.5–3 M. The USD 1 M milestone moves only modestly, from 3 May 2026 in the lowest-discipline case to 6 July 2027 in the most conservative, showing that even high levels of growth in Bitcoin demand cannot ignite a runaway scarcity spiral when both high time preference and price discipline act as liquidity release valves.

4.4. Monte Carlo Simulation

In the Monte Carlo simulation, we treated each of the seven parameters in the model—adoption curve T* and L_min, demand multiplier D, intertemporal substitution parameter ρ, withdrawal sensitivity α, and the baseline daily withdrawal flow qbase—as random (uniformly distributed) within the bounds explored earlier (6 ≤ T* ≤ 16, 0.01 ≤ L_min ≤ 0.08, 10 ≤ D ≤ 100, 0.5 ≤ ρ ≤ 2.5, 0.025 ≤ α ≤ 0.50, and BTC 1000 ≤ qbase ≤ BTC 8000). In addition, we treat initial illiquid supply, ql(0), as an unknown, randomly chosen from a uniform distribution between 1 M and 16.5 M (equivalent to initial liquid supply levels between BTC 3.19 M and 18.69 M).

4.4.1. Price Forecast Distribution

Table 11 summarizes the 5%, 25%, 50%, 75%, and 95% probability bands for the key metrics on 16 April 2036. The median run reaches a USD 5.17 M Bitcoin price and a USD 107.6 T market capitalization while leaving 6.31 M available in liquid supply by April 2036. A larger initial float reduces the 5% lower band to USD 1.66 M, with 15.11 M remaining in liquid supply; at the opposite extreme, tight initial liquidity helps the 95% upper band surge into hyperbolic territory, with a price of USD 19.64 M and liquid supply depleted to 200,000 coins.
Table 11. Price, market capitalization, liquid supply, CAGR, and projected dates for reaching USD 1 M price by probability band.

4.4.2. Implications of Shifting Liquidity Assumptions

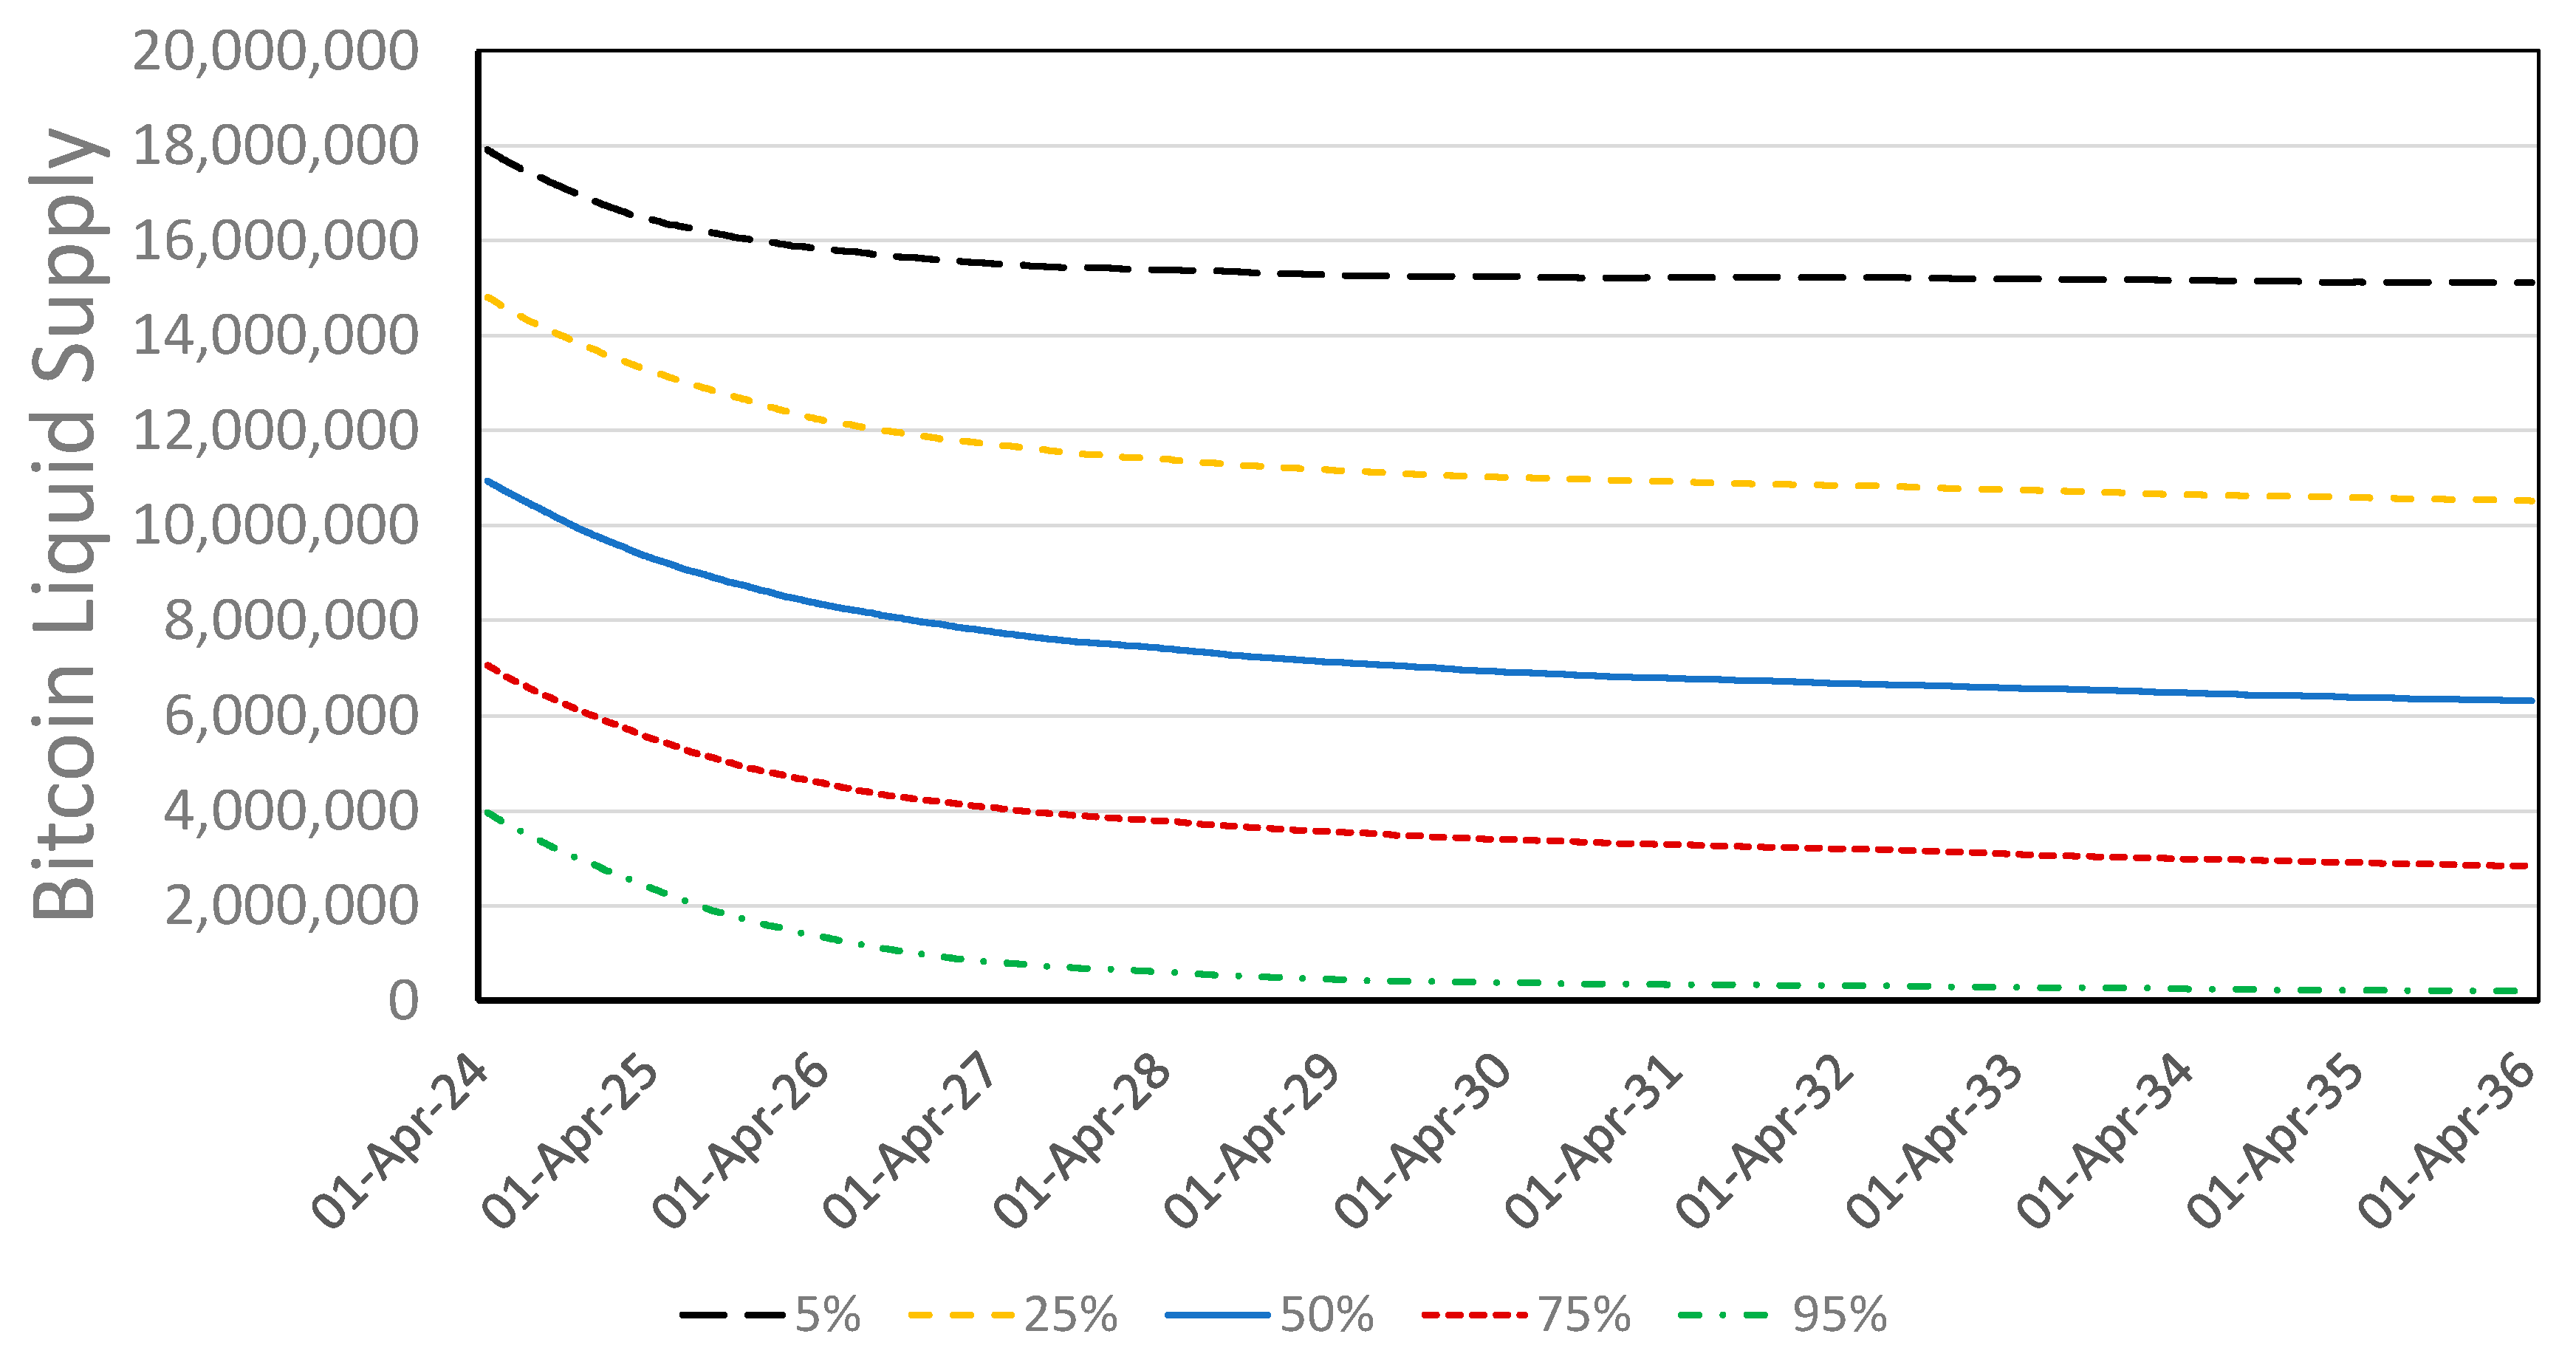
Figure 6 shows projected liquid supply probability bands. The 95% probability path slips below 2 M liquid Bitcoin by 19 July 2025 and under 1 M by 23 October 2026, a regime that produces hyperbolic moves. The 75% band, however, never breaches 2.8 M liquid supply, and the remaining bands never breach 6 M liquid supply. Because the hyperbolic zone is reached only in the tails with thin supply, extreme price outcomes in Table 11 owe more to initial low-liquidity conditions than to mid-course parameter draws.
Figure 6. Probability bands for liquid Bitcoin supply, 2024–2036.

4.4.3. Exceedance Probabilities

By converting the distribution into exceedance thresholds, we found that the likelihood that Bitcoin price exceeds USD 1 M by April 2036 is 98.9%, and that for USD 2 M, USD 5 M, USD 10 M, and USD 20 M benchmarks, the probabilities are 91.8%, 52.1%, 12.8%, and 4.9%, respectively. Taking a date-specific approach, Table 12 shows, for example, a 75% likelihood that price on 31 December 2030 exceeds USD 2.03 M. The upper band should be viewed with caution due to the impact of hyperbolic price singularities in the extreme tail of the distribution; the lower band represents a situation with abundant circulating supply, likely requiring heavy issuance of synthetics helping to absorb market demand.
Table 12. Forecast Bitcoin price that exceeds confidence interval bands at year-end (to 2035) and 16 April 2036.
Table 13 shows exceedance probability bands for Bitcoin market capitalization. Given 2024 global fixed income and equities market capitalization were around USD 145 T and USD 127 T, respectively (https://www.sifma.org/resources/research/statistics/fact-book/, accessed on 21 August 2025), it is clear that the values in the 5% band are extreme (Michael Saylor believes, however, that Bitcoin will eventually reach a USD 500 T market cap, https://finance.yahoo.com/news/michael-saylor-predicts-bitcoin-500t-182133488.html, accessed on 21 August 2025). The 50% probability band reaches USD 108 T by 2036, about five times the current value of gold, a potentially feasible value if Bitcoin were to significantly demonetize equity, fixed income, or real estate assets.
Table 13. Forecast Bitcoin market capitalization that exceeds confidence interval bands at year-end.

5. Discussion

We set out to examine whether Bitcoin’s fixed 21 M supply paired with plausible demand growth could alone explain the multi-million-dollar prices and multi-trillion-dollar market capitalizations forecast by some analysts. Rather than impose a single “best guess,” we first built up a baseline model, sampling four core drivers—demand, investor time preference, withdrawal sensitivity, and baseline withdrawals—across credible ranges, combined with uncertainty about the initial liquid supply of Bitcoin. This approach reveals the conditions under which price trajectories accelerate smoothly or spike into hyperbolic vertical climbs. Because the right tail concentrates in identifiable regimes, the results give policymakers and allocators a tractable way to identify and test pragmatic levers to reduce the probability of disorderly outcomes.
Three results stand out. First, multi-million-dollar prices arise across all parameter combinations: the median forecast for 16 April 2036 is USD 5.17 M and a USD 107.6 T market capitalization. Second, runaway price appreciation is relatively rare and highly conditional: it typically requires liquid supply below roughly BTC 2 M together with weak execution discipline (low α); strengthen either margin, and the spiral may be broken. Third, demand shifts chiefly change timing, not endpoints. Higher demand pulls milestones forward because rising prices trigger tighter execution and slow additional withdrawals in fiat terms; unlike in prior research (), demand alone does not, in our models, exhaust the float; this is due to the inclusion of market execution friction slowing the rate of Bitcoin withdrawals to permanent storage as price rises.

5.1. Growth in Demand

Demand growth in this framework chiefly re-times outcomes. Raising the demand-shift multiplier brings forward price milestones because more buyers arrive sooner, but it does not, by itself, exhaust the float. Prices rise, α tightens execution, and withdrawals slow in fiat terms. The result is steep, but bounded, appreciation so long as liquid supply remains above the scarcity corridor or about 2 M liquid Bitcoin.
The composition of demand matters more than its headline size. When long-horizon allocators dominate (high willingness to pay from EZ preferences) but maintain weak execution discipline (low α), coins leave circulation persistently even as price climbs. In thin-float settings, that slow grind pushes the system across the BTC 2 M threshold where marginal purchases move price disproportionately. By contrast, high demand coupled with strong discipline (higher α) preserves inventory despite rapid price appreciation, producing earlier, but still orderly, market price and capitalization trajectories.
Once the liquid supply falls below the scarcity corridor, even small additional purchases ignite large price moves. In high-demand cases, price rises quickly enough to activate the throttle, limiting further withdrawals and keeping the system on a steep but controlled path.

5.2. Comparison with Existing Financial Models

We compare financial modeling forecasts from Strategy (https://github.com/bitcoin-model/bitcoin_model, accessed on 21 August 2025) and ARK (https://www.investors.com/news/why-cathie-wood-sees-bitcoin-price-soaring-to-3-8-million/, accessed on 21 August 2025) with our quantity-clearing supply–demand engine to assess whether independent methods converge on both magnitudes and timing.
Strategy’s Bitcoin24 model assumes declining annual percentage gains in price. In its baseline, price reaches USD 13 M by 2045; the 2036 waypoint is USD 2.4 M and about a USD 55 T market capitalization. In our baseline, a USD 55 T market cap by 2036 sits midway between baseline variations 3 and 4 (Table 4), implying a demand-shift multiplier near 50 with other parameters fixed. In the Monte Carlo simulation, the USD 55 T median is reached by early 2030 (Table 13), reflecting the presence of low-probability, high-value paths when thin float and weak execution discipline coincide. Taken together, the mapping from Strategy’s price path to our supply–demand engine is tight despite different assumptions.
Strategy’s bull case targets USD 6.6 M per coin and a USD 139 T market capitalization by 2036. In our baseline model, matching that endpoint would require roughly a 100× demand-shift multiplier if other parameters were held constant. Alternatively, the Monte Carlo simulation found a 25% probability of exceeding USD 7.10 M price and USD 148.9 T market capitalization by April 2036, which lands near Strategy’s bull path. The point is not that the models are identical—they are not—but that a bottom-up quantity-clearing framework and a top-down financial model converge on comparable magnitudes and timing. Our model’s median projection is less aggressive compared to MicroStategy’s forecasts, which would land around the 70% exceedance bound in our model.
ARK Invest projects USD 3.8 M by 2030. In Table 12, the chance of exceeding USD 3.22 M by 31 December 2030 is 50%. That alignment, with ARK landing in the space between our median and more aggressive 25% exceedance band, is again striking given that ARK’s estimates arise from a use-case, building-block valuation and ours from a dynamic supply–demand system.

5.3. Liquid Supply and Execution Discipline

Liquid supply is the governing state variable. In this model (and the earlier () model), the regime shift arrives when liquid supply falls below roughly BTC 2 M. Above that line—particularly in the 3–5 M range—marginal sellers can meet marginal buyers and prices trace steep-but-bounded paths. Below it, each purchase lifts price disproportionately, which invites further withdrawals and tightens float again. Daily withdrawals above about BTC 6000 or a collapse of execution discipline (low α) accelerate the slide, but the propellant is scarcity itself. Fewer Bitcoin available and small quantity imbalances translate into large price moves: the model’s withdrawal pacing rules become the main brake on a self-reinforcing drain.
These mechanics explain why hyperbolic outcomes sometimes emerge in low-demand worlds. With modest demand and lax discipline, price rises gradually, so reserve programs keep withdrawing coins for longer. The slow erosion pushes the float under about BTC 2 M, where each marginal buy has outsized impact; once below a critical threshold, even small additional purchases can ignite a sharp ascent. High-demand worlds often avoid this trap precisely because rapid appreciation tightens execution discipline (via α) early, slowing further withdrawals and preserving inventory. The risk is therefore joint: liquid supply, execution discipline, and demand growth together set the path. No single element suffices: stress arises when a thin float meets weak discipline, regardless of whether headline demand is high or low.
Gold and silver offer clear antecedents of thin-float dynamics. In the 1960s, the London Gold Pool repeatedly sold official reserves to defend USD 35/oz, slowly draining inventory into private hands; when the pool collapsed in March 1968, a two-tier market emerged, and the free float tightened (). Through the 1970s, inflation-driven demand met constrained supply, and each marginal bid pushed prices higher, culminating in the 1980 repricing. Silver’s 1979–1980 episode shows the same mechanics with leverage: sustained Hunt family accumulation tightened available float while futures provided exposure without immediate physical settlement, amplifying the squeeze (). Only when exchange rules shifted to liquidation-only did the spiral break.
Bitcoin’s 2019–2020 cycle also shows a similar slow-compression setup. Exchange balances trended down through 2019–2020 as Bitcoin migrated off-chain, thinning the liquid supply while price advanced gradually (https://insights.glassnode.com/bitcoin-liquid-supply, accessed on 21 August 2025). That backdrop met incremental institutional bids in late 2020—public treasury purchases by Strategy (August–December) and Square (October), retail access via PayPal, and dramatic increases in money supply—so relatively small daily flows moved price disproportionately. As order books thinned, each additional purchase produced larger ticks, and the advance steepened into early 2021. The mechanism matches the model: a long, steady drain of coins off exchanges, modest headline demand at first, then a catalyst that pushes a constrained float past a threshold where price responds nonlinearly.
Derivatives can locally flatten the effective supply curve () by letting investors add or hedge exposure without settling spot Bitcoin. Cash-settled futures and options create “paper Bitcoin” that transmits price signals while leaving on-chain supply unchanged, absorbing incremental demand that might otherwise pull Bitcoin from exchanges (). The effect, however, is two-sided. When the term structure is in contango (futures priced above spot), basis-trade arbitrage (long spot, short futures) buys Bitcoin and moves them into custodial collateral, tightening the float; extended backwardation (futures priced below spot) can release Bitcoin. Rehypothecation multiplies claims on the same collateral and further decouples exposure from Bitcoin price movement, smoothing price–quantity mapping until collateral calls or funding stresses force spot flows. In short, derivatives can delay scarcity, but likely not eliminate it. While we do not explicitly model derivatives in the model, our choice to use a wide range of liquidity in the Monte Carlo model likely exceeds true liquid supply by at least BTC 2 M, thus providing a proxy for reasonable levels of long and short futures contracts.
Interventions that modestly raise execution discipline during momentum phases (higher α in rallies) or that reduce collateral reuse could help widen the safety margin without dictating preferences or suppressing demand. For example, requiring large accumulators—ETFs, corporations, and sovereign wealth funds—to follow time-weighted average price or volume-weighted average price pacing with a hard cap (e.g., no more than 10% of consolidated spot volume per day). The rule triggers whenever a public liquid supply indicator falls below a liquidity milestone or short-term momentum breaches a defined threshold; it would raise execution discipline exactly when needed, slowing reserve withdrawals during rapid price advances without constraining long-run allocation. In policy terms, keeping liquid supply above the scarcity corridor is the scalable, neutral way to reduce the odds of disorderly market outcomes.

5.4. Hyperbolic Price Trajectories

Hyperbolic paths arise when a thin liquid supply meets weak execution discipline. In this model, the right tail concentrates once liquid supply falls below roughly 2 M coins and α remains low, so each marginal purchase lifts price disproportionately and motivates further withdrawals. Two adoption regimes map cleanly to these mechanics. A sovereignty-first regime accepts rapid repricing and minimal intermediation; a stability-first regime prioritizes continuous market functioning and orderly pacing (). Both raise Bitcoin’s price level; they differ in how quickly Bitcoin leaves the market and how much synthetic supply is created via financial plumbing.
In a sovereignty-first regime, actors keep α low by choice: they favor self-custody, resist pacing rules, and avoid derivatives that decouple exposure from coin movement. The benefit is speed, creative destruction that compresses the transition and rewards early adopters. The tradeoffs are real: disorderly order books, heightened volatility, collateral stresses, and policy backlash when essential services (payments, credit) struggle to adapt. Gains concentrate among those already well-positioned, even if their goal may be more oriented towards self-sovereignty; late adopters and leveraged intermediaries bear the brunt of adjustment.
In a stability-first regime, institutions raise α through governance, dollar-budget caps, and execution pacing, while derivatives and collateral frameworks expand effective supply by offering exposure without immediate spot settlement. The result is steep-but-bounded trajectories that preserve market continuity and broaden participation. The risks shift rather than vanish: reliance on intermediaries, encumbrance of collateral through rehypothecation, and “cliff risk” if funding markets seize or basis trades unwind. Derivatives can delay scarcity and smooth pricing locally; under stress, they can transmit it abruptly.
“Good or bad” depends on goals (). A sovereignty-first path advances monetary sovereignty quickly but tolerates higher transitional volatility and distributional swings. A stability-first path reduces disorderly dynamics and operational risk at the cost of a slower monetary transition and greater intermediation. Our results suggest that policymakers do not need to pick winners on preferences. By shaping α, they can shape how the same level of demand maps into prices, either toward rapid repricing with thin float, or toward orderly appreciation with preserved inventory.
Three implications follow. First, Bitcoin analysts should consider reporting time-to-threshold metrics (e.g., time to key liquidity band increments), not just end-state prices, as the size of liquid supply becomes clearer over time: these thresholds govern regime changes. Second, policy and governance levers act most directly on execution discipline rather than on preferences: tightening α in rally phases when liquidity is thin, and relaxing pacing when inventory is ample, reduces the probability of disorderly, right-tail outcomes without taking a stance on long-run adoption. Third, channels that bend effective supply need to be monitored, including ETF creations/redemptions and exchange outflows (spot), open interest and funding rates (derivatives), and collateral rehypothecation policies at major lenders.

5.5. Limitations and Future Research

Our current inputs remain judgmental. The withdrawal-sensitivity parameter α assumes calibration from proxies (net exchange outflows, ETF creations/redemptions, treasury disclosures) rather than micro-level execution data. Estimates of liquid supply depend on on-chain heuristics and disclosed custodian balances, both subject to measurement error and classification drift.
The simulation does not explicitly endogenize derivatives, credit intermediation, or collateral reuse; we discussed these channels conceptually, and our model allows a wide range of liquidity as a proxy for paper Bitcoin, but detailed dynamic feedback from synthetics and rehypothecation is currently outside the scope of this framework. Incorporating these mechanisms would likely delay scarcity in normal states and steepen the right tail under stress. Our generous bounds on random selections of liquid supply (3.19 M to 18.69 M) in the Monte Carlo model provide a proxy for flattening of the supply curve. Should, in the future, the market become very highly leveraged on either the long or short side, it is simple in this framework to expand the range of the liquid supply bounds to derive a rough estimate of potential price impacts without fully modeling the specific structure of the synthetic exposure.
Identification also remains imperfect: some outcome paths can be replicated by different combinations of parameters. Finally, demand shifts enter as exogenous multipliers; future work should tie them specifically to macro drivers such as interest rates, M2 money supply, regulatory clarity, market sentiment, and institutional adoption.
Bitcoin’s high-level price dynamics appear to primarily hinge on two measurable determinants: the size of the liquid float and execution discipline (α). The next step is to replace the judgmental inputs we use in this paper with estimable parameters and state variables, so we can forecast when regime shifts occur (time-to-threshold) and how policy changes or market shocks alter right-tail risk. That means improving measurement for liquid supply and identifying α from data across market states. The research projects below (Table 14) prioritize policy relevance and empirical tractability. Together, they move from a basic question, “is hyperbolic growth possible?”, to a more policy-salient one, “under what observable conditions does it become likely, and which levers shift those odds?”
Table 14. Eight possible future research initiatives to improve supply–demand modeling.
Taken together, such a package of projects could build a coherent measurement-and-identification research stack: α estimated from transactions and creations; liquid supply measured and audited; encumbrance quantified; and policy options modeled with scenario and pathway analyses.

6. Conclusions

In this study, we show that Bitcoin’s fixed 21-million hard cap, combined with plausible demand growth and execution behavior, can generate prices ranging from the low single millions to the low tens of millions per Bitcoin by 2036. Unlike top-down market-share models or historical curve fits, the framework clears quantities at each time step, letting price emerge endogenously from the interaction of demand with a finite, shrinking liquid supply. This approach allows us to develop high-level price trajectory forecasts for a commodity with absolute scarcity, without having to rely on historical trends formed under pre-scarcity conditions.
The supply–demand framework is neutral in character. Currently, Bitcoin adoption is strong and increasing in magnitude. If, however, market demand were to fall in the future—through a quantum attack on old wallets, for example—the market price and liquid supply implications can be readily assessed using this market-clearing framework.
Analysis of individual and paired parameter variations demonstrates that market prices are highly sensitive to liquid supply, fiat-denominated withdrawal discipline, and demand composition. Most parameter combinations yield steep-but-bounded appreciation, with higher prices tightening execution and moderating withdrawals. Hyperbolic trajectories, which could pose wider risks to the financial system, occupy only a narrow region of the parameter space, concentrated when liquid supply falls near or below BTC 2 M and withdrawal sensitivity remains low.
As measurement improves—for corporate and sovereign holdings, liquid supply balances, ETF creations and redemptions, and encumbrance—parameter functional forms should become clearer and probability interval ranges tighten. The supply–demand framework provides a tractable way to identify where right-tail risk concentrates, to understand how observable state variables and specific policy levers shape long-term trajectories, and to ground assessments of Bitcoin’s monetary transition in quantity-clearing economics rather than extrapolation from price history. Steep-but-bounded price appreciation appears to be the default; hyperbolic repricing is a contingent outcome tied to low liquid supply and low withdrawal sensitivity.

Supplementary Materials

The following supporting information can be downloaded at https://doi.org/10.6084/m9.figshare.30167659.

Author Contributions

Conceptualization M.A.R.; methodology, M.A.R.; investigation, M.A.R.; writing—original draft preparation, M.A.R.; writing—review and editing, M.A.R. and D.P.; project administration, D.P. All authors have read and agreed to the published version of the manuscript.

Funding

This research receives no external funding.

Institutional Review Board Statement

Not applicable.

Data Availability Statement

The original data presented in the study are openly available in FigShare at https://doi.org/10.6084/m9.figshare.30167659.

Conflicts of Interest

Satoshi Action Education is a 501(c) (3) nonprofit. M.A.R. reports a relationship with Satoshi Action Education that includes consulting or advisory services. D.P. reports a relationship with Satoshi Action Education that includes board membership and employment. Both authors own Bitcoin and the authors declare no conflict of interest.

References

  1. Ang, A., Morris, T., & Savi, R. (2022). Asset allocation with crypto: Application of preferences for positive skewness. The Journal of Alternative Investments, 25, 7–28. [Google Scholar] [CrossRef]
  2. Arrow, K. J., Chenery, H. B., Minhas, B. S., & Solow, R. M. (1961). Capital-labor substitution and economic efficiency. The Review of Economics and Statistics 43, 225–250. [Google Scholar] [CrossRef]
  3. Augustin, P., Rubtsov, A., & Shin, D. (2023). The impact of derivatives on spot markets: Evidence from the introduction of Bitcoin futures contracts. Management Science, 69, 6752–6776. [Google Scholar] [CrossRef]
  4. Biais, B., Bisière, C., Bouvard, M., Casamatta, C., & Menkveld, A. J. (2023). Equilibrium Bitcoin pricing. The Journal of Finance, 78, 967–1014. [Google Scholar] [CrossRef]
  5. Bordo, M., Monnet, E., & Naef, A. (2019). The gold pool (1961–1968) and the fall of the bretton woods system: Lessons for central bank cooperation. The Journal of Economic History, 79, 1027–1059. [Google Scholar] [CrossRef]
  6. Ciaian, P., Rajcaniova, M., & Kancs, D. (2016). The economics of BitCoin price formation. Applied Economics, 48, 1799–1815. [Google Scholar] [CrossRef]
  7. Dyhrberg, A. H. (2016). Hedging capabilities of bitcoin. Is it the virtual gold? Finance Research Letters, 16, 139–144. [Google Scholar] [CrossRef]
  8. Epoch Management. (2025). The Bitcoin ecosystem: 2024 annual report. Available online: https://epochvc.io/pdf/Epoch-Bitcoin-Ecosystem-Report-2024.pdf (accessed on 21 August 2025).
  9. Epstein, L. G., & Zin, S. E. (1991). Substitution, risk aversion, and the temporal behavior of consumption and asset returns: An empirical analysis. Journal of Political Economy, 99, 263–286. [Google Scholar] [CrossRef]
  10. Feder-Sempach, E., Szczepocki, P., & Bogołębska, J. (2024). Global uncertainty and potential shelters: Gold, bitcoin, and currencies as weak and strong safe havens for main world stock markets. Financial Innovation, 10, 67. [Google Scholar] [CrossRef]
  11. Jacks, D. S. (2019). From boom to bust: A typology of real commodity prices in the long run. Cliometrica, 13, 201–220. [Google Scholar] [CrossRef]
  12. Ji, S., Kim, J., & Im, H. (2019). A comparative study of bitcoin price prediction using deep learning. Mathematics, 7, 898. [Google Scholar] [CrossRef]
  13. Kearney, J. J., & Perez-Delgado, C. A. (2021). Vulnerability of blockchain technologies to quantum attacks. Array, 10, 100065. [Google Scholar] [CrossRef]
  14. Mazur, M., & Polyzos, E. (2025). Spot Bitcoin ETFs: The effect of fund flows on Bitcoin price formation. The Journal of Alternative Investments, 27, 110–123. [Google Scholar] [CrossRef]
  15. Mehra, R., & Prescott, E. C. (1985). The equity premium: A puzzle. Journal of Monetary Economics, 15, 145–161. [Google Scholar] [CrossRef]
  16. Mejri, S., Leccadito, A., & Yildirim, R. (in press). Dynamic responses of Bitcoin, gold, and green bonds to geopolitical risk: A quantile wavelet analysis. Borsa Istanbul Review. [CrossRef]
  17. Mohamad, A. (2025). Do Bitcoin ETFs lead price discovery following their introduction in the Bitcoin market? Computational Economics, 66, 947–969. [Google Scholar] [CrossRef]
  18. Nabben, K. (2023). Cryptoeconomics as governance: An intellectual history from “Crypto Anarchy” to “Cryptoeconomics”. Internet Histories, 7(3), 254–276. [Google Scholar] [CrossRef]
  19. Nakamoto, S. (2008). Bitcoin: A peer-to-peer electronic cash system. Unpublished white paper. Available online: https://bitcoin.org/bitcoin.pdf (accessed on 21 August 2025).
  20. Narayanan, A., & Clark, J. (2017). Bitcoin’s academic pedigree. Communications of the ACM, 60, 36–45. [Google Scholar] [CrossRef]
  21. National Economic Council. (2025). Strengthening American leadership in digital financial technology. The President’s Working Group on Digital Asset Markets. Available online: https://www.whitehouse.gov/crypto/ (accessed on 21 August 2025).
  22. River Financial. (2022). What could Bitcoin mining look like at one zettahash? Available online: https://river.com/learn/files/river-bitcoin-mining-zettahash-report.pdf (accessed on 21 August 2025).
  23. Roberts, M. J., & Schlenker, W. (2013). Identifying supply and demand elasticities of agricultural commodities: Implications for the US ethanol mandate. American Economic Review, 103, 2265–2295. [Google Scholar] [CrossRef]
  24. Rudd, M. A. (2025). Bitcoin worlds. SSRN preprint. [CrossRef]
  25. Rudd, M. A., & Porter, D. (2025). A supply and demand framework for Bitcoin price forecasting. Journal of Risk and Financial Management, 18, 66. [Google Scholar] [CrossRef]
  26. SEC. (1982). The silver crisis of 1980. A report of the staff of the U.S. Securities and Exchange Commission (SEC). Available online: https://www.sechistorical.org/collection/papers/1980/1982_1001_SECSilverCrisis_01.pdf (accessed on 21 August 2025).
  27. Shiva Sankari, V., & Kavitha, R. (2025). Bitcoin adoption and price elasticity of demand: Cross-country insights. Humanities and Social Sciences Communications, 12, 930. [Google Scholar] [CrossRef]
  28. Sun, W., Jin, H., Jin, F., Kong, L., Peng, Y., & Dai, Z. (2022). Spatial analysis of global Bitcoin mining. Scientific Reports, 12, 10694. [Google Scholar] [CrossRef]
  29. van Huellen, S. (2020). Too much of a good thing? Speculative effects on commodity futures curves. Journal of Financial Markets, 47, 100480. [Google Scholar] [CrossRef]
  30. Wakker, P. P. (2008). Explaining the characteristics of the power (CRRA) utility family. Health Economics, 17, 1329–1344. [Google Scholar] [CrossRef] [PubMed]
  31. Wheatley, S., Sornette, D., Huber, T., Reppen, M., & Gantner, R. N. (2019). Are Bitcoin bubbles predictable? Combining a generalized Metcalfe’s Law and the Log-Periodic Power Law Singularity model. Royal Society Open Science, 6, 180538. [Google Scholar] [CrossRef] [PubMed]
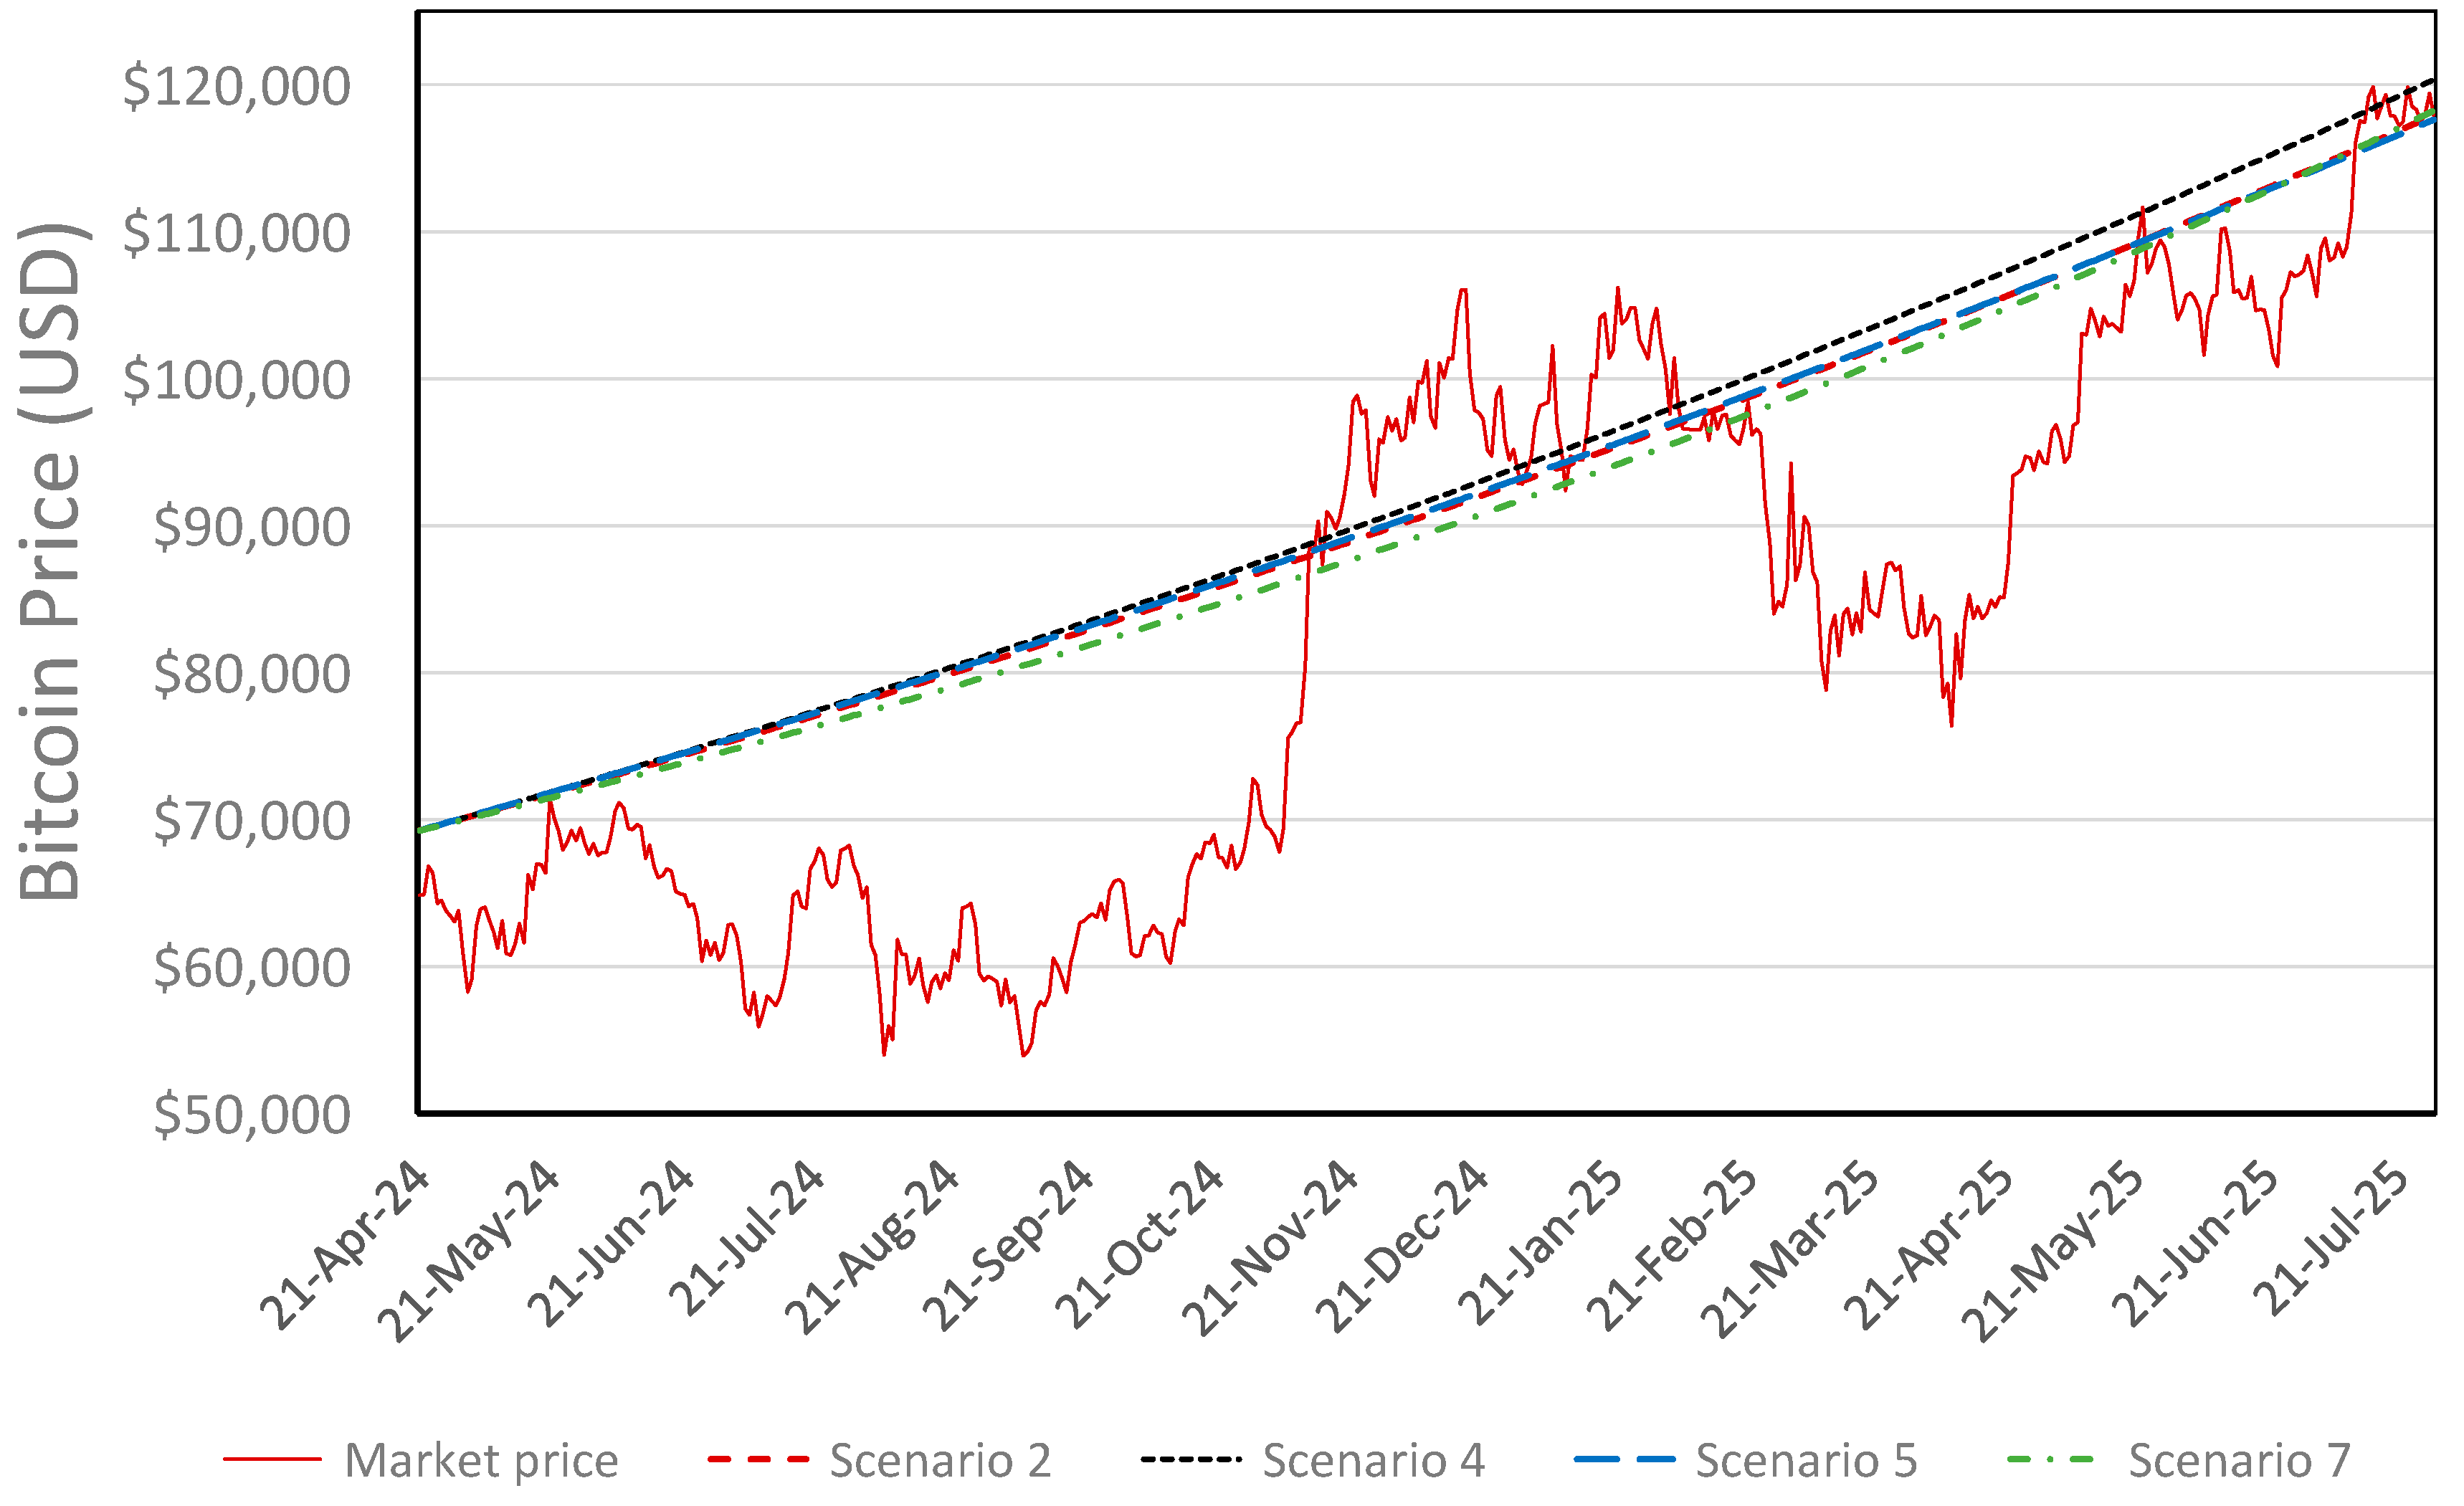
Disclaimer/Publisher’s Note: The statements, opinions and data contained in all publications are solely those of the individual author(s) and contributor(s) and not of MDPI and/or the editor(s). MDPI and/or the editor(s) disclaim responsibility for any injury to people or property resulting from any ideas, methods, instructions or products referred to in the content.

Article Metrics

Citations

Article Access Statistics

Article metric data becomes available approximately 24 hours after publication online.