Article

Bank Crisis Boosts Bitcoin Price

1
School of Mathematics, Statistics and Actuarial Science, University of Essex, Wivenhoe Park, Colchester CO42SQ, UK
2
Hamburg Institute of International Economics (HWWI), Mönkedamm 9, 20457 Hamburg, Germany
3
Leibniz-Fachhochschule, Expo Plaza 11, 30539 Hannover, Germany
*
Author to whom correspondence should be addressed.
These authors contributed equally to this work.
J. Risk Financial Manag. 2024, 17(4), 134; https://doi.org/10.3390/jrfm17040134
Submission received: 13 February 2024 / Revised: 14 March 2024 / Accepted: 21 March 2024 / Published: 22 March 2024
(This article belongs to the Special Issue Financial Technologies (Fintech) in Finance and Economics)

Abstract

:
Bitcoin (BTC) represents an emerging asset class, offering investors an alternative avenue for diversification across various units of exchange. The recent global banking crisis of 9 March 2023 has provided an opportunity to reflect on how Bitcoin’s perception as a speculative asset may be evolving. This paper analyzes the volatility behavior of BTC in comparison to gold and the traditional financial market using GARCH models. Additionally, we have developed and incorporated a bank index within our volatility analysis framework, aiming to isolate the impact of financial crises while minimizing idiosyncratic risk. The aim of this work is to understand Bitcoin’s perception among investors and, more importantly, to determine whether BTC can be considered a new asset class. Our findings show that in terms of volatility and price, BTC and gold have responded in very similar ways. Counterintuitively, the financial market seems not to have experienced high volatility and significant price swings in response to the March 9th crisis. This suggests a consumer tendency to seek refuge in both Bitcoin and gold.
JEL Classification:
F65; G11; C58; G10; G15; G18; O16

1. Introduction

Bitcoin emerged as a digital response to the Great Recession of 2008. In 2009, Bitcoin: A Peer-to-Peer Electronic Cash System was published under the pseudonym ’Satoshi Nakamoto’ (Nakamoto 2009). The goal was to create an electronic payment system based on cryptographic proof rather than trust, allowing two parties to transact directly with each other without the need for a trusted third party. The BTC tokens were created to serve as a manifestation of collectible items, a store of value, a medium of exchange, and a unit of account. They can be transmitted through a decentralized peer-to-peer network across time and space via the blockchain database (Rudolf et al. 2021).
The short history of Bitcoin shows a price trend following a specific cyclical pattern. Every 210,000 blocks, roughly equivalent to four years’ time, the block rewards provided to Bitcoin miners for processing transactions are cut in half. We call this phenomenon halving. This event is perceived by the market as an increase in the scarcity of BTC. Consequently, its price has historically experienced significant appreciation during halving periods. During the last halving cycle in 2020, the price of BTC exceeded $60,000.
The cryptocurrency market, growing steadily since 2009, garners interest from financial institutions, companies, and governments. Despite lacking formal recognition as a distinct asset class, evolving acceptance is evident. When Grayscale won the lawsuit against the SEC’s review of its Spot ETF application, it resulted in a 6% increase in Bitcoin’s price. On 10 January 2024, the first spot ETFs on Bitcoin were approved, confirming the introduction of this asset into international finance.
The approval of the ETF has generated a strong bullish momentum in the months leading up to it; however, this does not justify an increase in use cases. Nevertheless, global examples of adoption are already present: the legal adoption of Bitcoin by El Salvador alongside the US dollar, and the increasing daily use in countries such as Nigeria and Lebanon, highlight the growing acceptance of cryptocurrencies worldwide. Some use crypto due to the lack of banking infrastructure in the country, to hedge against inflation, or for remittances (Gowda and Chakravorty 2021; Ndinga 2023; Raydan 2022; Suberg 2023; World Bank 2022; Young 2023).
However, the important influence that investors’ behavior has in the world of cryptocurrencies is evident. Indeed, investors seek high profits, influenced by market sentiment and media attention (especially social media). However, herding behaviors and ongoing market inefficiencies persist, as evidenced by previous cycles characterized by the formation of speculative bubbles (Almeida and Gonçalves 2023).“Rational bubbles exist when investors anticipate that they can profitably sell an over valued asset at an even higher price. In contrast, irrational bubbles are formed when investors are driven by psychological factors unrelated to the asset’s fundamental value” (Cheah and Fry 2015).
Crypto assets are increasingly being viewed as an alternative investment and are even being recognized as a new asset class by various investors, including banks, family offices, asset managers, brokers, and retail investors. Ciaian et al. (2016) assert Bitcoin demands analysis beyond traditional currencies, viewing it as a hybrid entity involving currency, speculative asset, and safe-haven aspects. Dyhrberg (2016a) sees shared traits with both currencies and commodities. Klein et al. (2018) draw parallels between Bitcoin and gold but highlight market differences.
As outlined in research conducted by Pandey et al. (2023); Vo and Le (2023); Yousaf and Goodell (2023), the repercussions of the collapse of some international banks as of 9 March 2023 were evident in several sectors. American stocks and international banking shares displayed notable adverse returns. However, some financial assets reacted particularly well to the risk of an international banking crisis. Gold, above all, confirmed its role as a safe-haven asset. Surprisingly, however, Bitcoin also reacted positively to this risk. In our opinion, Bitcoin’s reaction to the fear of a systemic banking crisis is a clear indication of the changing perception that BTC is gaining among investors and within international finance.
The purpose of this paper, however, is not to provide a historical analysis of BTC’s performance but rather to analyze two fundamental issues. Firstly, we aim to understand the real perception of Bitcoin among investors. It is true that the cryptocurrency market is prone to speculative bubbles and market inefficiencies and amplifies numerous cognitive behavioral biases (Almeida and Gonçalves 2023). However, in our view, the recent banking crisis that began on 9 March 2023 provides significant insights into the current perception of Bitcoin by investors. Secondly, we aim to understand whether BTC can be defined as a new asset class. In fact, in a May 2021 report titled Crypto: A New Asset Class?, Goldman Sachs declared that Bitcoin is now considered an investable asset despite its high idiosyncratic risk (Nathan et al. 2021). The two realms, as defined by Galati and Capalbo (2023), traditional finance and cryptocurrencies, are already intimately connected. It is, therefore, important to analyze the developments in the world of cryptocurrencies and understand their implications for traditional markets.
In the past, Bitcoin has often been perceived as a panacea capable of replacing financial institutions and providing refuge from sovereign risk and weaknesses in the global financial system (Bouri et al. 2017, 2020; Luther and Salter 2017). Its price surged during the European debt crisis of 2010–2013 and the Cypriot banking crisis of 2012–2013 (Luther and Salter 2017), as some investors sought Bitcoin as a shelter against political and sovereign risks. However, in 2013, Bitcoin was still a relatively new asset and was affected by an even higher speculative component than what we observe today.
This study assumes significant importance in identifying the shift in perspective that investors appear to have had on BTC. It is no longer just a speculative asset with high volatility, subject to speculative bubbles, but potentially also an asset that, like gold, can protect investors from potential economic and financial crises and/or external shocks. It could be a complementary asset to traditional finance but also, in a sense, an alternative, as it is separate and autonomous (because it is decentralized) from the traditional banking system.
In order to isolate and better analyze the impact of the Silicon Valley Bank (SVB) crisis on the banking sector, we developed a bank index. This is a weighted index of the top capitalized banks in the Standard & Poor’s 500 market. By integrating this index into our analysis, we aim to grasp insights about the post-crisis turbulence and persistence of volatility. This will be practically achieved by employing symmetric and asymmetric GARCH models.
This paper is structured as follows: In Section 2 and Section 3, we provide a comprehensive review of the pertinent literature to which this study seeks to make a valuable contribution, elucidating our research hypothesis in the process and presenting the current macroeconomic scenario. In Section 4, the data are presented and the methodology explored. A discussion of our findings is presented in Section 5 and Section 6 concludes.

2. Literature Review

Cryptocurrencies represent a relatively recent new industry. Since its inception in 2009, Bitcoin (BTC)1 has witnessed numerous developments over its fifteen-year history. BTC is characterized by a limited coin supply, with only twenty-one million coins scheduled for issuance. This issuance will most likely continue until 2140, at which point the last coin is expected to be mined (Phillips 2022).
BTC adopts a decentralized technology on a global scale, promising to bring greater security, transparency, auditability, and efficiency to currency transactions (Scott et al. 2017). Investor perception around BTC is subject to strong emotional reactions (Ahn and Kim 2021), but we can argue that Bitcoin’s volatility is also due to its low market capitalization compared to other more mature markets (Rudolf et al. 2021). The state of the art has addressed the topic of BTC as an alternative investment, but its instability tends to deter from this type of investment. However, observed from a long-term perspective, Bitcoin becomes less speculative (Rudolf et al. 2021; Yermack 2015). Conversely, increased volume and liquidity typically result in reduced volatility (Frino et al. 2011).
Since its creation, BTC has experienced numerous price fluctuations but continues to exhibit a long-term bullish trend (Murty et al. 2022). The price of Bitcoin surpassed $1 in February 2011. However, in June 2011, Bitcoin experienced its first bubble, rising to $31 before sinking below $10 again (Murty et al. 2022). Subsequently, in April 2013, Bitcoin reached $200, and by the end of November that year, it was above $1000. Bitcoin rose to $19,000 in January 2017, after which we witnessed the 2018 bubble burst driven by a boom in initial coin offerings (ICOs) (Murty et al. 2022). Bitcoin’s price surpassed $60,000 in April 2021, setting a new record. To date, the price, after a long crypto winter, is back around $60,000, driven mainly by the approval of spot ETFs on 10 January 2024.
Given its parabolic price trend, one can only speculate about the kind of asset BTC might be associated with. Could it align more with stocks, bonds, or gold? Is it primarily a speculative asset or a reliable store of value?
According to Rudolf et al. (2021), traditional stores of value hold value due to their scarcity when large networks of people seek them or due to their income-generating capacity of those assets. If a commodity possesses utility but is not scarce, it cannot be considered a store of value. Bitcoin’s scarcity arises from two specific characteristics: its decentralized network, with thousands of nodes, makes it impossible to change the network’s operation without taking control of the entire network and the impossibility of imitating/cloning BTC due to the accumulated network effects over the years (Böhme et al. 2015; Neureuter and Kuiper 2023; Rudolf et al. 2021).
Hence, we believe that BTC could be associated more as a store of value or as an alternative asset to gold, given the extensive literature on the topic, rather than merely being considered a speculative asset.
Many studies on cryptocurrencies have explored whether Bitcoin can be considered as virtual gold (Klein et al. 2018) as well as its hedging ability against traditional assets (Wang et al. 2019). On the other hand, BTC appears to behave very similarly to gold, and over time, its volatility seems to decrease while often exhibiting higher returns compared to both gold and major stock indices (Jareño et al. 2020). Bitcoin can be used as a hedge against Financial Times stock index securities and the US dollar even in the short term (Dyhrberg 2016b; Rudolf et al. 2021).
Therefore, like gold, Bitcoin can be included in the range of tools available to market analysts to hedge specific market risks (Corbet et al. 2019), showing superiority over both gold and commodities (Bouri et al. 2020), and it can be considered a significant asset for portfolio diversification (Hatemi-J et al. 2022).
Anyway, the literature on BTC tends also to emphasize the immaturity of the crypto market (Conlon and McGee 2020; Corbet et al. 2020; Murty et al. 2022), highlighting how investors tend to flee from risky assets like cryptocurrencies during turbulent periods. However, we do not refute this hypothesis but rather emphasize the ongoing change of perspective on BTC, which clearly distinguishes it from the rest of cryptocurrencies (consider the approval of ETFs in January 2024). Its inflation rate is about 1.8%, similar to gold’s current rate (WGC 2019). Unlike gold, Bitcoin’s supply is provably finite, establishing it as a uniquely credible digital asset with an immutable monetary policy (Neureuter and Kuiper 2023).
Our paper deviates from the existing literature by attempting to assign a distinct role to BTC, essentially considering it as a separate asset. It is hybrid in a certain way, containing both speculative and safe haven aspects. The structure of Bitcoin significantly influences our perspective. For example, its potential limitation in the number of coins leads us to consider it as a scarce resource, similar to gold. However, we believe that Bitcoin represents more than just a scarce resource and therefore a store of value. We believe that BTC can assume a novel role among the various asset classes available today. Its nature is inherently linked to the traditional market, yet it remains distinct (or isolated) from it (Corbet et al. 2018). Its strength lies in decentralization, a characteristic that no traditional asset class can boast. Its characteristics could make BTC immune to systemic banking crises, economic crises, or exogenous shocks. In fact, Mokni et al. (2021) suggest that Bitcoin exhibits hedging characteristics and safe haven attributes against particular uncertainties. Along the same lines, Galati and Capalbo (2023) discuss the concept of “flight to safety,” referring to the capital exodus from traditional banks to cryptocurrencies during the recent banking crisis. Moreover, with time and thanks to the approval of ETFs, the market will tend to grow, reducing the volatility that limits its adoption. In fact, once volatility is stabilized, mass adoption will ensue (Rudolf et al. 2021).

3. Macroeconomics Scenario

We are currently navigating a complex historical moment where economies, already battered by the pandemic crisis between 2020 and 2022, are now grappling with high inflation and sluggish economic growth. Recently, the international banking system has been severely impacted, with the failure of several international banks in the past year. Some believe that on 9th March 2023, the failure of Silicon Valley Bank (SVB) marked the beginning of a prolonged period of bank failures and crises, accompanied by evident systemic risk (Galati and Capalbo 2023; Morrow and Egan 2023). To date, the banking crisis that began on March 9th seems to have been overcome without major repercussions, but by March 2023, fears of a systemic crisis had spread.
The SVB’s collapse triggered a global bank run, impacting banks such as Credit Suisse. Silvergate Capital and Signature Bank also experienced crises. To address the situation, the FDIC implemented a “systemic risk exception” for depositors surpassing $250,000. UBS assumed control of Credit Suisse on March 19 due to significant withdrawals and doubts about its stability. Notably, Roblox, with $150 million in deposits, would have been vulnerable without this exception (Galati and Capalbo 2023). In March 2023, the risk of global contagion within the banking sector appeared to intensify (Akhtaruzzaman et al. 2023).
Furthermore, the recent uptick in interest rates, enacted by central banks worldwide to mitigate inflationary pressures, has led to a $2 trillion decline in the market value of assets held by the US banking system. The significant proportion of uninsured deposits at certain US banks poses a threat not only to the stability of the US banking sector but also to the overall global financial system (Lynch 2023).
Beginning on 9 March, there was a surge in demand for gold and silver amid high prices, leaving investors uncertain. Equities and bonds were perceived as risky assets due to the banking crisis. Surprisingly, Bitcoin grew by 50% in a few months, raising questions about its role. Can it be viewed as an alternative, separate from the international banking system, and potentially disruptive to the system it aims to challenge?2

4. Data and Methodology

To address the research question outlined in the previous section, daily adjusted closing stock prices are utilized. Data were gathered from Yahoo Finance for Bitcoin (BTC), Standard & Poor’s 500 (SP500), Nasdaq (NASDAQ), and PAXG (PAXG). The rationale behind the selection of these symbols is detailed in Section 5, covering the period from 1 January 2022, to 9 July 2023 and resulting in a total of 554 observations. It is noteworthy that the last Bitcoin halving occurred on 11 May 2020. Thus, the selected time span aims to eliminate the undue volatility associated with the previous halving period and subsequent market euphoria, which led to significant peaks in March and October 2021, respectively.
In line with current best practices, let P t represent the adjusted closing price of the asset at time t, for t = 1 , , T , where T = 554 . The log returns, also known as returns, at time t are defined as r t = log ( P t / P t 1 ) , whereas the squared returns, serving as indicators of volatility, are denoted by r t 2 .
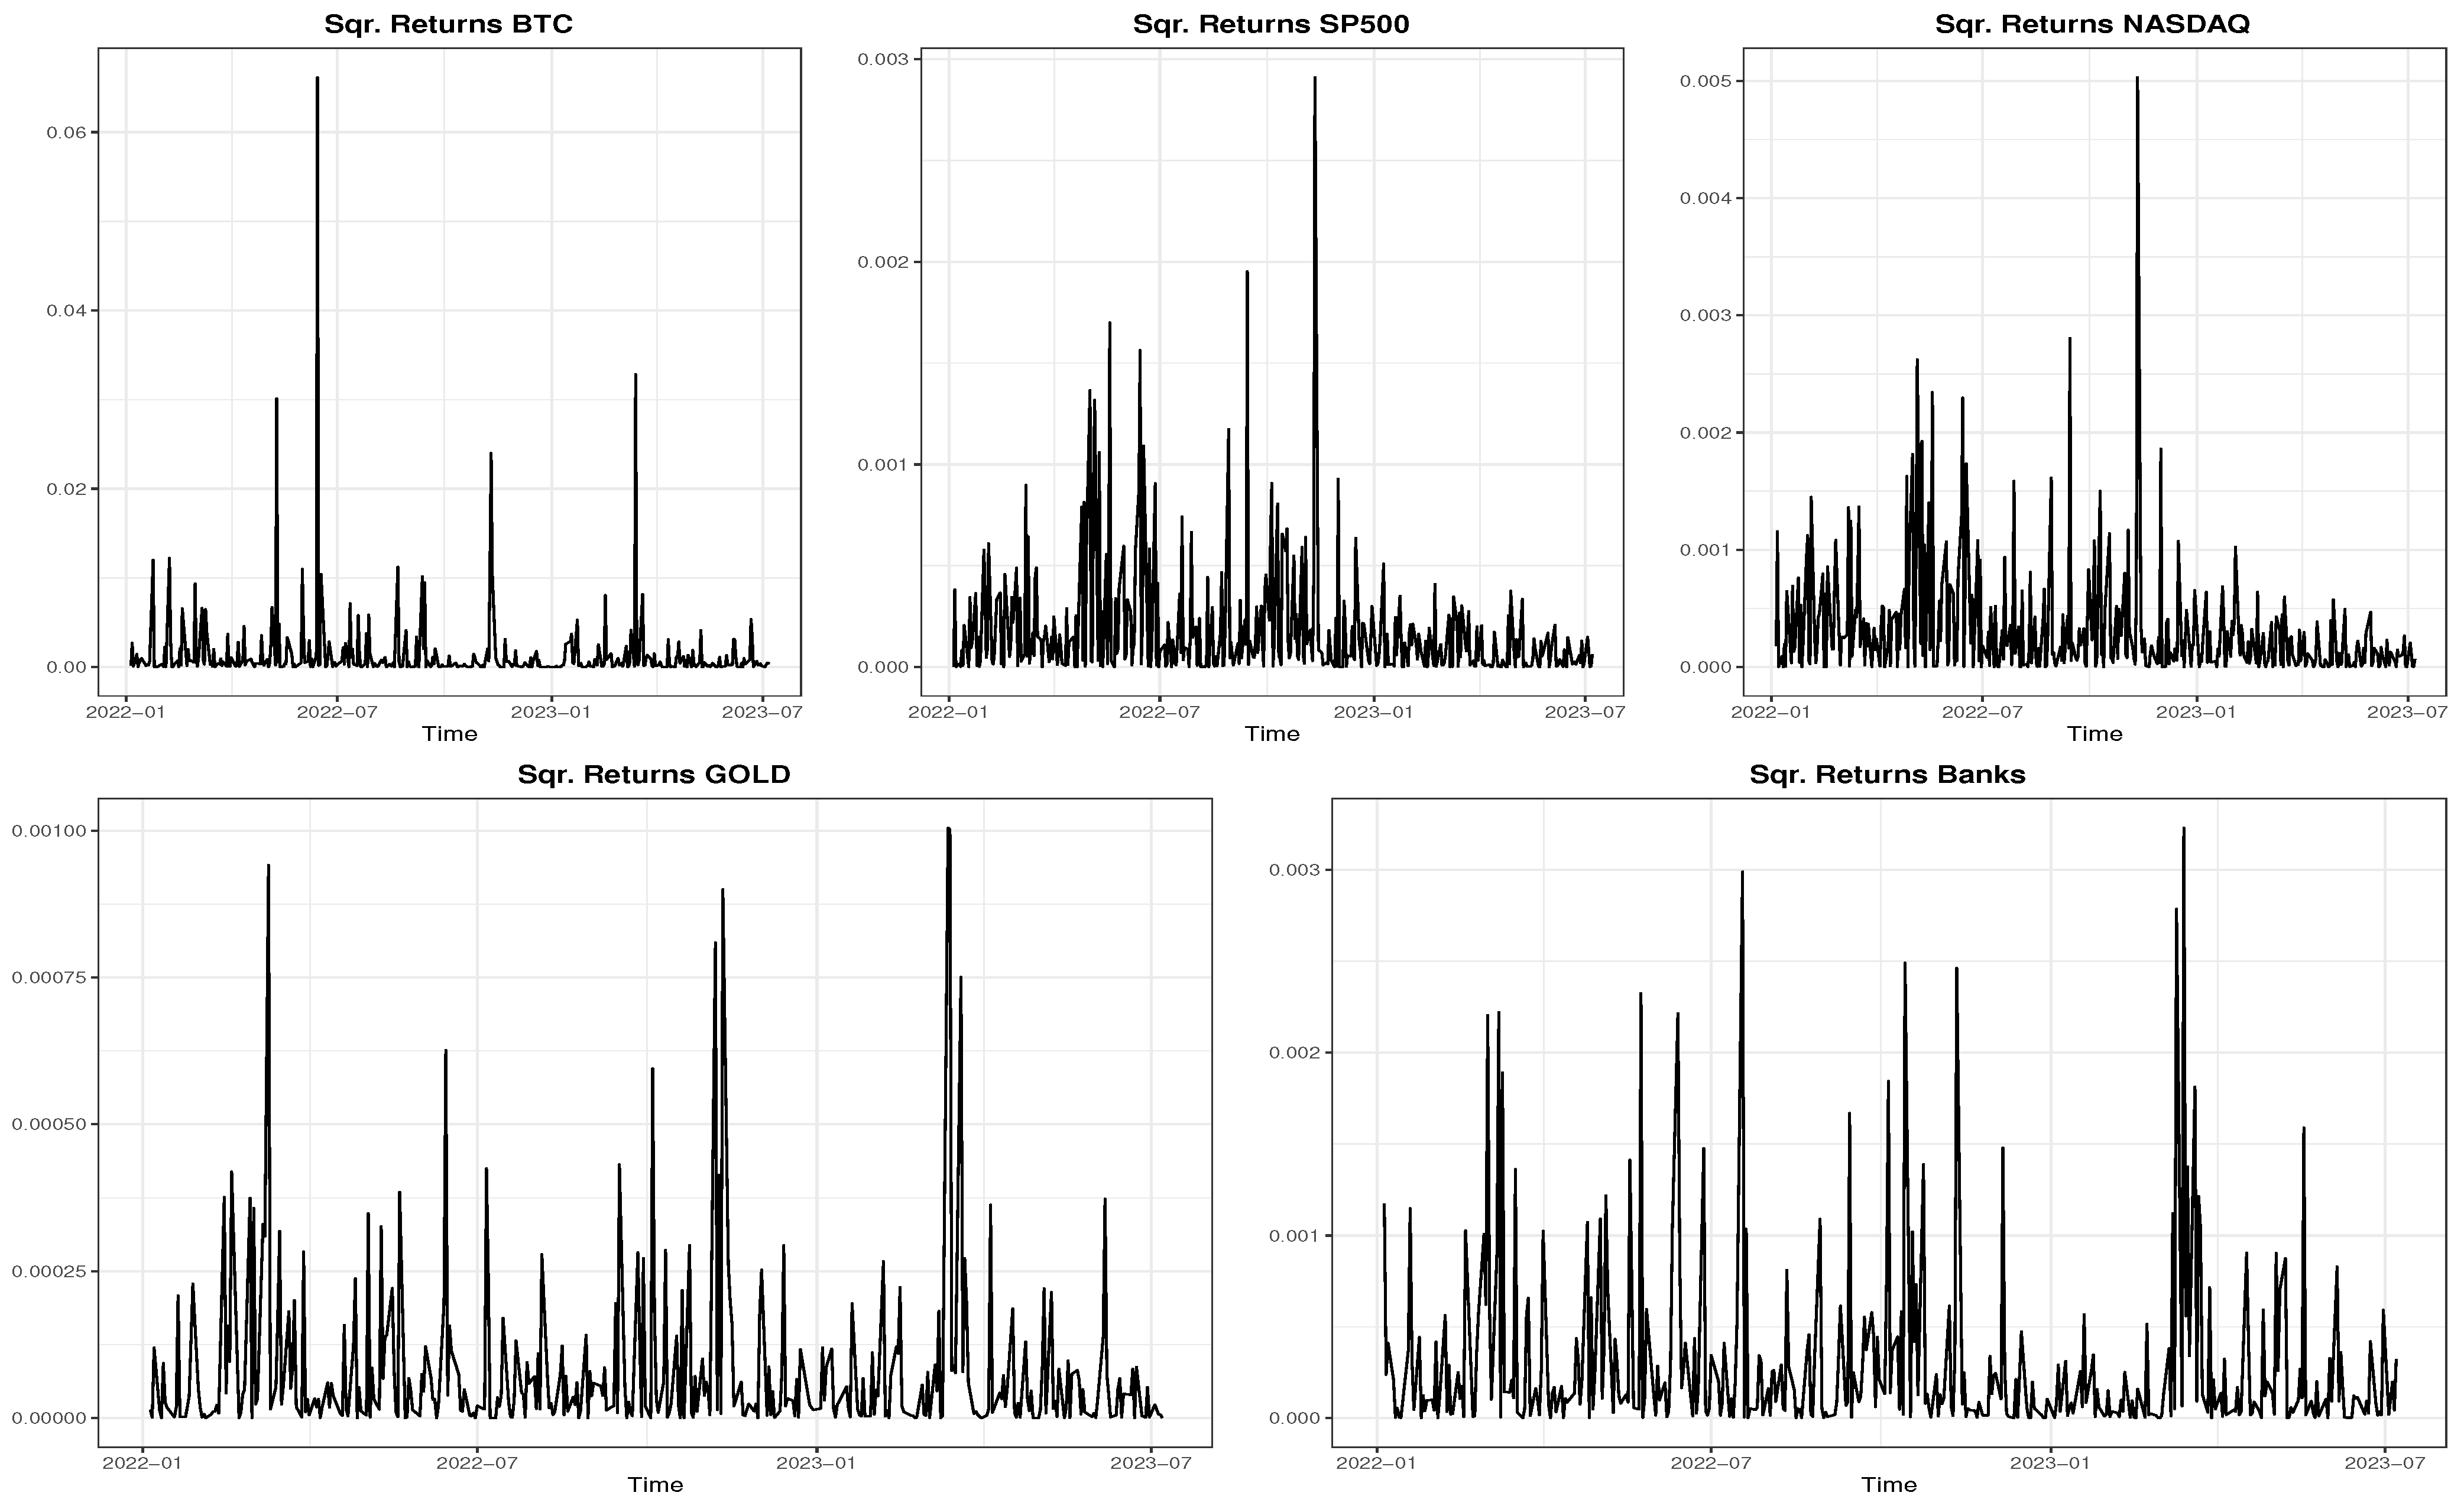
Preliminary analysis, presented in Table 1 and Figure 1, reveals that the returns series centers around zero and displays moderate skewness and kurtosis. Furthermore, there is no significant partial or total autocorrelation detected in the log-returns series. The Jarque–Bera test, utilizing the given sample, suggests rejection of the normality hypothesis. It is commonly acknowledged that returns from the cryptocurrency and stock markets demonstrate notable volatility and exhibit volatility clustering, a pattern empirically supported by the squared returns in Figure 2. The stationarity hypothesis was assessed and subsequently verified using the Augmented Dickey–Fuller (ADF) and Phillips–Perron (PP) tests, as documented in Table 1. The tests affirm stationarity for each financial asset under examination. In addition, a significant feature of financial time series is the marked memory in squared returns, signaling conditional heteroskedasticity. This characteristic was further confirmed through the Ljung–Box Q-Test applied to squared returns and Engle’s Lagrange Multiplier test for the returns, with outcomes detailed in Table 1.
Given the characteristics of the returns, employing a conditional heteroskedasticity model for analyzing the marginal volatility of the financial indices under consideration appears justified. The existing literature supports the notion that, in contexts of symmetric information, the GARCH (1, 1) model effectively captures data volatilities and returns. Conversely, under conditions of asymmetric information, asymmetric GARCH models prove to be more appropriate (see Bhowmik and Wang 2020; Pichl and Kaizoji 2017; Sapuric et al. 2022).
Let { r t } t = 1 T denote a sequence of observed log-returns with mean and variance defined as μ t = E [ r t | F t 1 ] and σ t 2 = Var ( r t | F t 1 ) = E [ ( r t μ t ) 2 | F t 1 ] , respectively. Here, F t 1 represents the information set available at time t 1 . Define a t = r t μ t as the innovations at time t. The sequence a t follows a GARCH ( m , s ) process (Bollerslev 1986) if
a t = σ t ϵ t σ t 2 = α + i = 1 m γ i a t i 2 + j = 1 s β j σ t j 2 ,
where { ϵ t } t = 1 T is a sequence of i.i.d. random variables with mean zero and unit variance. Under the model framework in (1), α > 0 , γ i 0 , and β j 0 are parameters ensuring model stability, with the constraint that i = 1 m a x ( m , s ) ( γ i + β i ) < 1 . Consequently, this implies that γ i = 0 for all i > m and β j = 0 for all j > s .
This constraint on γ i + β j ensures that the conditional variance of the innovations remains finite and that the conditional variance evolves over time. The parameters γ i and β j are traditionally denoted as the ARCH and GARCH parameters, respectively (Tsay 2005).
In the analysis detailed in Section 5, we adopt a methodology that integrates an autoregressive model of order 1 ( A R ( 1 ) ) to capture the conditional mean, alongside a first-order GARCH-type model to address conditional heteroscedasticity. This implementation is executed using the rugarch package within R (Ghalanos 2022), with the fitted models specified in Table 2. Various configurations are examined to model conditional heteroscedasticity, including GARCH, EGARCH, GJR, and APARCH, aimed at detecting potential leverage and Taylor effects (Taylor 2008). The optimal model for each symbol is determined based on information criteria: the Akaike Information Criterion ( A I C ), the Bayesian Information Criterion ( B I C ), the Hannan–Quinn Information Criterion ( H Q I C ), and the Schwarz Information Criterion ( S I C ), as outlined in Table 3.
The distributions employed are the Normal ( N ), Generalized Error ( GE ), Generalized Hyperbolic ( GHYP ), and T-distribution ( T ). Asymmetric distributions are not considered as the exploratory analysis reveals no evidence of asymmetry in the analyzed sample; see Figure 1.
Another key element of this work is the definition of the Bank Index (Bank Index). For the i th bank at a given time t { 1 , , T } , the index is defined as
Bank Index i , t = Price i , t × Shares Outstanding i i Shares Outstanding i .
The index, as expressed in Equation (2), is derived from a weighted average based on the market capitalization (product of price and shares outstanding) of the major banks included in the Standard & Poor’s 500. The primary objective of the Bank Index is to isolate the impacts of the banking crisis while mitigating idiosyncratic effects. It is important to note that, at any given time t, the numerator represents the market capitalization of the i-th bank relative to the total market capitalization of the 18 banks listed in Table 4.

5. Analysis

The aim of this paper is to conduct a comprehensive comparison of the performance between Bitcoin and two major international stock market indices: NASDAQ and SP500. It is noteworthy that both the SP500 and NASDAQ have demonstrated a positive correlation with Bitcoin, especially during periods of heightened uncertainty (Nguyen 2022).
Given the banking crisis that commenced on 9 March 2023, our objective is to explore whether these three assets—Bitcoin, NASDAQ, and the Standard & Poor’s 500—exhibited distinct reactions to this external shock. By analyzing their respective responses, we aim to understand the impact of the crisis on the volatility of each asset.
The inclusion of the Bank Index enhances our exploration of banking phenomena within the global banking and financial system, offering valuable insights into the dynamics of the study. Notably, Bitcoin exhibits characteristics akin to gold and acts like a currency, especially in its response to the federal funds rate (Dyhrberg 2016a). To further explore its reputation as a scarce asset and its potential long-term behavior mirroring that of gold, we incorporate the PAXG index into our analysis, serving as a gold proxy.
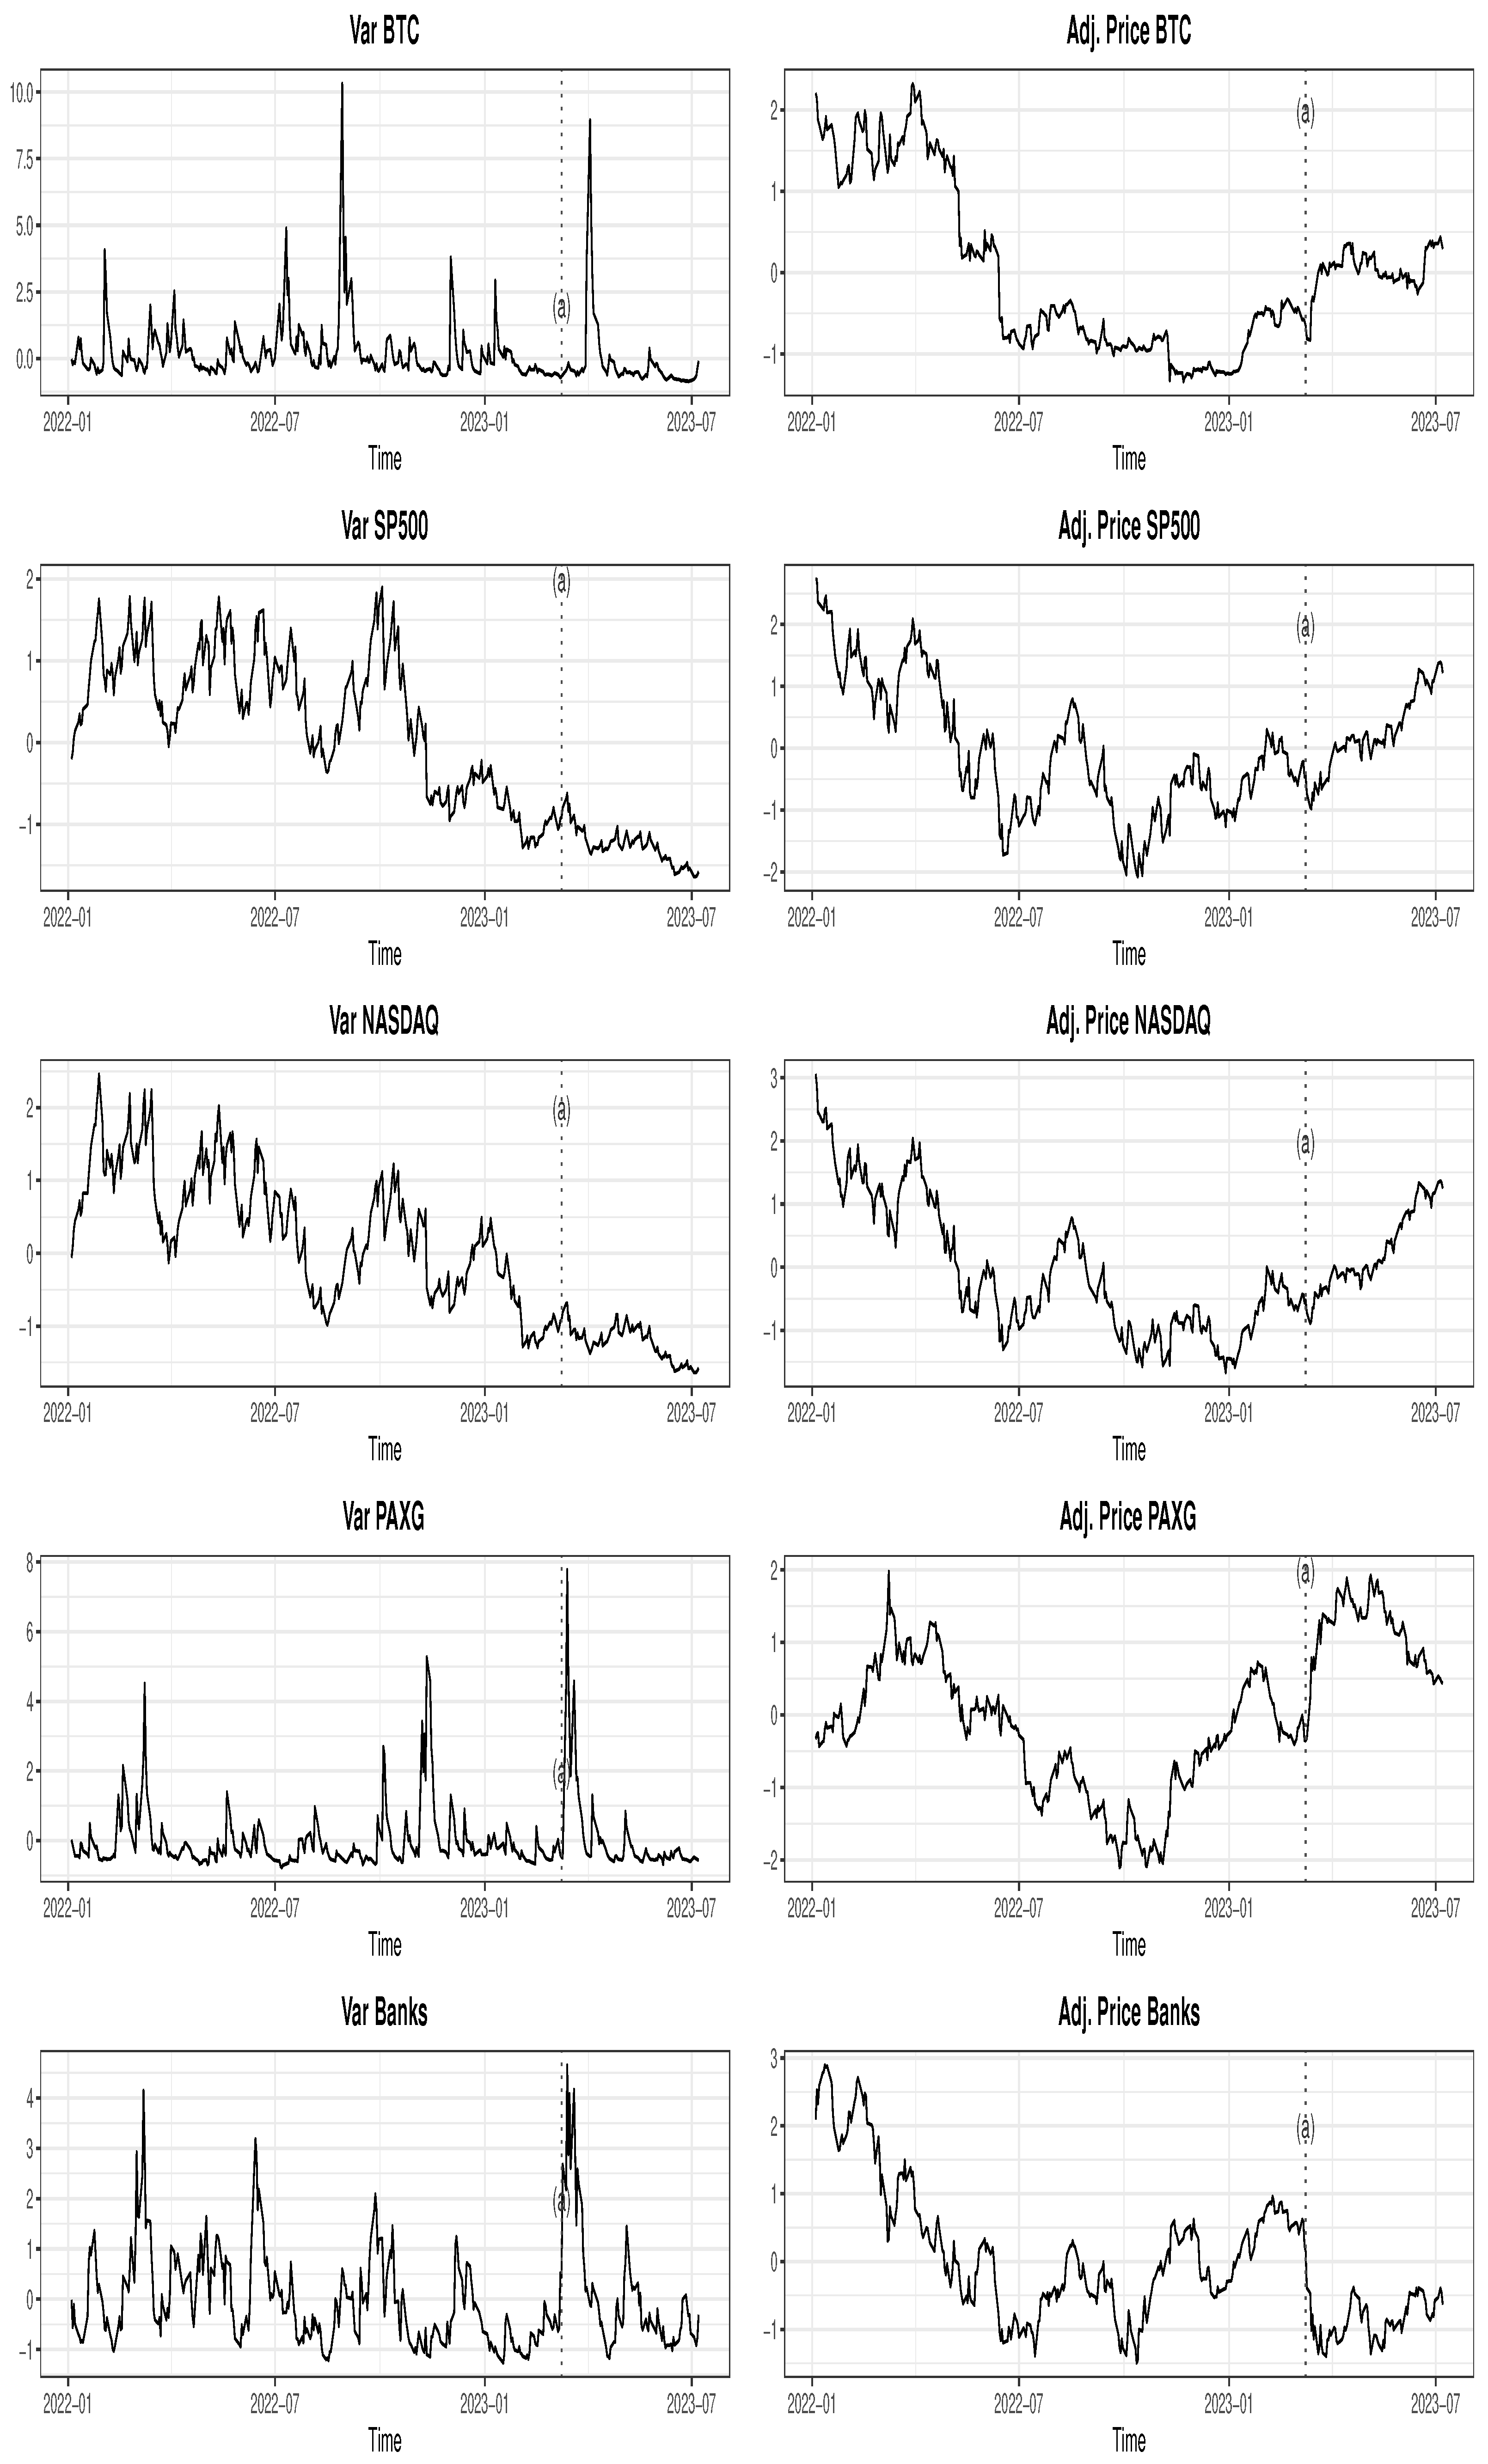
The analysis concentrates on estimating conditional volatility using various configurations of GARCH models. Initially, we identify potential setups and distributions for these models, leading to a total of 16 distinct configurations. Each configuration undergoes thorough evaluation. Subsequently, the model is selected based on information criteria and adjusted for the number of observations in the dataset, as shown in Table 5. This process results in Figure 3 and Figure 4, where we present a standardized version of the estimated volatilities.
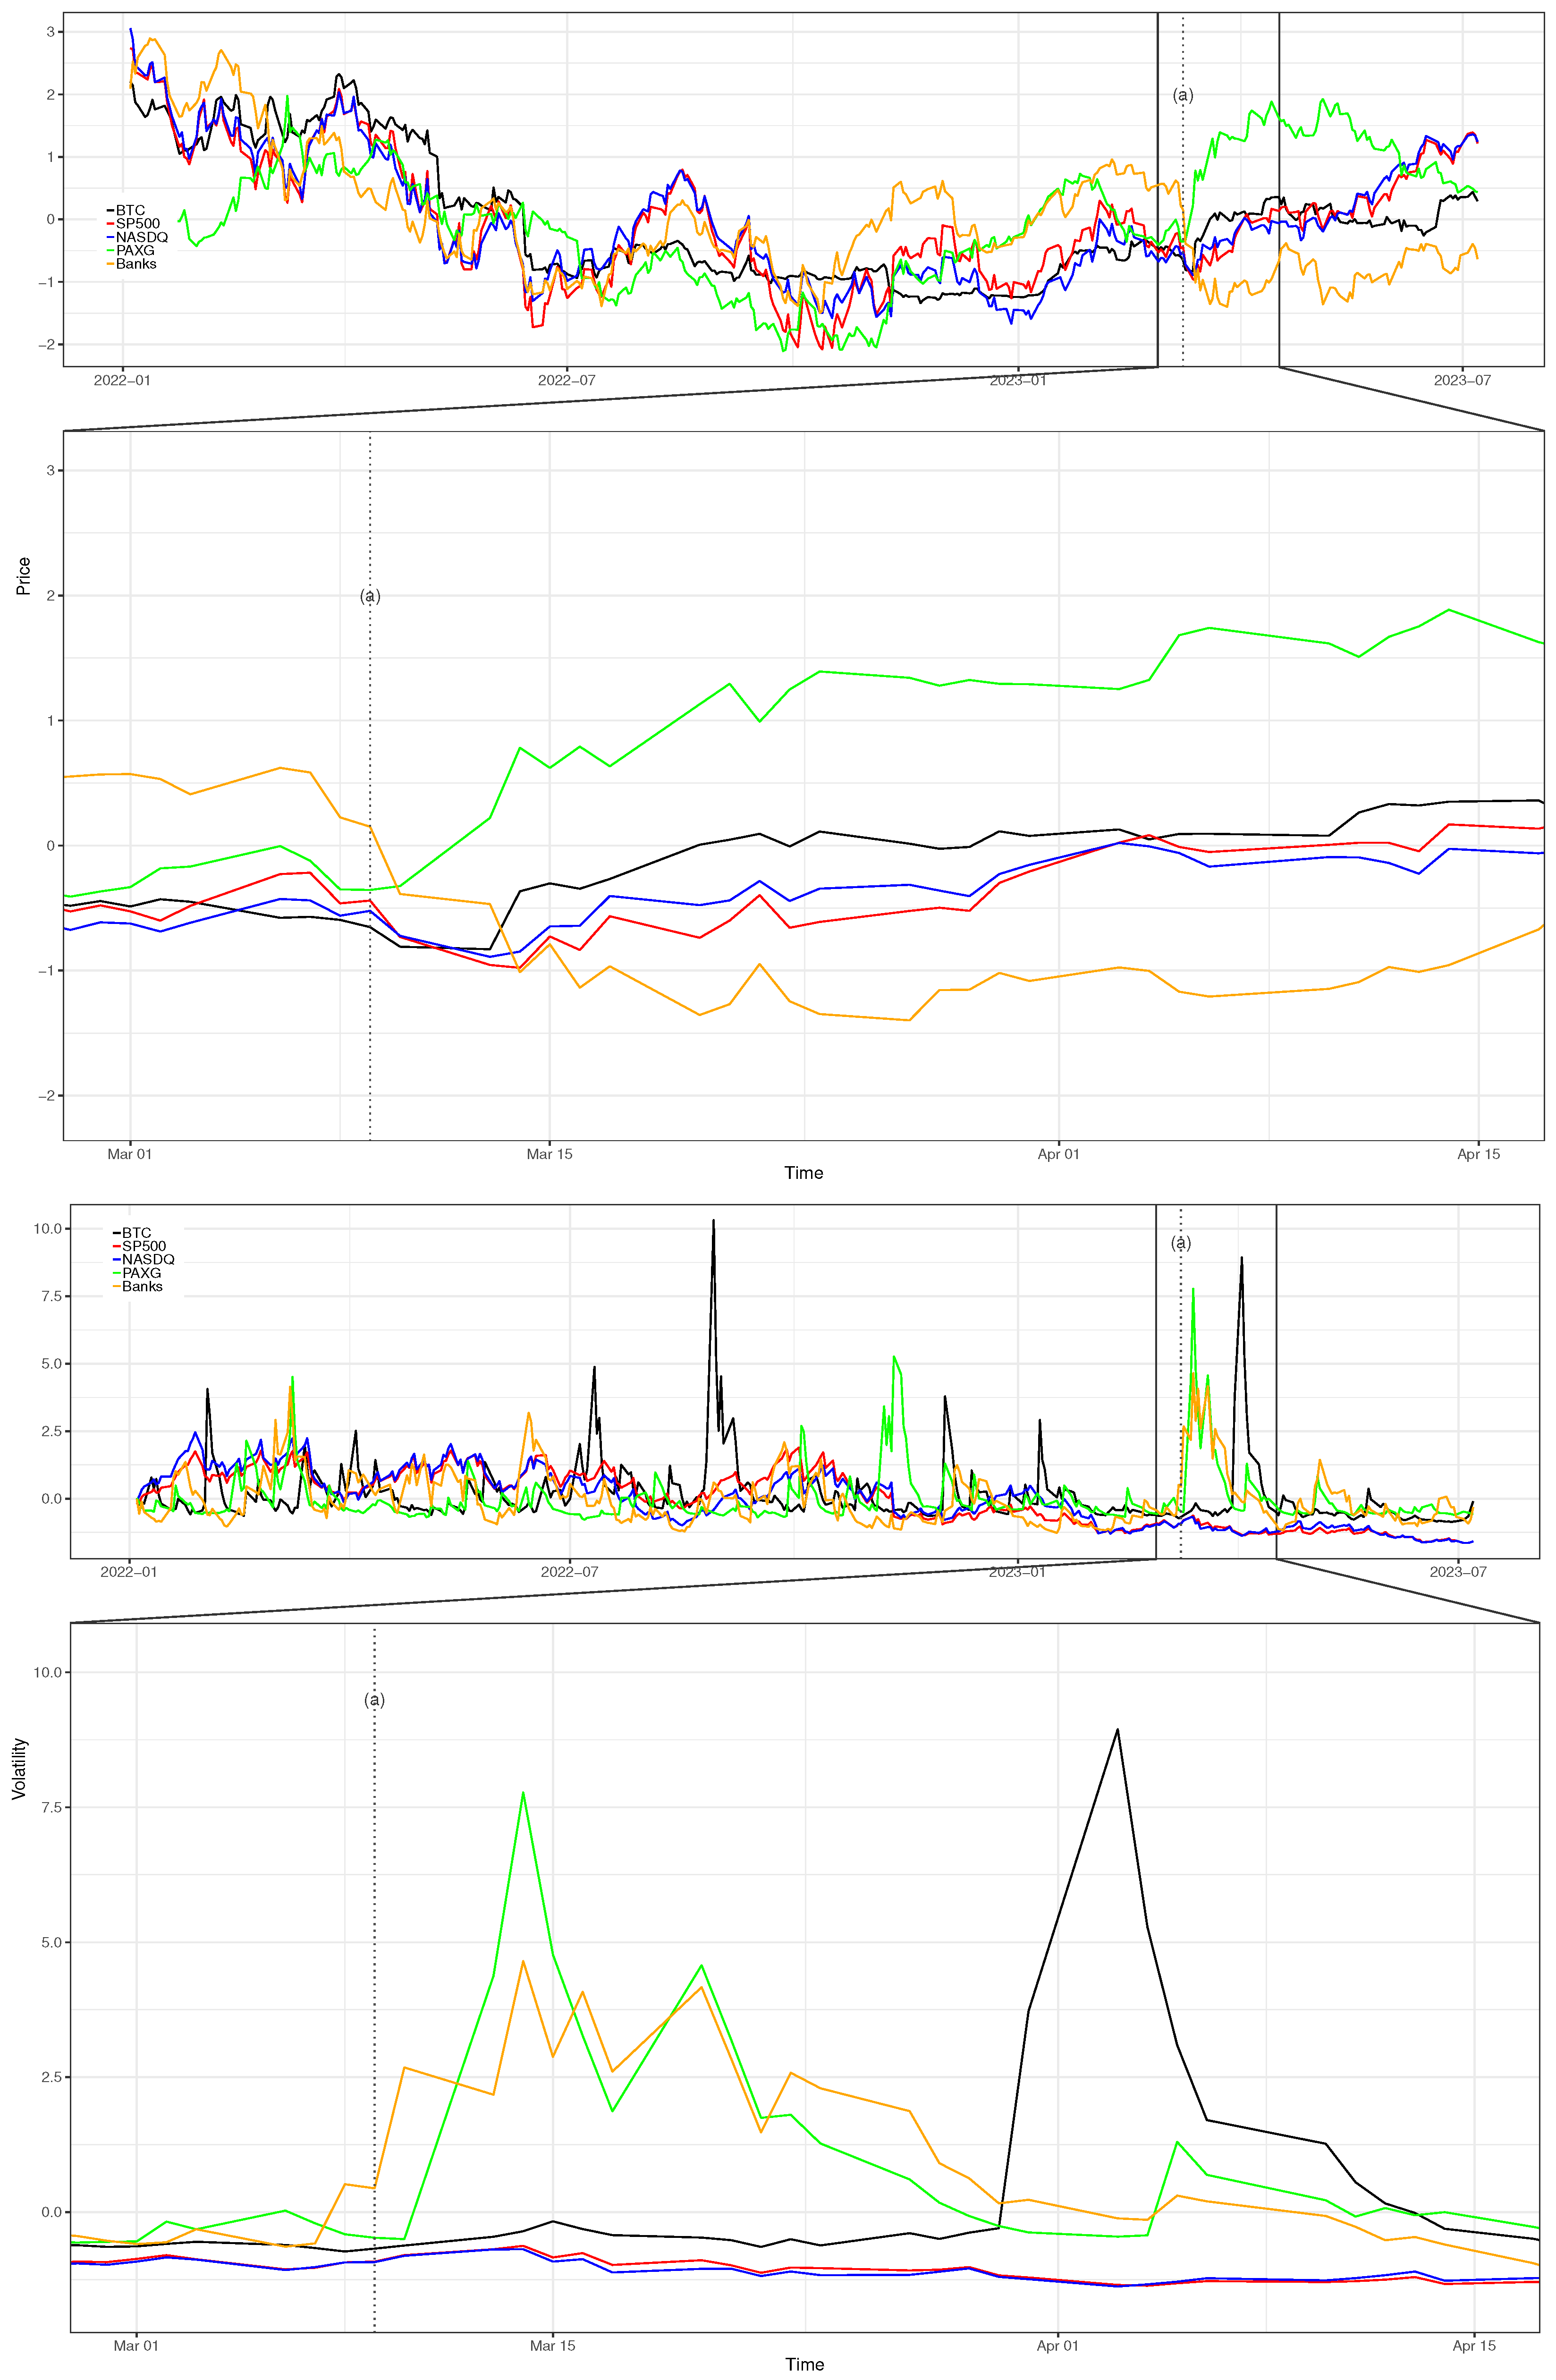
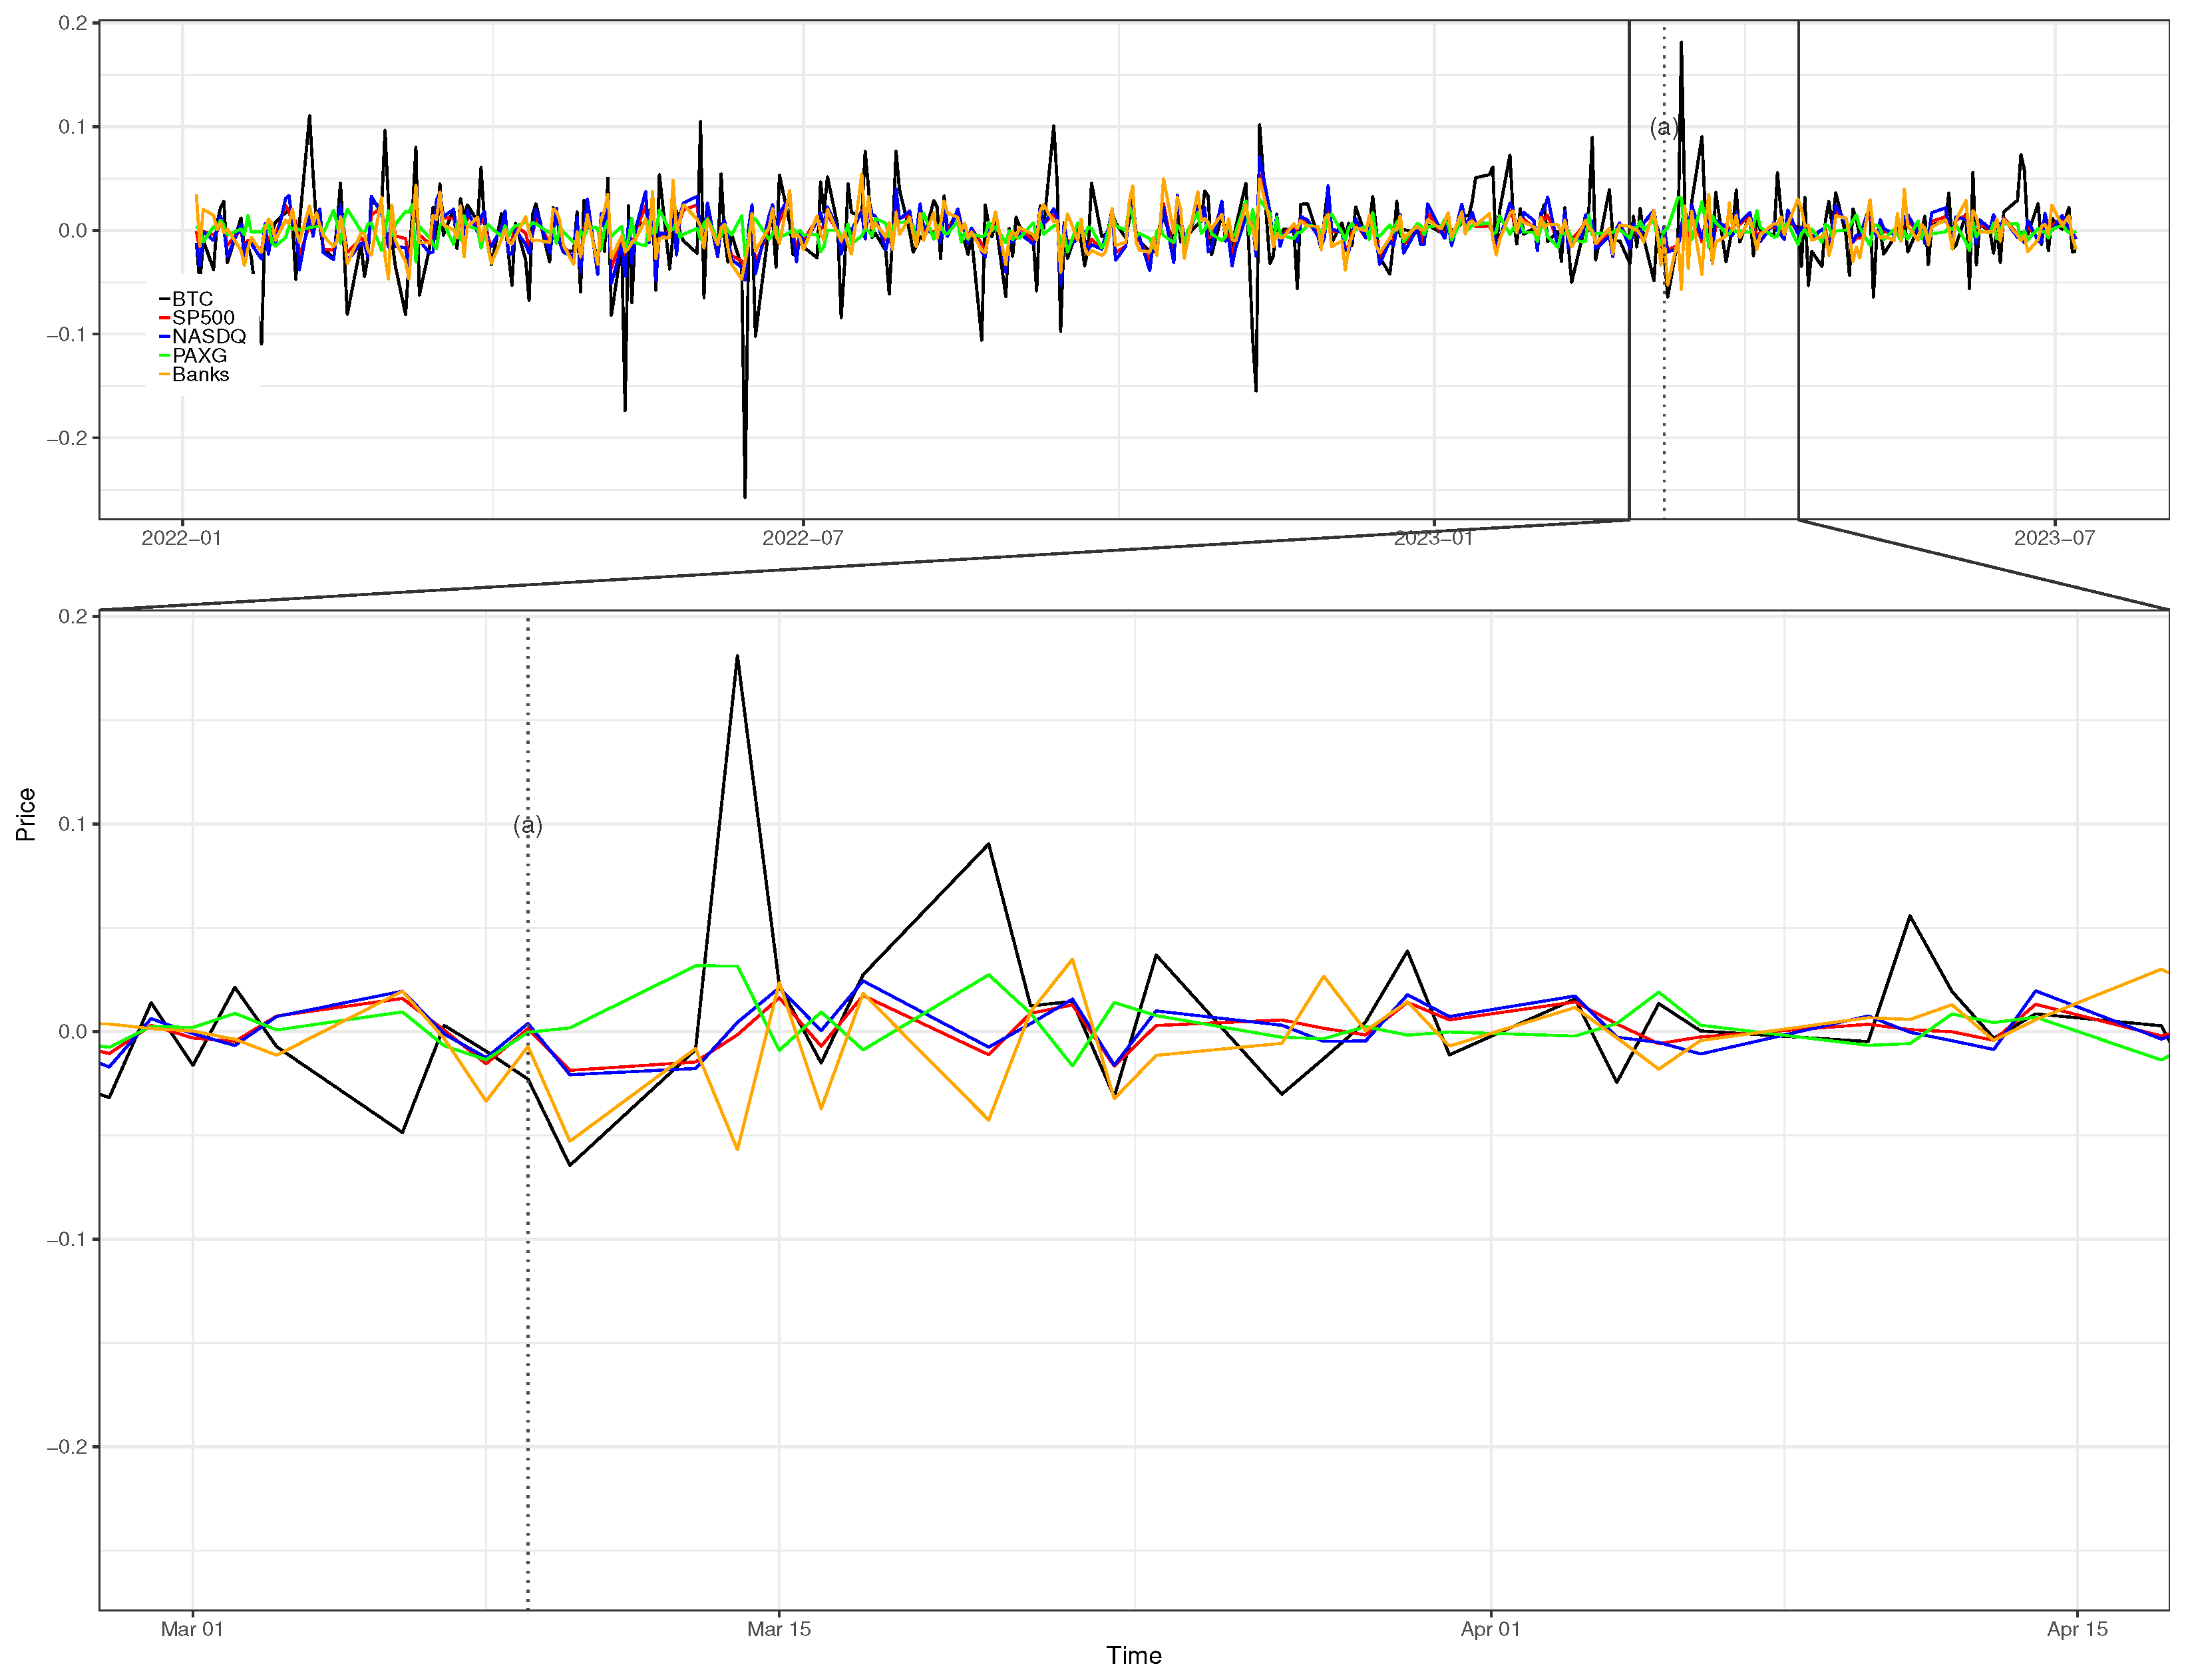
The preliminary observations discussed so far align with the data and charts we present in this section. Figure 3 presents standardized estimated volatilities (first column) and adjusted prices (second column). After the March banking crisis, BTC, PAXG, and the Bank Index (defined in Equation (2)) display significant volatility and subsequent rapid price fluctuations. In contrast, SP500 and NASDAQ exhibit only moderate increases in volatility. The surge in the Bank Index’s volatility directly mirrors the banking crisis impacts, affirming the index’s relevance. For clarity, Figure 4 juxtaposes scaled adjusted prices, volatilities, and returns, highlighting a sharp increase in gold prices (illustrated in green) at the crisis onset, indicating a shift towards safer assets amid heightened banking risks.
Significantly, Bitcoin (BTC) saw a notable price rise following the banking crisis’s outbreak on 9 March 2023. Meanwhile, the Bank Index, as defined in Equation (2), endured a period of heightened volatility (illustrated in Figure 4). The SP500 and NASDAQ initially suffered but subsequently recovered as systemic risk fears waned. Intriguingly, BTC volatility peaks towards late March, lagging the banking index and gold’s volatility decrease, hinting at a deeper linkage among these assets. As the traditional assets began to stabilize, BTC entered a phase of significant volatility, suggesting a possible shift in investor behavior towards traditional investments following reduced systemic crisis fears.
Examining daily returns (refer to Figure 4), BTC showcases nearly 20% growth around 13 March, contrasting with the more stable fluctuations of other assets. Notably, the returns of BTC and our banking index often mirror each other post-crisis, suggesting a potential capital migration from traditional markets to BTC and cryptocurrencies.
While gold’s status as a safe haven is expected, Bitcoin’s emergence as a protective asset against traditional market volatility is notable. Bitcoin, being a relatively new asset, lacks extensive historical data for definitive characterization. We rely on speculative analysis and observations from various global economic events. There are indications of significant crypto market capital inflows during the banking crisis (Butterfill 2022; Galati and Capalbo 2023). The gradual acceptance by institutions and potential SEC approval of a spot ETF may pave the way for Bitcoin’s institutionalization, possibly reducing its historical volatility in the future.

6. Conclusions

The analysis clearly demonstrates that BTC and gold exhibit similar behaviors following the 9 March crisis in terms of volatility and price changes. Both assets tend to show high volatility and abrupt price increases, indicating a consumer tendency to seek refuge in them. It is reasonable to assert that the price increase in gold has been more significant, possibly due to its well-established nature compared to the relatively unregulated BTC. Various ETFs on BTC have been approved to date, and it remains to be seen how this will affect the consolidation of this asset.
Conversely, the traditional financial market, represented by the Standard and Poor’s 500 and the Nasdaq, does not experience spikes in volatility but shows trends of negative volatility instead. This suggests the absence of a widespread rush to sell or buy, further confirming the validity of the proposed Bank Index.
In conclusion, Bitcoin may be considered a hybrid asset as it exhibits both speculative and conservative behaviors. As its volatility decreases over time, BTC could gradually transition from its speculative nature to primarily become a store of value.
BTC is integrating with traditional finance, yet its unique nature renders it independent (Corbet et al. 2018). An eventual international banking crisis might not negatively impact BTC’s price; instead, fear could drive individuals to seek refuge in this decentralized asset. Already in the past, during the European debt crisis and later the Cypriot banking crisis, when the asset was extremely young and unstable, BTC was used as a safe haven asset (Bouri et al. 2017, 2020; Luther and Salter 2017). Today, Bitcoin can represent a decentralized alternative to centralized finance, marking a novelty in the global financial landscape.
However, this work is not without limitations. The banking crisis was quickly absorbed and did not trigger the international contagion initially anticipated. Furthermore, this analysis is based on a single event, constrained by the brief history of BTC.
Overall, this study aims to lay the foundation for genuine academic discussion on BTC’s role within the international economic system, moving beyond rhetoric that often labels it as merely speculative or akin to a Ponzi scheme.
For future research, it would be insightful to include assets such as US Treasuries, the quintessential example of a safe asset. Additionally, further analyses on spillover effects and contagion could form the basis of future studies.3

Author Contributions

D.P.: Conceptualization, Methodology, Software, Validation, Formal Analysis, Investigation, Data Curation, Writing—Original Draft, Writing—Review and Editing, Visualization. I.S.: Conceptualization, Validation, Resources, Writing—Original Draft, Writing—Review and Editing, Project Administration. All authors have read and agreed to the published version of the manuscript.

Funding

This research received no external funding.

Data Availability Statement

Data and code will be made available on request.

Acknowledgments

We would like to thank the Associate Editor and four anonymous reviewers for providing very helpful suggestions which improved and clarified the message of the article.

Conflicts of Interest

All the authors would like to disclose that there is no financial or inappropriate influence (bias) in our work or personal relationships with other people or organizations that could inappropriately influence (bias) our work.

Notes

1
Bitcoin is a cryptocurrency, or digital currency, that operates on a peer-to-peer network.
2
However, it should be noted that Bitcoin was emerging from the so-called crypto winter, and this may have contributed to the impressive growth.
3
The last access of web references was on 13 January 2024.

References

  1. Ahn, Yongkil, and Dongyeon Kim. 2021. Emotional trading in the cryptocurrency market. Finance Research Letters 42: 101912. [Google Scholar] [CrossRef]
  2. Akhtaruzzaman, Md, Sabri Boubaker, and John W. Goodell. 2023. Did the collapse of silicon valley bank catalyze financial contagion? Finance Research Letters 56: 104082. [Google Scholar] [CrossRef]
  3. Almeida, José, and Tiago Cruz Gonçalves. 2023. A systematic literature review of investor behavior in the cryptocurrency markets. Journal of Behavioral and Experimental Finance 37: 100785. [Google Scholar] [CrossRef]
  4. Bhowmik, Roni, and Shouyang Wang. 2020. Stock market volatility and return analysis: A systematic literature review. Entropy 22: 522. [Google Scholar] [CrossRef]
  5. Bollerslev, Tim. 1986. Generalized autoregressive conditional heteroskedasticity. Journal of Econometrics 31: 307–27. [Google Scholar] [CrossRef]
  6. Bouri, Elie, Peter Molnár, Georges Azzi, David Roubaud, and Lars Ivar Hagfors. 2017. On the hedge and safe haven properties of Bitcoin: Is it really more than a diversifier? Finance Research Letters 20: 192–98. [Google Scholar] [CrossRef]
  7. Bouri, Elie, Syed Jawad Hussain Shahzad, David Roubaud, Ladislav Kristoufek, and Brian Lucey. 2020. Bitcoin, gold, and commodities as safe havens for stocks: New insight through wavelet analysis. The Quarterly Review of Economics and Finance 77: 156–64. [Google Scholar] [CrossRef]
  8. Butterfill, James. 2022. Digital Asset Fund Flows Weekly Report. Available online: https://blog.coinshares.com/volume-72-digital-asset-fund-flows-weekly-report-a4ac4ebf0fff (accessed on 13 March 2024).
  9. Böhme, Rainer, Nicolas Christin, Benjamin Edelman, and Tyler Moore. 2015. Bitcoin: Economics, technology, and governance. Journal of Economic Perspectives 29: 213–38. [Google Scholar] [CrossRef]
  10. Cheah, Eng-Tuck, and John Fry. 2015. Speculative bubbles in bitcoin markets? an empirical investigation into the fundamental value of bitcoin. Economics Letters 130: 32–36. [Google Scholar] [CrossRef]
  11. Ciaian, Pavel, Miroslava Rajcaniova, and d’Artis Kancs. 2016. The economics of Bitcoin price formation. Applied Economics 48: 1799–815. [Google Scholar] [CrossRef]
  12. Conlon, Thomas, and Richard McGee. 2020. Safe haven or risky hazard? bitcoin during the covid-19 bear market. Finance Research Letters 35: 101607. [Google Scholar] [CrossRef]
  13. Corbet, Shaen, Charles Larkin, and Brian Lucey. 2020. The contagion effects of the covid-19 pandemic: Evidence from gold and cryptocurrencies. Finance Research Letters 35: 101554. [Google Scholar] [CrossRef]
  14. Corbet, Shaen, Andrew Meegan, Charles Larkin, Brian Lucey, and Larisa Yarovaya. 2018. Exploring the dynamic relationships between cryptocurrencies and other financial assets. Economics Letters 165: 28–34. [Google Scholar] [CrossRef]
  15. Corbet, Shaen, Brian Lucey, Andrew Urquhart, and Larisa Yarovaya. 2019. Cryptocurrencies as a financial asset: A systematic analysis. International Review of Financial Analysis 62: 182–99. [Google Scholar] [CrossRef]
  16. Dyhrberg, Anne Haubo. 2016a. Bitcoin, gold and the dollar—A GARCH volatility analysis. Finance Research Letters 16: 85–92. [Google Scholar] [CrossRef]
  17. Dyhrberg, Anne Haubo. 2016b. Hedging capabilities of bitcoin. Is it the virtual gold? Finance Research Letters 16: 139–44. [Google Scholar] [CrossRef]
  18. Frino, Alex, Steven Lecce, and Reuben Segara. 2011. The impact of trading halts on liquidity and price volatility: Evidence from the australian stock exchange. Pacific-Basin Finance Journal 19: 298–307. [Google Scholar] [CrossRef]
  19. Galati, Luca, and Francesco Capalbo. 2023. Silicon valley bank bankruptcy and stablecoins stability. International Review of Financial Analysis 91: 103001. [Google Scholar] [CrossRef]
  20. Ghalanos, Alexios. 2022. rugarch: Univariate GARCH Models. R Package Version 1.4-9. Available online: https://cran.r-project.org/web/packages/rugarch/index.html (accessed on 13 March 2024).
  21. Gowda, Nandan, and Chandrani Chakravorty. 2021. Comparative study on cryptocurrency transaction and banking transaction. Global Transitions Proceedings 2: 530–34. [Google Scholar] [CrossRef]
  22. Hamilton, James D. 2020. Time Series Analysis. Princeton: Princeton University Press. [Google Scholar]
  23. Hatemi-J, Abdulnasser, Mohamed A. Hajji, Elie Bouri, and Rangan Gupta. 2022. The benefits of diversification between bitcoin, bonds, equities and the us dollar: A matter of portfolio construction. Asia-Pacific Journal of Operational Research 39: 2040024. [Google Scholar] [CrossRef]
  24. Jareño, Francisco, María de la O González, Marta Tolentino, and Karen Sierra. 2020. Bitcoin and gold price returns: A quantile regression and nardl analysis. Resources Policy 67: 101666. [Google Scholar] [CrossRef]
  25. Klein, Tony, Hien Pham Thu, and Thomas Walther. 2018. Bitcoin is not the new gold – a comparison of volatility, correlation, and portfolio performance. International Review of Financial Analysis 59: 105–16. [Google Scholar] [CrossRef]
  26. Luther, William J., and Alexander W. Salter. 2017. Bitcoin and the bailout. The Quarterly Review of Economics and Finance 66: 50–56. [Google Scholar] [CrossRef]
  27. Lynch, David J. 2023. Silicon Valley Bank Failure Raises Fear of Broader Financial Contagion. The Washington Post. Available online: https://www.washingtonpost.com/us-policy/2023/03/10/silicon-valley-bank-failure-financial-industry/ (accessed on 13 March 2024).
  28. Mokni, Khaled, Elie Bouri, Ahdi Noomen Ajmi, and Xuan Vinh Vo. 2021. Does bitcoin hedge categorical economic uncertainty? A quantile analysis. SAGE Open 11: 21582440211016377. [Google Scholar] [CrossRef]
  29. Morrow, Allison, and Matt Egan. 2023. Silicon Valley Bank Collapses after Failing to Raise Capital. Available online: https://edition.cnn.com/2023/03/10/investing/svb-bank/index.html (accessed on 13 March 2024).
  30. Murty, Sarika, Vijay Victor, and Maria Fekete-Farkas. 2022. Is bitcoin a safe haven for indian investors? A garch volatility analysis. Journal of Risk and Financial Management 15: 317. [Google Scholar] [CrossRef]
  31. Nakamoto, Satoshi. 2009. Bitcoin: A Peer-to-Peer Electronic Cash System. Available online: https://bitcoin.org/bitcoin.pdf (accessed on 13 March 2024).
  32. Nathan, Allison, Gabriel Lipton Galbraith, and Jenny Grimberg. 2021. Crypto: A new asset class? In Global Macro Research. New York City: The Goldman Sachs Group Inc. [Google Scholar]
  33. Ndinga, Eliézer. 2023. State of Crypto. 21Share. Available online: https://connect.21shares.com/web3-magazine (accessed on 13 March 2024).
  34. Neureuter, Jack, and Chris Kuiper. 2023. Bitcoin First Revisited. Available online: https://www.fidelitydigitalassets.com/research-and-insights/bitcoin-first-revisited (accessed on 13 March 2024).
  35. Nguyen, Khanh Quoc. 2022. The correlation between the stock market and Bitcoin during COVID-19 and other uncertainty periods. Finance Research Letters 46: 102284. [Google Scholar] [CrossRef]
  36. Pandey, Dharen Kumar, M. Kabir Hassan, Vineeta Kumari, and Rashedul Hasan. 2023. Repercussions of the silicon valley bank collapse on global stock markets. Finance Research Letters 55: 104013. [Google Scholar] [CrossRef]
  37. Phillips, Gavin. 2022. What Will Happen after All 21 Million Bitcoins Are Mined? December. Available online: https://www.makeuseof.com/what-happens-to-Bitcoin-after-all-21-million-coins-are-mined/ (accessed on 13 March 2023).
  38. Pichl, Lukáš, and Taisei Kaizoji. 2017. Volatility analysis of bitcoin price time series. December. Quantitative Finance and Economics 1: 474–85. [Google Scholar] [CrossRef]
  39. Raydan, Rodayna. 2022. Lebanese Turn to Cryptocurrency as Economy Tanks. March. Available online: https://www.al-monitor.com/originals/2022/02/lebanese-turn-cryptocurrency-economy-tanks (accessed on 13 March 2023).
  40. Rudolf, Karl Oton, Samer Ajour El Zein, and Nicola Jackman Lansdowne. 2021. Bitcoin as an investment and hedge alternative. a dcc mgarch model analysis. Risks 9: 154. [Google Scholar] [CrossRef]
  41. Sapuric, Svetlana, Angelika Kokkinaki, and Ifigenia Georgiou. 2022. The relationship between Bitcoin returns, volatility and volume: Asymmetric GARCH modeling. Journal of Enterprise Information Management 35: 1506–521. [Google Scholar] [CrossRef]
  42. Scott, Brett, John Loonam, and Vikas Kumar. 2017. Exploring the rise of blockchain technology: Towards distributed collaborative organizations. Strategic Change 26: 423–28. [Google Scholar] [CrossRef]
  43. Suberg, William. 2023. BTC Price Hits 2-Week Highs after Grayscale and SEC Bitcoin ETF Win. August. Available online: https://cointelegraph.com/news/btc-price-2-week-highs-grayscale-sec-Bitcoin-etf-win (accessed on 13 March 2023).
  44. Taylor, Stephen J. 2008. Modelling Financial Time Series. Singapore: World Scientific. [Google Scholar]
  45. Tsay, Ruey S. 2005. Analysis of Financial Time Series. New York: John Wiley & Sons. [Google Scholar]
  46. Vo, Lai Van, and Huong T. T. Le. 2023. From hero to zero—The case of silicon valley bank. Journal of Economics and Business 127: 106138. [Google Scholar] [CrossRef]
  47. Wang, Gangjin, Yanping Tang, Chi Xie, and Shou Chen. 2019. Is bitcoin a safe haven or a hedging asset? evidence from china. Journal of Management Science and Engineering 4: 173–88. [Google Scholar] [CrossRef]
  48. WGC. 2019. Annual Review. Available online: https://www.gold.org/goldhub/research/2019-annual-review (accessed on 13 March 2023).
  49. World Bank. 2022. COVID-19 Boosted the Adoption of Digital Financial Services. Washington, DC: World Bank. [Google Scholar]
  50. Yermack, David. 2015. Chapter 2—Is bitcoin a real currency? An economic appraisal. In Handbook of Digital Currency. Edited by David Lee Kuo Chuen. San Diego: Academic Press, pp. 31–43. [Google Scholar] [CrossRef]
  51. Young, Martin. 2023. Bitcoin in Nigeria is 60 Percent More Expensive, but There’s a Catch. Available online: https://cointelegraph.com/news/bitcoin-premium-hits-60-in-nigeria-as-it-limits-atm-cash-withdrawals (accessed on 13 March 2023).
  52. Yousaf, Imran, and John W. Goodell. 2023. Responses of us equity market sectors to the silicon valley bank implosion. Finance Research Letters 55: 103934. [Google Scholar] [CrossRef]
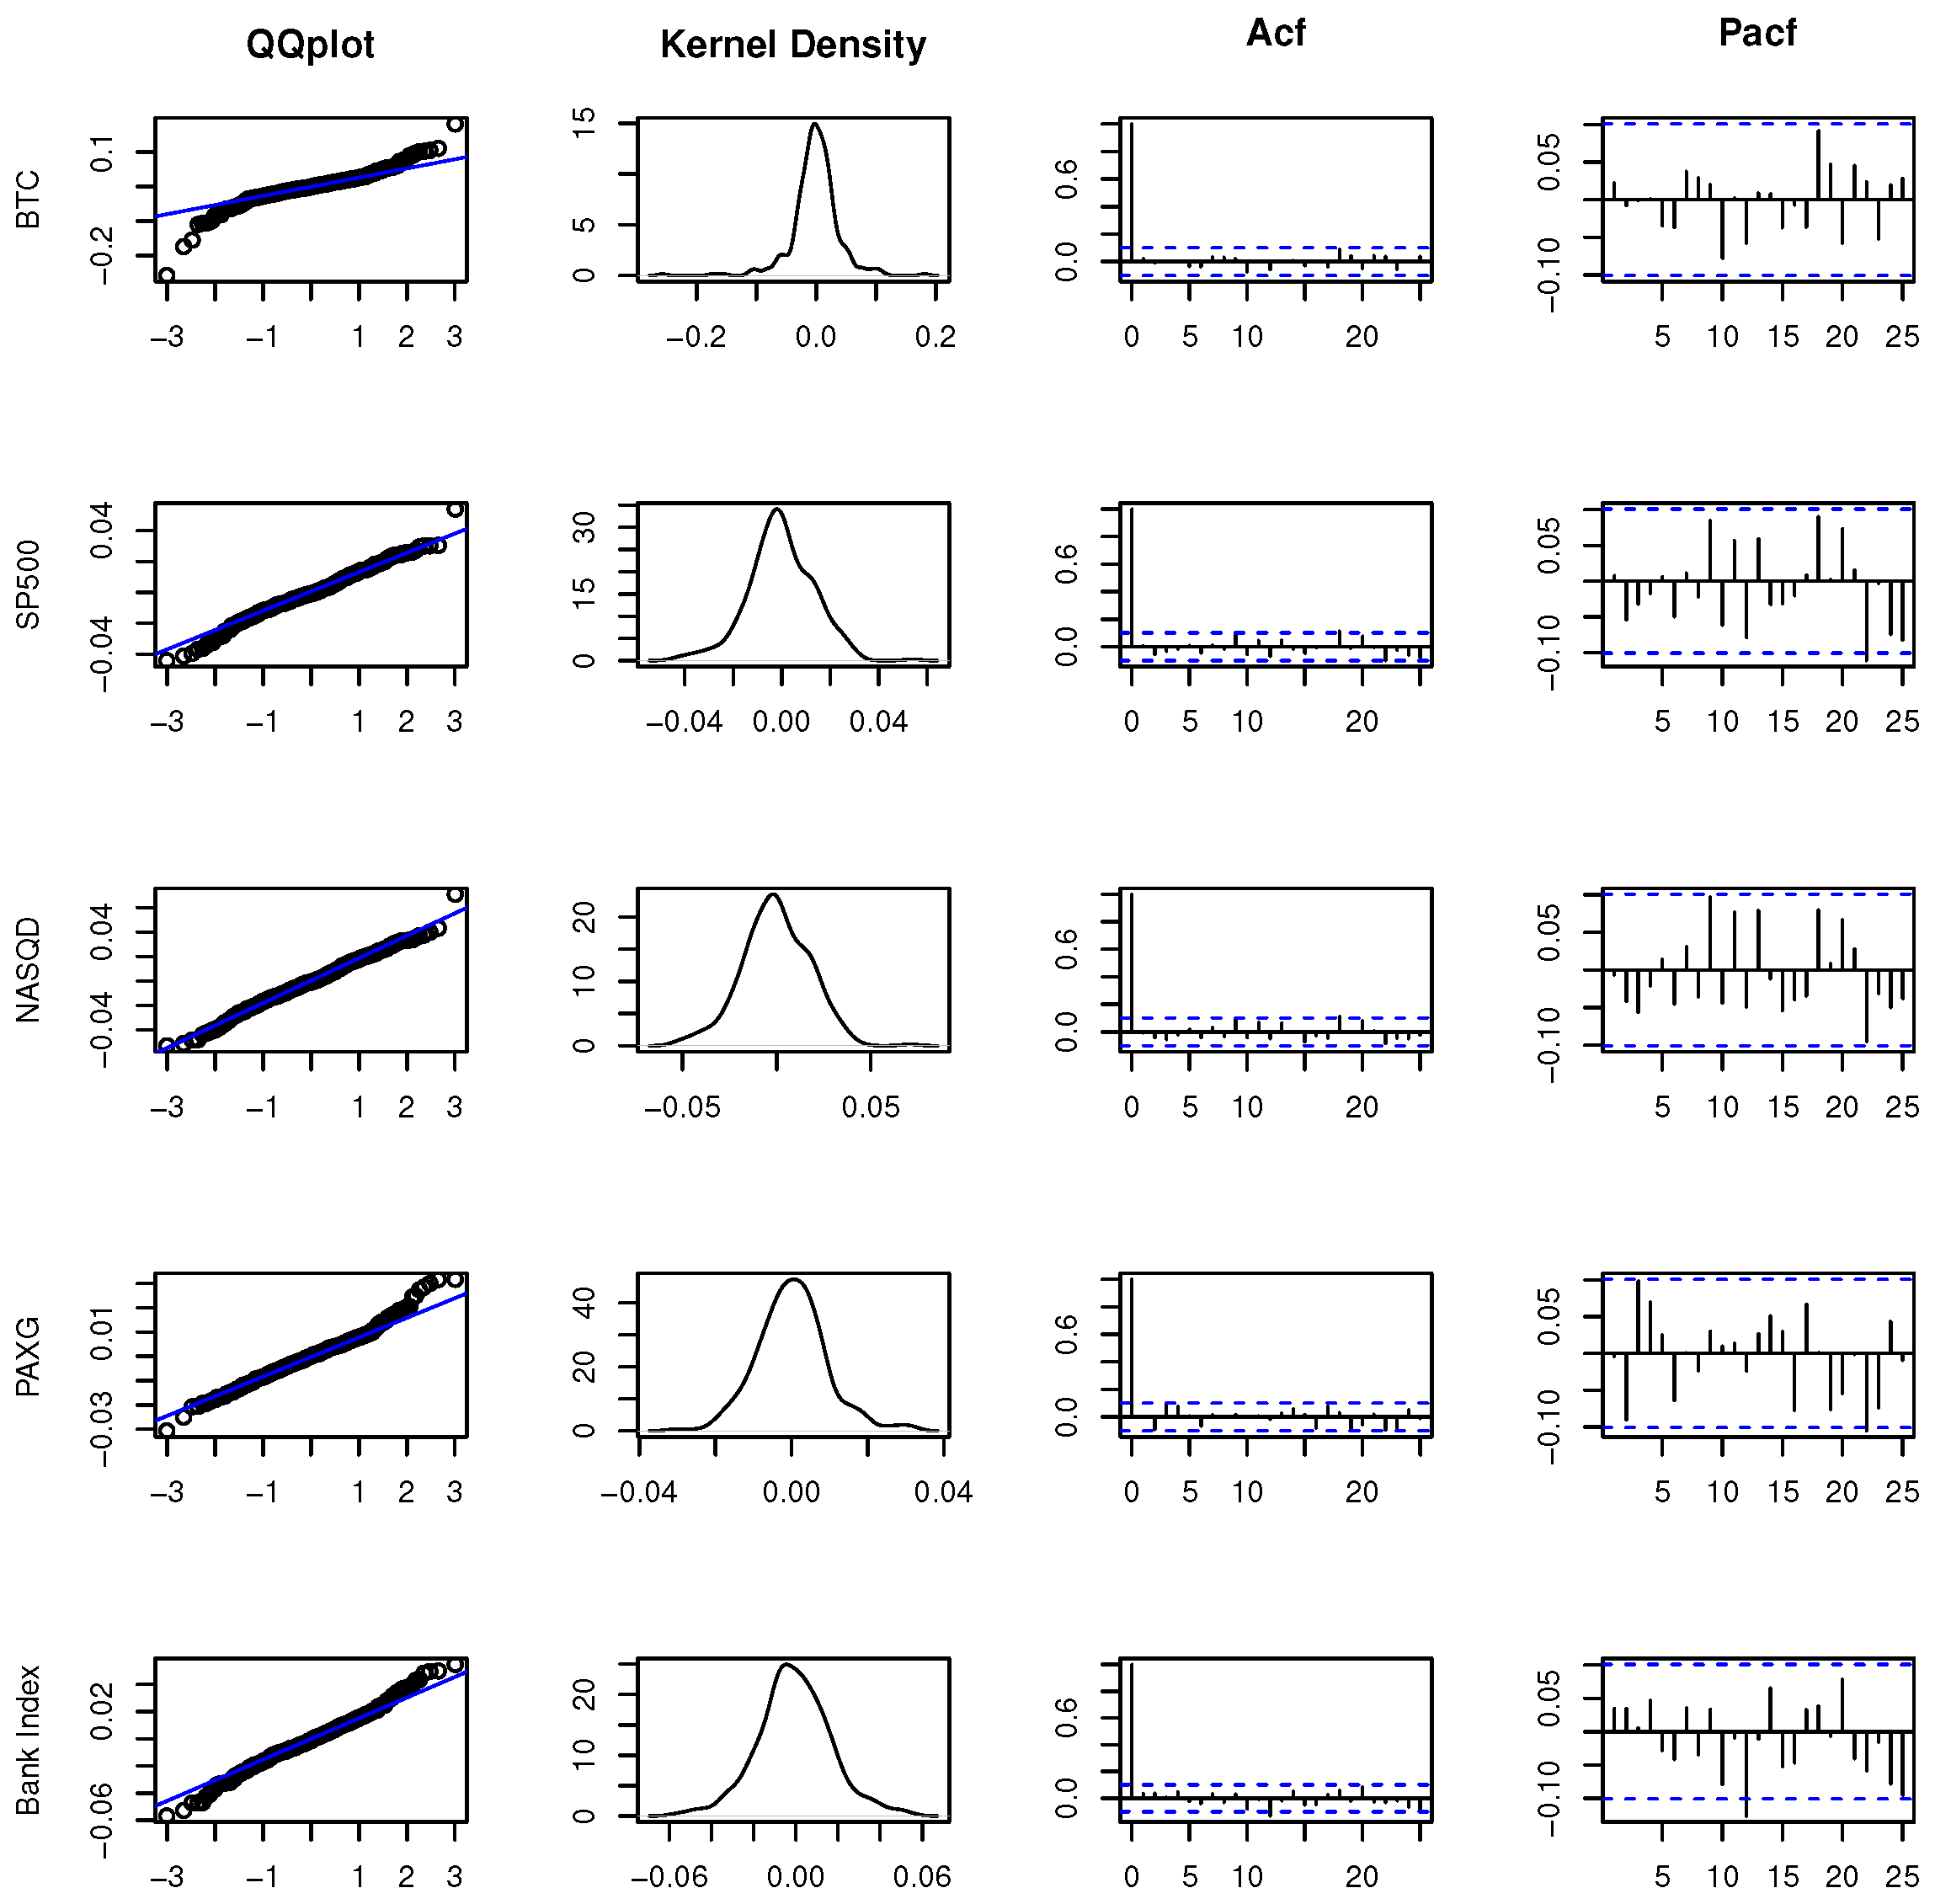
Figure 1. Exploratory analysis on the log returns. In row order, we have: Bitcoin (BTC), S & P 500 (SP500), NASDAQ (NASDAQ), PAXG (PAXG), Bank Index (Bank Index). For each row, there is a QQ plot, a kernel density estimation, an autocorrelation function, and a partial autocorrelation function. The Bank Index is defined in Equation (2).
Jrfm 17 00134 g001
Figure 2. Squared daily log return (proxy of volatility). The Bank Index (Banks) is defined in Equation (2).
Jrfm 17 00134 g002
Figure 3. Comparison of estimated volatility (first column) and adjusted closing price (second column). The dashed line, denoted with (a), indicates the start of the banking crisis. The charts are based on standardized quantities to appreciate the changes in absolute terms.
Jrfm 17 00134 g003
Figure 4. Comparison of standardized prices (top) volatility (middle) and standardized returns (bottom) for BTC (black), SP500 (red), NASDAQ (blue), PAXG (green), and Bank Index (orange) from 1 January 2022 to 9 July 2023. The onset of the banking crisis is marked by a dashed line in both plots, denoted by (a). Volatility is obtained from GARCH model(s).
Jrfm 17 00134 g004aJrfm 17 00134 g004b
Table 1. Combined analysis of summary statistics, stationarity, and heteroschedasticity tests on the log returns of Bitcoin (BTC), S&P 500 (SP500), NASDAQ (NASDAQ), PAX Gold (PAXG), and the Bank Index (Bank Index). The table is structured into three main sections: The upper section displays summary statistics of log returns covering mean, standard deviation (Sd), minimum (Min), maximum (Max), median, mean absolute deviation (MAD), skewness (Skew), kurtosis (Kurt), and the p-value from the Jarque–Bera (JB) test assessing normality. The middle section reports on stationarity, featuring test statistics from the Augmented Dickey–Fuller (ADF) and Phillips–Perron (PP) tests for the log returns. The lower section includes p-values from the Ljung–Box (LB) test for autocorrelation in squared log returns at various lags, and results from Engle’s Autoregressive Conditional Heteroskedasticity (ARCH, also known as Lagrange Multiplier—LM) test, indicating conditional heteroskedasticity within the series. Critical values for the ADF and PP tests, as cited from Hamilton (2020), are set at −3.43 and −3.96, respectively, applicable to tests conducted with and without trend considerations. The definition and calculation of the Bank Index are detailed in Equation (2).
BTCSP500NASDAQPAXGBank Index
Summary Statistics
Mean−0.00−0.00−0.00−0.000.00
Sd0.040.010.020.020.01
Min−0.26−0.04−0.05−0.06−0.03
Max0.180.050.070.050.03
Median−0.00−0.00−0.00−0.000.00
MAD0.030.010.020.020.01
Skew−0.83−0.08−0.040.050.32
Kurt4.57−2.23−2.57−2.34−1.96
JB-test (p-val.)<2.2 × 10−160.0061870.19640.02321<2.2 × 10⁻¹⁶
Stationarity and Heteroschedasticity Tests
ADF— no trend−7.63−5.90−5.98−6.94−5.90
ADF—trend−15.81−13.40−13.60−18.47−12.53
PP—no trend−570.52−304.42−301.49−561.23−301.40
PP—trend−567.99−303.29−299.41−561.28−300.85
LB lag 5 (p-val.)0.0012010.068950.072260.031931.124 × 10−6
LB lag 10 (p-val.)0.013750.0021740.0011531.346 × 10−55.942 × 10⁻⁶
LB lag 15 (p-val.)0.031680.0011837.079 × 10−57.202 × 10−57.597 × 10−5
LB lag 20 (p-val.)0.034380.0009872.234 × 10−50.00020090.0002584
LM test (p-val.)<2.2 × 10⁻¹⁶<2.2 × 10⁻¹⁶<2.2 × 10⁻¹⁶<2.2 × 10⁻¹⁶<2.2 × 10⁻¹⁶
Table 2. GARCH-Type Model used in modeling conditional volatility: GARCH(1,1): In this model, σ 2 represents the conditional variance, α denotes the intercept, β 1 represents the GARCH parameter, and γ 1 is the ARCH parameter. EGARCH(1,1): This model employs log ( σ 2 ) to represent the logarithm of the conditional variance. δ 1 is the coefficient that captures asymmetry in volatility. GJR(1,1): In this variant, δ 1 serves as the coefficient for the interaction term between a t 1 2 and an indicator function I { a t 1 < 0 } , capturing the asymmetric response to shocks. APARCH(1,1): Here, ξ R + represents a Box–Cox transformation of σ t , and δ 1 is the coefficient in the leverage term.
Volatility ModelExpression
GARCH(1,1) σ t 2 = α + β 1 σ t 1 2 + γ 1 a t 1 2
EGARCH(1,1) log ( σ t 2 ) = α + β 1 log ( σ t 1 2 ) + γ 1 a t 1 σ t 1 + δ 1 a t 1 σ t 1 2 π
GJR(1,1) σ t 2 = α + β 1 σ t 1 2 + γ 1 a t 1 2 + δ 1 a t 1 2 I { a t 1 < 0 }
APARCH(1,1) σ t ξ = α + β 1 σ t 1 ξ + γ 1 ( | a t 1 | δ 1 a t 1 ) ξ
Table 3. σ ^ 2 is the estimated variance of the GARCH model(s), m is the number of autoregressive terms, s is the order of the moving average terms, n is the number of observations, T is the number of estimated parameters, and ( θ ) ^ represents the maximum value of the log-likelihood function.
CriterionFormula
AIC 2 log ( ( θ ^ ) ) + 2 m
BIC 2 log ( ( θ ^ ) ) + log ( n ) m
HQIC 2 log ( ( θ ^ ) ) + 2 ( m + s ) log ( log ( n ) ) n
SIC log ( σ ^ 2 ) + 2 m n + s n T
Table 4. List of banks in the banking index defined in Equation (2).
Company NameSymbolAverage Price ($)Shares OutstandingWeight
JPMorgan Chase & Co.JPM127.842,920,000,00024.35%
Bank of America CorporationBAC34.247,970,000,00017.80%
Wells Fargo & Co.WFC43.843,750,000,00010.72%
Morgan StanleyMS85.641,670,000,0009.33%
Goldman Sachs GroupGS328.09332,450,0007.11%
Citigroup Inc.C48.841,950,000,0006.21%
U.S. BancorpUSB43.381,530,000,0004.33%
PNC Financial Services GroupPNC155.46399,680,0004.05%
Truist Financial CorporationTFC44.241,330,000,0003.84%
Capital One Financial CorporationCOF110.81381,810,0002.76%
Discover Financial ServicesDFS104.50253,950,0001.73%
M&T Bank CorporationMTB154.15164,900,0001.66%
Fifth Third BancorpFITB33.81680,720,0001.50%
Regions Financial CorporationRF20.38938,310,0001.25%
Huntington Bancshares Inc.HBAN12.951,440,000,0001.22%
KeyCorpKEY16.94935,260,0001.03%
Ally Financial Inc.ALLY32.57300,820,0000.64%
Zions BancorporationZION48.65148,100,0000.47%
Table 5. Values of AIC, BIC, Shibata, and Hannan−Quinn information criteria, resulting from the estimation of volatility on the log returns of Bitcoin using the rugarch package in R, where A I C = 2 log { ( θ ^ ) } + 2 m , B I C = 2 log { ( θ ^ ) } + log { n } m , S I C = log { σ ^ 2 } + ( 2 m + s ) ( n / T ) , H Q I C = 2 l o g { ( θ ) ^ } + 2 ( m + s ) ( l o g ( l o g ( n ) ) / n ) , σ ^ 2 is the estimated variance of GARCH model, m is the number of autoregressive parts, s is the order of the moving average part, n is the number of observations, T is the number of parameters estimated, and ( θ ) ^ is the maximum value of the log-likelihood function. The estimated models are: Garch, EGARCH, GJR, APARCH, with the following combinations of distributions: Normal ( N ), Generalized Error ( GE ), Generalized Hyperbolic ( GHYP ), and Student’s t ( T ). In bold is the selected configuration for volatility estimation. NA values indicate that the estimation, in that specific configuration, did not reach convergence.
ModelBTCSP500
AICBICSICHQICAICBICSICHQIC
AR(1)−GARCH(1,1) N −2276.18−2254.60−2276.27−2267.75−2210.02−2190.34−2210.15−2202.21
AR(1)−EGARCH(1,1) N −2329.73−2303.84−2329.86−2319.61−2231.14−2207.53−2231.32−2221.77
AR(1)−GJR(1,1) N −2321.24−2295.35−2321.37−2311.13−2219.11−2195.50−2219.29−2209.74
AR(1)−APARCH(1,1) N −2331.35−2301.14−2331.53−2319.55−2218.60−2191.05−2218.85−2207.67
AR(1)−GARCH(1,1) GE −2426.72−2400.83−2426.85−2416.60−2208.70−2185.09−2208.88−2199.33
AR(1)−EGARCH(1,1) GE −2431.67−2401.46−2431.84−2419.87−2228.72−2201.18−2228.97−2217.79
AR(1)−GJR(1,1) GE −2428.63−2398.42−2428.80−2416.83−2217.29−2189.75−2217.55−2206.36
AR(1)−APARCH(1,1) GE −2430.06−2395.54−2430.29−2416.57NANANANA
AR(1)−GARCH(1,1) GHYP −2423.22−2388.70−2423.45−2409.73−2208.70−2185.09−2208.88−2199.33
AR(1)−EGARCH(1,1) GHYP −2427.50−2388.66−2427.79−2412.33−2228.72−2201.18−2228.97−2217.79
AR(1)−GJR(1,1) GHYP −2424.72−2385.88−2425.00−2409.54−2217.29−2189.75−2217.55−2206.36
AR(1)−APARCH(1,1) GHYP −2425.77−2382.62−2426.12−2408.91NANANANA
AR(1)−GARCH(1,1) T −2420.91−2395.02−2421.04−2410.80−2208.39−2184.78−2208.58−2199.02
AR(1)−EGARCH(1,1) T −2422.98−2392.78−2423.16−2411.18−2228.16−2200.61−2228.41−2217.22
AR(1)−GJR(1,1) T −2421.20−2391.00−2421.38−2409.40−2216.27−2184.79−2216.60−2203.78
AR(1)−APARCH(1,1) T −2420.97−2386.45−2421.20−2407.48−2216.27−2184.79−2216.60−2203.78
NASDAQPAXG
AICBICSICHQICAICBICSICHQIC
AR(1)−GARCH(1,1) N −2276.18−2254.60−2276.27−2267.75−2482.81−2463.14−2482.94−2475.00
AR(1)−EGARCH(1,1) N −2329.73−2303.84−2329.86−2319.61−2482.29−2458.68−2482.47−2472.92
AR(1)−GJR(1,1) N −2321.24−2295.35−2321.37−2311.13−2486.15−2462.54−2486.34−2476.78
AR(1)−APARCH(1,1) N −2331.35−2301.14−2331.53−2319.55−2479.42−2451.88−2479.68−2468.49
AR(1)−GARCH(1,1) GE −2420.91−2395.02−2421.04−2410.80−2488.71−2465.10−2488.89−2479.34
AR(1)−EGARCH(1,1) GE −2422.98−2392.78−2423.16−2411.18−2488.18−2460.63−2488.43−2477.25
AR(1)−GJR(1,1) GE −2421.20−2391.00−2421.38−2409.40−2490.98−2463.44−2491.24−2480.05
AR(1)−APARCH(1,1) GE −2420.97−2386.45−2421.20−2407.48−2484.50−2453.02−2484.83−2472.01
AR(1)−GARCH(1,1) GHYP −2426.72−2400.83−2426.85−2416.60−2485.78−2454.31−2486.11−2473.29
AR(1)−EGARCH(1,1) GHYP −2431.67−2401.46−2431.84−2419.87−2485.18−2449.77−2485.60−2471.13
AR(1)−GJR(1,1) GHYP −2428.63−2398.42−2428.80−2416.83−2487.65−2452.24−2488.07−2473.60
AR(1)−APARCH(1,1) GHYP −2430.06−2395.54−2430.29−2416.57−2483.45−2444.10−2483.96−2467.83
AR(1)−GARCH(1,1) T −2423.22−2388.70−2423.45−2409.73−2488.31−2464.70−2488.49−2478.94
AR(1)−EGARCH(1,1) T −2427.50−2388.66−2427.79−2412.33−2487.62−2460.07−2487.87−2476.68
AR(1)−GJR(1,1) T −2424.72−2385.88−2425.00−2409.54−2490.31−2462.76−2490.56−2479.38
AR(1)−APARCH(1,1) T −2425.77−2382.62−2426.12−2408.91−2484.63−2453.15−2484.96−2472.13
Bank Index
AICBICSICHQIC
AR(1)−GARCH(1,1) N −1994.84−1975.16−1994.97−1987.03
AR(1)−EGARCH(1,1) N −2017.60−1993.99−2017.79−2008.23
AR(1)−GJR(1,1) N −2009.09−1985.48−2009.28−1999.72
AR(1)−APARCH(1,1) N −2012.77−1985.22−2013.02−2001.84
AR(1)−GARCH(1,1) GE −1996.93−1973.32−1997.12−1987.56
AR(1)−EGARCH(1,1) GE −2016.73−1989.19−2016.99−2005.80
AR(1)−GJR(1,1) GE −2008.83−1981.28−2009.08−1997.90
AR(1)−APARCH(1,1) GE −2011.94−1980.46−2012.27−1999.45
AR(1)−GARCH(1,1) GHYP −1994.02−1962.54−1994.35−1981.53
AR(1)−EGARCH(1,1) GHYP −2012.52−1977.11−2012.94−1998.47
AR(1)−GJR(1,1) GHYP −2005.34−1969.93−2005.76−1991.29
AR(1)−APARCH(1,1) GHYP −2007.71−1968.36−2008.22−1992.09
AR(1)−GARCH(1,1) T −1996.26−1972.65−1996.44−1986.89
AR(1)−EGARCH(1,1) T −2016.49−1988.94−2016.74−2005.55
AR(1)−GJR(1,1) T −2008.21−1980.67−2008.47−1997.28
AR(1)−APARCH(1,1) T NANANANA
Disclaimer/Publisher’s Note: The statements, opinions and data contained in all publications are solely those of the individual author(s) and contributor(s) and not of MDPI and/or the editor(s). MDPI and/or the editor(s) disclaim responsibility for any injury to people or property resulting from any ideas, methods, instructions or products referred to in the content.