1. Introduction
The preferential regime of the Arctic Zone of the Russian Federation (AZRF) is the latest tool for regulating economic processes in this macroregion and a way to transform its economic space in a targeted manner. The geographical scope of the preferential measures is such that it in fact constitutes the largest special economic zone worldwide (
Volkov 2021). It is designed to augment Russia’s economic presence in the Arctic and shaped by the previously adopted programs and strategies for the development of the AZRF and the country in general (
Skufina et al. 2022).
Despite the keen interest Russian government institutions have paid to the Arctic region in the past decade and the efforts invested to develop it (
Smirnova et al. 2016;
Dmitrieva and Buriy 2022;
Leksin and Porfiriev 2021), most of the territory is still characterized by the negative socio-economic trends that had gained momentum in the 1990s, among which depopulation is the most acute (
Lytkina and Smirnov 2019;
Kumo and Litvinenko 2019;
Fauzer and Smirnov 2020). The fall of the Soviet socio-economic model of using Arctic spaces has led to a mismatch between the pre-existing economic and infrastructural footings for the development of the Russian Arctic, the limited resources of the state for maintaining it, and the new realities of the country’s development in post-Soviet times (
Leksin and Porfiriev 2022). Lately, this mismatch has translated into a critical shortage of the technological and infrastructural base for localizing new competitive industries (
Skufina and Mitroshina 2020) alongside a rising threat of local communities losing stability as the resource base of old industries gets depleted (
Shiklomanov et al. 2020). The urge to bridge these deepening development gaps has triggered a six-years-long search for adequate economic policy tools (2014–2020) (
Volkov et al. 2022).
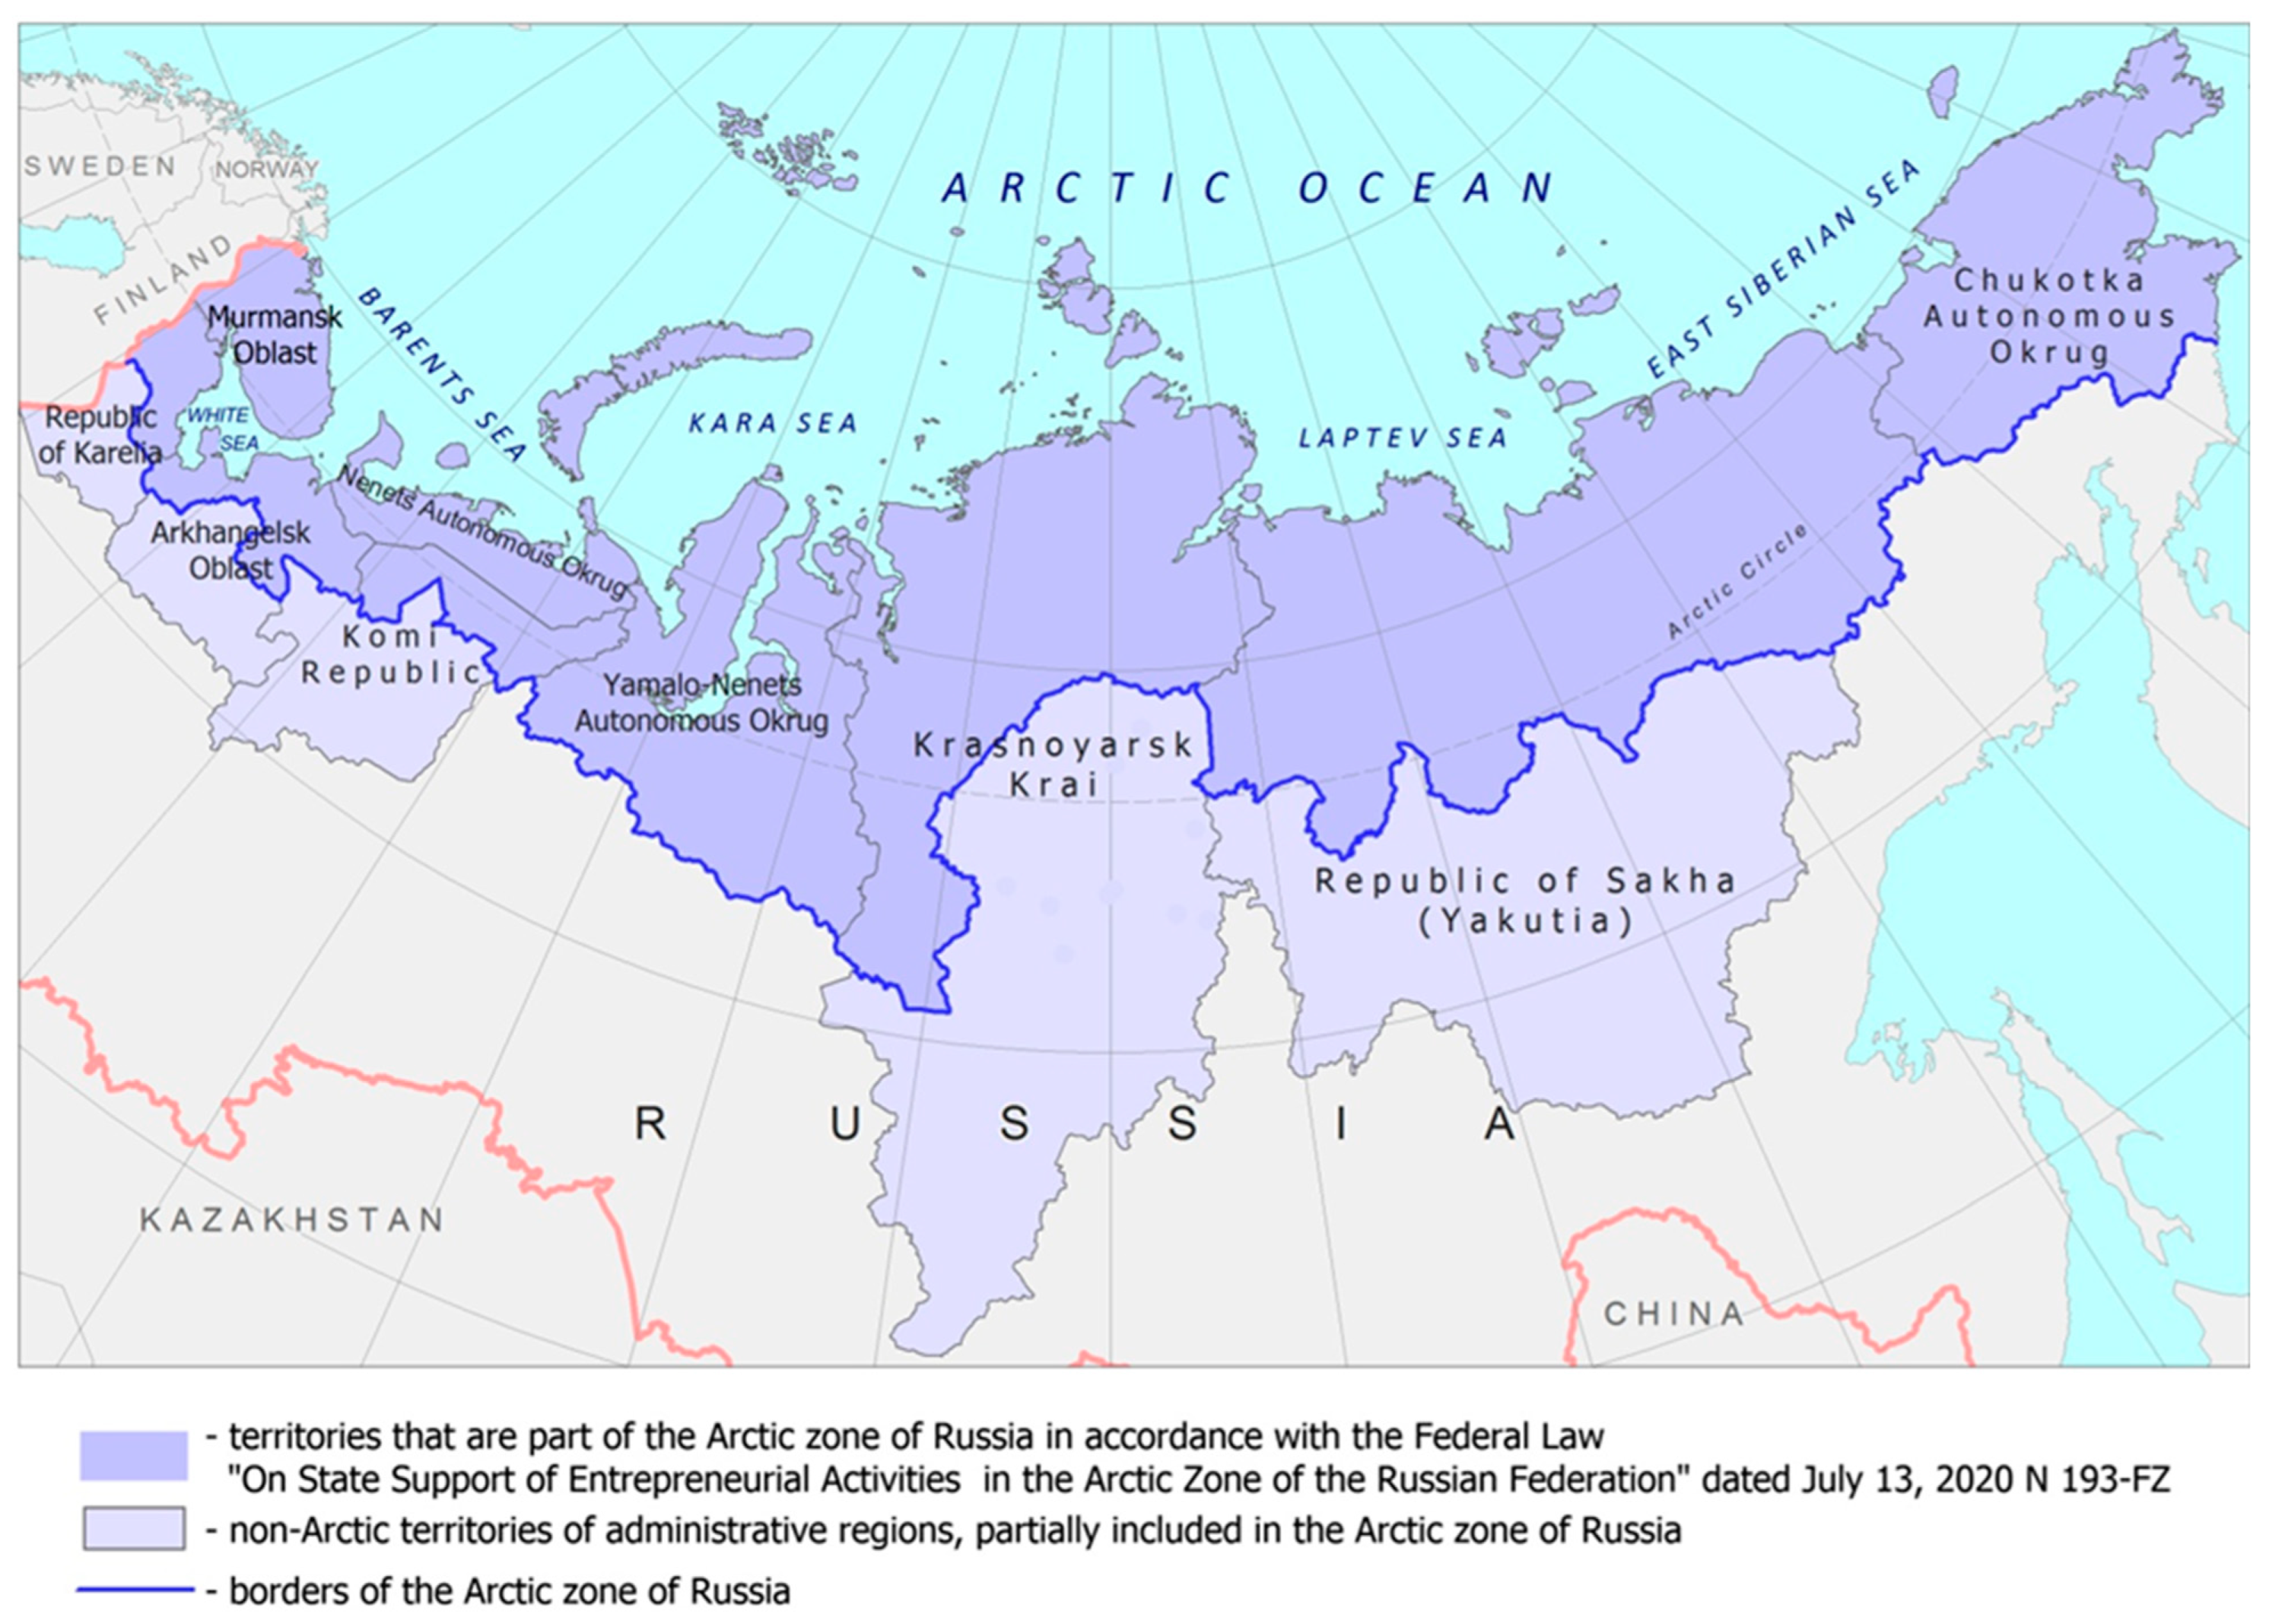
The starting point for the implementation of the preferential regime of the AZRF was July 2020, when its legal foundations were drafted in the Federal Law “On State Support of Entrepreneurial Activities in the Arctic Zone of the Russian Federation” No. 193-FZ, dated 13 July 2020. All companies in the territory of the Russian Arctic that have entered into an agreement and thereby enjoy preferential business terms are given the status of a “resident of the Russian Arctic Zone”, or “AZRF resident”. Furthermore, in accordance with the said Federal Law and for the purpose of its implementation, the boundaries of the Russian Arctic Zone were revised (
Figure 1).
As of 1 July 2023, the AZRF resident status was bestowed on 626 companies, the total planned investment size is 804.7 billion RUR, and the total number of workplaces to be created is 23,828, which is relatively tangible for the extensive but sparsely populated territory of the Russian Arctic. Yet, behind these numbers lying on the surface of reports and the economic agenda, are hidden controversies in the realization of this unique special economic zone. It will be demonstrated below that the history of applying the special economic zone mechanism in the USSR and Russia is richer in cases of a poor set of incentives and fallacious choices of the strategy and tactics of integrating zones with a special business environment into territorial economic structures (
Shvetsov 2018;
Leonov 2020;
Zaytsev 2022). Can these mistakes be avoided when setting up and regulating the development of the Russian Arctic as a preferential-regime territory? Most experts on economic zones with a special business environment agree that the most reasonable timeframe for a first assessment of the performance of preferential regimes is over a three-year period (
Chichkanov and Belyaevskaya-Plotnik 2018;
Farole and Akinci 2011). Over this period, both the direct positive effects of the accumulation of resources from other parts of the economic space as well as the potential negative consequences of resource “impoverishment” of the surrounding territory, which happens fairly often due to management mistakes in planning and setting up special economic zones, will have enough time to unfold. Thus, having collected the bulk of the factual background for our study between July and September 2023, we have reason to believe that our analytical constructs and first conclusions on the performance of the AZRF preferential regime are well-grounded.
This study cannot, for objective reasons, cover the entire spectrum of the effects associated with special economic zones and observed within the scope of the economic space as well as individual economic entities. Its goal is to provide a primary basic analysis of whether the effects of the AZRF preferential regime meet the strategic development objectives of the Russian Arctic, such as:
This listing of regional development priorities agrees with the asserted effects of using special economic zones (SEZs) worldwide (
Farole and Akinci 2011). Achieving these effects, however, cannot be guaranteed in the highly specific conditions of the Arctic, which impose natural and infrastructural constraints on economic activities. In this context, we put forward an assumption which is in line with an optimistic opinion on the effectiveness of the AZRF preferential regime and is based on an initial analysis of information on the progress of its implementation: the emergence of AZRF residents’ projects has helped to stabilize and increase employment in the economies of the regions wholly or partially included in the Russian Arctic Zone through the creation of new high-productivity workplaces. This inference can be operationalized into the following hypothesis:
H0. A regional effect from the implementation of the AZRF preferential regime is a statistically significant change in the relationship between investment and employment trends in economic sectors of Russian Arctic regions.
This article is structured as follows.
Section 2 provides an overview of the concepts underlying the use of preferential regimes and economic space transformation processes, which have provided the theoretical premises for our study. It also outlines the global and Russian experience of using special economic zones. The latter exposes the economic and institutional context in which the preferential regime of the Russian Arctic is realized.
Section 3 contains the basic hypothesis details and the formulation of three additional hypotheses.
Section 4 introduces the technique applied to assess the regional effects of the given preferential regime. The results based on empirical analysis are reported in
Section 5.
Section 6 contains a discussion of the results and their comparison with the findings of other studies with a similar subject and object.
Section 7 presents the key results of the study, evaluates its theoretical contribution and applied significance, points out the current limitations for the study, and drafts the prospects for follow-up.
2. Literature Overview
2.1. Forms of Spatial Organization of the Economy as an Object for Scientific Analysis
Special economic regimes can be regarded as an objective condition for the spatial shaping of national economy structures. The ideas behind the establishment of special conditions for economic specialization, concentration, and cooperation correspond to the theoretical approaches to the spatial organization of economic systems. Friedrich Ratzel, for example, asserted that the state aspires to a spatial uniformity of the development and resource availability of its territories (
Ratzel 1897). This is achieved through a continuous process of recruiting unused territories both inside and outside the country. Johann Heinrich von Thünen posited a location theory of production in which the key factors for the distribution of productive forces are distance and transportation costs (
Thünen 1910). Walter Christaller suggested the central place theory, where he defined cities as economic centers. Spatially, these centers arise in a strict hierarchical sequence (
Christaller and Baskin 1966). The geographical perspectives of the distribution of consumer demand form the conceptual core of Walter Isard’s model (
Isard 1960). Gunnar Myrdal’s model, which substantiated the unevenness of the economic growth of countries and regions, proclaimed a primacy of social and institutional factors (
Myrdal 1958;
Myrdal and Fund 1968).
Other theoretical approaches could be added to this listing, but in the context of our study the most interesting from the perspective of the operation of SEZ mechanisms is the scientific school of unbalanced economic growth; in particular, the “growth poles” theory of Francois Perroux. He proves that economic growth happens around certain poles (
Perroux 1961). An important highlight from Perroux’s scholarly legacy is that one of his studies demonstrates that institutions of state (and this is what preferential economic formats are) are supported exactly by economic actors (
Brisset and Fevre 2020); that is, these growth poles are formed at the national level upon the initiative of national governments in tandem with big business. Perroux termed the realization of this process as “state dirigisme”. He regarded polarization as an inevitability, which in turn shapes the economic space with corresponding centripetal forces (
Leonov 2020;
Ukrainsky 2017). Economic, social, investment, and innovation activity are concentrated in these development centers, and the corresponding economic effects are extended to the surroundings through the development of “propulsive” industries, which are systemically important for the regional economies (
Leonov 2020).
Perroux’s ideas were advanced further by his follower Jacques Boudeville, who more specifically defined economic space types: homogenous, polarized, and planned-growth (
Boudeville 1968). He demonstrated that poorly developed areas are homogenous-type spaces which begin to polarize as they develop. The development rates are predicated on the success of spotting the sectors to specialize in, such as propulsive industries. At present, polarization is often viewed as a socio-economic inequality growth catalyst (
Kühn 2015;
Lange 2015).
The polarized economic space concepts of Perroux and Boudeville were elaborated on by Pierre Pottier (
Pottier 1963), who also distinguished development axes in addition to poles. Development axes not only provide transport connectivity, but also create additional opportunities for their own development. Thus, the poles and the axes connecting them form the framework of the territory’s economic system.
The modern concepts of the spatial organization of economies to be mentioned here are, in particular, those of Paul Krugman (
Krugman 1991) and his colleagues Masahisa Fujita (
Fujita and Krugman 2003) and Anthony Venables (
Fujita et al. 2001). They fall under the new economic geography theory, which, however, is largely underpinned by previous theoretical works on polarization and development axes. A common practice within this approach is to construct abstract economic models to explain spatial development patterns such as the emergence of economic activity centers (urban agglomerations acting in this role), and spatial interactions between production factors and transport costs, which ultimately influence the profit growth rates. Agglomeration effects have also been explored by a team of economists led by Kristian Bahrens, who demonstrated the impacts of spatial frictions on productivity, competition, and workforce migrations (
Behrens et al. 2017). The core of these frictions is the fundamental trade-off between the agglomeration and dispersion effects of economic space formation. In effect, firms and workers choose their locations depending on their transportation/commuting costs, land rents, and access to markets.
Special economic zone mechanisms give rise to economic growth centers, which attract investment, human, and other economic resources from other parts of the economic space. To manage their development efficiently, one must take into account not only the economic specialization, agglomeration, and synergistic effects of the combinability of the industries located therein, but also the infrastructural, innovation, and population distribution contexts of the surrounding economic space. Such economic growth centers can be examined from the perspective of the cluster policy, with the theoretical approaches to its making formulated by Michael Porter (
Porter 2008). Clusters can differ greatly from one another both in terms of geographical scope and structural complexity. However, Porter suggests that the modern economy is viewed through the prism of clusters because it is within a cluster that special conditions for acquiring competitive advantages are formed. The role of governments in supporting a particular sector of the economy and forming clusters mainly consists in “establishing overall rules and incentives”, which also corresponds to the essence of promoting preferential regimes.
2.2. Special Economic Zones in Global Economic Regulation Practices
The special economic and legal regimes applied to a certain economic space are defined as special economic zones. When analyzing the management issues and scholarly writings on this subject, there is some terminological uncertainty in the scientific and practical definition of this concept. It arises, firstly, from the different approaches to the implementation of special economic and legal regimes across countries, and secondly, from a certain degree of inconsistency between scientific research in this area and the administrative and regulatory practices established in the Russian Federation. Based on empirical data, we can conclude that the “special economic zone” is a generic term for a large number of variations of special economic regimes, whose typology is conditioned by the nature of certain scientific and management tasks.
The UN methodology involves 3 basic criteria for SEZs (
UNCTAD 2019):
Geographically delimited areas;
Subject to different economic regulations than other regions within the same country (usually expressed in special customs and fiscal conditions, assurance of property rights, land access, employment, and recruitment support);
Special infrastructural support.
The World Bank (
Buba and Wong 2017), in turn, provides a more detailed checklist of criteria, which has gained wider support among scientists, e.g., Sosnovskikh (
Sosnovskikh 2017):
Geographically limited area;
Single zone management facility or administration;
Fiscal benefits for residents;
Separate customs area with streamlined procedures and duty benefits or duty-free;
Milder economic and legal regulation compared to the rest of the country.
Most researchers and decision-makers rely on a checklist of criteria occupying an intermediate position between the above approaches, differing primarily in the degree of specification and refinement of the above criteria.
As the authors of the references above remark, this is not an exhaustive list and a division into many more SEZ subtypes can be undertaken to meet specific research and management tasks.
The first experience of creating special economic zones (in the sense similar to the modern definition) dates back to 1937, when a small (originally less than 0.4 km
2) special zone for simplified export operations was established on the eastern side of New York’s Harbor. The world’s first SEZ was organized in 1959 in Ireland (Shannon Free Zone). It was the success of this project and its high efficiency as a tool for stimulating territorial development that determined the institutionalization of SEZs as a best practice of economic organization. By 1970, state programs for special economic zone development were launched in many European countries, which took into account current conditions, local specifics, as well as best practices (
Volkov 2021). In the 1970s and 1980s, SEZs spread to the countries of Southeast Asia at a time which overlapped with the period of industrialization of these countries. However, most African countries, as well as post-Soviet countries, were involved in the global trend of SEZ organization after 1990 (
Bost 2016). The main reason for this lag was the existence of their own spatial development tools that did not rely on global trade as a key growth factor. This is especially true for Russia. For example, the USSR economy for a long time practiced the “single national economy complex” concept (
Kolosovskiy 1961). However, this feature is also true for a number of developed countries, such as Japan and France, which also led to a longer period of exploration and greater local specificity of the SEZ mechanism.
Nevertheless, with the development of globalization and the deepening of regional specialization trends, the number of SEZs grew, as they were an accelerator of these processes. By 2019, the number of SEZs increased almost 6.5 times (to the level of 5857 operating and projected SEZs) compared to in 1998. Furthermore, there are 8368 so-called “single-enterprise zones” in 18 countries (
UNCTAD 2019, p. 138). The “single-enterprise zone” regime is the most widespread in South Korea, Colombia, the Dominican Republic, Mexico, and Tanzania. As of 2019, 147 countries apply the SEZ instrument in their policies (
Alexianu et al. 2019). However, there are many country-specific formats of special economic zones that do not fully meet the criteria listed above but have similar objectives and are often combined with canonical SEZs. These include science parks, which are more common in developed countries (the European Union, for example, had over 360 of them as of 2019 (
UNCTAD 2019), poles of competitiveness, which are most widely used in France), etc.
The establishment of SEZs is associated with the traditional directions of common economic policy problem solving:
Attracting foreign capital to be invested in export-oriented industries;
Stabilizing labor market performance (employment opportunities, control of unemployment, etc.);
Designing and testing new mechanisms for developing regional economies;
Dissemination of good practices and cases of SEZ companies making allowances for institutional environment adjustments.
Analysis of the world experience shows that only a relatively small part of special economic zones continue to have a significant effect at the regional level over prolonged time periods. Moreover, these zones often “pull” financial and labor resources over from surrounding areas. The performance of economic zones is tightly linked to the general economic conditions in the respective country and the economic environment, and may vary depending on the object in question. For the purposes of scientific analysis, management, and public administration, researchers distinguish between effects at the country, regional, and local levels, as well as at the company level (
Zaytsev 2022;
Buba and Wong 2017;
Ortega et al. 2015). The experience of successful zones shows that the better overall economic performance of the tenant companies is due both to the favorable tenancy conditions as such and to the effects of agglomeration and selection of business entities within the SEZ (
Li et al. 2021).
Researchers have emphasized the mutual influence of SEZs and the surrounding areas. Proven positive effects of SEZs include the promotion of export volumes and structural diversification (
Asian Development Bank 2015;
Aggarwal et al. 2008), expansion of export geography (
Schminke and Van Biesebroeck 2013), attraction of direct foreign investments (
Wang 2013), upgrading of the professional skills and labor productivity of company employees within the SEZ (
Liu et al. 2021), lowering of the relative environmental load (
Gao et al. 2023), and in some cases also the absolute load (
Liu et al. 2007). The effects of SEZs on employment (
Zheng 2021;
Buba and Wong 2017;
Zeng 2016) and innovation activity in the region of operation are controversial (
Wu et al. 2021;
Liu et al. 2021;
Zaytsev 2022). It has been ascertained, however, that the more intensive are the interactions between SEZ tenants and companies in the surrounding areas, the more noticeably the said parameters grow (
Liu et al. 2021). Researchers have noted a positive impact of SEZs on GDP growth, which, however, is not unconditional (
Seiler et al. 2023). In a paper on the specific features of SEZ realization in developing economies,
Frick and Rodríguez-Pose (
2019) remarked that the positive effects on the surrounding territories depended on the distance to the special economic zone. The greatest positive effects spread in the contact zone of SEZ and decrease with distance from it, becoming insignificant at a distance of 50 km and more (
Frick and Rodríguez-Pose 2019, pp. 86–87). The SEZ’s spillover effects are weaker on the territories with a sparse economic space than on the territories with highly developed economies. These conclusions are corroborated in a study (
Ackah et al. 2023) regarding the wealth and incomes of households in areas surrounding SEZs.
The need to take into account the spatial aspect as an important element of modeling in SEZ organization is noted in a World Bank study (
Buba and Wong 2017). If we consider other significant factors of SEZs contributing to spatial development efficiency, then size (larger zones usually develop faster) and specialization (zones focused on low-tech and labor-intensive sectors of the economy grow faster) stand out. In the first case, the spillovers are provided due to economies of scale, and in the second due to the effect of a low base.
In the current situation, special economic zones have turned into an instrument in the struggle for limited financial, technological, and human resources, which is surging in the modern world. In the case of the most successful and efficient zones, these assets are “pulled over” not from the nearby areas and regions within the national state but from abroad.
2.3. The Experience of Using Special Economic Zone Mechanisms in Russia and the USSR (1990–2023)
Historically in the USSR and then also in Russia, the localization of special economic and legal regimes has given rise to the following typology of zones.
Free economic zones (FEZs) started being established back in the 1990s in the USSR (e.g., FEZ Eva and FEZ Sakhalin in the Far East) and lacked an adequate legislative and substantive basis. Neither was there a Federal Law or a government program to regulate their operation. One of the legislative foundations for the first experiments in creating special economic zones was the RSFSR Law No. 1545-I of 4 July 1991 “On foreign investment in the RSFSR” (
Gasnikova 2018). Some of the reasons for their poor performance were the spatial extensiveness and the high capital intensity of the required infrastructure, the surrounding of the more developed and beneficial SEZs in East and Southeast Asia, and low levels of institutional and legislative support for the SEZ mechanism (
Leonov 2020).
“Special economic zones” (“SEZs”) were established as a zone type in 2005 under the Federal Law No. 116-FZ of 22 July 2005 “On special economic zones in the Russian Federation”. According to the current legislation, “SEZs” can be of four types: industrial-production (IPT), technological-innovation (TIT), port (PT), and tourism & recreation (TRT). “SEZ” is still valid as a format of special economic zone but its performance ratings vary (
Zaytsev 2020;
Leonov 2020). The leaders among “SEZs” are Alabuga (Republic of Tatarstan), Saint Petersburg (St. Petersburg City), Lipetsk (Lipetsk Oblast), Technopolis (Moscow), and Dubna (Moscow Oblast), which by the end of 2022 collectively contributed 77.2% to the total revenue of all “SEZs”. All the five most successful zones are of the industrial-production or technological-innovation types. The lowest absolute performance indicators are demonstrated by “SEZs” of the tourism & recreation type
1.
Applying the acronym “SEZ” to denote this particular Russian format of special economic zones, one should seek to avoid terminological confusion since the wider category of special economic zones (SEZs—without quotation marks) has the same acronym and a fixed meaning in global scientific and management practices.
Territorial development zones (TDZs) were legislatively established as a format of special economic zones in 2011
2. Researchers note that the support measures in zones of this type proved to be far less attractive for tenants and investors, rendering this zone format unviable in Russia (
Leonov 2020).
Priority socio-economic development areas (PDAs, also known as territories of advanced development, TADs) were legislatively formalized in 2014
3. The specific features of the regime are detailed elsewhere (
Leonov 2020;
Chichkanov and Belyaevskaya-Plotnik 2018;
Gasnikova 2018). A total of 115 PDAs were established by the end of 2022, 91 of them in monotowns (including 5 monotowns that simultaneously have the status of a closed administrative–territorial entity (CATE)) and 3 PDAs in CATEs. The number of residents totaled over 1100, more than 80,000 workplaces were created, and over 250 billion RUR was attracted in investments. The residents’ revenues amounted to over 760 billion RUR
4.
The Vladivostok Free Port (VFP) format is a development of the PDA format
5 designed in time for the opening of the Eastern Economic Forum in Vladivostok in 2015. As noted by Leonov (
Leonov 2020), the VFP currently provides its residents a more favorable economic and legal regime, first of all in dealing with land issues (land allocation without a tendering procedure) and in requiring no special obligations for the use of land lots. Apart from the simplified land-related formalities, which are classified as an administrative preference, residents get some fiscal benefits. These include zero profit tax in the first five years and zero land tax in the first three years of operation, social security taxes reduced from 30.2% to 7.6% for 10 years after receiving resident status, and other support measures. The VFP territory encompasses all major harbors in the Far East, has attracted investments from over 10 foreign countries, and has generated over 100,000 new workplaces as of 2023
6. Investors are attracted not only by the preferential regime but also by the fact that the VFP infrastructure is integrated into such a strategic transportation thoroughfare as the Northern Sea Route.
Special administrative districts (SADs) were established on Is. Russky (Primorsky Krai) and Is. Oktyabrsky (Kaliningrad Oblast)
7.
The entities eligible as residents of these special economic zones are international companies (companies registered in Russia under the redomiciliation procedure and operating in several countries including Russia)
8.
As noted by Matykov and Krivelevich (
Matykov and Krivelevich 2020), the law was promptly passed for Russian businessmen and companies registered in foreign jurisdictions and aimed at legislative support and reducing the risks caused by sanctions. After a relatively slow development in the first phase in 2018–2021, the tangible stepping up of sanctions pressure gave a new impetus to the SAD regime
9. By the end of 2022, 125 companies were registered as SAD resident.
The preferential regime for the Arctic Zone of the Russian Federation has operated since 2020. This is the latest among major special economic regimes established in Russia. The preferences provided under this regime are multi-tiered, corresponding to the structure of the tax and budget systems of the Russian Federation (federal, regional, and municipal levels). Each government level is free to set the rates for the taxes collected at that level. The minimum required amount of capital investments within an investment project is one million RUR. The fiscal benefits available to AZRF residents under the preferential regime are shown in
Table 2.
In addition, backing up the strategic priorities in the development of the Russian Arctic macroregion, support measures matching the basic preferential measures of the AZRF special economic regime were introduced. In particular, there is a provision for federal subsidies to the development of the infrastructure required for the implementation of some projects prioritized in the respective area. This measure was instated by the Russian Federation Government Decree No. 297 of 18 March 2020 “On endorsing the Rules of selecting investment projects to be implemented in the Arctic Zone of the Russian Federation”. There are a number of other regulatory acts to ensure the comprehensiveness and wholeness of the preferential regime. The specific features of the AZRF preferential regime are discussed in more detail in our previous paper (
Volkov et al. 2022).
Among the studies dealing with various aspects of the AZRF preferential regime, we can highlight those by Kotov (
Kotov 2022a,
2022b), Volkov (
Volkov 2021;
Volkov and Tishkov 2022), Antsiferova (
Antsiferova and Vasilieva 2021), and Koshkin (
Koshkin 2020). They primarily focus on analyzing how well this instrument meets the strategic development goals for the Arctic macroregion and provide some preliminary assessments of the trends and performance indicators of the preferential regime in the Russian Arctic Zone. Admittedly, its presentation in the scientific literature is rather limited because previous estimates of its performance were premature. As of now, critical changes in socio-economic and political context (intensification of sanctions pressure and narrowing of the investment, technological, and technical opportunities for implementing investment projects) make well-grounded assessment of the AZRF preferential regime more actual. The mission of this study is to fill the gap in scientific knowledge on this subject.
3. Hypothesis Development
Based on the generalization of the presented experience of SEZ implementation in the world and the specifics of their application in Russia, the H0 hypothesis put forward earlier appears legitimate and can be detailed due to assumptions about the nature of the relationship between employment and investment parameters for certain sectors. These assumptions can be operationalized within the framework of additional hypotheses.
The positive impact of SEZs on the development of professional skills and labor productivity of employees of SEZ-resident companies has been proven (
Liu et al. 2021). The transformation processes taking place in Russian Arctic regional economies in connection with the depletion of resources in old deposits and technological shifts in the economy are objectively quite strong, and administrative resources are not always sufficient for adequate redistribution of manpower and retaining the population. In this context, application of the AZRF preferential regime is designed to promote a diversification of the economies of the Arctic regions and the building of companies of a new technological mode. The Arctic specifics associated with existing restrictions on the labor market also imply a corresponding limitation of the employment growth effects in sectors, combined, however, with a more active introduction of technologies that increase labor productivity. The latter is due to objective difficulties and increased costs of attracting labor to the Arctic regions of Russia from the outside (within the historical framework of Russia the key pattern of the Arctic development model was placed on attracting permanent inhabitants rather than shift work). Based on the views of Francois Perroux and his followers, according to which the corresponding economic effects are spread through the development of “propulsive” sectors that are of system-forming importance for regional economies (
Leonov 2020), the position is that the preferential regime was created primarily to influence propulsive sectors. Thus, the concentration of labor productivity growth will be observed in the propulsive sectors, which are the main channels of transformational and diversification changes of the regional economy. Based on this we can put forward the auxiliary hypothesis:
H1. Within the propulsive industry sectors, the relation between investment and employment follows an inverted U.
In contrast to this, we assume the absence of corresponding effects, or their unexpressed in the sectors that are not propulsive:
H2. Unlike other sectors of the economy in the life-supporting but non-propulsive sectors (electric power, gas, steam generation, water supply, and sewerage), employment is indifferent to the dynamics of investments under preferential treatment conditions.
The SEZ mechanism considered within the unbalanced economic growth scientific school framework, in particular the theory of “poles of growth” by Francois Perroux in combination with the views of Paul Krugman (
Krugman 1991) and on the decisive role of relative competitive advantages due to spatial interactions of production factors with transport costs, allows us to formulate a hypothesis for the sectors of traditional specialization of the Russian Arctic regions, which are associated with mining. Buonocore et al. separately emphasizes the importance of the transport connectiveness of territories both for successful development of the SEZ and for the positive effects in the region of its location (
Buonocore et al. 2023) The World Bank study emphasizes that most of the preferential measures themselves, such as simplification of company registration and other property rights, tax benefits, and expanded powers of SEZ regulators, do not have an independent significance in isolation from aspects of transport infrastructure (
Buba and Wong 2017).
Transport infrastructure plays a special role for remote and specific Arctic territories. We can assume that the dependence on infrastructure development level will be even more apparent due to the special remoteness from sales markets and the increased share of transportation and storage costs in the overall structure of production costs. In accordance with this, the following auxiliary hypothesis has been put forward:
H3. Within geographical regions with poorly developed transport infrastructure, the association between employment and investment is stronger in the mining sector than in other sectors.
4. Methodology
The available figures on the number of residents, planned and actual investment size, and new workplaces give reason to expect some effects for the regional economies, but they do not objectively take into account the possible negative countervailing effects associated with the redistribution of resources within the economic space of the Arctic regions. This is why in this paper we compare the performance indicators of the AZRF preferential regime with a number of indicators and parameters reflecting the processes in the Russian Arctic regional economies over the period 2017–2022.
The methodological approach was based on applying regression analysis methods to spot reliable correlations between the factor variable of investments in fixed capital and the resulting variable of employment in organizations by sectors of Russian Arctic regions’ economies. The input data were open statistical information from public sources (Unified Interdepartmental Information and Statistical System; Federal State Statistics Service; Far East and Arctic Development Corporation) and materials provided by the Ministry of the Russian Federation for the Development of the Far East and Arctic upon the authors’ request.
As the first step, statistical analysis methods were applied to identify the general trends in AZRF preferential regime performance: data series were plotted and parameter trends were estimated for the number of AZRF residents, planned and implemented investments, and planned and actually created workplaces—both overall and by regions and sectors.
The key task for the second phase was to detect and prove the form of the relationship between investments and employment size in sectors of the Russian Arctic regions’ economies. The methods were chosen proceeding from the need to analyze dynamical parameters on the one side and to assess the transformational changes in the correlations between the investment and employment parameters in the regions on the other side. We started by testing the inferences of linear, quadratic, and logarithmic forms of the relationship (see Formulas (1)–(3)):
The formulas represent the employment size in the sector i of the region j (Yij) and investments for the sector i in the region j in different forms: incremental (ΔIij) and cumulative (Iij).
The sectors to be analyzed in AZRF regions were selected with regard to region-specific features: both the pre-existing structure of investments and employment and the projects planned and implemented under the AZRF preferential regime. It should be noted that AZRF regions vary substantially both in terms of the array of significant industries and in the technological paradigm and labor productivity levels. Thus, extractive industries typically have high investment levels simultaneously with relatively low employment levels (
Nizhegorodtsev et al. 2022). The education and healthcare sectors, contrariwise, cannot boast high investment levels; their activities are instead a measure of the “presence” of the state and its responsibility for the standard and quality of living in these remote areas, wherefore these sectors are among the leaders in employment shares in all AZRF regions. Consequently, favoring any one parameter (the sector’s share in the region’s total investment size or the number of employees) as the qualifier for selecting the activities significant for the region would, in our opinion, excessively narrow the range of interrelationships important for the analysis. Keeping this mind, we selected the sectors having:
the highest share in investment size region-wise;
the highest share in the number of employees region-wise;
the highest share in the number of AZRF residents.
Thus, 7–9 main sectors were selected for each region.
The toolkit for a preliminary determination of the form of the relationship included a graphical method and the Advanced Grapher 2.2 software. In particular, these methods were used to identify and flag for subsequent analysis the value outliers that could occur in some years. To this end, we introduced a binary dummy variable (D), which fixed the parameter level in the given period, assigning the value 1 if the values deviated from the prevalent data trend in the given year, and 0 if the values fit within the general trend. The year-specific time effects that proved insignificant at the regression construction phase were estimated in a similar manner.
The ultimate determination of the form of the relationship was accomplished through regression analysis using the least squares method, since all the specifications under consideration were linearizable formulas. The correlation between the parameters was deemed proven if all the estimated indexes were significant at a computational error probability below 5% (p-value ≤ 0.05), as estimated by the Student’s t-statistic and explanatory power level (R2 ≥ 50%). To map the relationships between the parameters correctly, we considered data in their incremental and cumulative forms, as well as the values of the parameters in each specific time period (quarter of the year). To assess the effects produced by the AZRF preferential regime on the Russian Arctic regional economies, the analysis was run for three data sets covering the following time intervals:
2017–2019—the period preceding the start of AZRF preferential regime application;
2020–2022—the period from the launching of the preferential regime until present;
2017–2022—the complete time interval covering both of the above-stated periods: Before and after the introduction of preferential measures. The reason to consider this was that we needed to verify the hypothesis about the AZRF preferential regime having a significant effect on economic sectors in the regions.
The next step was to estimate the coefficients of the equation for the relationship between investments and employment in each of the selected sectors (i) in each region (j) under the specifications (1)–(3) using data for the three time intervals. In each case, preference was given to the model with the highest explanatory power (the highest R2 among all significant models).
The final stage was a cointegration matrix construction. The basis for the cointegration matrix was to consider two aspects of changes in the dynamics of employment in sectors of the Russian Arctic regions: (1) the dynamics of employment in absolute terms in 2017–2022, having three states: the decrease in stabilization and growth of employment; (2) the dynamics of the relationship between the parameters of employment and investment, which were identified at the previous stage of the regression model evaluation. Here, 5 states were marked: constancy in the relationship; change in the relationship; conservation of the relationship, accompanied by a weakening of the current trend (slowing of the trend); conservation of the relationship, accompanied by an intensification of the current trend (acceleration of the trend); lack of relationship.
For each sector studied, both aspects were determined (the first on the basis of real statistical data, the second on the basis of model evaluates obtained), which made it possible to compile the sectors in the cointegration matrix.
Statistical data from public sources were used as the input. Employment was estimated using real-time statistical data on AZRF regions—“Average employee headcount (excluding external part-timers) in organizations not classified as small business entities”—as the number of persons
10, given on a monthly basis with a breakdown into the main sections of the Russian National Classifier of Economic Activities (RNCEA). They were processed into quarterly employment data. The source of the data on investment size was the indicator “Fixed capital investments of large and medium organization and organizations with over 15 employees that are not classified as small business entities (with a division into types of economic activity)”, given in millions of RUR
11. This indicator is given in the form of the cumulative total broken down on a quarterly basis. Using the reverse calculation method, we obtained the values for investments made in each specific calendar quarter, thus generating the data set for further calculations.
To validate the representativeness of the real-time data (UIISS
12), additional comparisons were made with the annual values of the corresponding indicators provided by other sources (FSSS
13). The deviation for most of the sectors was within 3–5%, reaching 10% in some cases, from which we conclude that real-time data quite accurately represent the real processes within the regional economies and can be used for analysis and forecasting purposes.
To ensure comparability of the monetary measure, a deflating procedure was performed using the indicator “Price indexes for investment-intended products (expenditures, services)”, given as a percentage
14. Monetary indicator values were converted to a comparable form from the current prices to the prices of the 1st quarter of 2017.
A prerequisite for understanding the spatial context in which the AZRF preferential regime operates is the study of the trends and conditions for the functioning of key sectors in the administrative regions at large. This was the primary reason for us to consider data on the regions fully or partially included in the Russian Arctic Zone. There is no doubt that for the regions entirely falling under the AZRF preferential regime (Murmansk Oblast, Nenets Autonomous Okrug, Yamalo–Nenets Autonomous Okrug, Chukotka Autonomous Okrug) its effects, as reflected in official statistical files, will be more obvious. The same applies to the regions that have most of their territory, economic potential, and population situated within the Russian Arctic Zone (Arkhangelsk Oblast, Republic of Sakha (Yakutia)). For the rest of the regions, in which only a small part of the territory and the economic potential are located within the Russian Arctic (Republic of Karelia, Komi Republic, Krasnoyarsk Krai), the effects will be the most pronounced only within their Arctic municipalities. Another significant factor is the greater comprehensiveness of the regional-level official statistics compared to municipal-level statistics.
5. Results
5.1. Current Trends in the Implementation of the Preferential Regime of the Russian Arctic
As of 1 July 2023, the number of AZRF residents was 626, the total planned investment size was 804.7 billion RUR, and the number of workplaces planned to be created was 23,828. The actual amounts are far more modest: 96.9 billion RUR was invested, and 7378 new workplaces were created over three years. The ratio between these parameters is shown in
Appendix A. The plot starts on 1 January 2022 since there was no noticeable change in the parameters before that time.
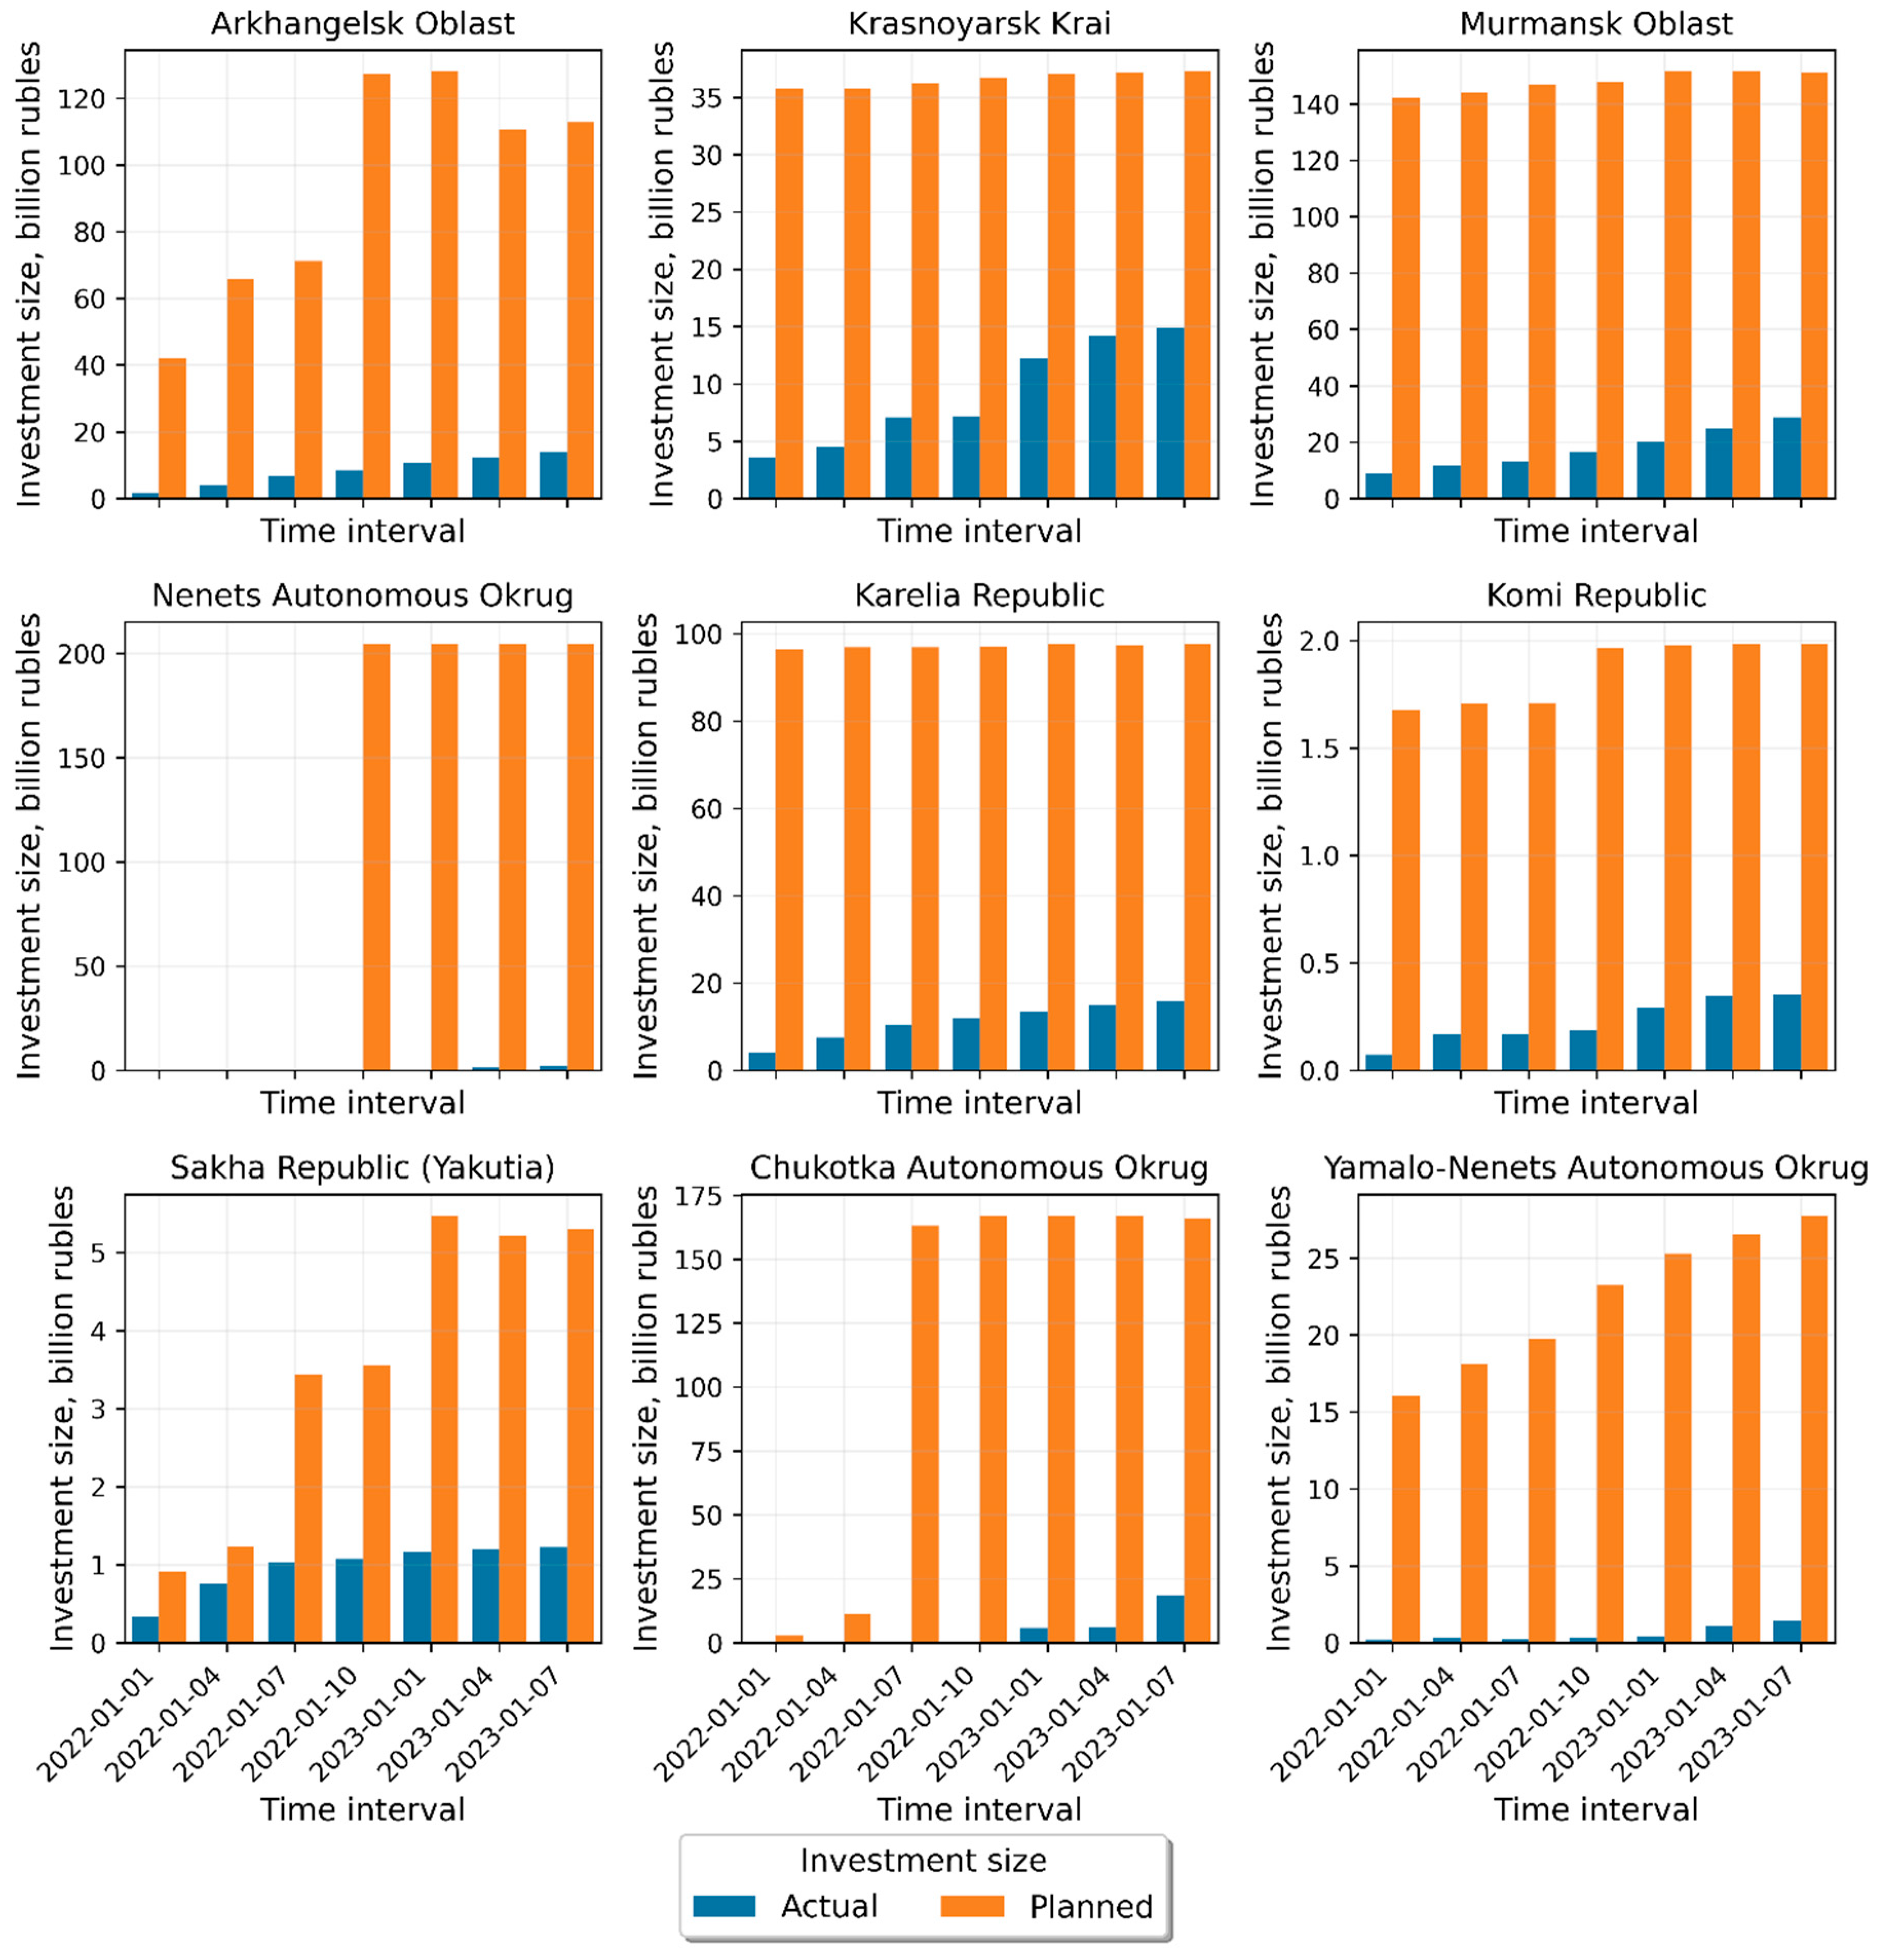
However, the trends in the ratio of real investment size and new workplaces varied across regions of the Russian Arctic on a time horizon of the last year and a half (
Figure 2). The leaders in terms of the investment size actually made are the Murmansk Oblast, Arkhangelsk Oblast, Chukotka Autonomous Okrug (CAO), and Republic of Karelia. The greatest number of workplaces was created in the Arkhangelsk Oblast (2445) and Murmansk Oblast (2150), followed after a significant gap by the CAO (1001 workplaces), Republic of Karelia (630), and Yamalo–Nenets Autonomous Okrug (YNAO) (619). Some regions show a stabilization or even some decline of the parameters starting in the spring of 2023 (Republic of Sakha (Yakutia) and Krasnoyarsk Krai). In the majority of other regions, however, the trends for investments actually made and new workplaces created have been positive (
Figure 2).
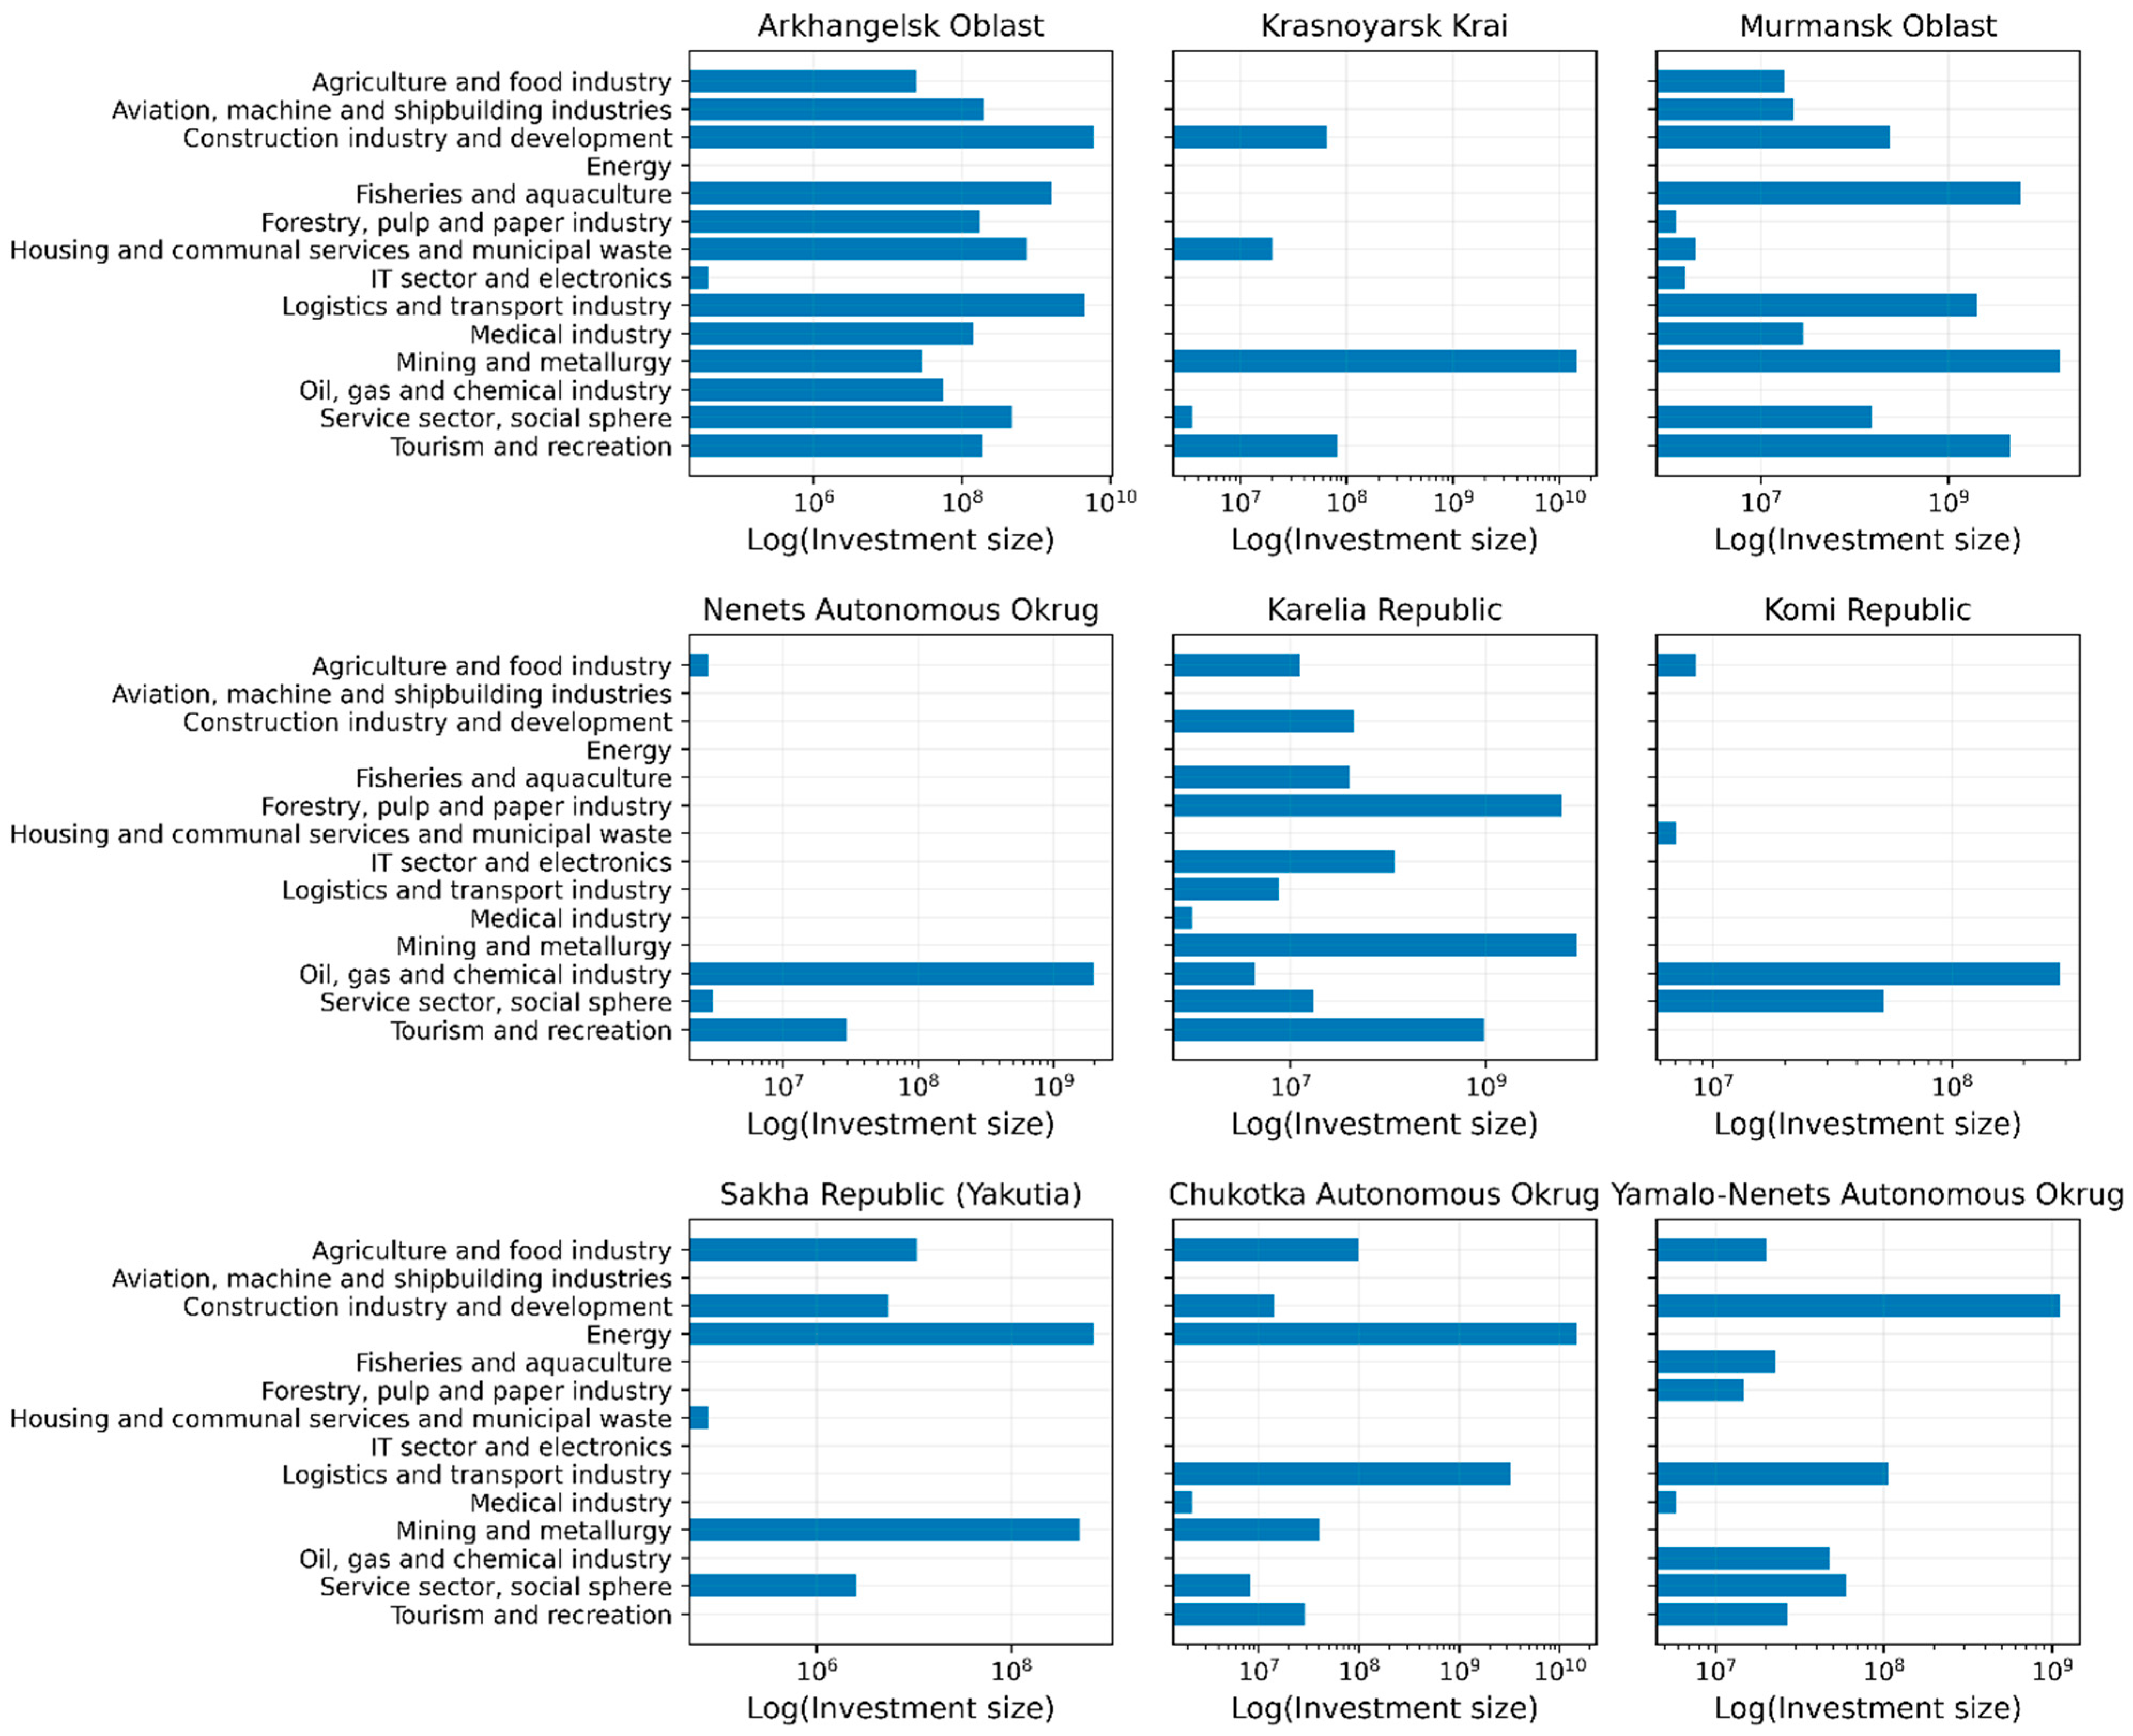
The ratio between investment size and the number of new workplaces created varies among regions. For example, the number of workplaces created per RUR 1 billion in investments in YNAO is 434, whereas in Karelia the same amount of investments generated only 40 new workplaces. These differences are predicated on the sectoral profile of the projects implemented by AZRF residents. In some of the regions, they match the region’s economic specializations—the mining, pulp-and-paper, and energy sectors, which are characterized by high capital intensity and relatively high labor productivity (Krasnoyarsk Krai, CAO). The residents’ projects and investments in some regions are mostly implemented in the spheres of secondary and subsidiary specialization—services and construction (YNAO), while in others they are represented by economic activities of primary, secondary, as well as subsidiary specialization—mining, fisheries and aquaculture, commerce, and construction (Arkhangelsk Oblast, Murmansk Oblast, Republic of Karelia). The distribution of actual investment size in specific Arctic regions among 14 enlarged types of economic activities
15 is shown in
Figure 3 (a logarithmic scale portraying values of different orders of magnitude is used).
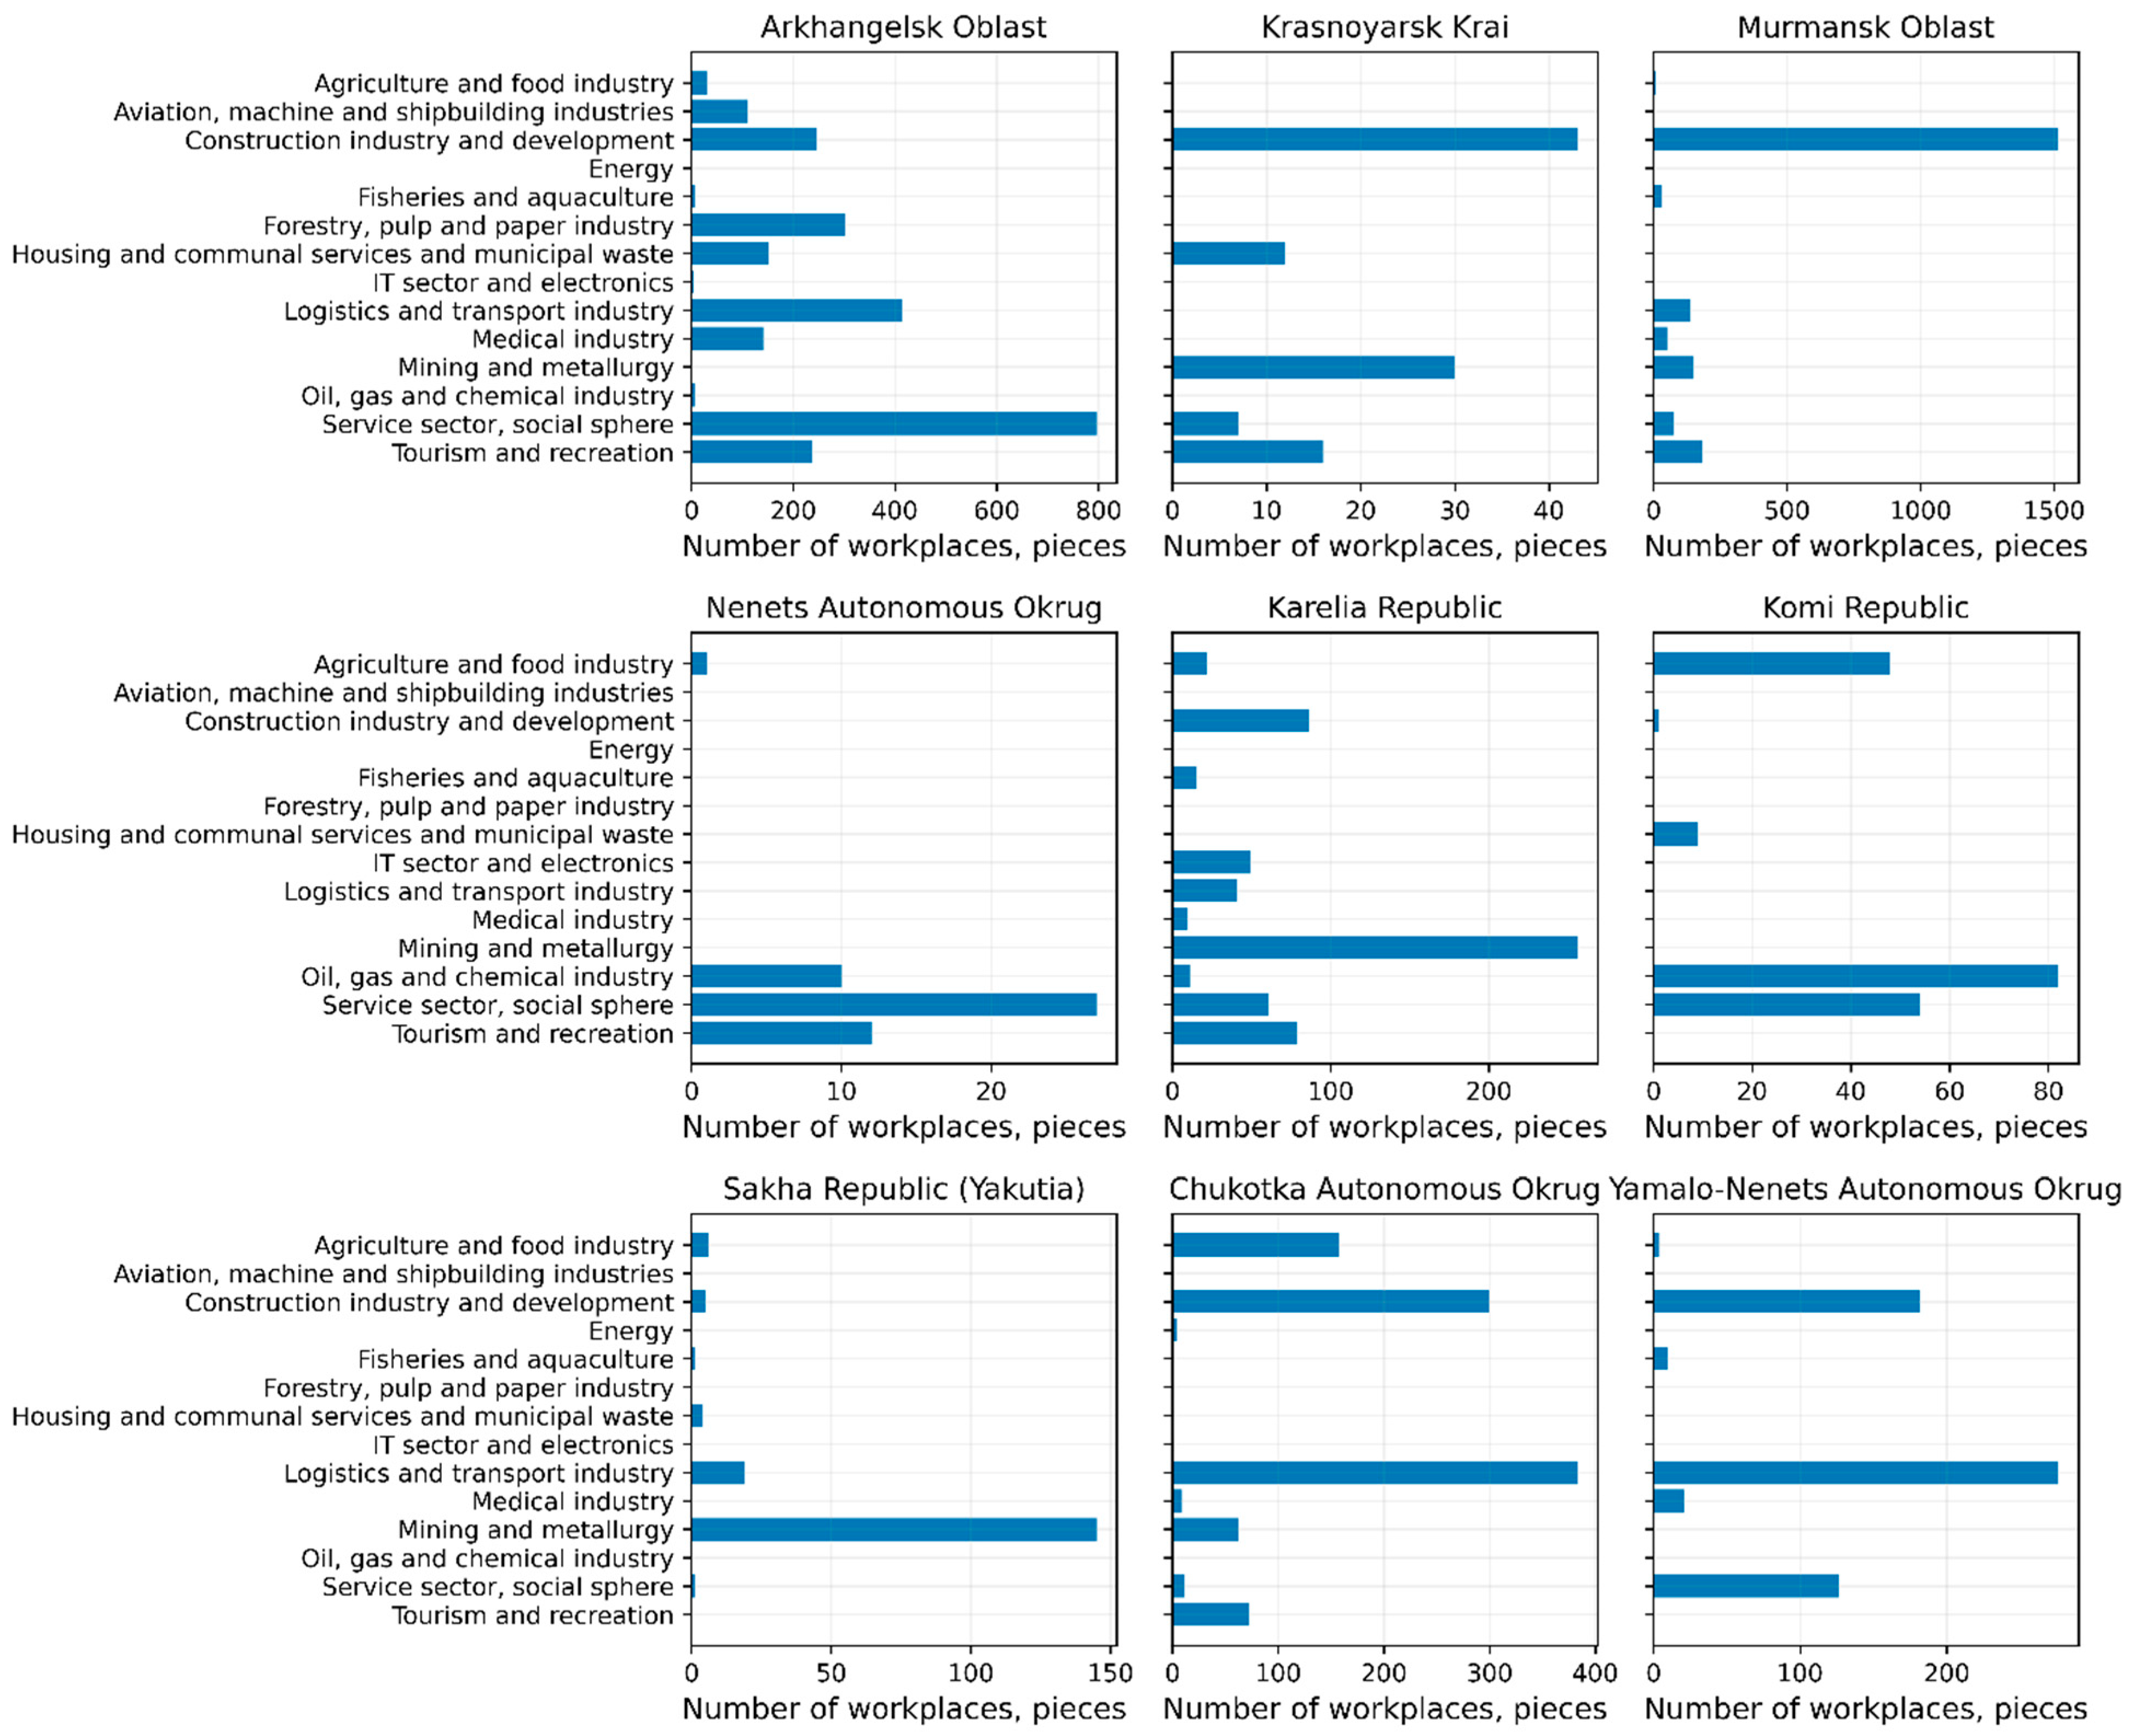
Below we provide information about the sectoral profile of the new workplaces created within AZRF residents’ projects (
Figure 4).
We can see that the sectoral spectrum of residents and investments is much wider in regions situated in the European part of the Russian Arctic (so-called old-development regions—Murmansk Oblast, Arkhangelsk Oblast, Republic of Karelia) than in the comparatively sparsely developed regions of the Asian AZRF or in Cis-Ural regions. The relatively high actual investments in such historically underdeveloped sectors in the Russian Arctic including tourism and recreation, and the medical industry and the IT sector in some regions, indicate that the AZRF preferential regime is creating the conditions for a diversification of the regional economies.
The trend for a substantial growth of planned investments and new workplaces observed in the first 2–2.5 years of the preferential regime’s operation was succeeded by a stabilization of these parameters in most of the regions (
Figure 5). While the actual investment size and the number of workplaces really created in the projects already registered keep growing, the trends of the last 3–4 quarters of the year suggest that much of the AZRF preferential regime’s potential to attract large investors under the current macroeconomic conditions is already depleted.
It is worth noting that the ratio between actual and planned levels is generally higher for the number of new workplaces than for investments (with the exception of the Krasnoyarsk Krai) (
Figure 5 and
Figure 6). This fact reflects the nature of the projects implemented in the regions: the most investment-intensive and complex industrial projects are still in an interim phase, so the workplaces within them have not yet been created. Small and medium business projects, first of all in services and the social sphere, tourism, fisheries and aquaculture, etc., have largely been accomplished or reached a phase where the residents have started their business operations and employees have been hired for the workplaces.
The data reported above demonstrate that the trends in investments and project implementation by AZRF residents are sharply differentiated among regions of the Russian Arctic. The numbers of projects and new workplaces are the highest in old-development regions (Arkhangelsk Oblast and Murmansk Oblast), which have good transport and social infrastructure and the accompanying costs of project implementation are comparatively low. The relatively recent trend is that major projects involving large investment and many new workplaces are implemented in peripheral, economically sparse areas (CAO), first of all within infrastructure-building projects (in the CAO case—building of power generation capacities and transmission infrastructure). Generally speaking, the data indicate that the role of the preferential regime in economic space development differs among regions.
5.2. The Impact of Investments by AZRF Residents on Employment in Project Localization Regions: Evaluation Results
In accordance with the methodology adopted for analyzing the impact of investments on employment in regions falling under the AZRF preferential regime, we constructed a set of models, some of them shown in
Table 3 (the full version of the table including all models is given in
Appendix B). For some sectors, neither of the proposed specifications provided a significant impact of investments on employment size, which may be an indicator of a depleted potential for employment stimulation through investment. For the regional sectors where the effect of the preferential regime and/or the accompanying processes was significant, two formulas were produced for the different forms of relationship between the employment and investment variables in the periods 2017–2019 and 2020–2022. For the regional sectors where the preferential regime produced no significant impact, the simulations based on 2017–2022 data were proven to perform better and be more reliable, indicating that the nature of the relationship between the variables persisted throughout the study period. We observe that the preferential regime effects appeared only in certain sectors.
The region- and sector-specific profiles of trends in employment and the relationship between employment size and investment size are shown in
Table 4.
The first thing that attracts attention is that the trends observed before the launch of the preferential regime persist in most sectors in the regions. Investment growth has not entailed a significant increase in employment. However, employment does not decline either, which is important in the context of the COVID-19 pandemic impact and the increased sanctions pressure in the period 2020–2022, which have significantly affected the overall economic activity and employment in most Russian regions (
Turgel et al. 2022;
Iwasaki 2023). Another important thing to consider is the “Northernness” context, which makes northern and Arctic economies generally more sensitive to crisis phenomena (
Lazhentsev 2018). A trend for employment decline has also been detected, both in sectors with a substantial number of projects implemented by residents (e.g., the logistics and transport industry—Formula (14) in
Appendix C) and in sectors not directly related to the application of the AZRF preferential regime (e.g., healthcare—Formula (16) in
Appendix D).
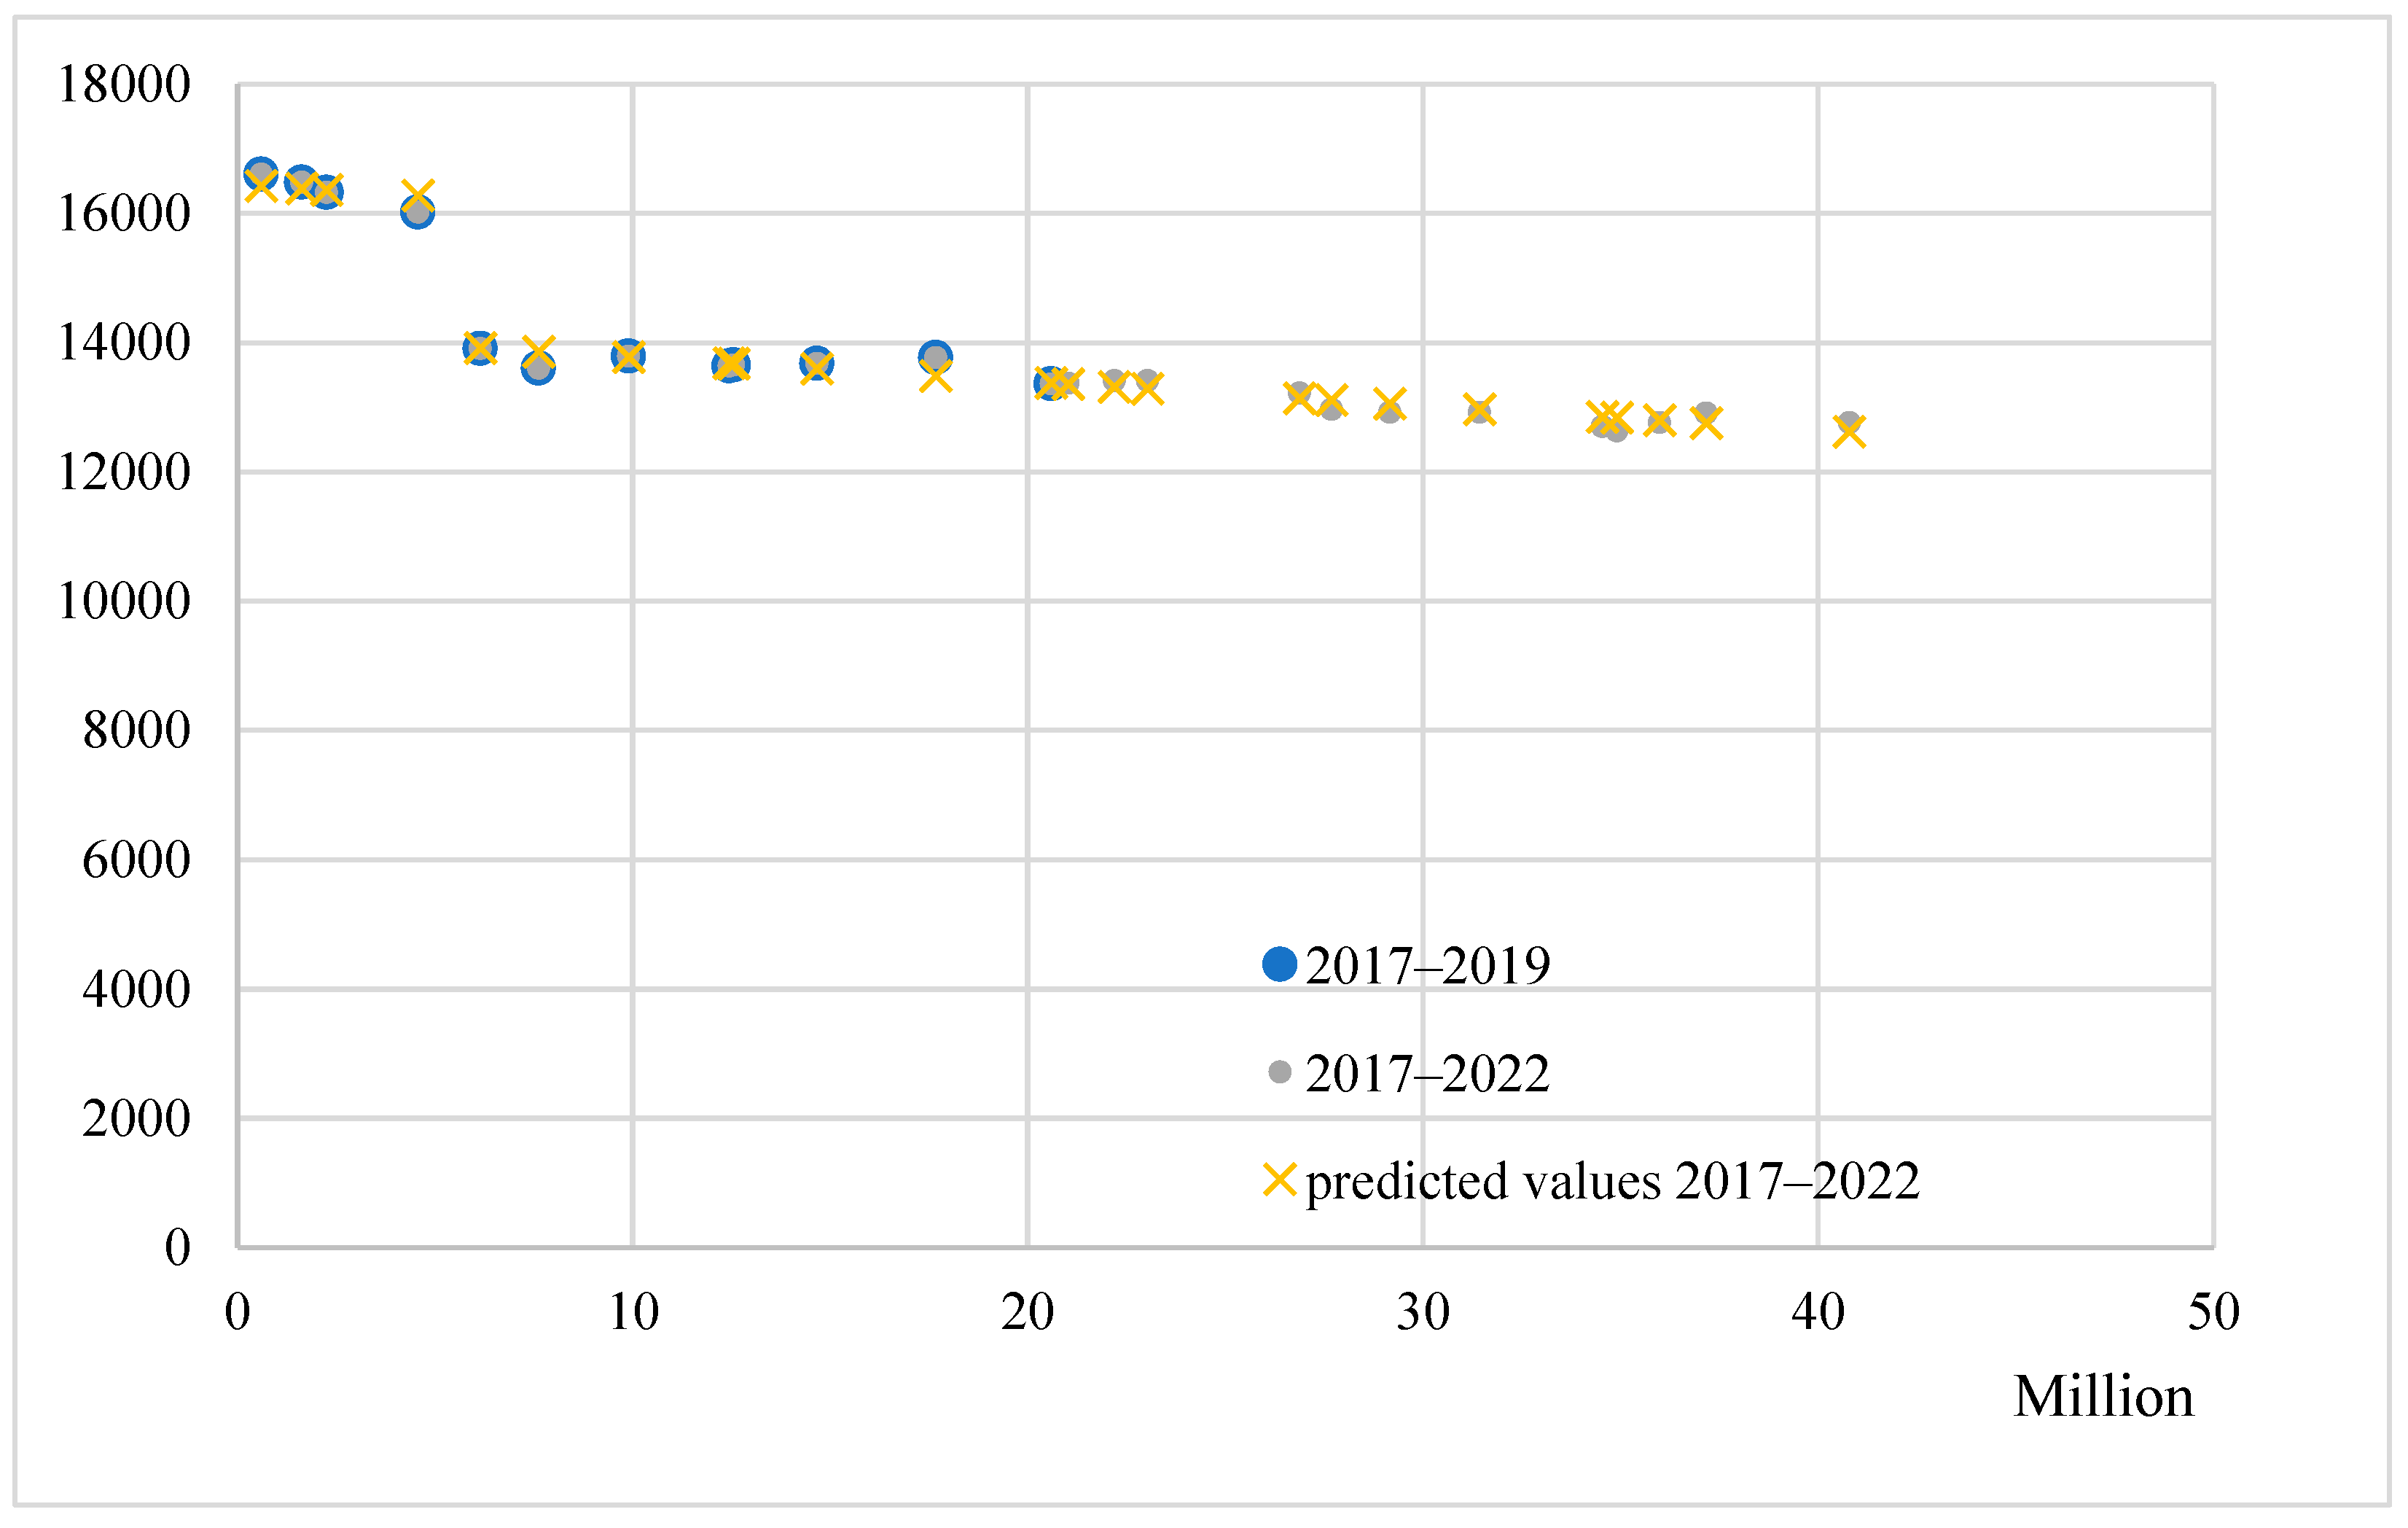
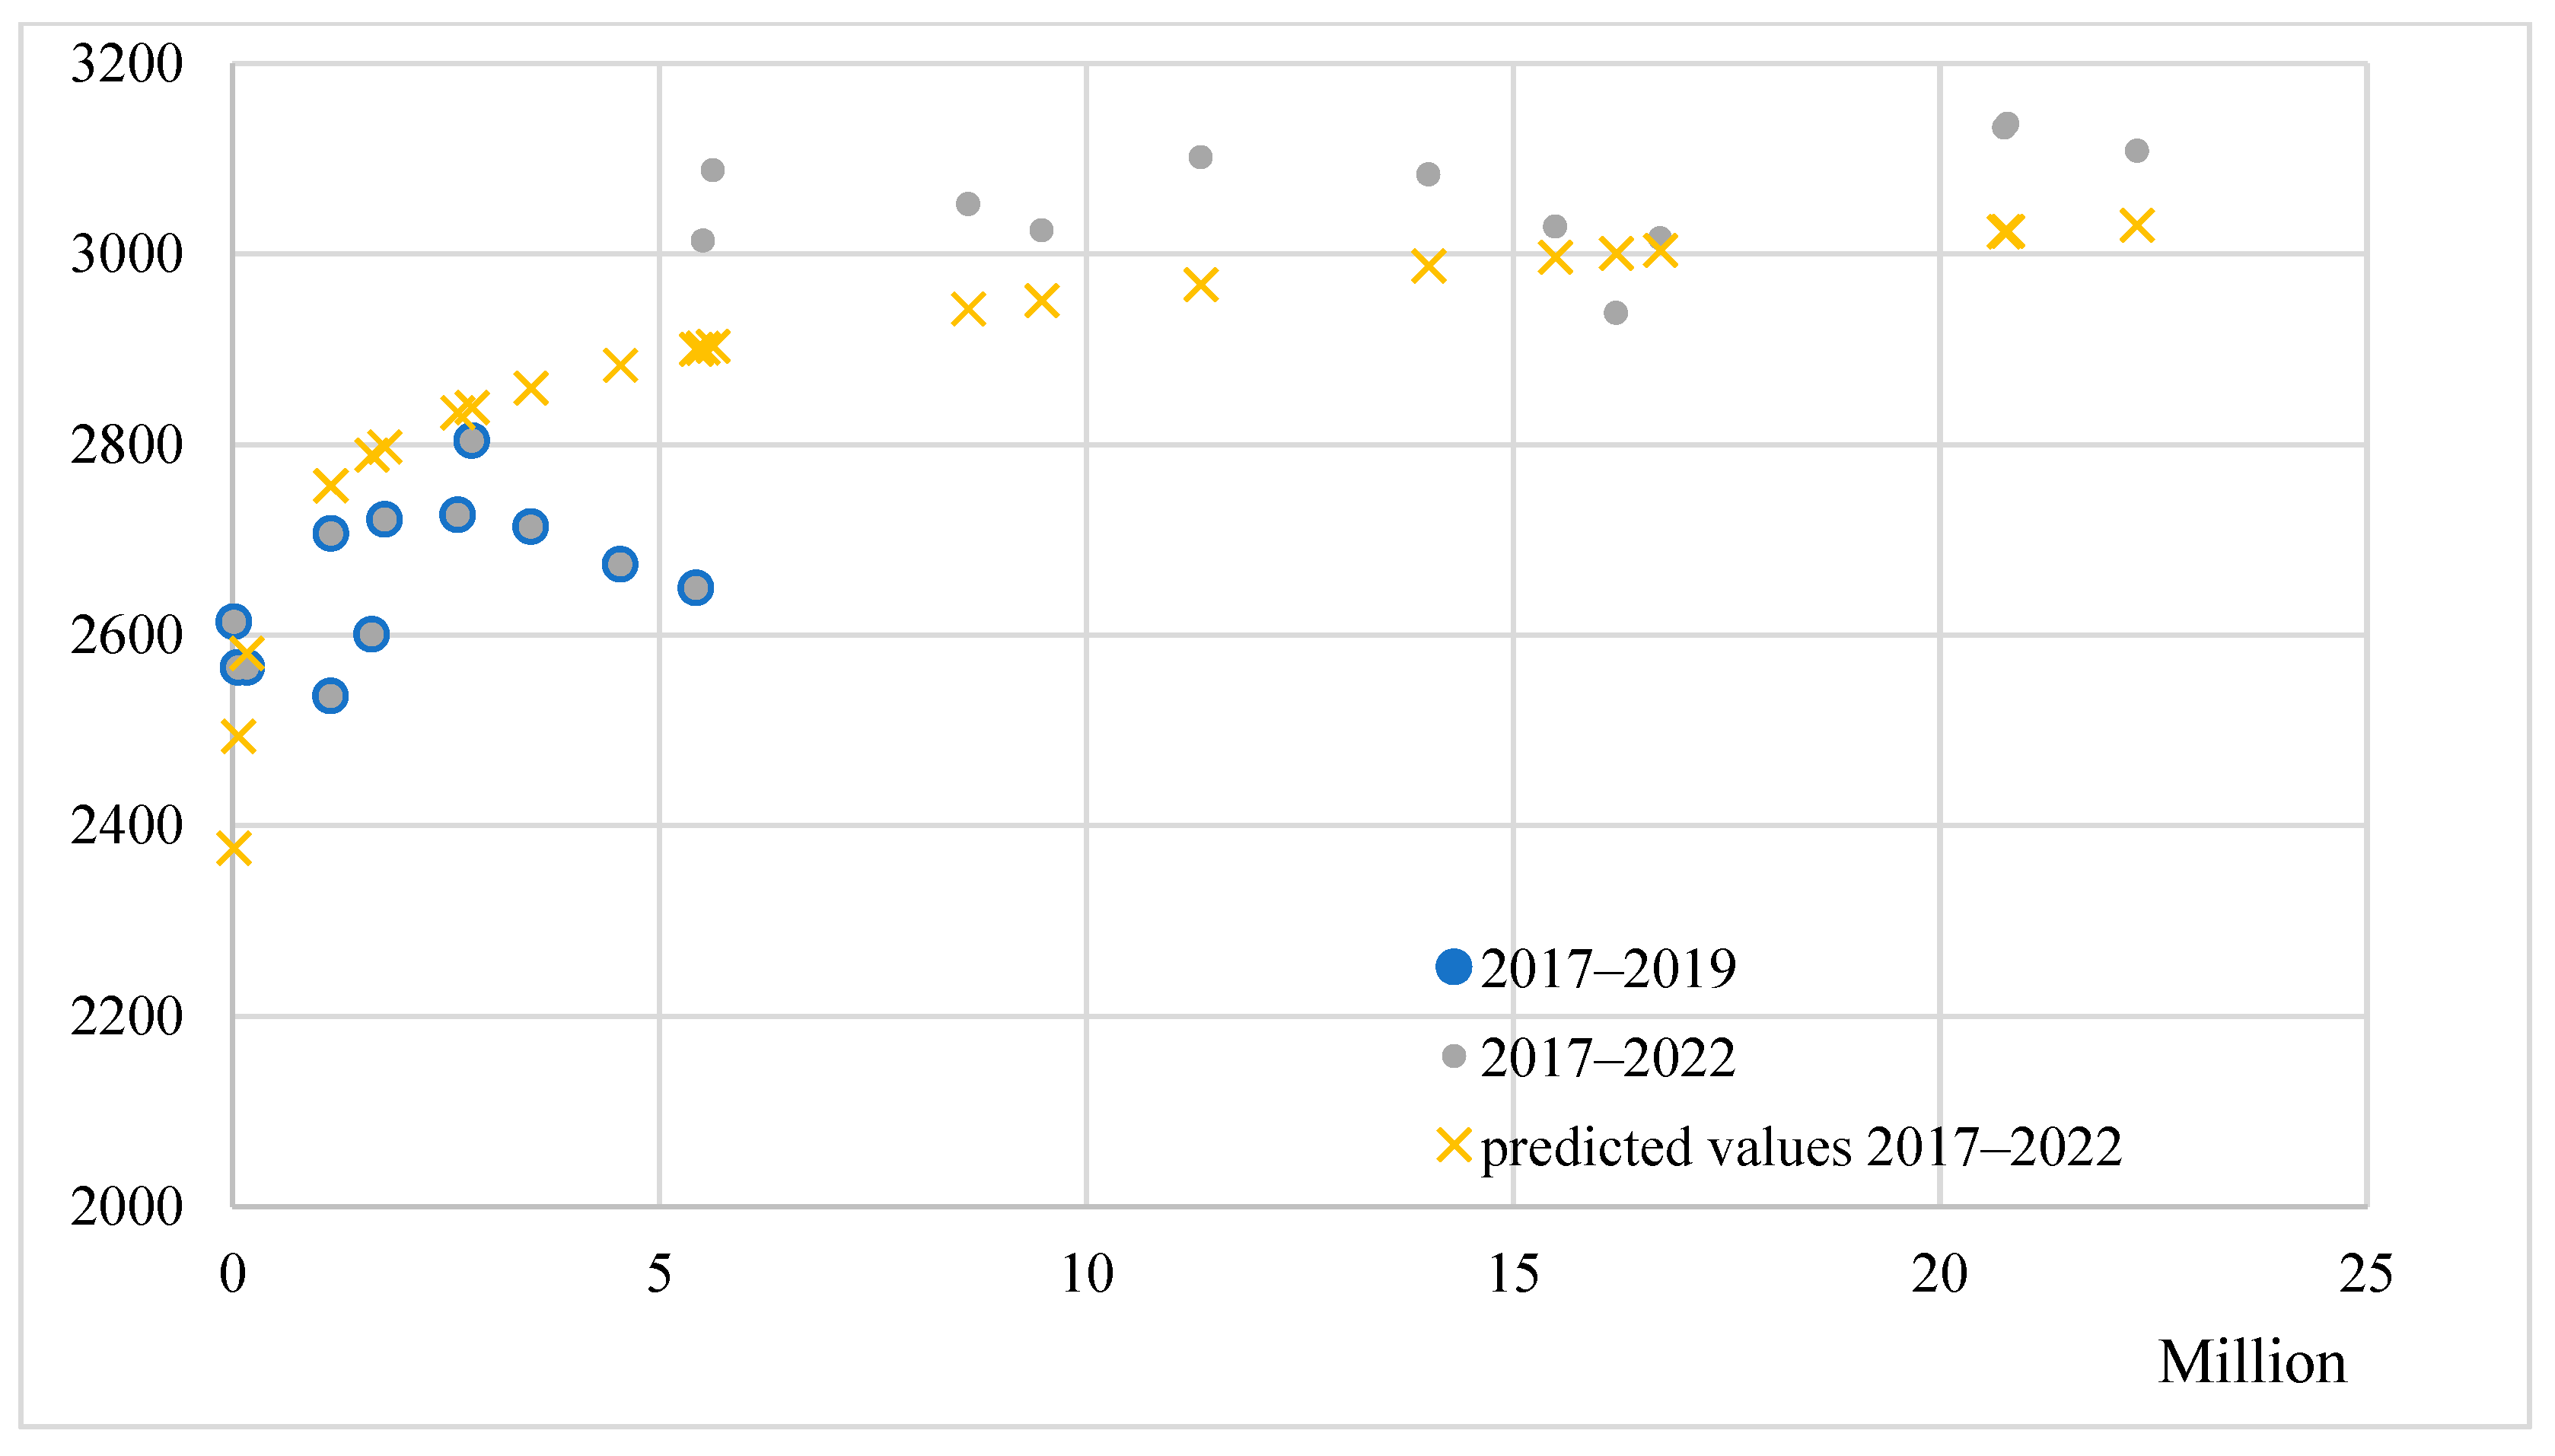
A significant task of preferential regime implementation aimed at the development of regional economies is to overcome the limitations of supply in the labor market, which are removed by the diversification and building of companies of a new technological mode. The differentiated economic space of the Russian Arctic is bound also by other sorts of constraints, as demonstrated by our analysis. For the transformations involving an increase in employment size there is a clear employment threshold for each specific sector. Thus, the relationship between the investment and employment variables in the logistics and transport industry sector in the Nenets (Formula (21)) and Chukotka Autonomous Okrugs is modeled by a logarithmic function, which approaches a horizontal asymptote when, after a certain threshold, a change in investment size can no longer induce a change in the employment size (
Figure 7). Introduction of a preferential regime is exactly associated with a transition to the phase of insensitivity to changes in investment, which is evidence that the said sectors had used up the available manpower potential even before the support measures and an increase in investments brings about a risk of exposure to growth restraints, such as staffing bottlenecks and regional human capital limitations (
Volkov and Tishkov 2022).
A similar situation is observed in agriculture in the Arkhangelsk Oblast, the logistics and transport industry in the Republic of Sakha (Yakutia) and Chukotka Autonomous Okrug, construction in the Chukotka Autonomous Okrug, and healthcare in the Republic of Sakha (Yakutia), the only difference being that in this group of study objects the clearly linear growth trend is replaced by insensitivity to investment change—a process that is better modeled by trend break functions rather than a logarithmic function (e.g., Formula (26) in
Appendix E). Essentially, they result in similar circumstances, where the sector has reached a limit in employment size and further investments cannot change the situation.
The case of agriculture in the Arkhangelsk Oblast clearly demonstrates that the employment size in the sector upon the launching of the AZRF preferential regime was augmented and then stabilized. The obvious effect is 2188 new workplaces (D2020-2022 coefficient in Formula (26)), which we attribute both to the application of the AZRF preferential regime and to the accompanying processes catalyzed thereby.
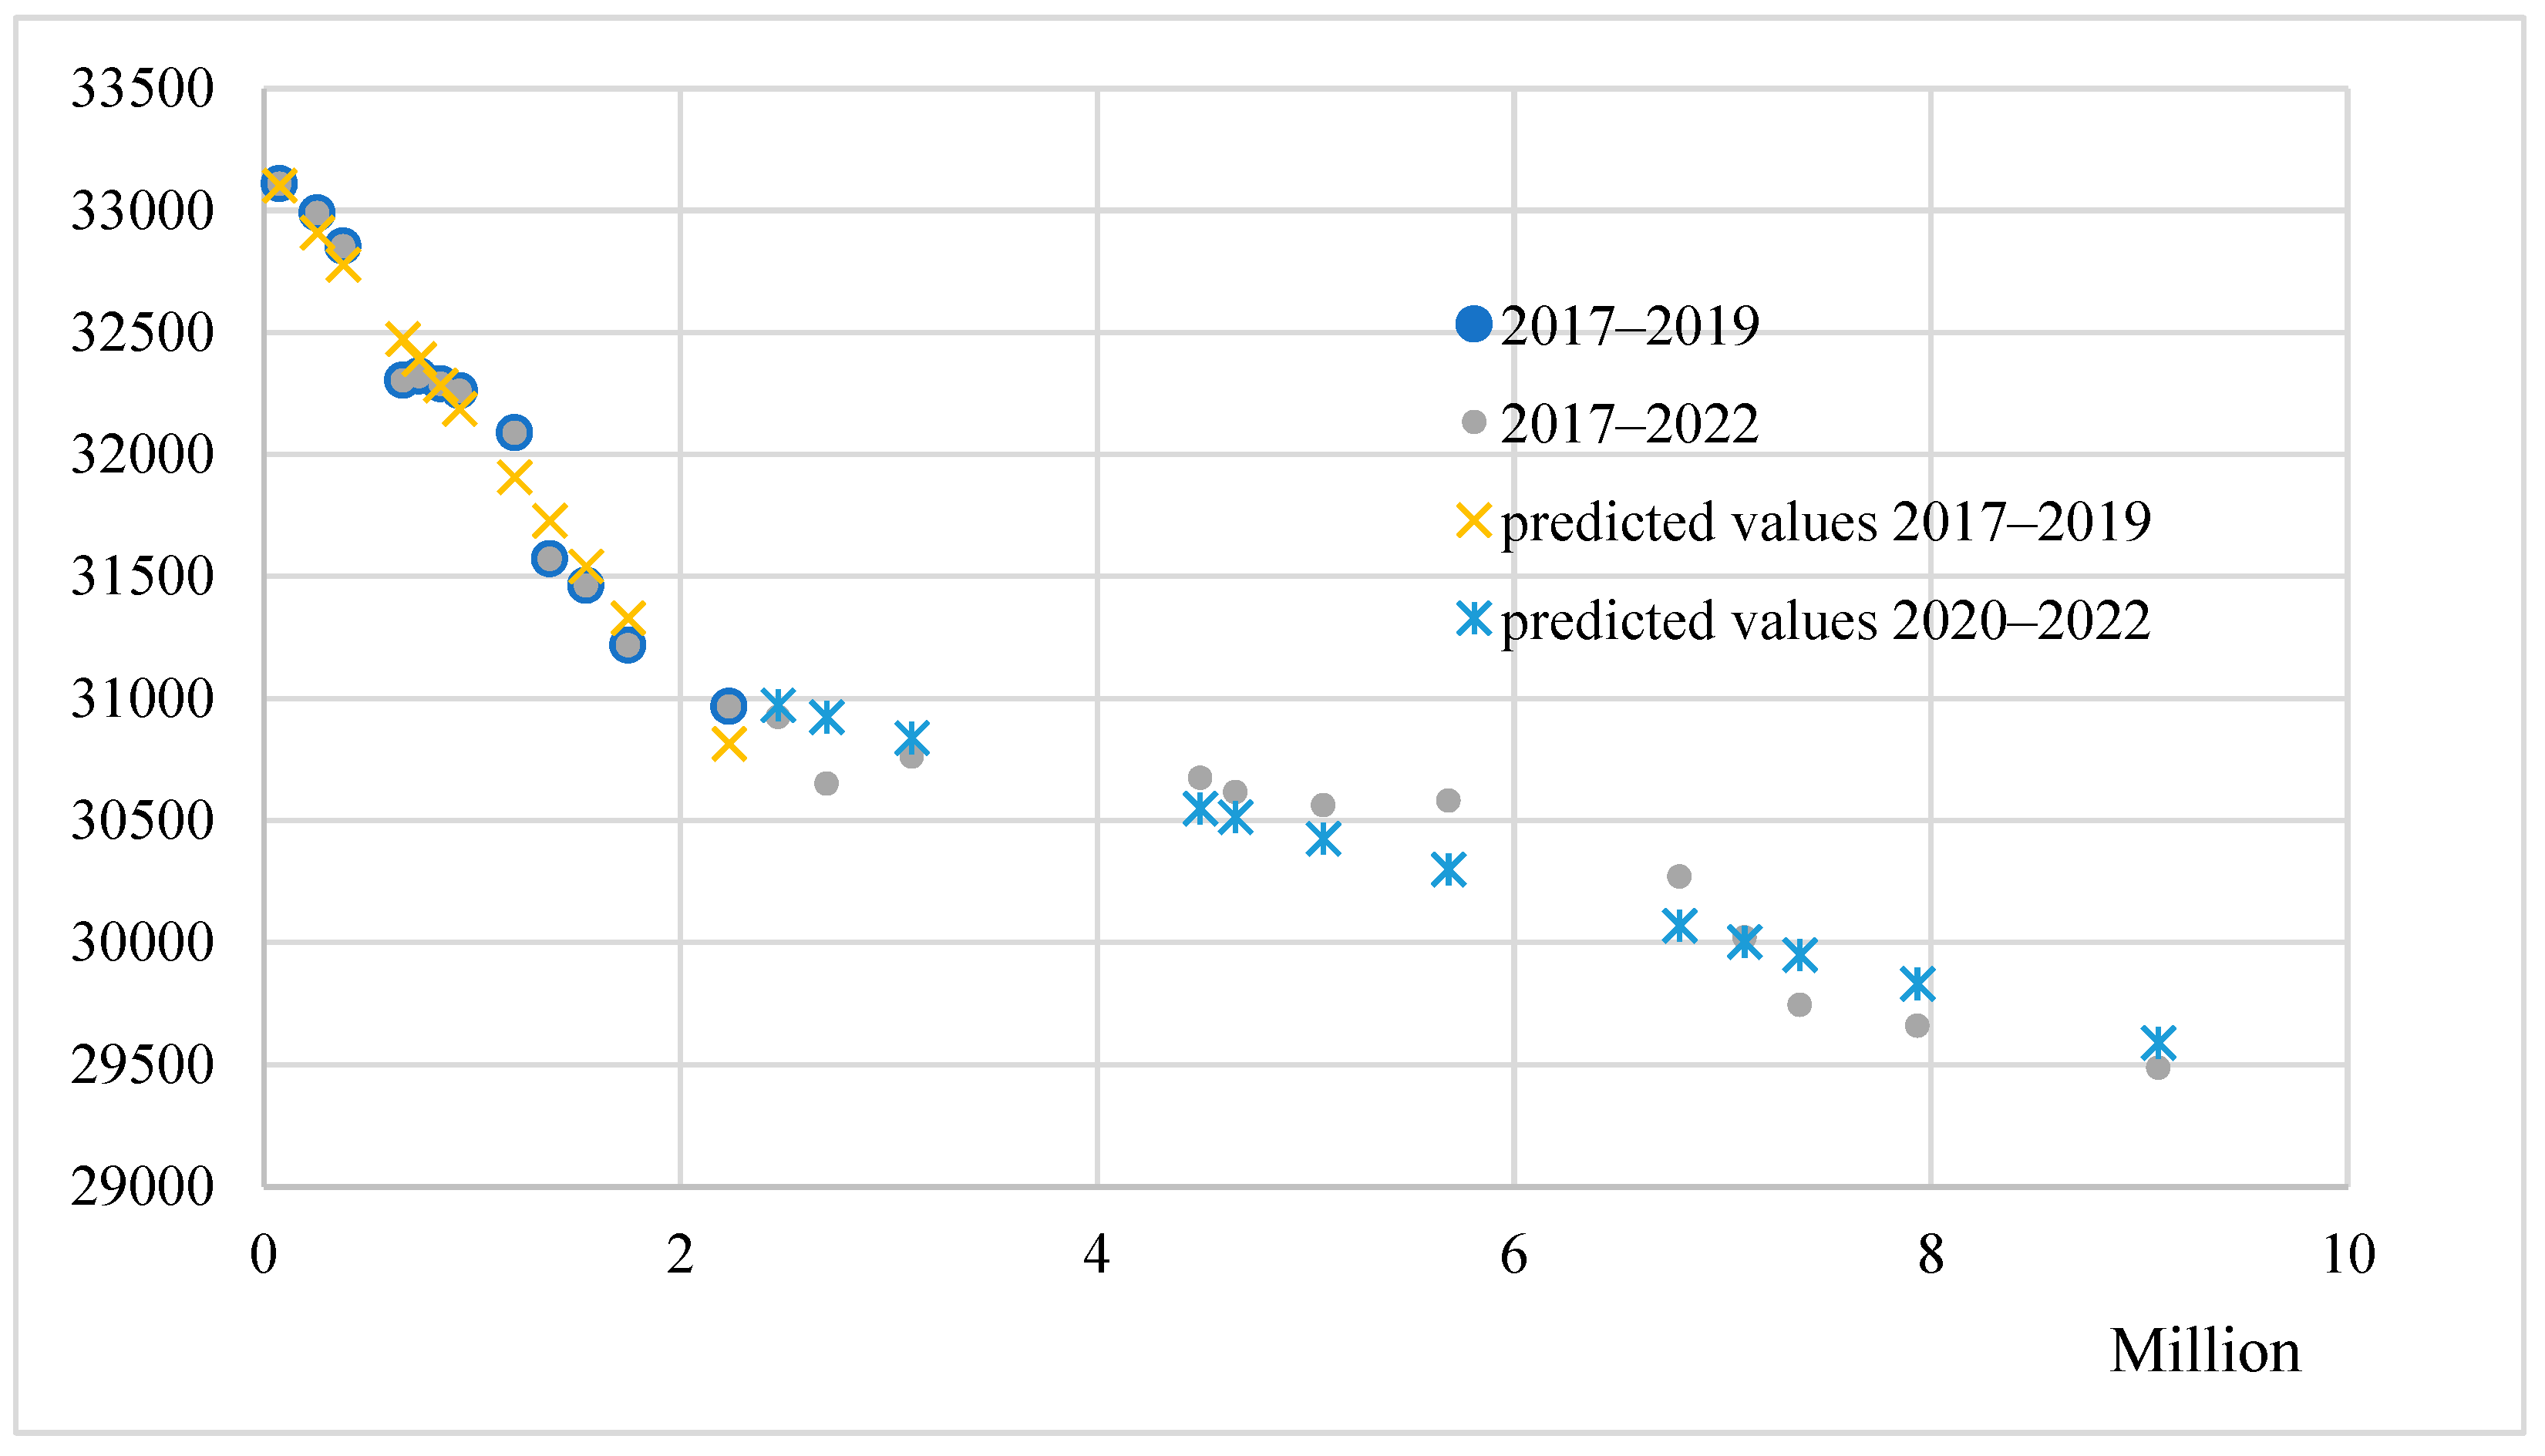
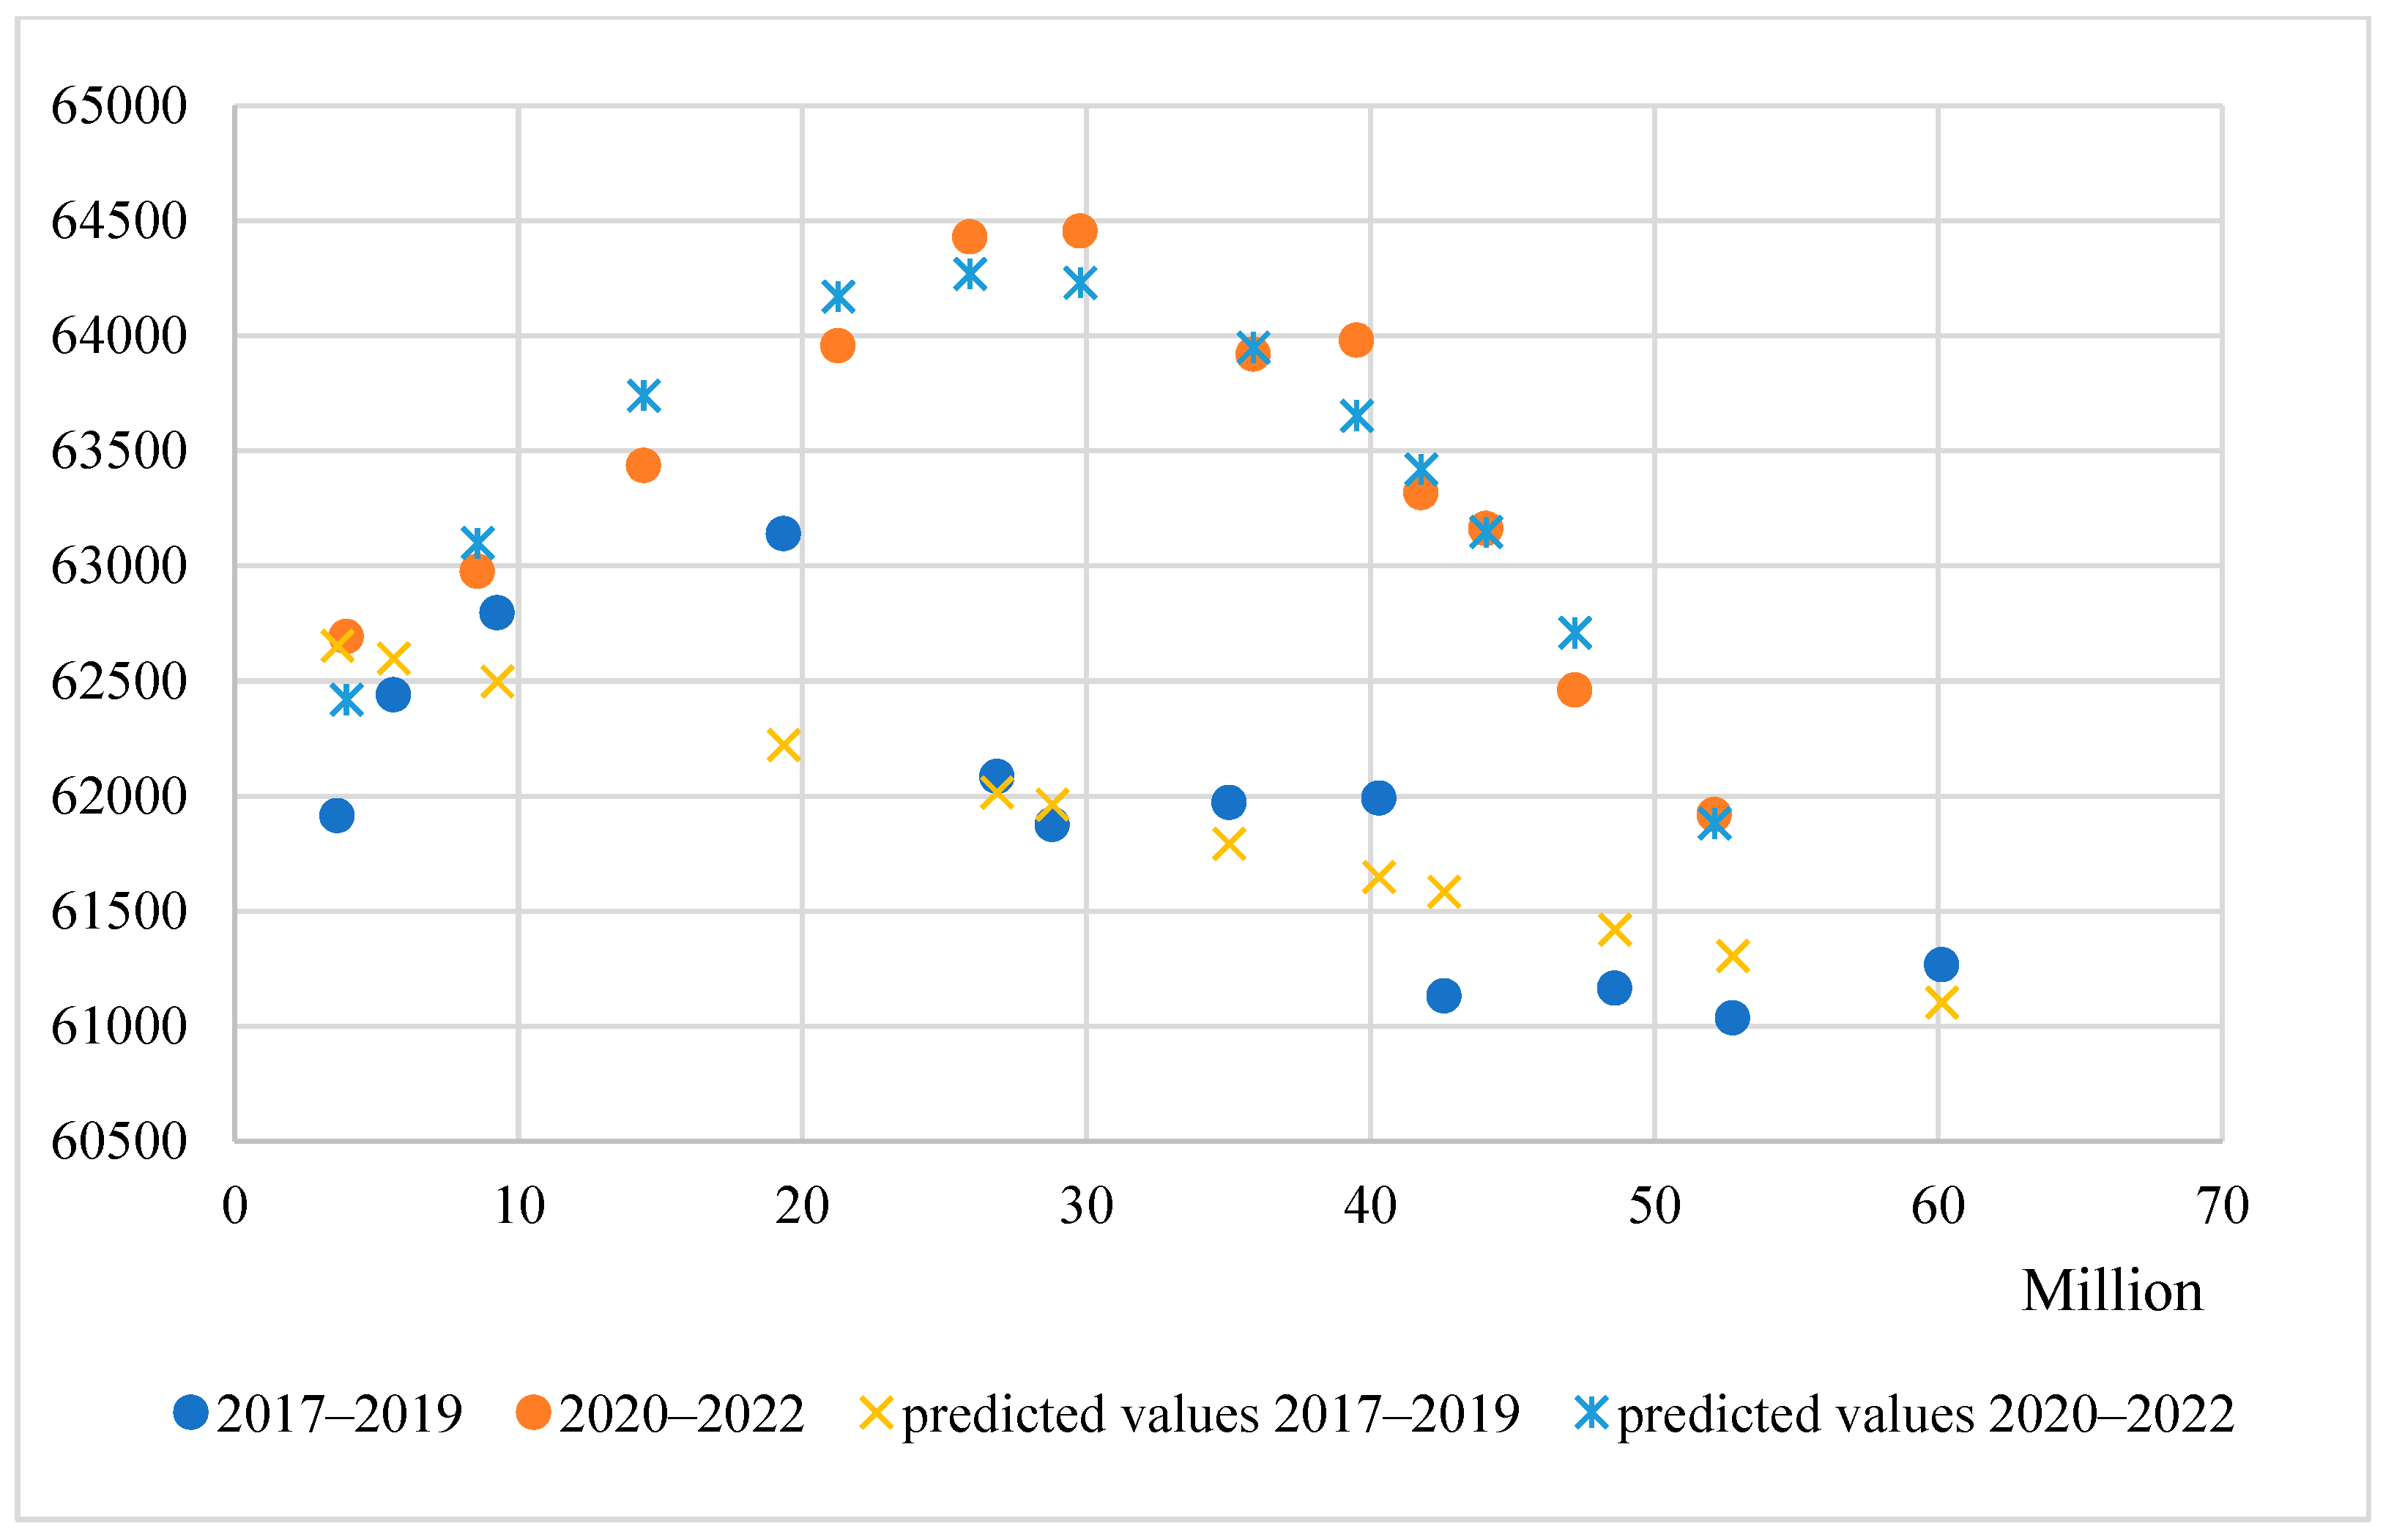
Another interesting case is the trends in the manufacturing sector in the Arkhangelsk Oblast (Formula (27)). There, the linear trend in the relationship between investment and employment was replaced over time by a quadratic function with a clear maximum (
Figure 8). In other words, the extensive growth of production and employment upon the introduction of the preferential regime reaches a certain limit after which the industry begins to actively adopt labor-saving techniques, thus launching the process of employment reduction.
The nature of manufacturing apparently makes it easier for the sector to implement and upscale such techniques. This is reason to expect that another trend break in the region’s manufacturing sector is merely a matter of time and the timing will largely depend on the general economic development context. An alternative path is a redistribution of manpower among other industries and sectors within the region or its migration to the corresponding sector in other AZRF regions, given tangible effects from the preferential regime.
The presented data allow us to speak about the confirmation of hypotheses H1 in terms of the presence of turning points, which are caused by the limitations of the labor market in propulsive sectors (
Figure 8) and H2 in terms of the indifference of employment in life-supporting sectors to changes in the dynamics of investments associated with the introduction of the preferential regime (
Figure 7). To confirm H3, it is necessary refer to the data of infrastructure provisions in the Arctic regions (
Table 5).
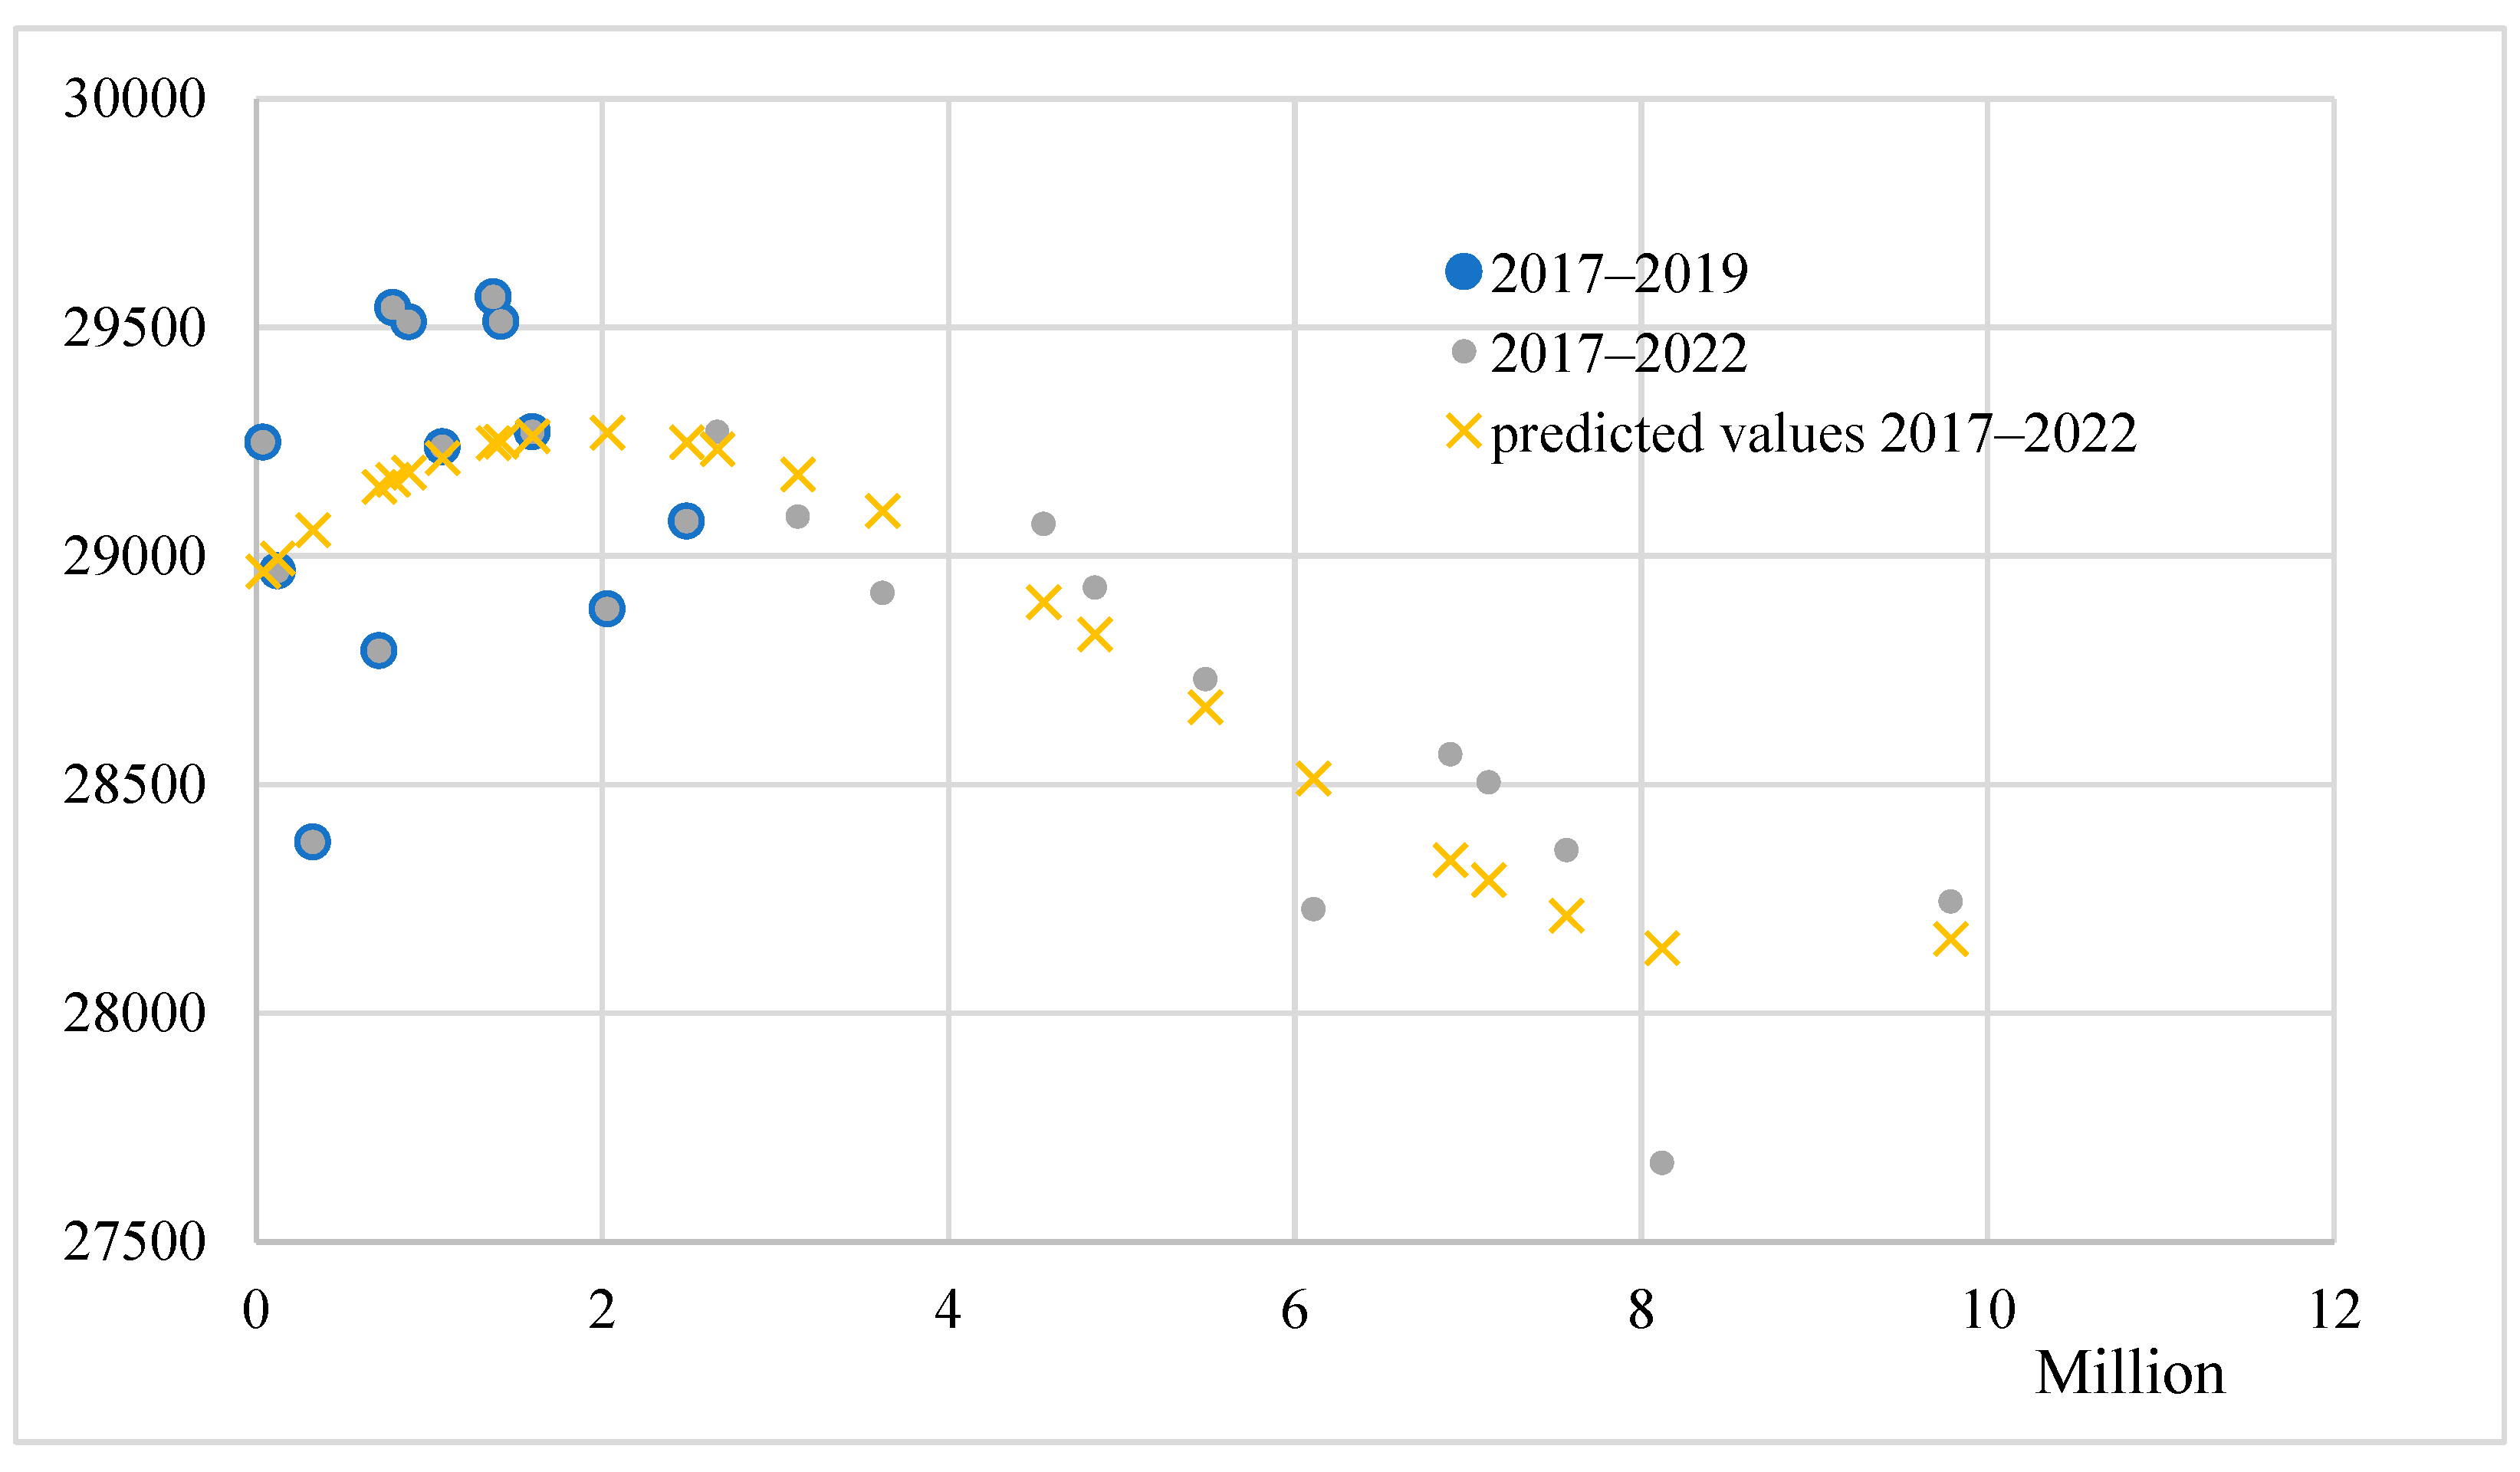
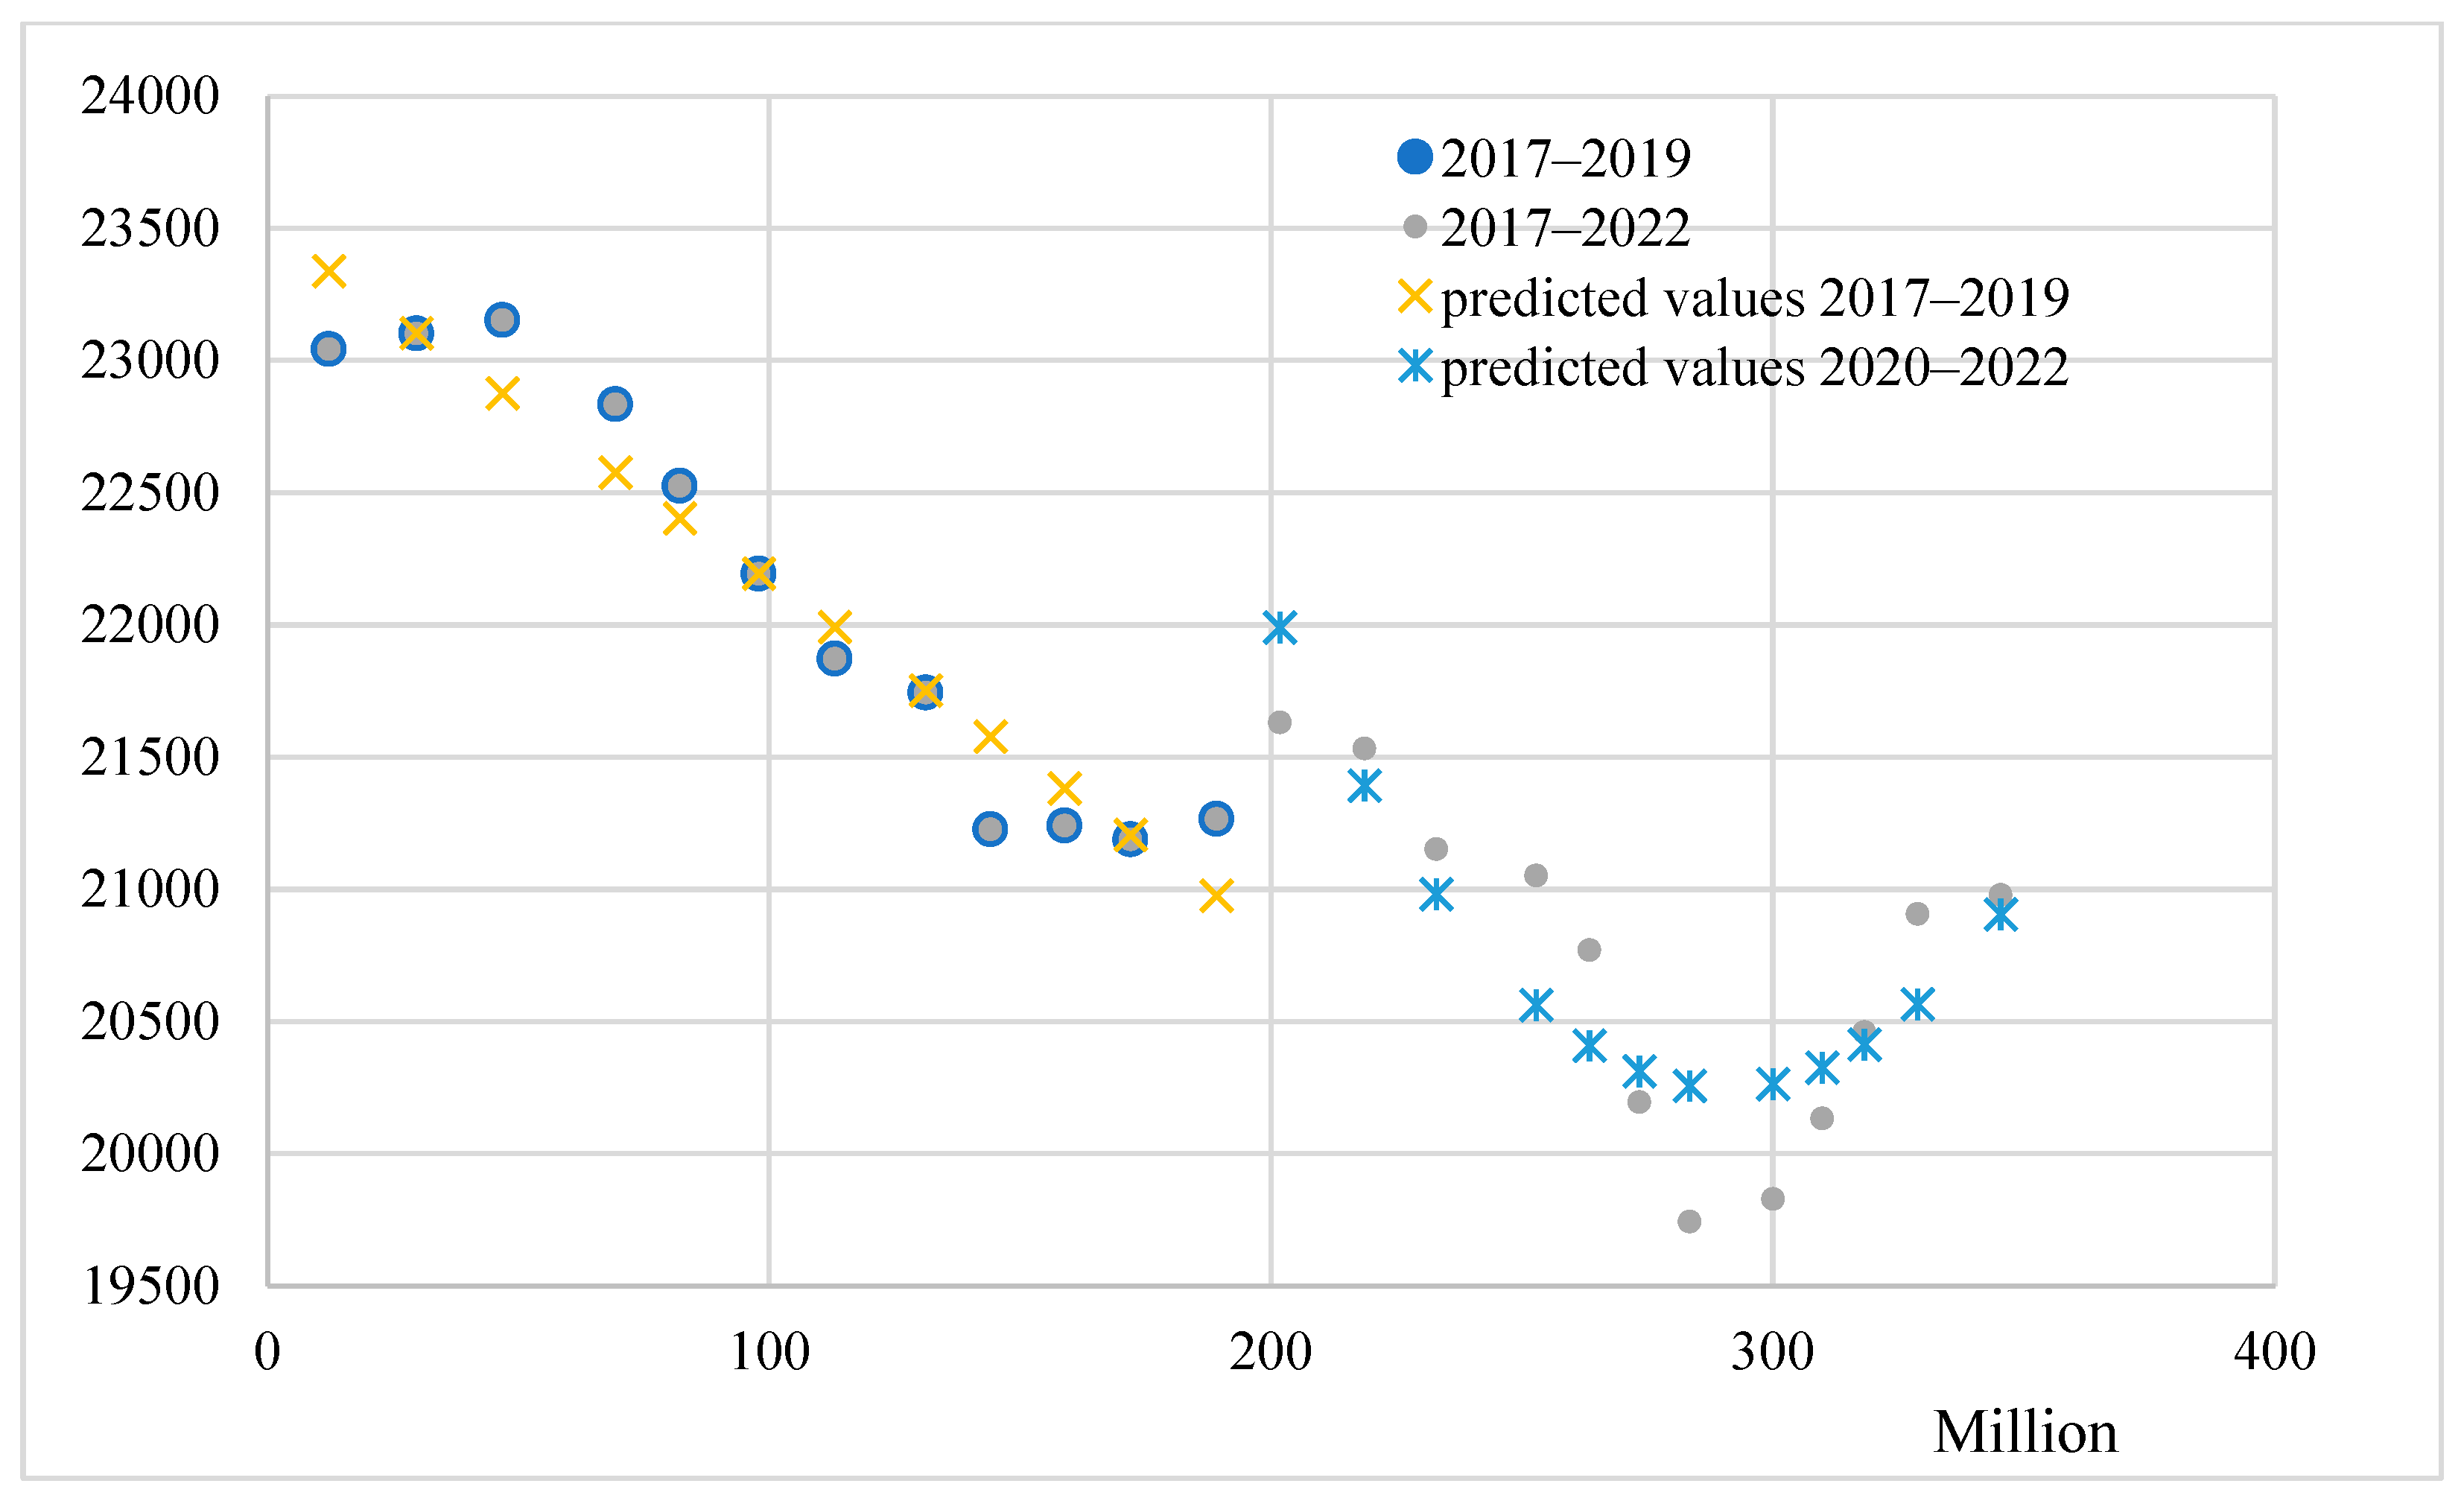
Comparing the evaluation results reflecting the relationship between investment and employment and the level of infrastructure development, we can conclude that the relationship is not observed in all sectors, but we see the greatest correspondence in mining. Employment growth trends prevailed in the mining and commerce sectors in most of the regions analyzed. In the mining sector, it was combined with a steady form of the relationship between investment size and employment size (e.g., in the YNAO Formula (43)—
Figure 9). The patterns for commerce were not so uniform—what we see in the Arkhangelsk Oblast and YNAO is the relationship conserved without a noticeable change in the employment trend, whereas the development of this sector in the Republic of Karelia is accompanied by a change in the form of relationship between investments and employment.
Thus, Hypothesis H3 is confirmed.
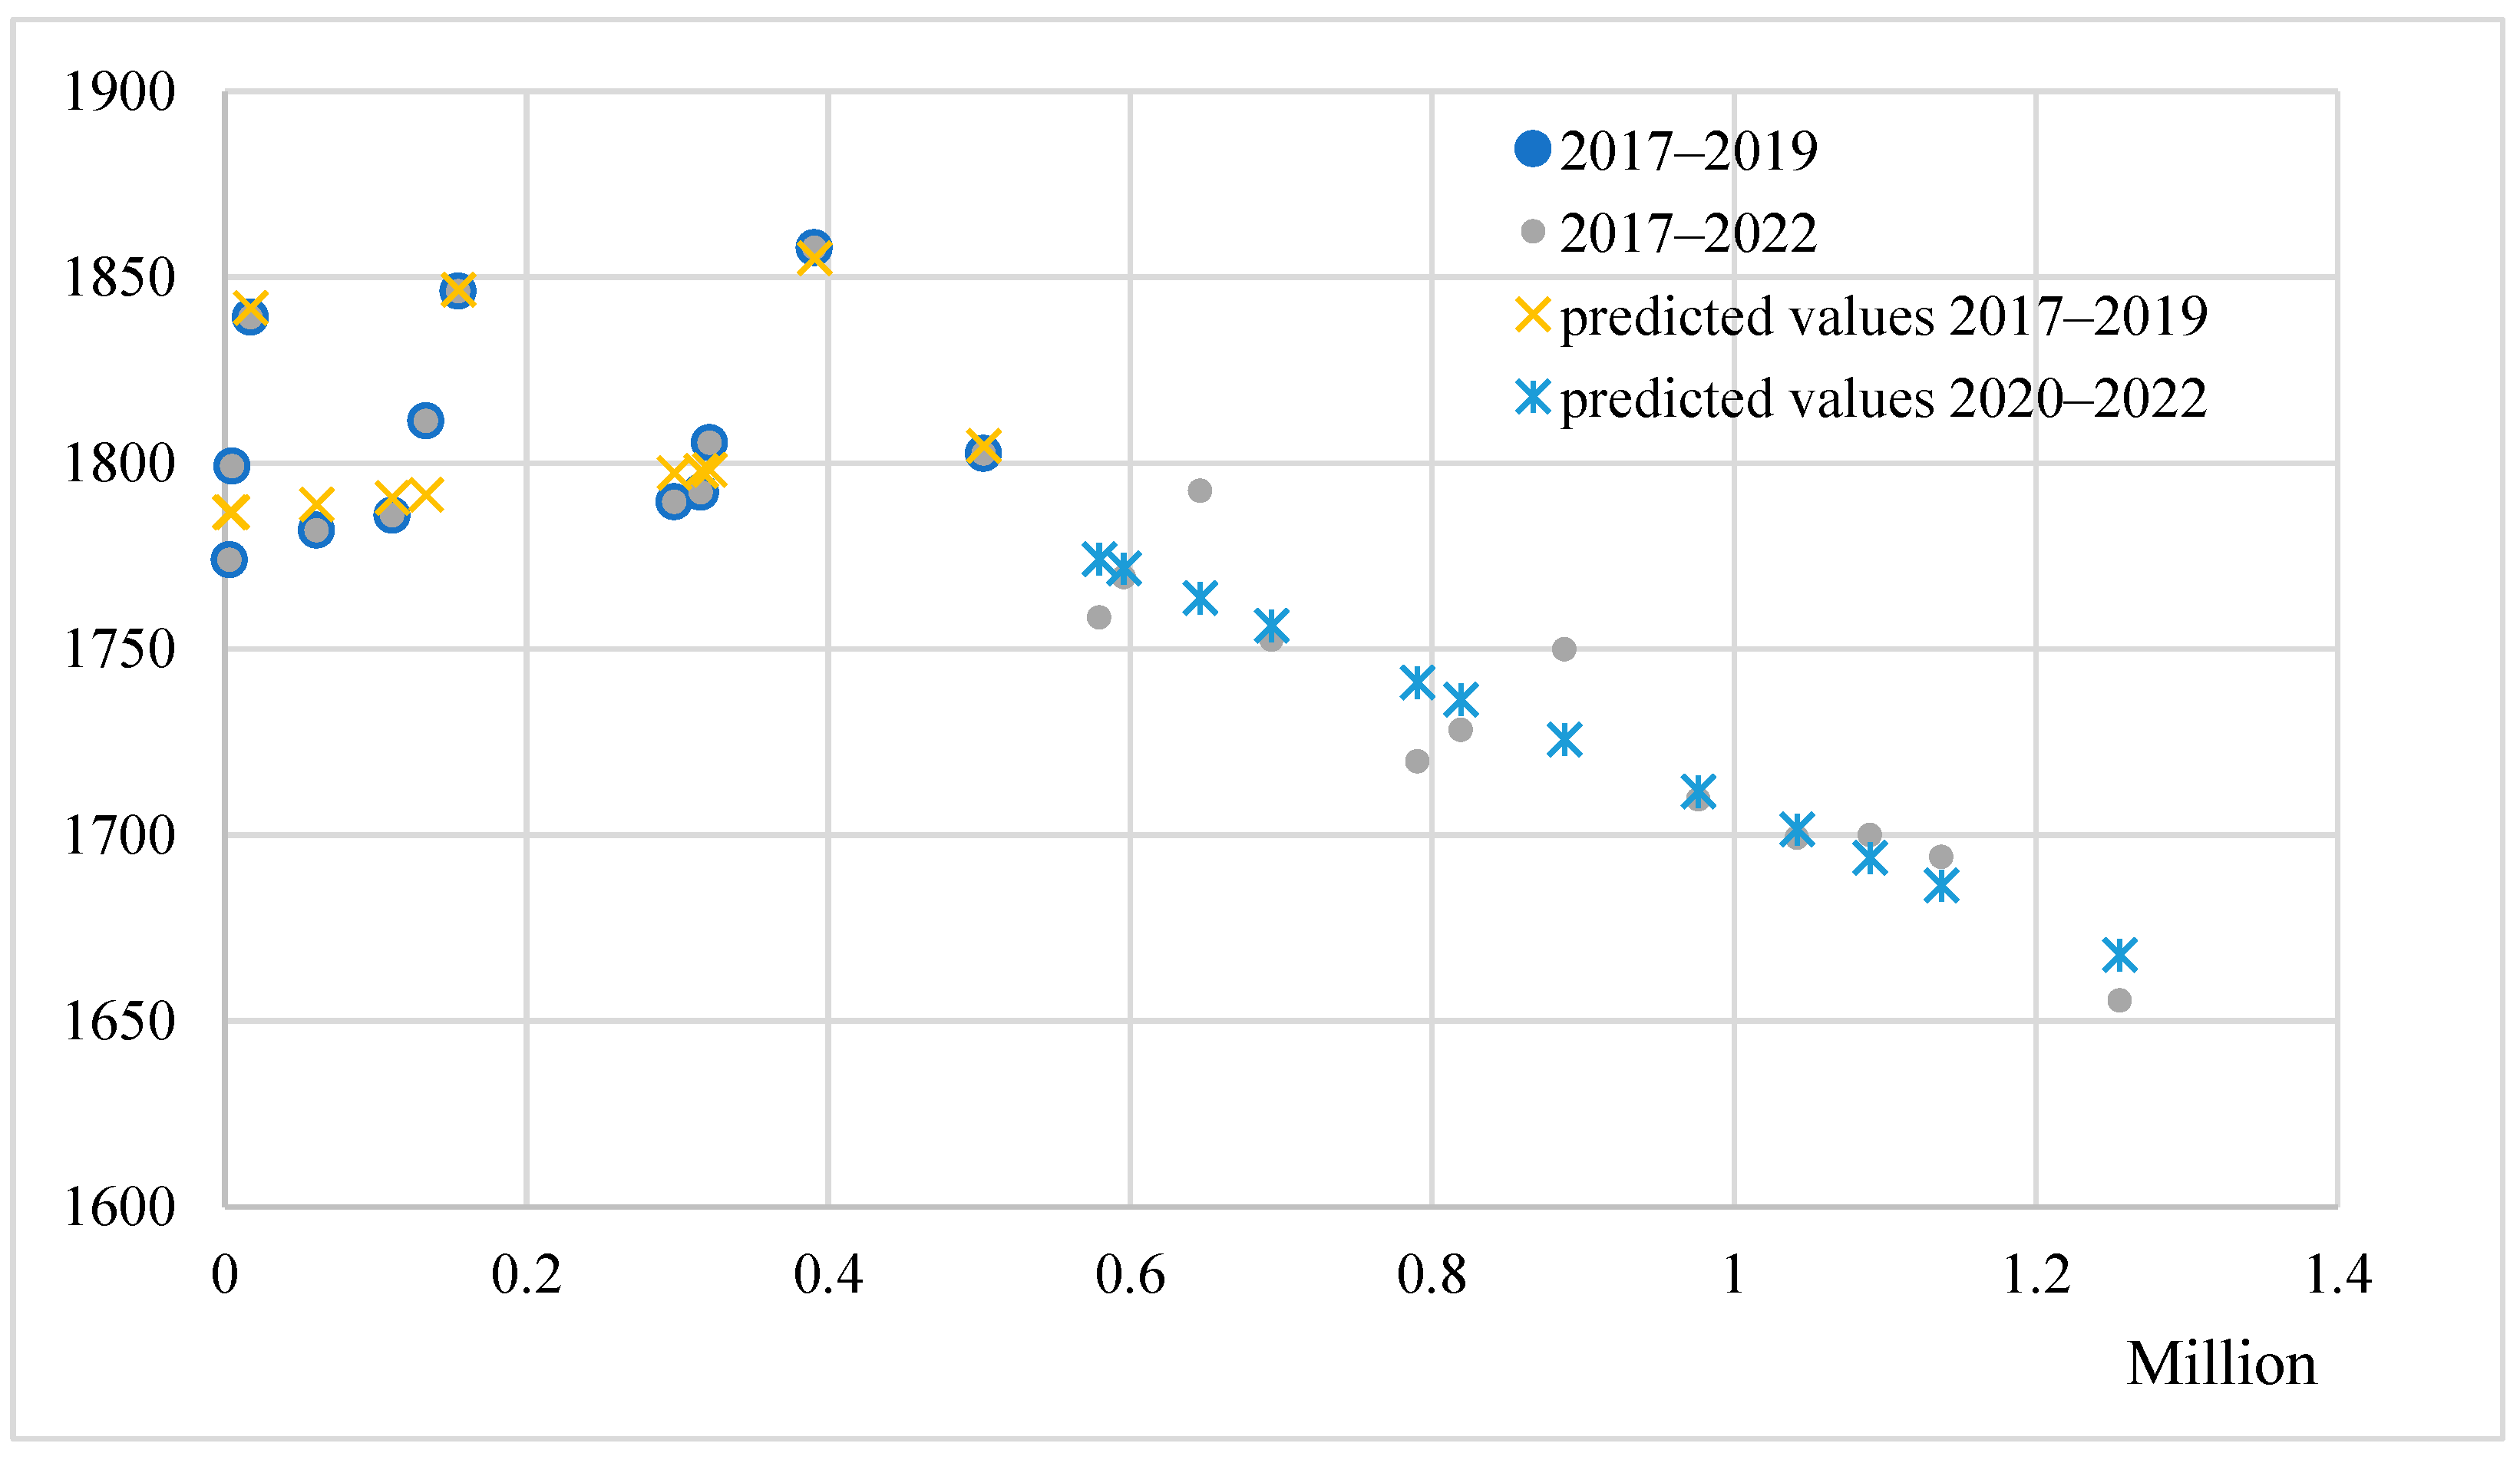
The category most interesting for this study is the group where the relationship between investments and employment undergoes a transformation. In the case of a decrease in employment, we can distinguish quadratic (construction in the Republic of Sakha (Yakutia); mining in the Komi Republic (e.g., Formula (12) on
Figure 10) and Nenets Autonomous Okrug—and third degree polynomial (education in the Murmansk Oblast—Formula (38) in
Appendix F) functions, which have local minima. Such a transformation in the nature of the relationship may indicate that employment in the sector has reached a certain socially acceptable bottom threshold level after which the regional system loses social stability. On the way to this threshold, processes related to staff reduction through the introduction of technologies that boost productivity as well as increase the hidden workload for some categories of employees can take place. After the threshold is reached, however, the process is reversed to building up the employment size, which is obviously critical for maintaining social stability in the situation of limited regional labor markets and a prevalence of communities with a single-focus economic profile in the Russian Arctic. Thus, widely known are cases of federal authorities intervening in socio-economic processes in monotowns, such as saving the JSC Nadvoitsy Aluminum Smelter in Nadvoitsy, Republic of Karelia from closure in 2012 to maintain social stability (the enterprise, however, was eventually shut down in 2018).
The employment decline in the case of the Komi Republic’s mining sector was associated with significant transformations occurring in the region’s Arctic territories. A steady decline in extraction output and a release of manpower are taking place in the economic activities related to coal mining in the Vorkuta Urban District; the pivotal enterprise of the Inta Urban District—PJSC IntaUgol’ coal mine, was liquidated in 2018–2019. Regional and federal authorities put substantial administrative resources into delaying this decision and mitigating the consequences. The Government of the Russian Federation passed Decree No. 2564 of 18 November 2017 “On allocating funds for restoring stable operation of the pivotal enterprise of the monotown Inta” to channel 1.2 billion RUR from the government reserves to reimburse the costs required to resume stable operation of the monotown’s economic mainstay
17.
After the shutdown of the enterprise had been announced, the Head of the Komi Republic addressed the public through printed media in an attempt to prevent social unrest and stop people from leaving the Republic’s Arctic territories: “
Everyone willing to be employed must get a job... First of all, we need to work with Vorkutaugol. If miners from Inta have difficulties moving to Vorkuta, they must be provided support with housing. If this requires resources, they must to be found. If necessary, people should be given the opportunity to be retrained to be employed at other enterprises in the region. And most importantly—despite the liquidation of the enterprise, the city must live and have prospects for development. I am taking the issue under my personal control. I will additionally have consultations with Severstal and Vorkutaugol CEOs, so that they can also get involved and provide assistance and support where possible”
18.
A general remark to be made here is that not all changes in the relationships are directly driven by the preferential regime. Some of them are predicated more on the accompanying processes associated with dealing with the consequences of the pandemic and the sanctions pressure, as well as a generally heightened attention of the state to the development of Russian Arctic territories. Especially noteworthy in this regard are two groups of sectors, where the overall employment trend is preserved but the form of the relationship between investments and employment has changed. For both of these groups, the introduction of the AZRF preferential regime was likely a factor of indirect impact, whereas the principal impacts were produced by the processes accompanying its application. Thus, the decrease in employment size in the healthcare sector in the Nenets Autonomous Okrug and Krasnoyarsk Krai has intensified since 2020 (Formula (23) in
Appendix G). Contrariwise, the reduction in the number of employees in healthcare in the Murmansk Oblast and education in the Komi and Karelian Republics and the Arkhangelsk Oblast has slowed down since 2020 (e.g., Formula (29) in
Appendix H). In the first case, we are witnessing a prevalence of optimization processes in the healthcare system, and the latter case reflects a stabilization as a result of channeling the investments, which we believe were pumped in to overcome the consequences of the COVID-19 pandemic, to the retention of staff.
Another circumstance “camouflaging” the relationship between investments and employment within the region was uncovered as the authors of this article communicated with representatives of business in the territories in question. While before the mobilization activities of the Defense Ministry started in 2022, a vast majority of workers insisted on being officially employed, after the start of the mobilization it became common for workers at many enterprises to ask for being switched to working unofficially, without the social benefits or pension contributions. Thus, they are not officially registered as employees and the statistical data on this indicator are misrepresented.
Even if the accompanying (e.g., depopulation upon the closure of old enterprises and manpower demand reduction in the education and healthcare sectors) and foreign economic (administrative decisions taken by authorities in the social and economic spheres) processes have a prevalent impact on the said sectors, it is obvious that the preferential regime is part of the context of mitigating the COVID-19 pandemic and sanctioning shocks for the Arctic regions.
The results of the analysis only partially corroborate the proposed hypothesis: a statistically significant change in the relationship between trends in investments and employment is indeed seen in most of the sectors, their lists varying across the administrative regions of the Russian Arctic. This is not, however, a unidirectional change: the economic space of the Russian Arctic is currently seeing a clash between the trends of economic stagnation and depopulation in old-development territories, where enterprises of old technological modes are located, versus substantial transformation processes involving renovation of territorial infrastructure, building of new industrial facilities featuring high labor productivity, and diversification of the regional economies.
6. Discussion
The experience of applying preferential economic regimes in Russia shows that the most successful special economic zones are the SEZs located in existing logistics, industrial, financial, and administrative centers, whereas peripherally situated zones do not have tangible effects either at the level of resident enterprises or from the regional economy’s perspective (
Chichkanov and Belyaevskaya-Plotnik 2018;
Shvetsov 2018;
Leonov 2020;
Buchwald 2014;
Sosnovskikh 2017). The main hindrances to their efficiency are:
Some of these shortcomings have been overcome in Russia’s latest SEZ—the AZRF preferential regime, owing to comprehensive elaboration of resident support measures and provision of an adequate statutory framework, wide scope of the preferential regime, and relevance of the main favorable treatment measures—streamlined allocation of land for investment projects and manpower-related tax reimbursements. This effect is promoted by the relative flexibility of the preferential measures, permitting regions and municipalities to “tune” the benefit levels within their fiscal and administrative powers. However, the AZRF preferential regime’s performance assessment, as well as certain aspects of its further strategic development in combination with other preferential regimes in the AZRF (e.g., TADs, Vladivostok Free Port), have not been addressed at all. Another issue that needs to be further elaborated on within the strategic regulation framework is the emerging trend for stagnation of the residents’ planned investment size as the regime’s potential for attracting large business investments becomes depleted. These aspects, coupled with the highly specific climatic and infrastructural conditions for implementation of the preferential regime, render its mid-term performance questionable.
The effects for the regional economies detected within our study on the one side fit into the common practice of SEZ application regarding their impact on the regional labor market (
Zheng 2021;
Buba and Wong 2017;
Zeng 2016). On the other side, there are certain distinctive features, largely arising from the spatial characteristics of the Arctic territories. Thus, the increase in employment size combined with a stable form of the relationship between investments and employment in the mining sector in regions of the Russian Arctic poorly provided with infrastructure suggests that the mining specialization of Arctic regions will persist and intensify. The opinion that there is no alternative to this development alley as the mainstream for Russian Arctic territories has been expressed previously by other researchers (
Leksin and Porfiriev 2019). Now we have better grounds to argue that, apart from other effects, application of the AZRF preferential regime strengthens the mining specialization of regional economies.
Speaking of one of the key strategic objectives of AZRF development—diversification of regional economies, the trends identified here indicate that the greatest regional effect in the form of employment growth in sectors of secondary significance occurs in the commerce and construction sectors. Region-wise, this effect is the most noticeable in the areas that already have a fairly well-developed industry (such as the Arkhangelsk Oblast or Yamalo–Nenets Autonomous Okrug). In these regions, the AZRF preferential regime apparently helps maximize the multiplier effect from the development of the principal sectors and promotes the diversification of local economies. Conversely, the impact of the preferential regime on employment in peripheral and comparatively underdeveloped regions remains questionable. It becomes obvious that the lack of infrastructure (
Serova and Serova 2021), human capital (
Govorova 2018), and power capacities (
Gasnikova 2018) hinders its performance. While the preferential regime per se has not been very effective in attracting funding to infrastructural projects, it will obviously take more time and public investments in infrastructure to obtain more tangible effects in peripheral areas.
The general comparability of our results with other studies is rather limited—both considering the unique spatial characteristics of the AZRF preferential regime and because of a nearly total absence of detailed performance assessments.
A similar study focusing on a different object is reported in a paper by Belyov, Veterinarov, and Suchkova (
Belev et al. 2021). It discussed the efficacy of applying the priority development area (PDA) regime in a range of municipalities. However, the spatial scope embedded in their methodology prevented the authors from delving deep into the sector-specific features of the economic transformations. The results of our study, contrariwise, fill in this gap and are more narrowly specialized, enabling region-specific identification of the sectors significantly influenced by the application of the AZRF preferential regime. This has also formed the basis for assessing the direction of change in previously existing relationships (denoted as Δ in
Table 4).
The above-mentioned diversification trends help balance the environmental, social, and economic perspectives of territorial development. These development trends resonate with the finding of Dmitrieva and Buriy (
Dmitrieva and Buriy 2022) that the integration and balancing of the environmental, social, and economic dimensions of Arctic regions depends on the advancement of the tourism sector, technologies applied, and the quality of life. We can add that launching this process in our context requires a targeted diversification policy. A counterexample is the findings from the Murmansk Oblast, where a major social consequence of the transformation processes is a reduction in employment size (education, housing and public utilities), potentially provoking an escalation of social tension. Another exemplary case is the Republic of Karelia, where the only sector that has undergone a transformation is commerce, and a lack of transformations in a wide range of sectors is reason why a balancing of the region’s social, environmental, and economic parameters cannot be expected in the mid-term.
This opinion is shared by Raspotnik, Grønning, and Herrmann (
Raspotnik et al. 2020), who prove through cases of Arctic cities that policymaking focusing on economic efficiency leaves out the considerations of the equity of the social, environmental, and cultural development dimensions. They demonstrate that the underlying prioritization of economic efficiency in the development of northern communities will in the long run require large-scale, both private and public, investments to be channeled first of all to augmenting the local potential (a quality urban environment, energy, communications, infrastructure). A lack of such investments lays the ground for a social destabilization and intensification of out-migration, which, in turn, reduces the diversification potential. In view of this, we must remark that the deepening of the mining specialization of the regional economies of the Yamalo–Nenets Autonomous Okrug, and Krasnoyarsk Krai, Republic of Karelia, Murmansk Oblast, that we revealed within this study implies that they will remain dependent on monotown pivotal enterprises, which puts local stability in danger.
Another opinion that deserves a critical remark in view of these findings is that of Koshkin (
Koshkin 2020), who proclaimed that the preferential regime of the Russian Arctic catalyzed the development of small and medium businesses as a “social safety net”. Contrary to this opinion, a prevalent category among the projects that have generated the largest number of new workplaces in the Murmansk Oblast, Krasnoyarsk Krai, and Republics of Sakha (Yakutia) and Karelia is those connected with large investments in mining, and oil and gas processing. An intermediate position is occupied by the Arkhangelsk Oblast and the Komi Republic, where the number of new workplaces in the said spheres is relatively balanced with employment growth in services and the social sphere (mostly represented by commerce in the RNCEA) and in agriculture. The only region with full-scope application of the “social safety net” concept is the Nenets Autonomous Okrug.
Considering the substantial differentiation of the preferential regime’s effects across regions, the recommendations of Chichkanov and Belyavskaya-Plotnik (
Chichkanov and Belyaevskaya-Plotnik 2018) to work out a single set of indicators and a common approach to evaluating the performance of the preferential regime do not appear well-reasoned. What seems to be a far more reasonable approach is to give regions more freedom to choose the local concept of preferential regime implementation and to set the corresponding system of performance indicators. However, the combination of the extremely diversified space of the Russian Arctic and the limited powers of governing of decision makers at the regional and municipal levels in the field of asserting preferential measures forms a contradiction. Overcoming this contradiction is complicated by the specific structures of the budget and tax system of the Russian Federation, which limits the autonomy of territories in choosing preferential measures. Realizing that a significant restructuring of these systems is unlikely to be possible in the near future, the most appropriate solution is to introduce additional compensation measures and funds at the level of the whole macroregion. For example, creation of an Arctic Investment Fund would allow more flexible implementation of preferential measures at the regional level in accordance with the economy specialization of the regions and the strategic expediency of their development.
7. Conclusions
The preferential regime of the Russian Arctic is the latest SEZ format in Russian history. What makes this experiment unique is the huge geographical scope of this special Arctic regime as well as the highly differentiated and unfavorable spatial conditions for its implementation. The latter is predicated on the climatic, infrastructural, and demographic features of Russian Arctic territories. An additional and rather serious challenge for the implementation of this governance mechanism is that it was designed when the full magnitude of the global shocks of recent years, driven by the consequences of the COVID-19 pandemic and geopolitical tensions, was not yet foreseeable. As a result, along with its accumulative and stimulatory function, the AZRF preferential regime took on the role of a supporting and restorative mechanism for the highly unstable socio-ecological economic systems of the Russian Arctic.
The study presented above is of both academic and applied value. It is for the first time in scientific literature that the trends and indicators of the AZRF preferential regime are thoroughly examined relying on a basis sufficient for such an analysis. The three-year period (starting July 2020) is long enough for making a well-grounded assessment of both the trends in its implementation and its impact on regional economies within the Arctic Zone of the Russian Federation. Thus, this study bridges the research gap in this subject area and supplements the scientific knowledge of preferential regimes and their diversity worldwide.
The applied value of this study is that it provides a well-grounded assessment of the impact of the AZRF preferential regime, as a management mechanism, on the economies of Russian Arctic regions. Our results serve as an analytical background for future adjustment and tuning of preferential measures at all government levels: municipal, regional, and federal. Considering the overall slow-down of the inflow of new investments caused both by a depletion of the preferential regime’s potential to attract investors as well as by the increased technological, financial, marketing, and other risks for new and ongoing projects, it appears advisable to establish a contingency co-financing facility for the Arctic projects of AZRF residents, designed to compensate for the increased costs incurred by investors in the situation of macroeconomic and geopolitical instability. Such a facility would improve the survival rate of AZRF residents’ projects and additionally promote a comprehensive development of Arctic spaces, creation of new workplaces, and growth of the tax revenues of local and regional budgets.
This study has demonstrated that the preferential economic regime produced a notably differentiated effect on investment and employment trends across regions. The number of projects and new workplaces was the highest in old-development regions (Arkhangelsk Oblast and Murmansk Oblast), where a dense transport and social infrastructure was already in place and the related costs of project implementation were not so high. The effects of the preferential regime in peripheral Arctic areas of Asian Russia are limited, notwithstanding the fact that their development in the framework of the macroregion’s economic space integration is prioritized in policymaking.
The reasons for the change in the form of the relationship between the amount of investments and employment size in some study objects are:
Attainment of thresholds in parameters of the socio-economic system, after which its stability is shattered (Mining in the Komi Republic, Education in the Murmansk Oblast);
Attainment of the threshold of investment impact on employment under the existing resource constraints on development (first of all the limited human capital) (the logistics and transport industry in the Nenets Autonomous Okrug, agriculture in the Arkhangelsk Oblast);
Prevalence of the tendency to enhance labor productivity and optimize employment size over the tendency to create new workplaces (manufacturing in the Arkhangelsk Oblast).
To maximize the preferential regime’s effects in such cases and to ensure that the areas develop sustainably in the long run, a major revision of the regulatory measures and the regional economic policy will be needed.
Our results suggest that in the current macroeconomic conditions the potential of the preferential regime for business activities in the AZRF to attract large investors is becoming depleted. Yet, it will in the foreseeable future continue to play a supporting role in augmenting the multiplier effect from large-scope projects and will contribute to the creation of new workplaces in the service industries.
Although this study contributes significantly to scientific research in this subject area, there are also certain limitations. They are chiefly related to the quality of the input statistical data, which leaves much to be desired in terms of sector-specific details and does not permit the desired focused analysis to be carried out for individual types of economic activity. The source data on AZRF residents also have a peculiarity, being grouped in a form somewhat different from the official statistical information. The direct comparability of data from the said sources is thus limited. The analysis of some effects on regional economies (creation of infrastructure, GRP dynamics, and some others) will be the subject of further research because of the delayed nature of these effects and a certain time lag in the availability of statistical information.
Overall, this study throws light upon the tendencies in the operation of this uncommon and unique preferential regime whose success is not at all obvious. Nonetheless, the AZRF preferential regime is already playing a weighty supporting role in the economic crisis circumstances, which, however, is insufficient for overcoming the negative social and demographic trends in Russia’s Arctic macroregion.
The prospects for further research in this subject area lie in exploring a wider spectrum of regional effects from the introduction of the Russian Arctic preferential regime. This future study will become possible when a sufficient factual basis is available. We posit that special emphasis in such a study should be placed on comparing the economic performance indicators and development trends of “AZRF residents” and other enterprises located in the same spatial conditions.


 ,
, 

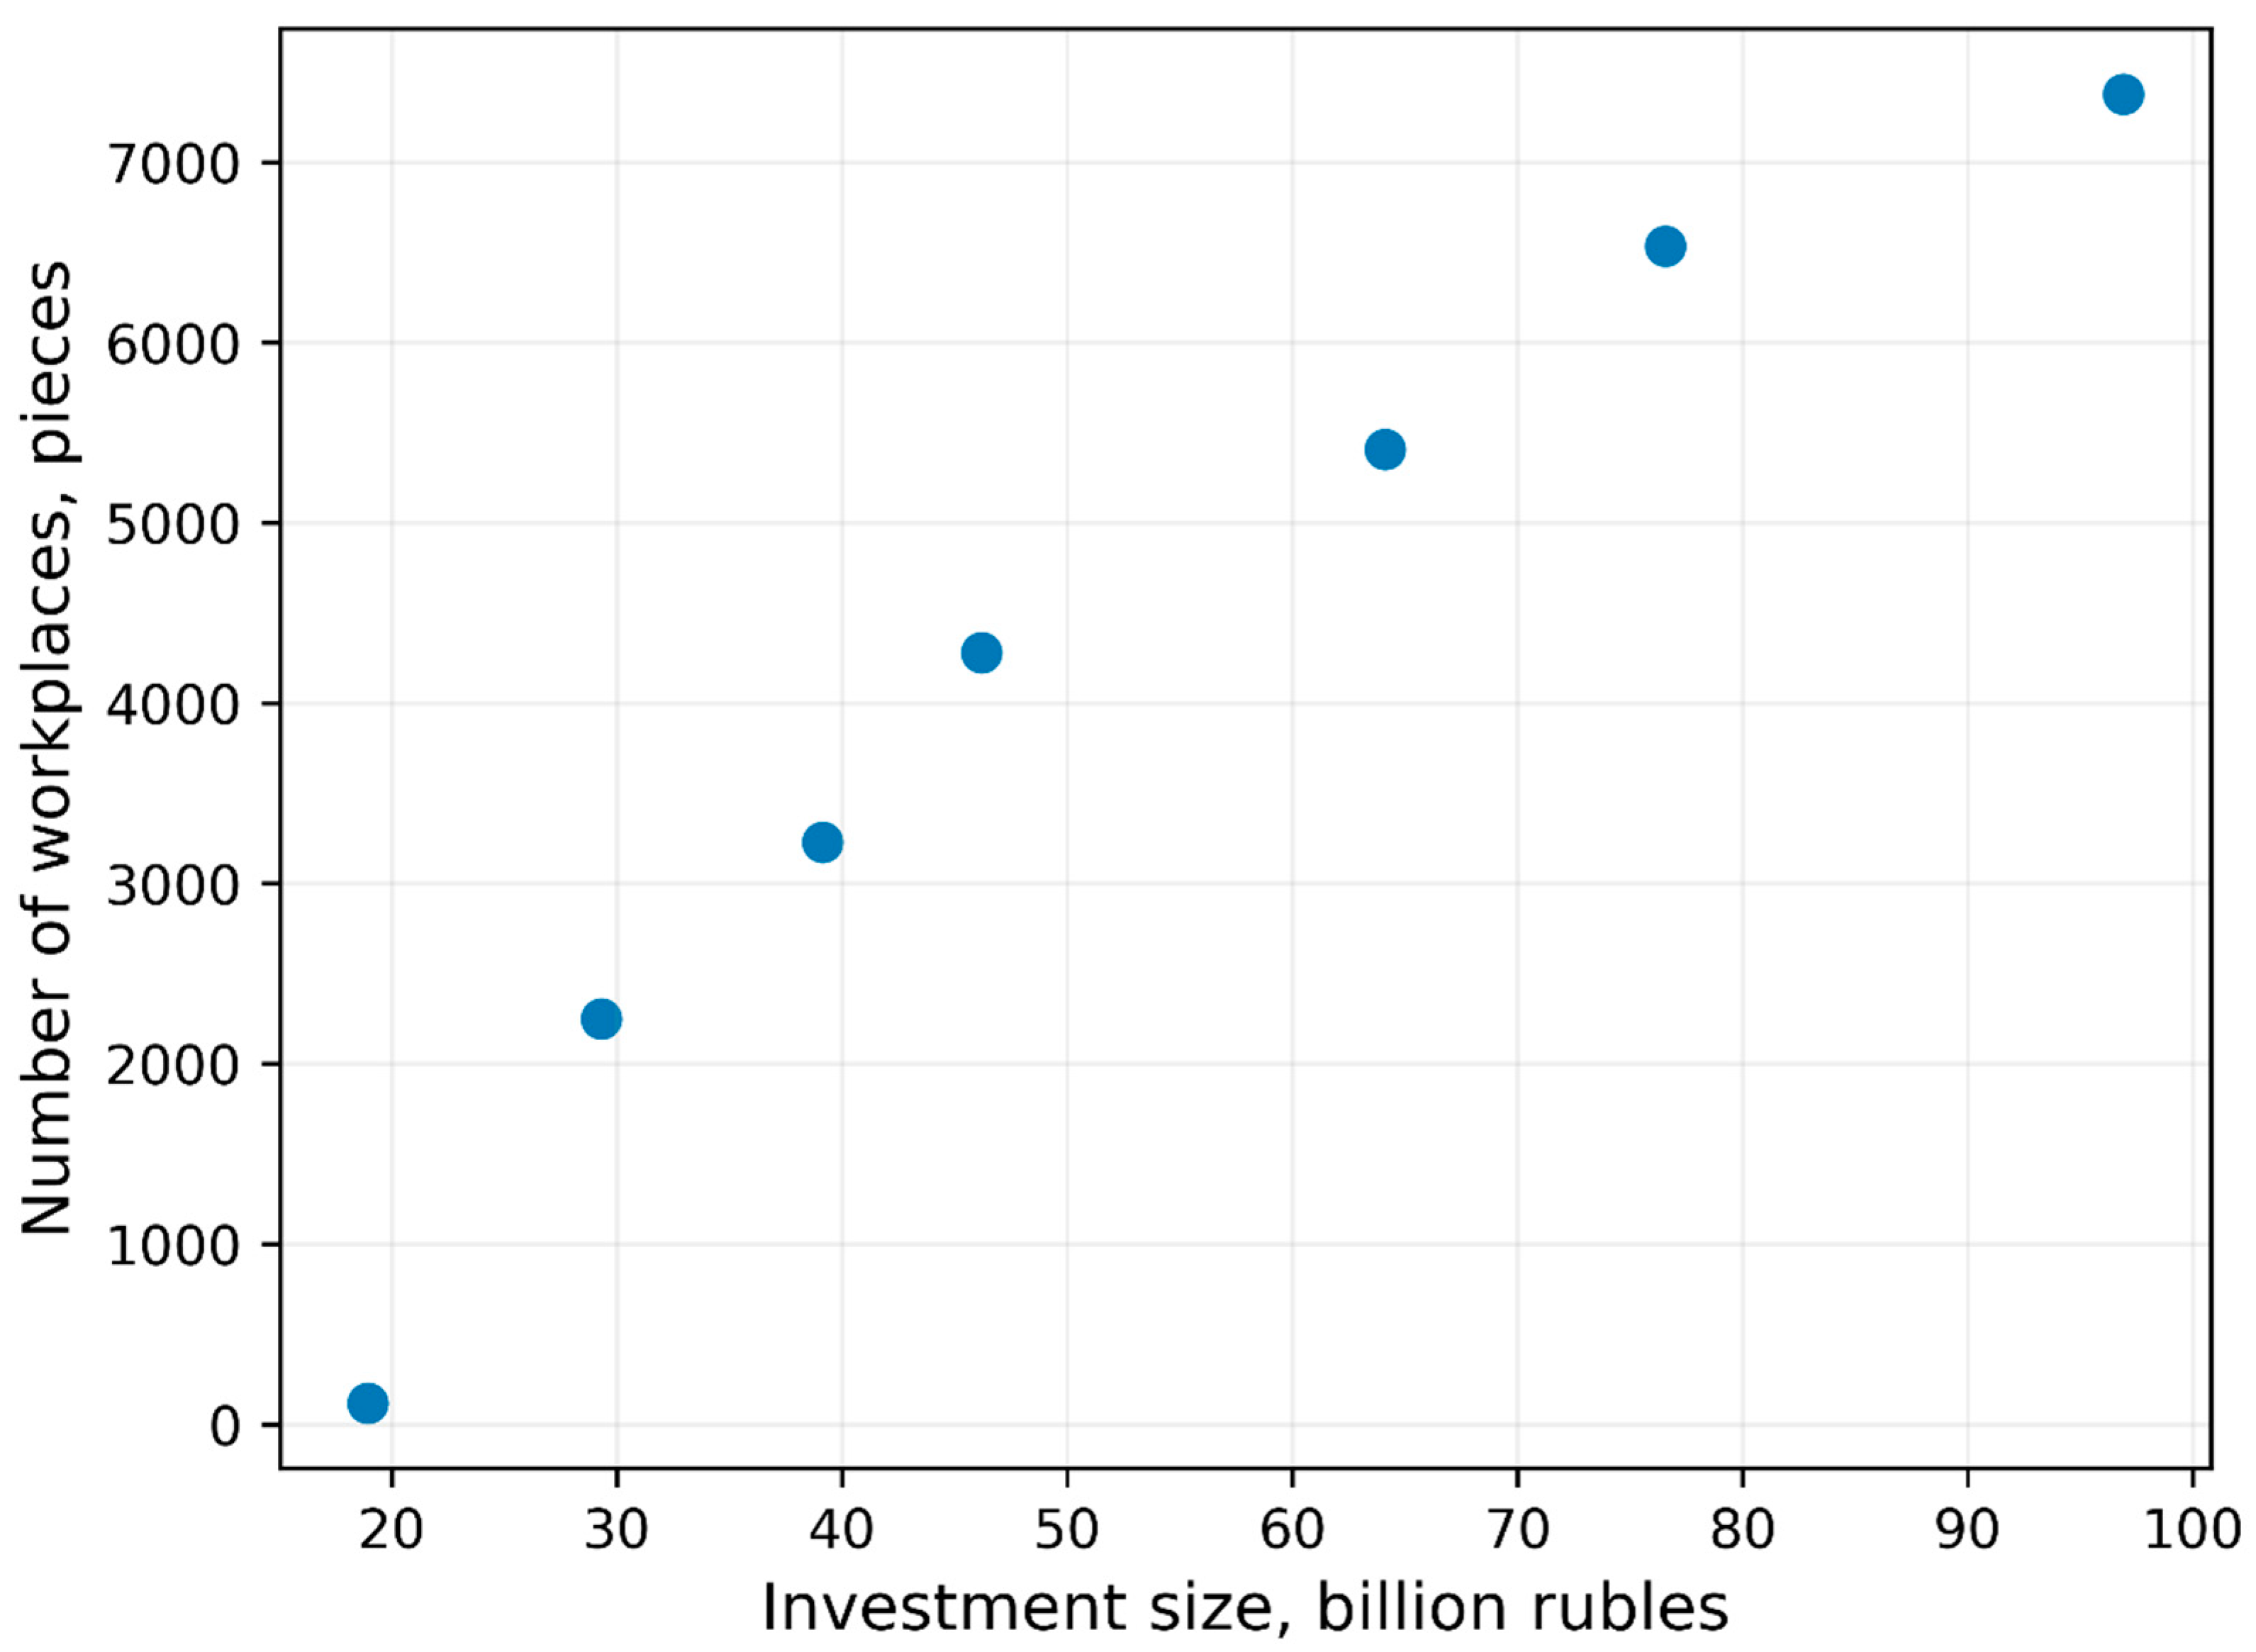
