Article

Change Point Analysis of Time Series Related to Bitcoin Transactions: Towards the Detection of Illegal Activities

by
Ourania Theodosiadou
*,
Alexandros-Michail Koufakis
,
Theodora Tsikrika
,
Stefanos Vrochidis
and
Ioannis Kompatsiaris
Information Technologies Institute, Centre for Research and Technology Hellas, 57001 Thessaloniki, Greece
*
Author to whom correspondence should be addressed.
J. Risk Financial Manag. 2023, 16(9), 408; https://doi.org/10.3390/jrfm16090408
Submission received: 17 July 2023 / Revised: 31 August 2023 / Accepted: 8 September 2023 / Published: 13 September 2023
(This article belongs to the Special Issue FinTech, Blockchain and Cryptocurrencies)

Abstract

:
This paper proposes a unified framework for the detection of statistically significant changes in time series related to Bitcoin transactions. The time locations of these changes are linked to the occurrences of events which could be further investigated aiming to reveal potential illicit activity. The proposed framework includes: (a) the extraction of 28 features of interest in the form of time series from the Bitcoin transaction history; (b) the selection of features among the extracted ones based on the Partition Around Medoids clustering approach; and (c) the change point analysis of the multivariate time series which is formulated by the medoid time series of each cluster. This analysis enables the identification of structural breaks in the underlying behavior of the time series of interest at certain time points. The proposed framework is applied on the Bitcoin transactions of two entities that have been involved in illicit activities, namely Pirate@40, who orchestrated a high-yield investment programme, and the MintPal Bitcoin exchange platform that was hacked. The analysis results indicate that the estimated change points can be linked to certain event occurrences which may affect the transaction activity and could be further investigated for potential links to illicit actions.

1. Introduction

Bitcoin has known meteoric rise in its popularity since its creation in 2008, constituting a lucrative market reaching up to more than USD 1.2 trillion1 over the years. In contrast to traditional currencies, Bitcoin does not rely on administrative institutions, such as banks, to ensure trust, but rather on the transparency of its transactions. All Bitcoin transactions are stored on the blockchain, a distributed ledger technology, and are publicly available. However, despite its inherent transparency, Bitcoin offers pseudo-anonymity to its users since Bitcoin transactions are not linked to entities but to Bitcoin addresses; thus, there is no direct connection to the entities that participate to the transactions. Due to this characteristic, as well as the ease of access it offers, Bitcoin has been used for a number of illicit activities, ranging from Ponzi schemes to black markets (see, for example, Sándor and Fehér 2019).
Bitcoin forensics capitalise on the vast amount of available transaction data in the blockchain (more than 480 GB of transactions accumulated to date2) with the goal to detect illicit activities. Such approaches typically analyse Bitcoin transactions by extracting several features aiming to determine whether they are related to criminal actions. The majority of existing methods employ classification models to infer whether an address is involved in illicit activities by extracting static features, i.e., without considering the evolution over time (Oliveira et al. 2021; Ranshous et al. 2017; Toyoda et al. 2017; Yang et al. 2022). In particular, most commonly, the whole timeline of transactions related to an address is summarised into static features; for example, the transaction volume of an address over the whole activity duration is typically summarised into a single value (Farrugia et al. 2020; Lin et al. 2019; Toyoda et al. 2017, 2018a, 2019). However, this approach fails to capture the dynamic evolution of features of interest over time, which may add further valuable insights to the analysis of the history of transactions, thus enabling additional inferences regarding specific addresses and transactions in real time and not only retrospectively.
This paper focuses on the analysis of temporal features extracted from a Bitcoin transaction history enabling the use of time series analysis approaches to identify changes in the temporal behaviour. In particular, our work proposes a framework for the detection of time locations in the time series of features extracted from Bitcoin transactions that may signify the occurrence of events in which further attention should be paid to. This approach could serve as a digital forensics tool for the analysis of Bitcoin transactions assisting in the identification of possible causes that may have affected the transaction activity.
The proposed framework comprises three steps. At first, several features (namely 28 features) are extracted from the transaction history on a wallet basis aiming to capture as much information as possible about these transactions and add further value to the analysis. The values of the features are aggregated at specific time steps resulting in the depiction of their dynamic evolution and the creation of time series. Then, the relevant time series are grouped into clusters in order to perform feature selection and remove overlapping information. Finally, the medoids of the formulated clusters constitute the input to the change point analysis method so as to estimate time locations of statistically significant changes in a multivariate time series; this analysis enables the identification of potential relationships between time locations and event incidents that could have influenced the changes observed in the transaction activity. Moreover, the use of a multivariate change point detection (CPD) approach compared to a univariate one allows the exploitation of possible correlations that may exist between the different features.
To the best of our knowledge, this is the first work that enables the use of change point analysis approaches in temporal features extracted from Bitcoin transactions with the goal to estimate the time instances where significant changes occur in the evolution of the time series of interest. The proposed framework covers the whole pipeline from feature extraction and selection, up to the final implementation of the multivariate CPD. The applicability of the proposed framework is evaluated by analysing two notable Bitcoin entities: Pirate@40, who was involved in a high-yield investment programme (HYIP) scam, and the MintPal exchange platform that was hacked. Of course, it can be applied to any other crypto entity, apart from Bitcoin. The analysis results are promising as the effectiveness of the proposed framework is justified by succeeding in the detection of structural breaks in the time series of interest of both entities at time locations which are related to incidents that are worthy of further attention and may be linked to illicit actions.
The remainder of the paper is structured as follows: Section 2 presents the related work with particular focus on time series analysis applied on cryptocurrency data, as well as methods used for classifying addresses involved in crypto transactions as illicit. Section 3 details the proposed framework, while Section 4 showcases its applicability. In Section 5, the results are discussed, and, finally, Section 6, summarises the main findings and provides directions for future work.

2. Related Work

Time series analysis approaches have been widely applied on cryptocurrency data aiming at the fitting of models and the provision of forecasts related to their prices. In Azari (2019), the autoregressive integrated moving average (ARIMA) model has been applied to predict the future value of Bitcoin by using the closing prices of a three-year period starting from 1 September 2015. This work indicated that the proposed model is effective over sub-periods in which the relevant time series has an unchanged trend, especially for short-term predictions. The ARIMA forecast is compared with a long short-term memory (LSTM) approach described in Fleischer et al. (2022); McNally et al. (2018). In these cases, the LSTM model achieves a better accuracy compared to the ARIMA one, having the tradeoff of longer execution time. Comparative studies about the use of time series analysis approaches in predicting crypto prices can be found in Ibrahim et al. (2021) and Tan and Kashef (2019). An important feature that can be taken into consideration when modelling the time series of crypto prices is the existence of time varying volatility. For this purpose, generalized autoregressive conditional heteroskedasticity (GARCH) models have been used to fit the relevant time series. For example, in Chu et al. (2017) twelve GARCH-type models are fitted to seven cryptocurrencies (i.e., Bitcoin, Dash, Dogecoin, Litecoin, Maidsafecoin, Monero, and Ripple) and the goodness of fit is assessed using information criteria that utilise the likelihood function of the data based on the different models, such as the Akaike information criterion (AIC) and the Bayesian information criterion (BIC).
The detection of illicit activities from cryptocurrencies has been studied focusing mainly on approaches where static features are extracted from the cryptocurrency transactions, i.e., features that do not capture variation over time. Toyoda et al. (2017, 2019) studied the identification of a type of fraudulent investment program called high-yield investment programmes (HYIPs) by analysing Bitcoin transactions. They classified Bitcoin addresses as HYIP-related using the XGBoost and random forest methods on a limited number of static features, such as frequency of transactions, number of total transactions, and the mean value of addresses per transaction. Moreover, they utilised an address clustering methodology based on heuristics that allows for multiple addresses to be grouped based on ownership. The same authors followed a similar approach in Toyoda et al. (2018a) to classify Bitcoin addresses into multiple usage types (i.e., Exchange, Faucet, Gambling, HYIP, Marketplace, Mixer, and Mining pool) formulating a multi-class problem compared to the previous binary classification. In addition, Farrugia et al. (2020) studied the detection of illicit addresses from Ethereum blockchain transactions. They extracted 42 static features and used XGBoost to classify the addresses as normal or illicit. Finally, Lin et al. (2019) extracted static features along with four new “transaction moments” in a multi-class classification problem. These moments summarise the transactions distribution into singular values which represent the mean, variance, skewness, and kurtosis of the transactions.
Another approach for detecting illicit activities with static features is to use graph analysis methodologies. For example, Ranshous et al. (2017) modelled Bitcoin transactions as a hypergraph and identified graph motifs. Additionally, they extracted graph-based statistical features (e.g., out-degree, total in-weight, etc.) that were used in their classification model as exchange addresses that are possibly involved in money laundering/Bitcoin mixing. Oliveira et al. (2021) proposed GuiltyWalker, a method that performs random walks on a Bitcoin address network and extracts features based on the distance from illicit nodes. Subsequently, they used the graph features along with other static ones to classify the addresses as illicit or not. Yang et al. (2022) generated four-hop subgraphs for specific time periods along with a set of features for each subgraph. Subsequently, they aggregated the features (using e.g., average, max) and employed them in a classification task with the labels: Gambling, Darknet Market, and Tumbler.
One avenue to enrich the Bitcoin transaction features is to consider how they change over time allowing for the exploitation of dynamic features. By doing so, the temporal component of the features is captured and the use of time series analysis approaches is enabled. For example, Toyoda et al. (2018b) extracted four dynamic features on Bitcoin transactions of a known HYIP operator and constructed the corresponding time series. They used a sliding window of seven days with one day shift for the calculation of the features. Then, an anomaly score based on principal component analysis was calculated per time step based on the relevant dynamic features. Li et al. (2020) also extracted temporal features in order to identify illicit addresses. They initially constructed some temporal structures from time series and subsequently used an LSTM auto-encoder to codify them into discriminative temporal features. They combined the temporal features with static and topological ones to classify the addresses as illicit or not. Finally, Weber et al. (2019) combined temporal, graph, and static features to classify addresses as illicit in a binary classification problem. They divided the time horizon into multiple time steps and extracted features for each step akin to forming time series.
Our work also focuses on the exploitation of dynamic features related to crypto transactions in order to gain further insights to the transaction history. Particularly, the adopted approach presents a unified framework for revealing possible links between time locations and event occurrences that may have triggered changes in transaction activity, providing digital forensics practitioners a tool to identify possible trends and patterns that could reveal illicit actions. Towards this direction, a multivariate change point detection method is used to analyse the dynamic evolution of features of interest and identify changes that may indicate the occurrence of events, where further attention should be paid to. Our approach shares some similarities with the work of Toyoda et al. (2018b). In particular, both approaches aim to detect behaviour irregularities by extracting temporal features from cryptocurrency transactions. Moreover, the applicability of both methods is illustrated using the Pirate@40 transactions. However, the two works exhibit also distinct differences. More specifically, in our approach the list of extracted features is expanded (i.e., 28 features compared to 4) in order to capture a more comprehensive overview of the transaction activity. Due to the extended list of features, we add a feature selection step so as to eliminate the overlapping information and reduce the computational cost of the analysis. Moreover, we proceed with the analysis of the time series of interest via a change point detection method instead of an anomaly score algorithm. Finally, we apply our approach on the whole Pirate@40 dataset and not a part of it, compared to Toyoda et al. (2018b), as well as on the MintPal transactions.

3. Materials and Methods

This section describes the steps of the proposed change point detection (CPD) framework for the identification of statistically significant change points in the history of Bitcoin transactions that may be linked to the occurrences of events which should be further analysed (e.g., in the context of digital forensics). In particular, Section 3.1 describes the methodology for the extraction of 28 time series features from the Bitcoin transaction history. Then, Section 3.2 presents the approach that is followed for selecting features among the extracted ones based on the clustering of the relevant time series. Finally, Section 3.3 describes the CPD algorithm that is used for the estimation of statistically significant changes in the multivariate time series of interest that is formulated by the selected features. Figure 1 illustrates the overview of the proposed framework.

3.1. Feature Extraction

The proposed framework takes as input the wallet transactions of an entity of interest. A wallet in this context is defined as a set of Bitcoin addresses that are associated with a single entity. The wallet transactions can provide a better overview of the activity of an entity compared to individual addresses, since the latter ones are typically used only temporarily. In the context of this work, wallet transactions were used as extracted by the website www.walletexplorer.com (accessed on 14 July 2023).
In order to simplify the wallet transactions, the amounts that originate and end up at the same wallet are ignored; the same approach was also followed in Toyoda et al. (2018b). For example, if addresses A, B, and D (see Figure 2) are known to belong to the same wallet, then the amount 0.6 can be ignored since it ends up at the same wallet from which it originated.
Typically, the majority of addresses are not directly associated with an entit; however, there are some heuristic methods that can infer the addresses used by the same entity. In particular, these heuristics are used in a process called address clustering, which starts from a limited number of addresses and identifies addresses that are likely to belong to same entity based on their interactions. For example, Figure 3 shows a transaction where Address A is co-spending with Address B; this indicates that likely both addresses A and B are controlled by the same entity. In the context of this work, no further address clustering took place; for an overview of address clustering methods, please see the work of Zhang et al. (2020) and He et al. (2022).
Once the addresses used by the same entity are aggregated into a wallet, the features listed in Table 1 are extracted from the corresponding transactions. The values of each feature are calculated at certain time steps (e.g., once per day) in order to generate the respective time series that capture the evolution of the wallet activity over time. The = r e c e i v e d ( s p e n t ) keyword defines the transactions where the wallet of interest is on the receiving (spending) end of a transaction. The c o i n b a s e transactions are incentives/fees rewarded to Bitcoin miners. The conversion from BTC to USD is made according to the price of BTC in the specific period in order to account for the volatility of the BTC price. Features 1, 2, 3, and 4 have been also used by Toyoda et al. (2018b) in the form of time series. Weber et al. (2019) do not mention explicitly all the features that they used; thus, we can only confirm the use of features 10 and 11 by them. To the best of our knowledge, the rest of the features have only been used in static approaches (e.g., by Lin et al. 2019) and not in the form of time series.

3.2. Feature Selection

This section describes the second step in the proposed framework corresponding to the selection of features among the extracted ones that will eventually contribute to the construction of the input in the multivariate change point detection algorithm.
We propose to perform feature selection for the following reasons. First, given the list of extracted features presented in Table 1, the proposed approach will need to generate 28 time series from the transactions’ history data to be used as the multivariate time series input in the change point detection algorithm. In cases where this is further combined with time series of significant length, then the computational cost and execution time of the change point analysis will increase substantially; this may also hinder the real time application of the proposed approach. Therefore, aiming to reducing such computational costs, we aim to keep only the time series that provide further information to the gathered intelligence and remove the ones that share similar characteristics, thus eliminating the overlapping information.
Our approach towards feature selection is based on time series clustering. In other words, the constructed time series based on the extracted features are organised into homogeneous groups, and then, the centre of each group is used to contribute to the formulation of the input for the multivariate change point analysis. In our case, the Partition Around Medoids (PAM) clustering algorithm is used for the clustering of time series. This method aims to find a set of representative objects, called medoids, and then assigns each object of the data to the closest representative object; a detailed presentation of the algorithm is provided in Kaufman and Rousseeuw (2009).
Since time series data represent the values of a feature that change over time, the dynamic time warping (DTW) distance is used to identify the similarity between the different time series. This distance allows to identify similarities between time-shifted time series compared to other distances (e.g., Euclidean distance, Mikowski distance, etc.) which are more suitable for static data. In particular, the DTW algorithm aims to compare two time series and find the minimal path between them in terms of overall cost. Given two time series X = ( x 1 , x 2 , , x N ) and Y = ( y 1 , y 2 , , y M ) , a warping path is a sequence p = ( p 1 , , p l ) with p l = ( n l , m l ) [ 1 : N ] × [ 1 : M ] for l [ 1 : L ] satisfying the following conditions (see for example Müller 2007):
  • Boundary condition: p 1 = ( 1 , 1 ) & p l = ( N , M ) ;
  • Monotonicity condition: n 1 n 2 n L & m 1 m 2 m L ;
  • Step size condition: p l + 1 p l { ( 1 , 0 ) , ( 0 , 1 ) , ( 1 , 1 ) }, l [ 1 : L 1 ] .
The total cost (in essence total distance) c p ( X , Y ) of a warping path p between X and Y is defined as
c p ( X , Y ) = l = 1 L c ( x n l , y m l ) .
Then, the DTW distance between X and Y is defined as the total cost of the optimal warping path p * in terms of minimal total cost among all possible warping paths, i.e.,
D T W ( X , Y ) = c p * ( X , Y ) = m i n { c p ( X , Y ) | p is a warping path } .
In order to find the optimal warping path, dynamic programming is used based on the following formula:
D T W ( i , j ) = c ( x i , y j ) + m i n { D T W ( i 1 , j 1 ) , D T W ( i 1 , j ) , D T W ( i , j 1 ) }
where D T W ( i , j ) is the distance between ( x 1 , x 2 , , x i ) and ( y 1 , y 2 , , y j ) with the best alignment, and c ( x i , y j ) is a distance between the two elements x i , y j . Also, it is assumed that D T W ( i , 0 ) = , D T W ( 0 , j ) = and D T W ( 0 , 0 ) = 0 .
Regarding the estimation of the number of clusters, a validation approach is adopted based on the compactness and the separation of the formulated groups corresponding to different number of clusters. To implement such an internal clustering validation, several clustering validity indices (CVIs) could be used namely the Dunn index (Dunn 1973), the Silhouette index (Rousseeuw 1987), the Davies–Bouldin index (Davies and Bouldin 1979), etc. Arbelaitz et al. (2013) performed an extensive comparative study of CVIs and illustrated that there is no single CVI that clearly outperforms the others, although they observed that the Silhouette index achieves the best results in many contexts. Given the above and since there is no strong evidence in favour of a single CVI, we opted to use the Silhouette index, which has also been used by Abbasimehr and Shabani (2021) and Puspita and Zulkarnain (2020) in the context of time series clustering, hence selecting the number of clusters that maximises its value.

3.3. Change Point Detection

The last step of the proposed framework corresponds to the implementation of a multivariate change point analysis. Change point detection (CPD) methods are applied to time series data aiming to estimate the time points of structural breaks in the evolution of the time series; this can be performed for either univariate or multivariate time series. Since various features are extracted in this work in the form of time series, the multivariate approach is adopted aiming to exploit also the possible correlations that may exist among the time series of interest.
In our case, the multivariate change point detection algorithm presented in Matteson and James (2014) is used, which is also nonparametric and is based on the E-Divisive method. Let X n = { X i : i = 1 , 2 , , n } and Y m = { Y j : j = 1 , 2 , , m } be independent identical distributed samples from the distribution of X and Y R d , respectively, such that E | X | α , E | Y | α < for some α ( 0 , 2 ) . An empirical divergence measure is defined as follows:
ε ^ ( X n , Y m ; a ) = 2 m n i = 1 n j = 1 m | X i Y j | a n 2 1 1 i < k n | X i X k | a m 2 1 1 j < k m | Y j Y k | a ,
a ( 0 , 2 ) . For the detection of a single change point, a scaled sample measure of the above divergence measure is defined as
Q ^ ( X n , Y m ; a ) = m n m + n ε ^ ( X n , Y m ; a ) , a ( 0 , 2 )
Let Z 1 , Z 2 , , Z T R d be an independent sequence of observations, and let 1 τ < κ T be constants, where T denotes the length of the time series of observations. The sets X τ = { Z 1 , Z 2 , , Z τ } and Y τ ( κ ) = { Z τ + 1 , Z τ + 2 , , Z κ } are defined, and a change point location τ ^ is estimated as
( τ ^ , κ ^ ) = a r g m a x ( τ , κ ) Q ^ ( X τ , Y τ ( κ ) ; a )
To estimate multiple change points, the above technique is iteratively applied. Suppose that k 1 change points have been estimated at time locations 0 < τ ^ 1 < < τ ^ k 1 < T . These partition the observations into k clusters C ^ 1 , , C ^ k , such that C ^ i = { Z τ ^ i 1 + 1 , , Z τ ^ i }, in which τ ^ 0 = 0 and τ ^ k = T . Given these clusters, the procedure for finding a single change point is applied to the observations within each of the k clusters. The corresponding test statistic for the kth estimated change point is given by the relation q ^ k = Q ^ ( X τ ^ k , Y τ ^ k ( κ ^ k ) ; a ) , where τ ^ k = τ ^ ( i ) denotes the kth estimated change point located within cluster C ^ i and κ ^ k = κ ^ ( i ) the corresponding constant. Moreover, a permutation test is used to determine the statistical significance of each change point (p-value) under the null hypothesis of no additional change points (R random permutations are performed). First, the observations within each cluster are permuted to create a new sequence of length T. The estimation process is then implemented again for the detection of change points in the permuted observations. This process is repeated, and after the lth permutation of the observations, the test statistic q ^ k ( l ) is recorded. An approximate p-value of the kth estimated change point is defined as
# { l : q ^ k ( l ) q ^ k } / ( R + 1 )
An overview of the process that is followed for the change point analysis of a time series of interest is illustrated in Figure 4. Once a change point location is estimated, the time series is partitioned into two clusters of observations. Then, the procedure for finding change points is iterated in each one of the formulated clusters, resulting in further segmentation of the time series. The algorithm terminates when no further statistically significant change points are identified. The statistical significance of a change point is determined via a permutation test, as described above.
Overall, the proposed change point analysis method provides a tool for retrospectively detecting statistically significant changes in a multivariate time series. When considering historic data that are related to Bitcoin transaction history, the time locations of the estimated change points could be linked to the occurrence of events that may have triggered the changes, and could be further investigated aiming to identify potential illicit activities. Finally, the application of the CPD method into multivariate data also allows the exploitation of possible correlations that may exist between the different features that will formulate the multivariate input to the CPD algorithm capturing more information about the changes.

4. Results

This section presents the results derived by the application of the proposed framework to two different datasets containing Bitcoin transactions that were linked to illicit activities: Pirate@40, who was involved in a high-yield investment programme (HYIP) scam, and the MintPal exchange platform that was hacked.

4.1. Experimental Setup

To showcase and evaluate the applicability of the proposed change point detection framework in identifying potential illicit addresses in Bitcoin transactions, two high profile Bitcoin entities, which involved illicit activities and their timeline was covered in news outlets, social media, and Web forums have been selected. The effectiveness of the proposed method is validated by its capability to identify statistically significant changes in the evolution of the selected time series of features at time points which can be linked to occurrences of events that may indicate the existence of illicit actions; this validation method has been followed due to the absence of ground truth about the time locations of the statistically significant changes in the time series of interest. Within a different context, a similar approach is included, for example, in Gerlach et al. (2019) regarding a bubble analysis of the Bitcoin to USD price dynamics from January 2012 to February 2018. Also, Theodosiadou et al. (2021) adopts analogous approach in the context of detecting change points in terrorism-related online content. Next, we describe the two Bitcoin entities that have been analysed.
The first entity was a user with the nickname Pirate@403; this entity was also analysed by Toyoda et al. (2018b). Pirate@40 orchestrated a kind of a Ponzi scheme—a high-yield investing programme (HYIP) scheme. Such schemes offer absurdly high interest rates in order to lure new investors, while they use new investments to pay out earlier ones. Pirate@40 started his scheme in November 2011 gradually offering up to 7% interest per week. He mainly operated in the www.BitcoinTalk.org (accessed on 14 July 2023) forum where he advertised the high interest rates that were promised to reach up to 11%. He progressively amassed investors until the beginning of August 2012 when he announced a reduction in the interest rate to 3.9%. Later in the same month he declared default, and as a result, he was charged for the misappropriation of about 146,000 Bitcoin out of the total 764,000 that were raised over the whole scheme’s life cycle4. The total amount corresponded to approximately USD 4,500,000 based on the average Bitcoin price at that period.
The second entity for evaluation is the MintPal5 cryptocurrency exchange platform; to the best of our knowledge, this entity has not been previously analysed. MintPal provided exchange services between cryptocurrencies and fiat money. Moreover, it provided cryptocurrency wallet services for its customers that were entrusting the platform with their crypto assets. MintPal was founded in February 2014 and gradually became a popular exchange platform that traded on multiple crypto assets (including Bitcoin). On 13 July 2014, the platform was hacked and 8,000,000 Vericoin (valued USD 2,000,000) were stolen. Notably, the Vericoin community decided to rollback the blockchain to a point before the hack, effectively annulling the stolen Vericoins. Despite that, a few months after the hack, the Mintpal platform was sold to the digital currency service provider Moolah Ltd. (London, UK). The expressed intent was to use MintPal as the major altcoin exchange platform of Moolah. The merging of the two companies was plagued with technical difficulties, and finally, on October 2014, more than 3700 Bitcoins went missing. Unlike the first incident, in this case the stolen amount was not able to be restored, resulting in losses equivalent to USD 1,500,000 at that period. Contrary to the first hacking incident, the events on October 2014 were attributed to Moolah’s CEO, who participated in the merging of the two companies.
The datasets of the two entities were retrieved from the Wallet Explorer website
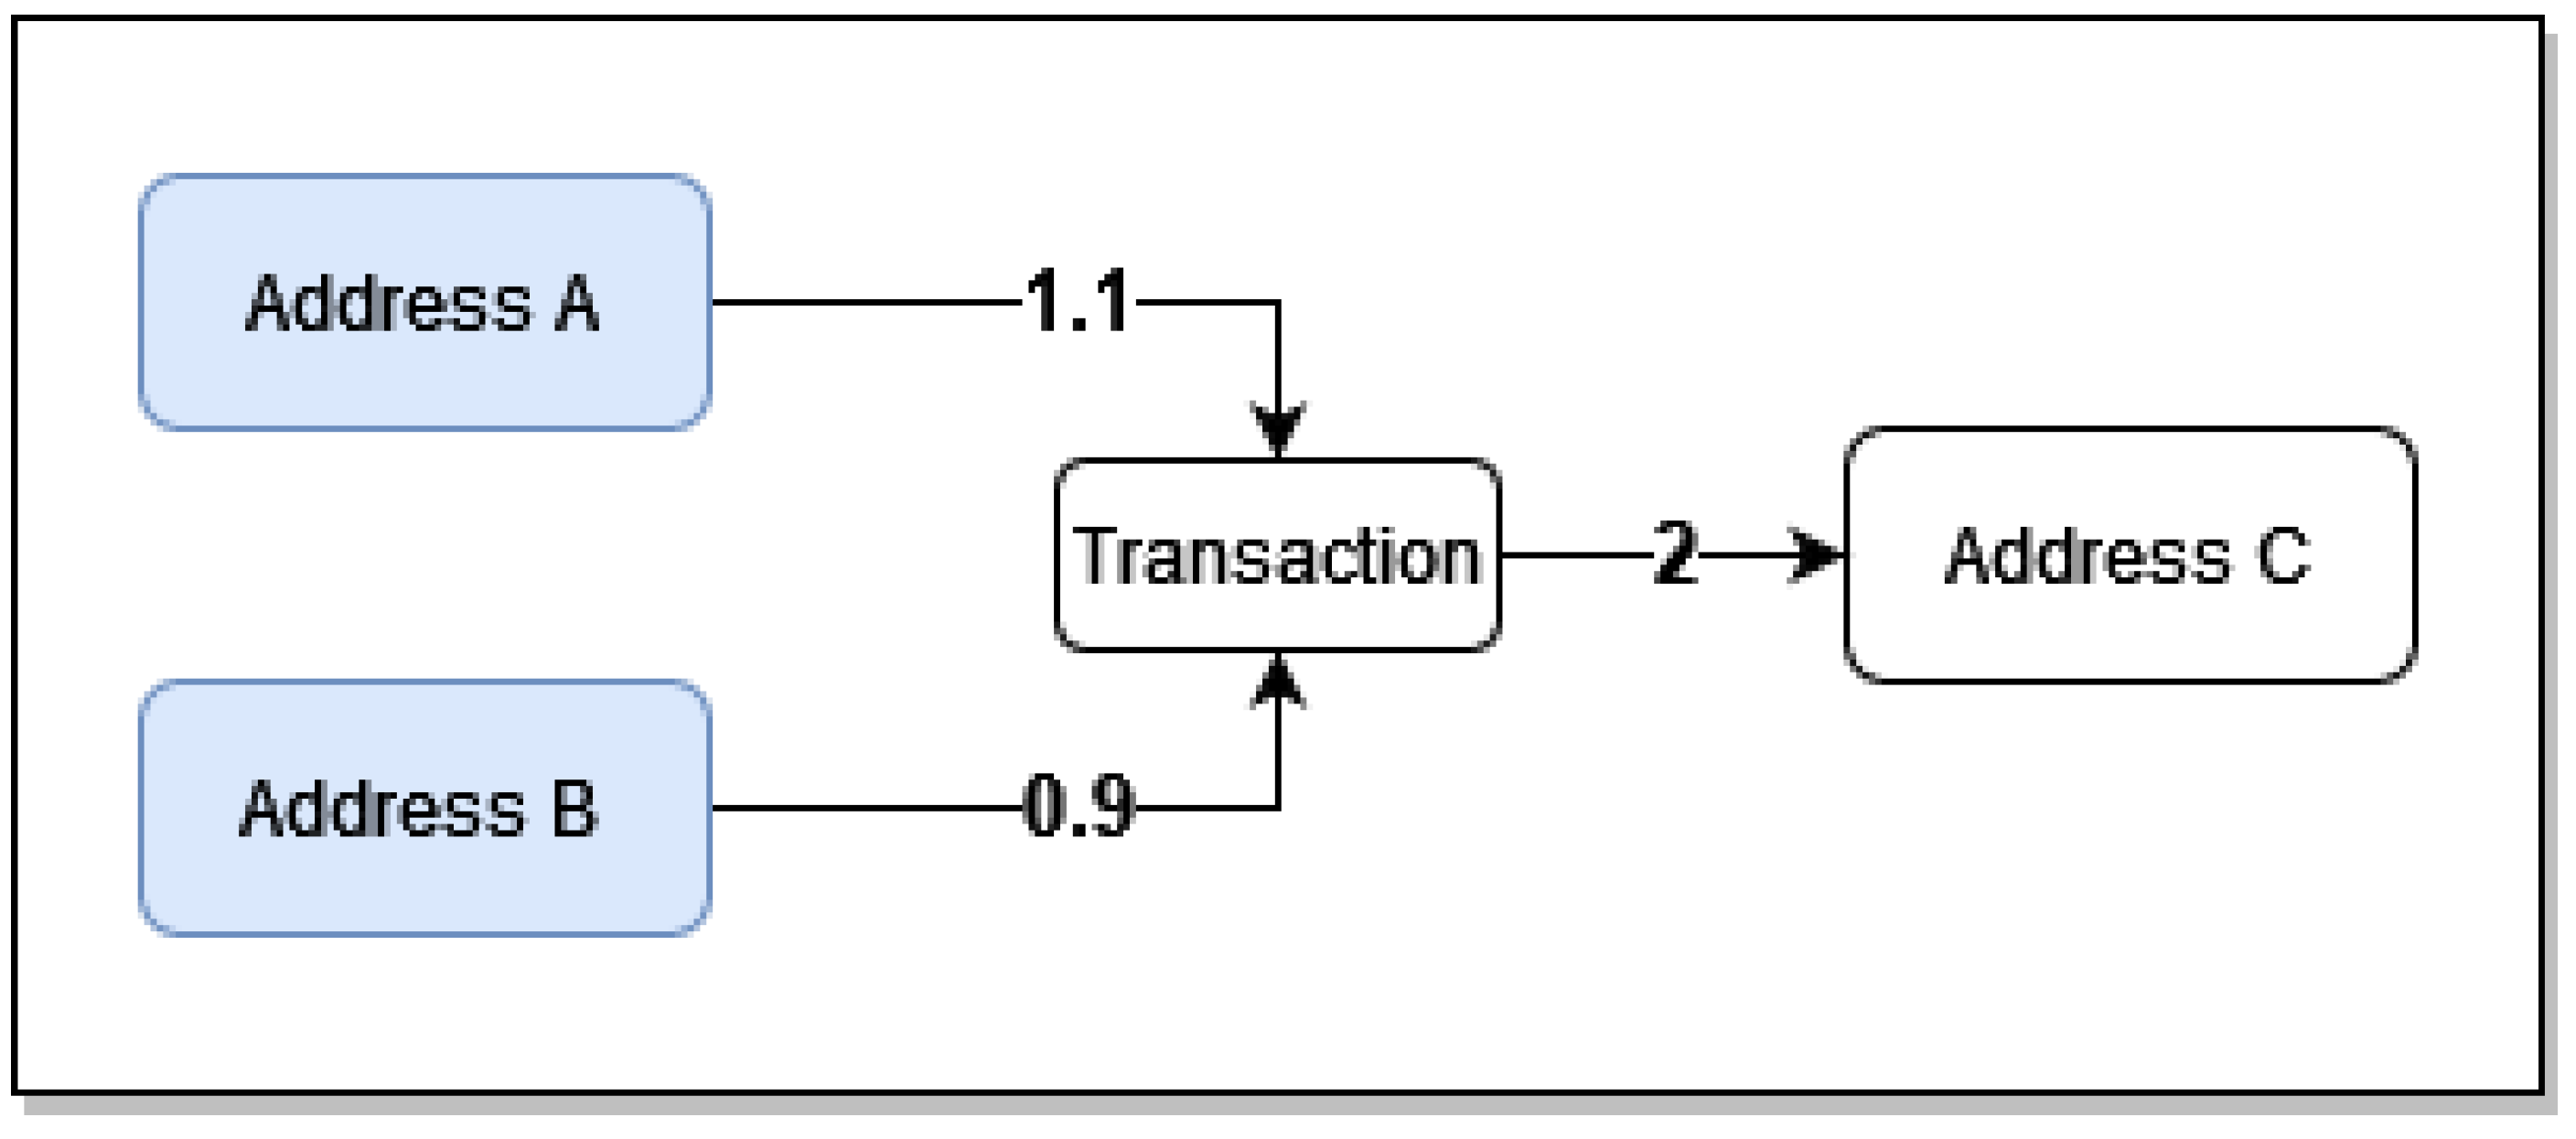
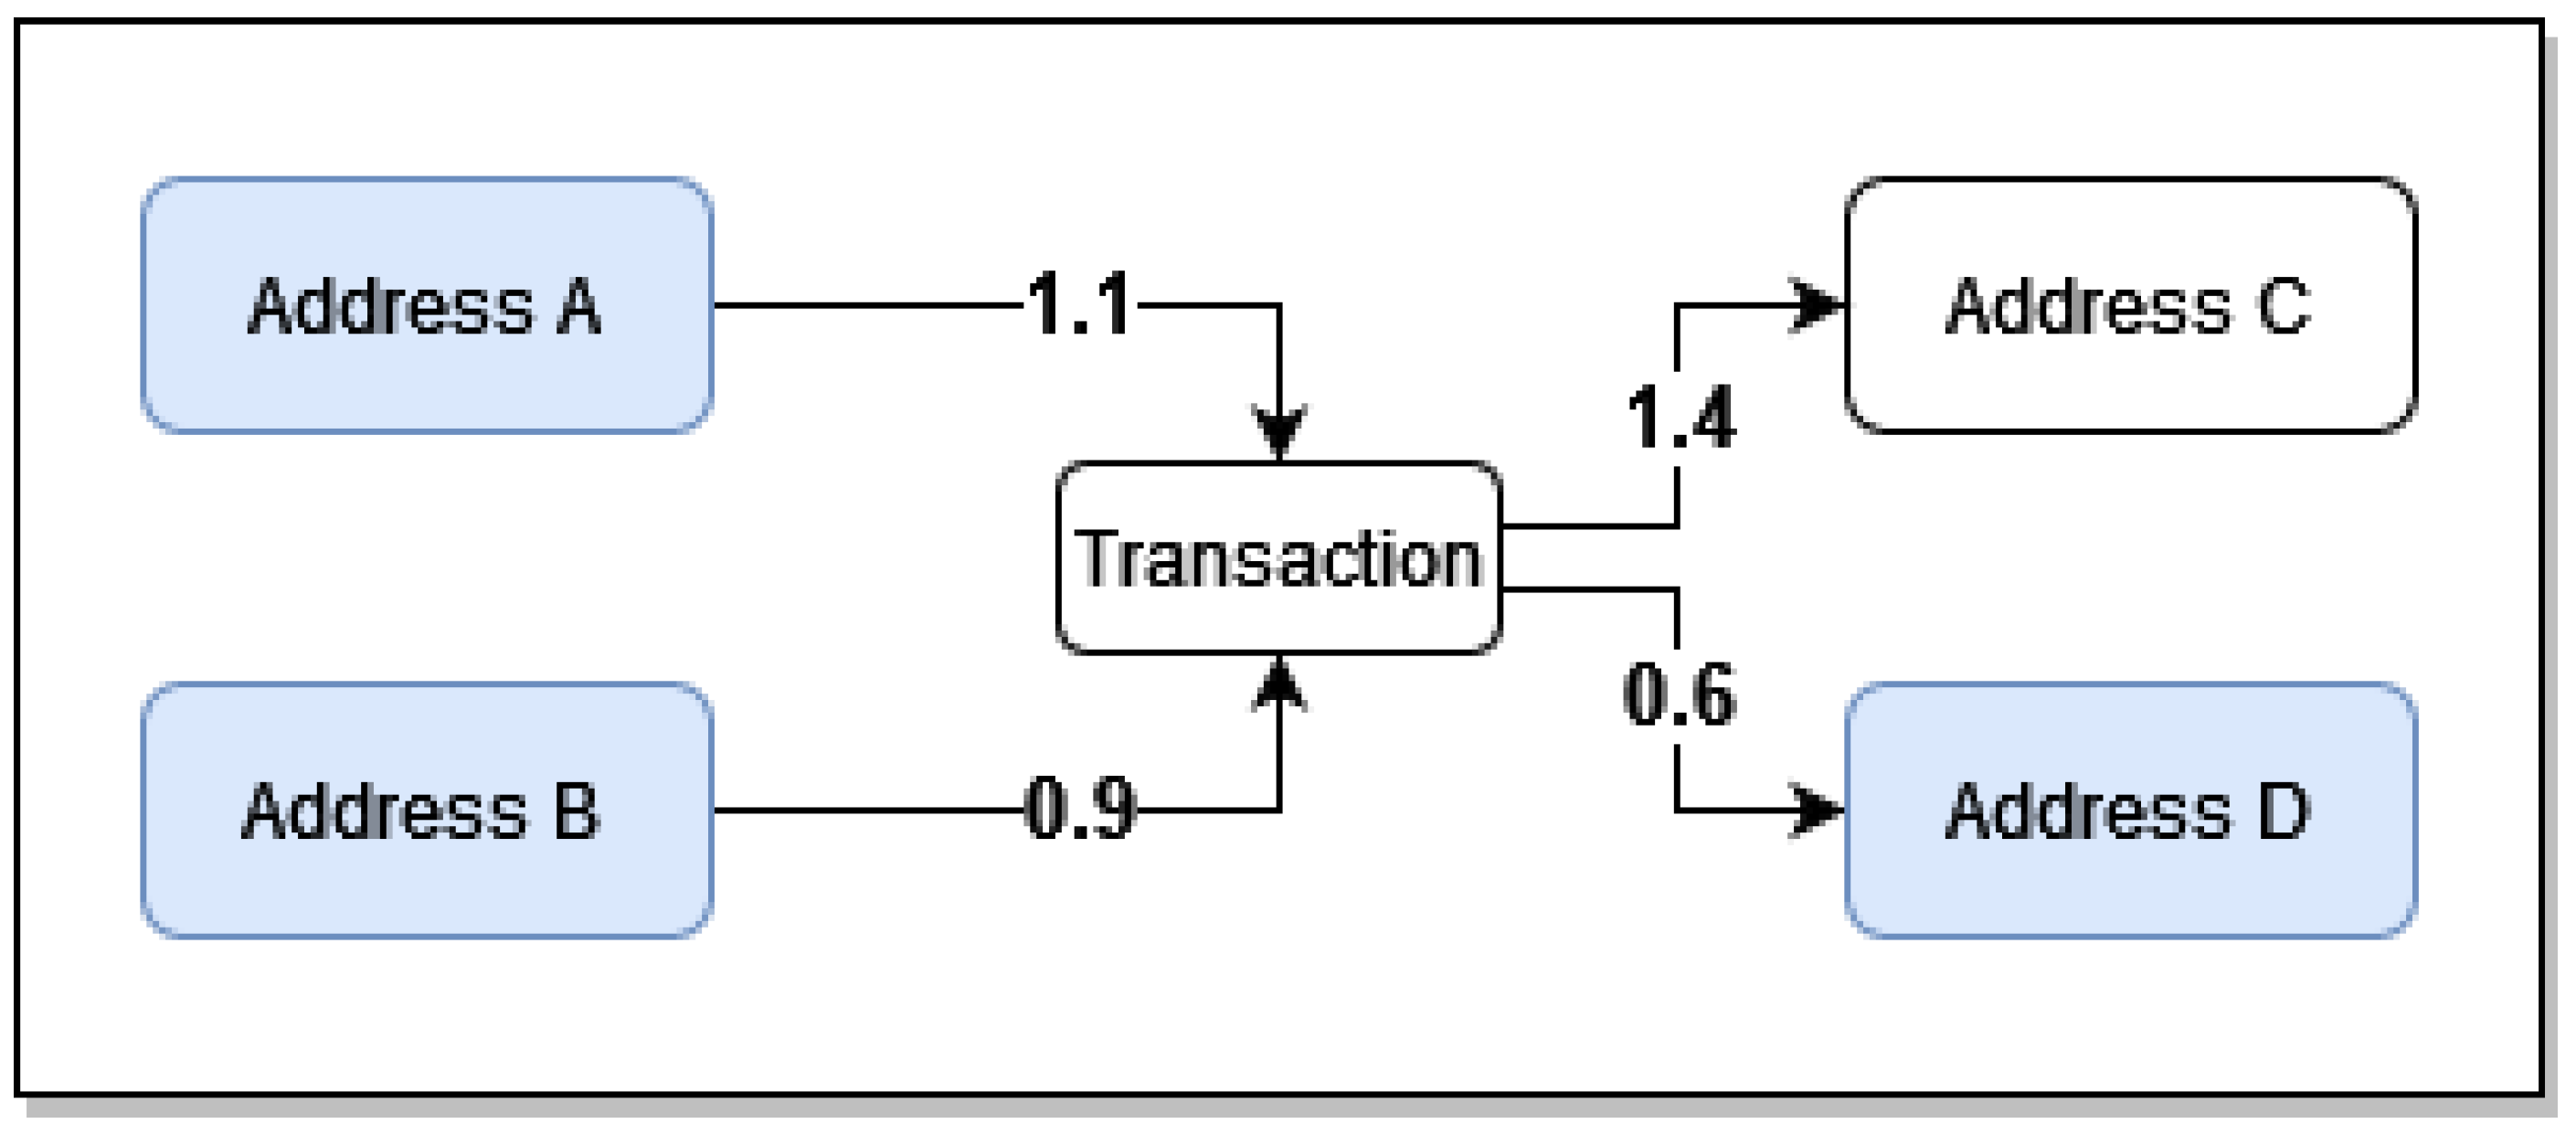
6, which contains lists of Bitcoin transactions for specific entities. The transactions are owner-based, meaning that multiple Bitcoin addresses are combined into a single entity (wallet). This is because one entity typically uses multiple Bitcoin addresses throughout its lifetime. For example, 
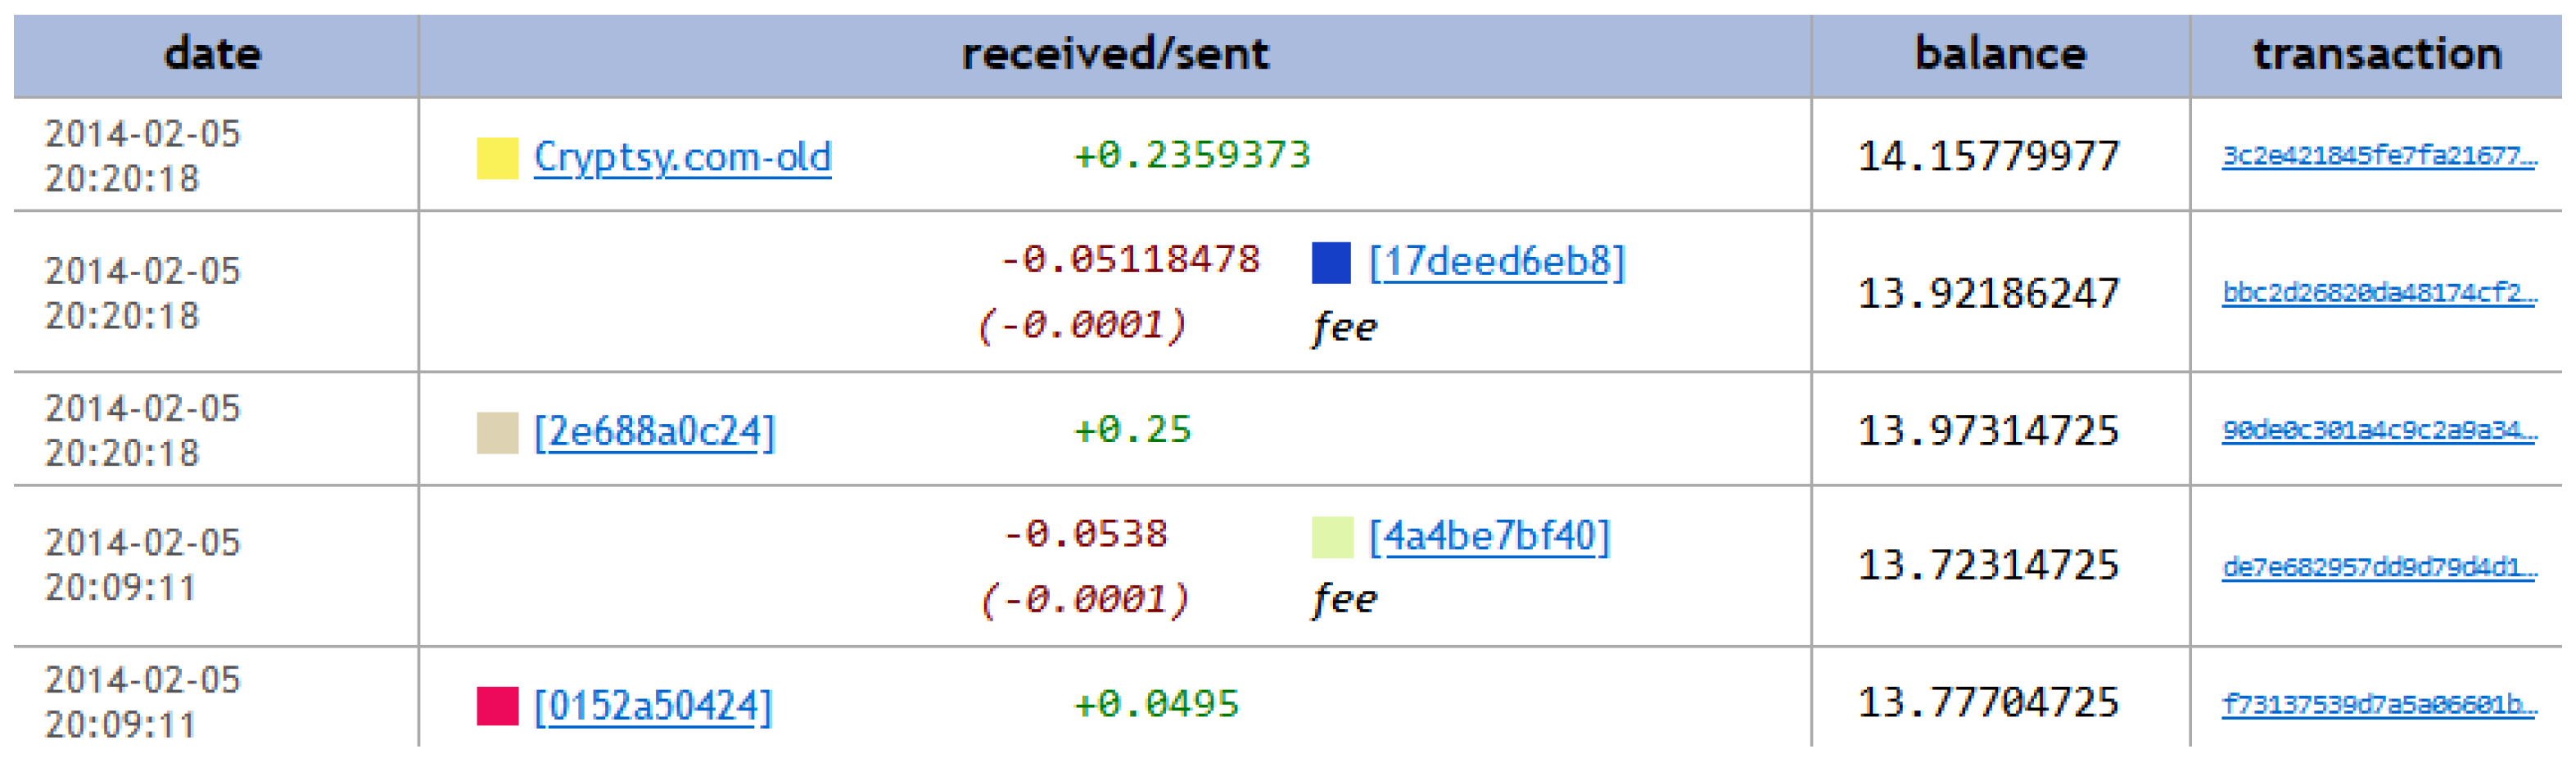
Figure 5 shows five transactions of the MintPal entity as provided by Wallet Explorer, where the columns represent:
  • The timestamp of the transaction;
  • The ID of the spending entity;
  • The transacted amount;
  • The ID of the receiving entity;
  • The progressive balance;
  • The blockchain transaction ID.
The receiving/spending IDs are attributed by the Wallet Explorer website and they do not hold a particular importance other than to distinguish between entities. The balance changes progressively according to the transaction, starting from the bottom row and moving up. For example, the last row indicates that the MintPal entity received 0.0495 Bitcoin from the entity with ID 0152a50424 and the row above indicates that the entity MintPal sent 0.538 to 4a4be7bf40, and 0.001 was used up as a fee.
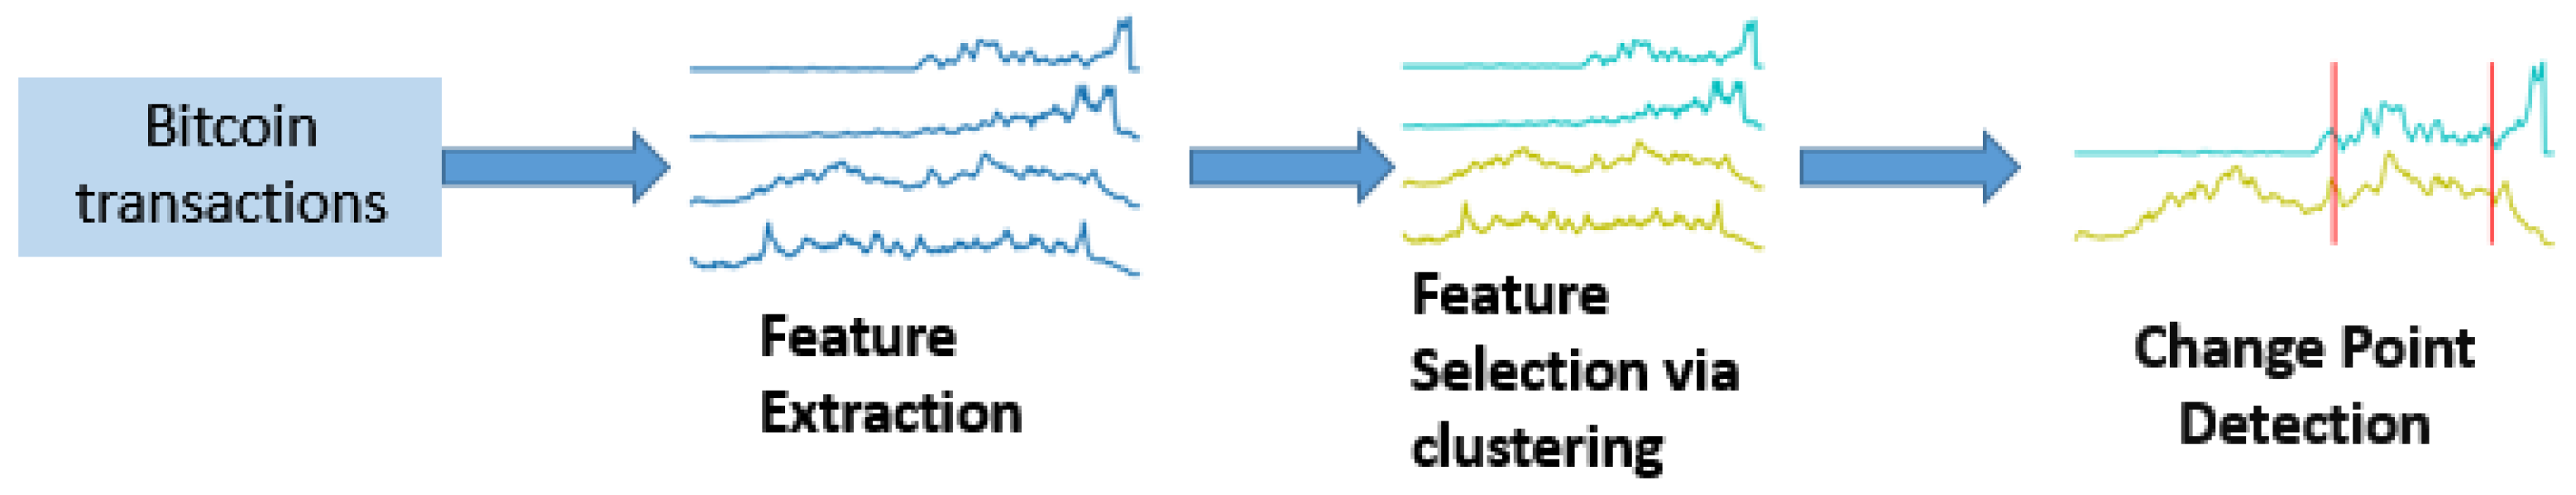
In what follows, the proposed framework is applied to the two abovementioned Bitcoin entities that were involved in illicit activities. The analysis includes the three steps described in detail in Section 3: (a) feature extraction, where 28 features are extracted from the transaction history and their values are aggregated on a daily basis resulting in the creation of 28 time series; (b) feature selection, where the relevant time series are grouped into clusters; and (c) change point detection, where the multivariate time series created by the medoids of the formulated clusters is analysed aiming to identify statistically significant changes in it. For the implementation of the change point detection algorithm presented in Section 3.3, the “ecp” R package has been used.

4.2. Pirate@40 HYIP Scheme

In this section the applicability of the proposed framework is illustrated and evaluated using the Pirate@40 dataset and the relevant results are presented.
Feature extraction. The features mentioned in Table 1 are extracted from the Pirate@40 dataset per day, resulting in the construction of 28 time series with length T = 408 (days) each, covering the period 22 from June 2011 until 26 August 2012.
Feature selection. To categorise the extracted features into homogeneous clusters so as to use the medoid time series of each class as input to the CPD algorithm, the PAM clustering algorithm is applied to the constructed time series using the DTW distance. In order to estimate the optimal number of clusters, we use the Silhouette index for the clustering validation, selecting the number of clusters that maximises its value (see Section 3.2); the results are presented in Table 2 for different numbers of clusters.
Based on Table 2, the maximum value of the Silhouette index related to the 
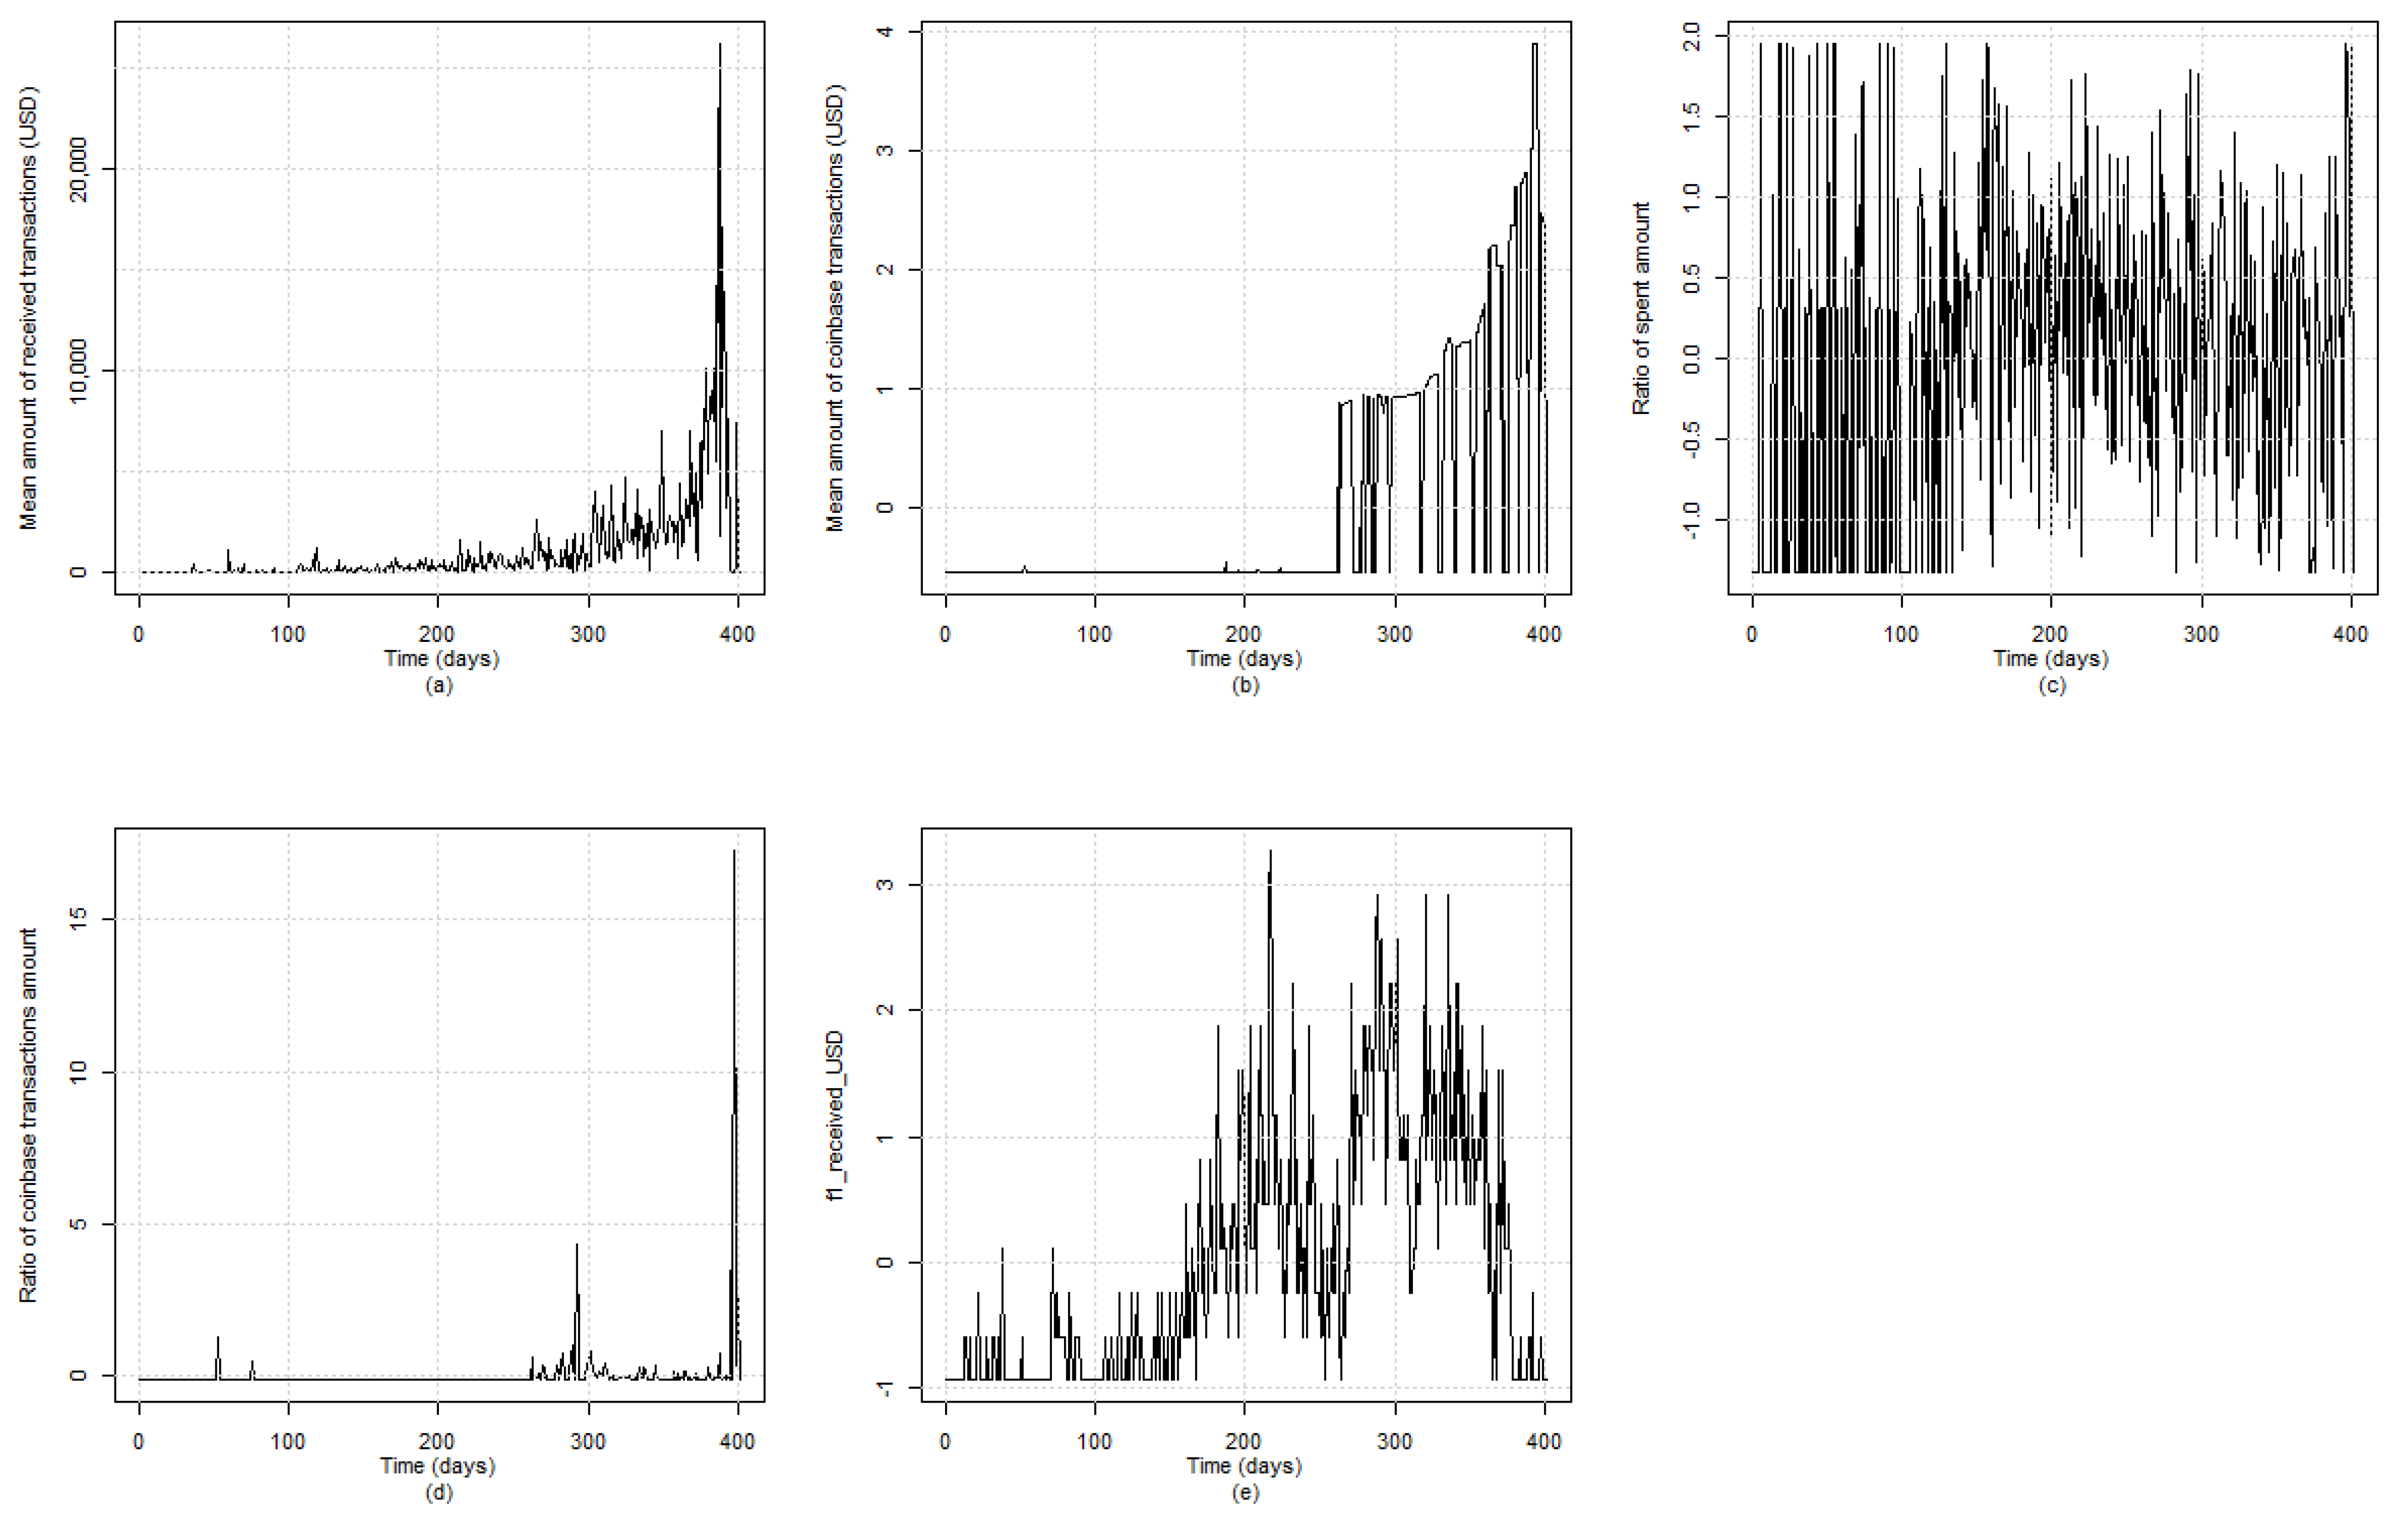
Pirate@40 entity is achieved with the use of five clusters. Therefore, we proceed with the clustering of the extracted time series features into five groups. The formulated clusters, as well as, the medoid time series of each one of them, are presented in Table 3, while Figure 6 depicts graphically the evolution of the medoid time series.
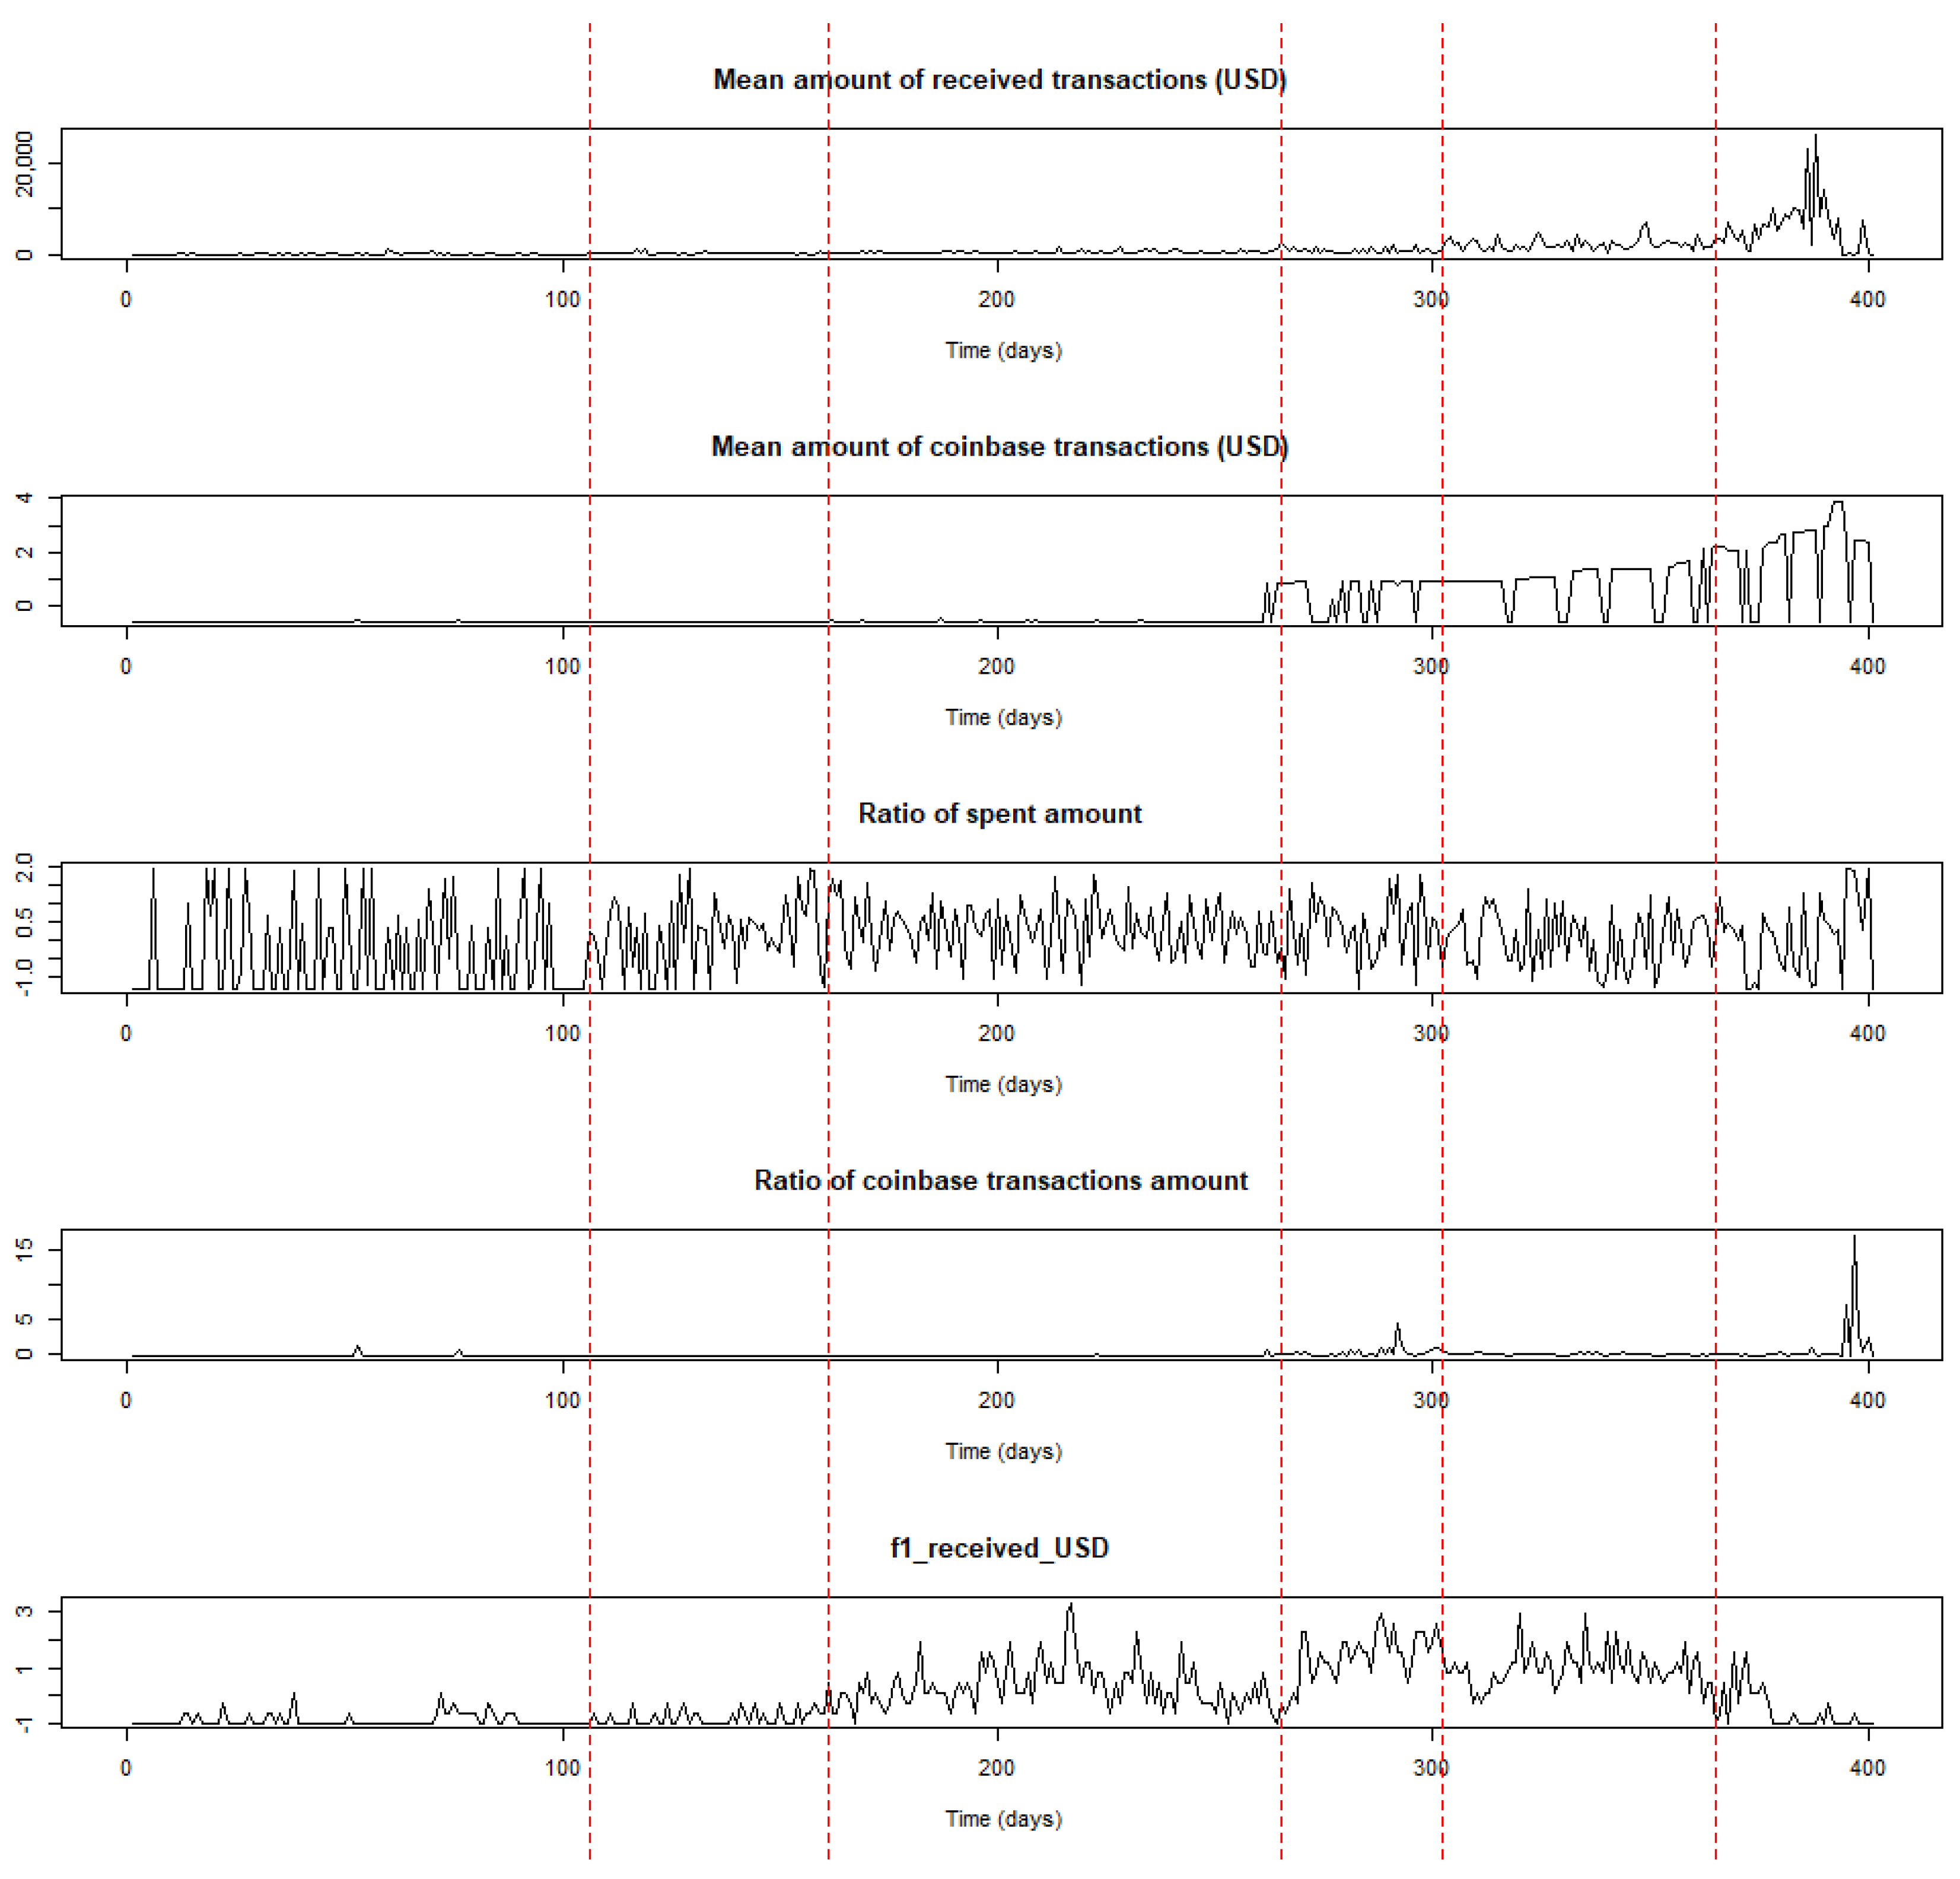
Change point analysis. Using the medoids of each of the five clusters, we result in creating a five-dimensional time series which constitutes the input to the CPD algorithm presented in Section 3.3. The results of the change point analysis in the multidimensional time series are presented in Table 4 and are depicted graphically in Figure 7.
Some observations can be drawn by taking into account the time locations of the estimated change points and incidents (e.g., forum announcements) that occurred during the transaction period related to the Pirate@40 wallet. The first estimated change point at time location t = 106 (5 November 2011) signifies a period where transaction activity mainly started to occur, without intensity, though this characteristic is more obvious when considering the evolution of the time series related to the frequency of received transactions, where the range of the USD amount is greater than 10 1 and less than or equal to 10. It is noted that the time series of the number of transactions per day evolves similarly, since they both belong to the fifth cluster. This change in trend may be partially related to a major announcement that took place at the beginning of November 2011 based on the related topic in the Bitcointalk forum where it was announced by the Pirate@40 user that the Bitcoin Savings & Trust will be closed down7.
The period between the second estimated change point at time location t = 161 (30 December 2011) and the third one at t = 265 (12 April 2012) appears to have an increasing trend, especially when considering the time series related to the ratio out amount and the frequency of the received transactions where the values of the USD amount lie between 10 1 and 10. Subsequently, it can be argued that the estimated change point at t = 161 signifies an upward change related to the transactions activity; this may be linked to the opening of the website of Pirate@40’s HYIP that occurred in December 2011, according to the related topic in the Bitcointalk forum8, and may have triggered such an intense activity.
Regarding the period between t = 265 (12 April 2012) and the fourth estimated change point at t = 302 (19 May 2012), it can be argued that a more intense activity in transactions is identified compared to the previous period. In this case, time location t = 265 signals the initialisation of a more intense upward trend in the transactions activity which could be partially justified by the fact that on 10 April 2012 Pirate@40 changed their scheme name9; this may have contributed to the continuation of the upward trend in a more intense way.
Commenting on the period between t = 302 (19 May 2012) and the fifth estimated change point at t = 365 (21 July 2012), it can be argued that the related time series appear to have a stable trend at a high level; this means that the fourth estimated change point at t = 302 indicates the initialisation of a period with stable trend in transactions activity. Finally, the last period starting at t = 365 (21 July 2012) until the wallet was defunct (26 August 2012), indicates the existence of a decreasing trend related to the medoid time series of the fifth cluster, and an increasing one in the remaining medoids. This may be partially linked to the fact that during July 2012 Pirate@40 changed its interest rate down from 7% to 5%10.
Overall, based on the findings derived from the application of the proposed method to the Pirate@40 case, it can be concluded that the estimated change points in the time series of interest partially align with time instances of events that may have impacted its transaction activity.

4.3. The MintPal Exchange Platform

In this section, the applicability of the proposed framework is illustrated using the MintPal dataset.
Feature extraction. The features mentioned in Table 1 are extracted from MintPal dataset per day, resulting in the construction of 28 time series with length T = 271 (days) each, spanning the period from 2 February 2014 until 31 October 2014.
Feature selection. Similarly to the Pirate@40 case, we categorise the extracted features into clusters using the PAM clustering method with the DTW distance, and the optimal number of clusters is selected using the Silhouette index; the values of this index for different number of clusters are presented in Table 5.
The maximum value of the Silhouette index is achieved with the use of two clusters, and therefore, we proceed with the clustering of the extracted time series features into two groups. Table 6 presents the clusters and the medoid time series for each one of them, while 
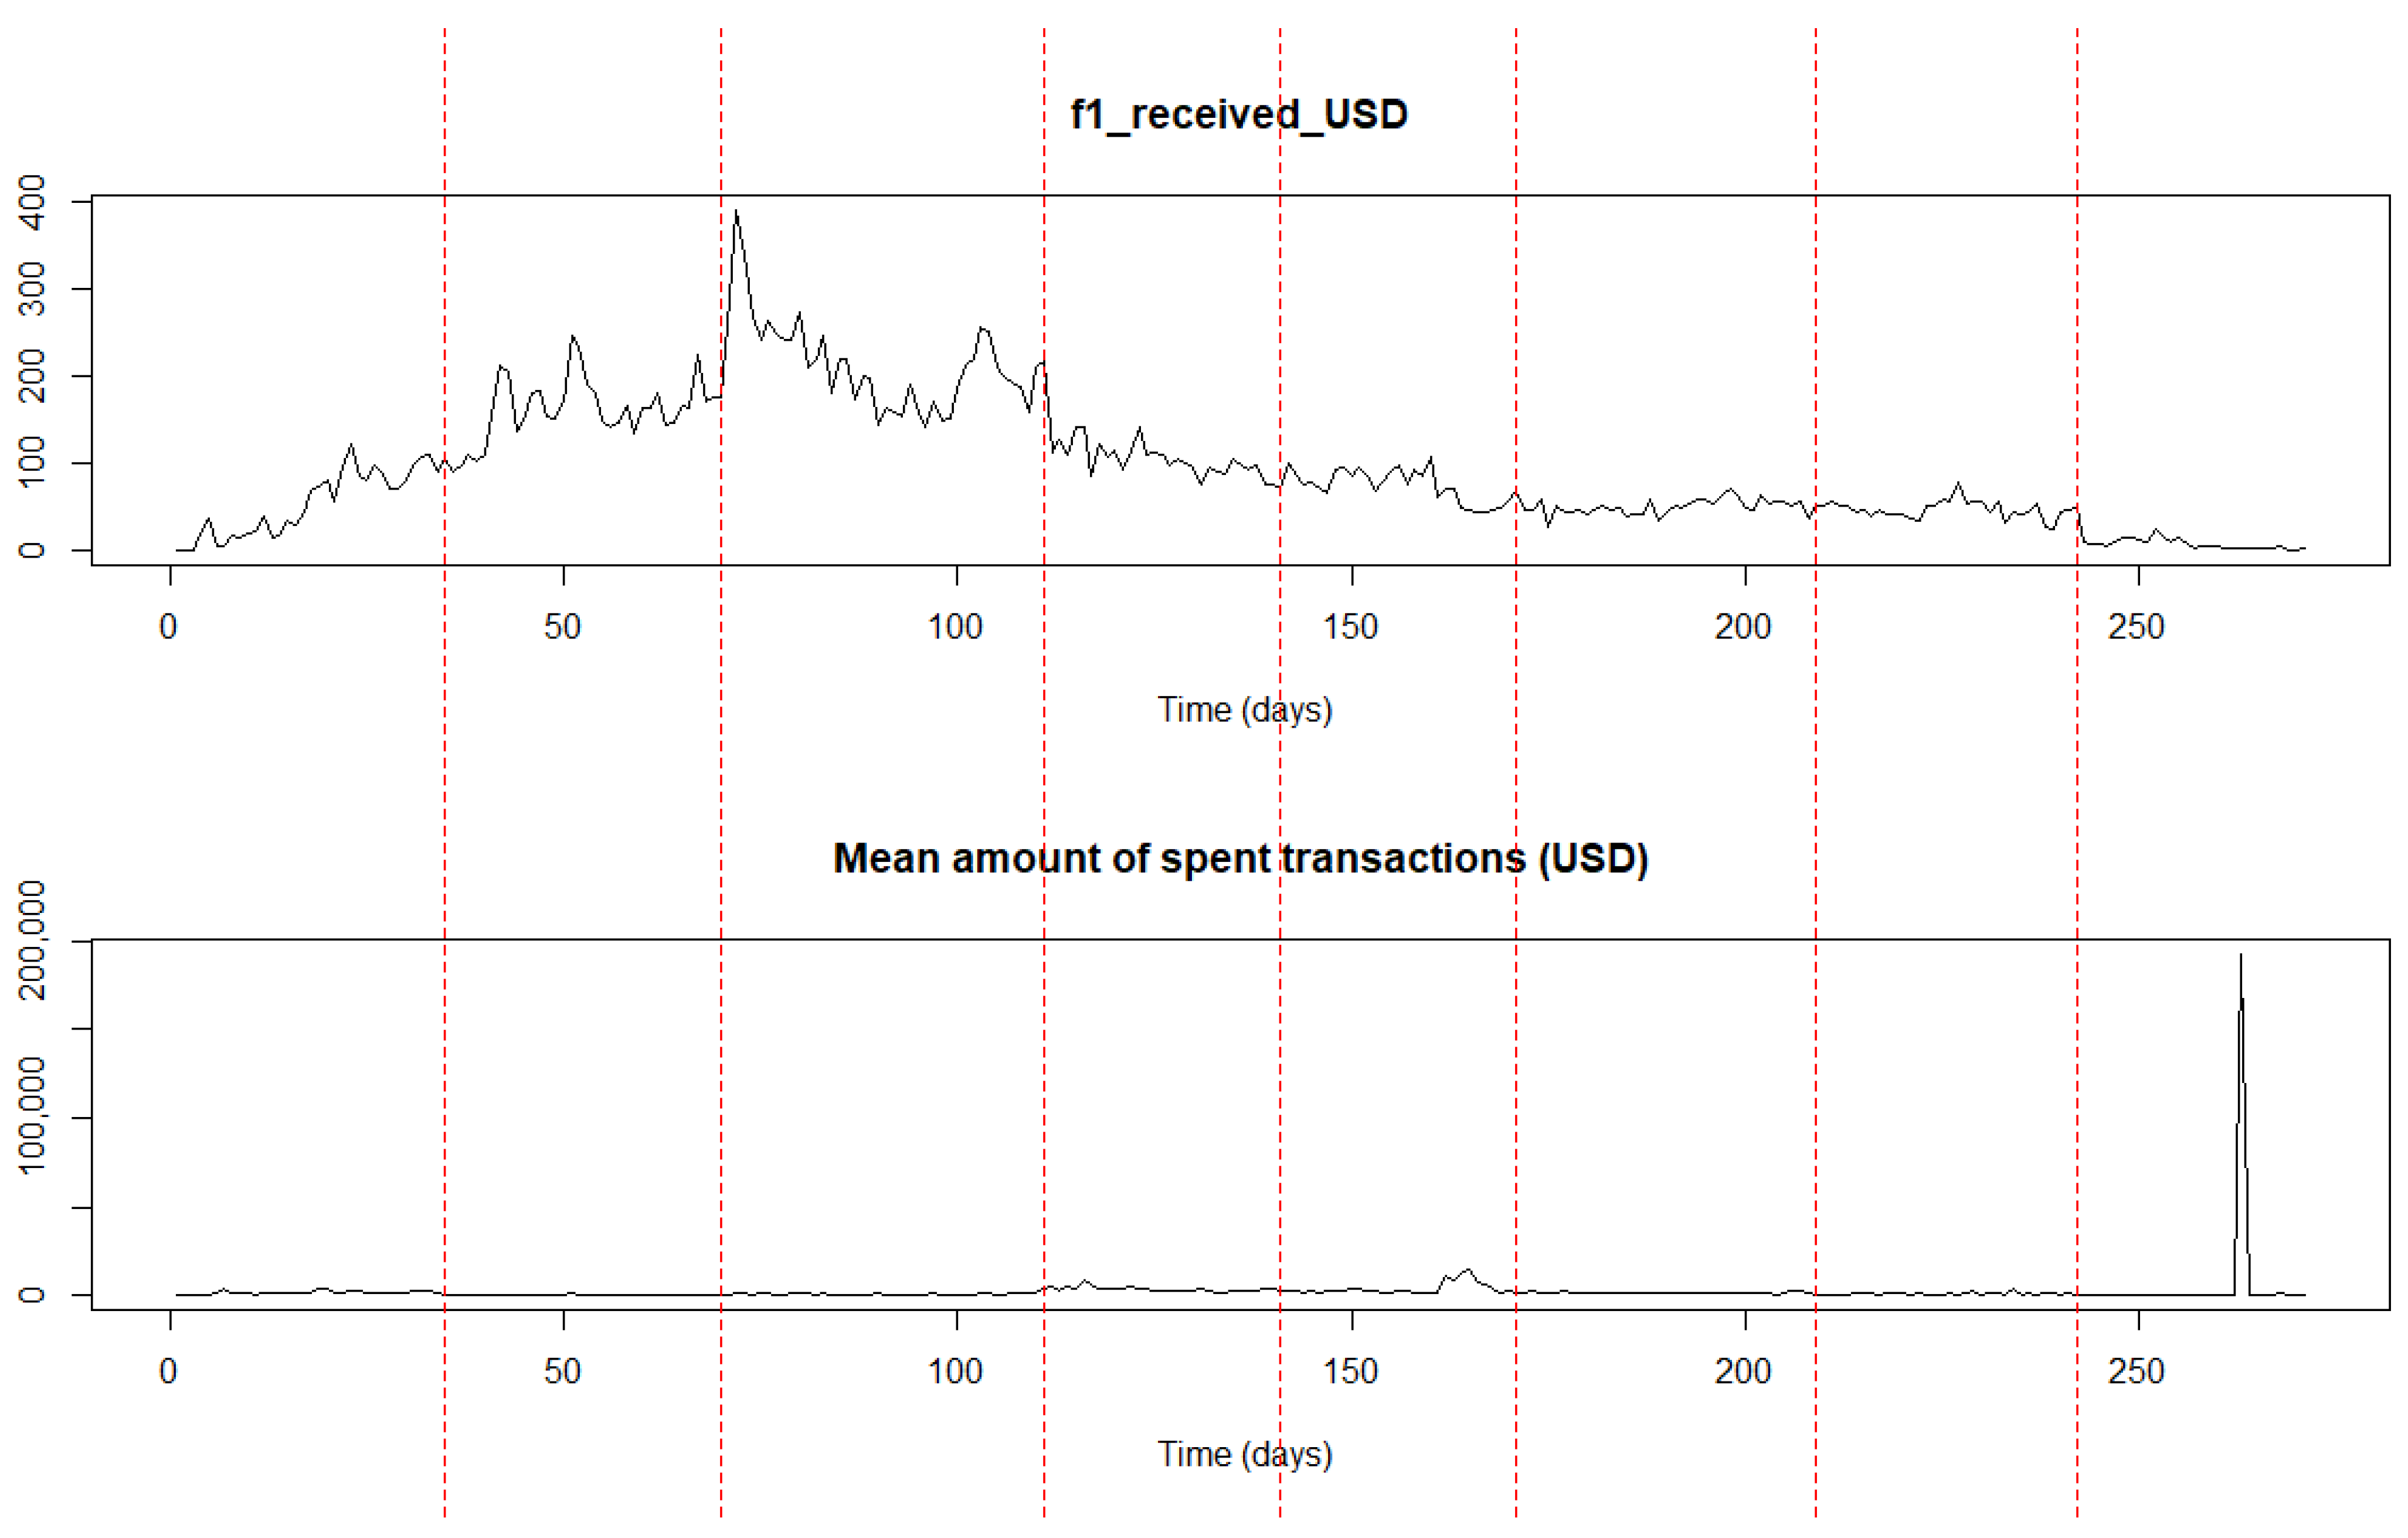
Figure 8 showcases the evolution of the medoids over time.
Change point analysis. Using the medoids of each of the two clusters, we result in creating a two-dimensional time series which constitutes the input of the CPD algorithm presented in Section 3.3. The results of the change point analysis in the multidimensional time series are presented in Table 7 and are depicted graphically in Figure 9.
Similarly to the Pirate@40 case, some observations could be drawn regarding the MintPal crypto exchange platform. The period between the first estimated change point at t = 35 (9 March 2014) and the second one at t = 70 (13 April 2014) depicts a more intense upward trend related to the transaction activity compared to the previous one; this characteristic is more obvious especially when considering the time series of the frequency of the received transactions where the values of the USD amount are greater than 10 1 and less than or equal to 10. It is also mentioned that the time series of the number of transactions per day evolves similarly, since both features belong to the first cluster. In other words, time location t = 35 initiates a period with a more intense upward trend in the extracted features. This could be attributed partially to two facts: (a) MintPal was founded in February 2014 (See Note 5 above) and consequently there was a gradual increase in transactions since then, and (b) a new cryptocurrency was added in MintPal in early March 201411 that may have boosted the transaction activity.
Regarding the period between time locations t = 70 (13 April 2014) and t = 111 (24 May 2014), it could be argued that a stable trend at high level is depicted, especially in the medoid time series of the second cluster. This means that the high transaction activity continues from the previous period and stabilises. The high engagement related to a tweet commenting on the addition of the BlackCoin in MintPal constitutes an indication of this high interest (See Note 11 above). In the remaining periods formulated by the estimated change points, either a decreasing trend is depicted related to the medoid time series of the first cluster and an increasing one in the medoid of the second cluster, respectively (e.g., during the period between t = 111 (24 May 2014) and t = 141 (23 June 2014), or a stable one at a low level is depicted in both cases (e.g., during the period between t = 171 (23 July 2014) and t = 209 (30 August 2014). These identified trends may be partially related to a series of events that may have triggered the change in the transaction activity in MintPal, like the attack it faced on 13 July 201412, the fact that it was purchased by the digital currency services provider Moopay late July 201413, and the technical issues that were raised due to the relaunch of MintPal exchange early October 201414.
The findings obtained from applying the proposed change point detection framework in the MintPal dataset are similar with the results of the first one in the Pirate@40 entity. These similarities suggest that the framework could successfully identify links between time instances and events that may influence the transaction activity.

5. Discussion

This paper proposed a method for the analysis of dynamic features formulated as time series data that are extracted from Bitcoin transactions. The core of the analysis is based on the implementation of change point detection in the relevant time series aiming to identify the time locations of statistically significant changes in their temporal evolution. The motivation and rationale behind this approach lies on the fact that the estimated locations may be correlated to the occurrence of events that could affect the transaction activity, and therefore may need to be further investigated.
Taking into consideration the results derived from the application of the proposed framework in real cases, as presented in Section 4, it could be deduced that the estimated change points coincide partially with the time locations of incidents that may influence the transaction activity. Therefore, links are identified between time instances and event occurrences, indicating that the proposed approach could serve as a tool in digital forensics aiming to identify trends and patterns in transaction activity that could lead to the exposure of potential illicit actions after the more thorough investigation of the relevant events. For example, the proposed framework could be applied in the analysis of historical data of a wallet that is considered to be an HYIP scam. At a specific time instance, a change point is estimated. Upon further investigation, it is revealed that this point overlaps with the time that the scammer initiated the halt of the outgoing payments; this event impacted the transaction activity and it was eventually linked to the existence of an illicit activity. Of course, patterns of illicit behaviour in crypto transactions are continuously evolving and become more complex, thus introducing further difficulties in the development of digital forensics technologies that could identify them.
It should be noted though that the proposed framework aims at estimating time locations in the transaction activity where the statistical properties of the features change over time. In other words, it provides alerts at time instances where different behaviour begins to be observed (from a statistical point of view) compared to the evolution in the past. Then, these alerts can trigger further investigation in terms of digital forensics to determine whether the estimated time instances coincide with events that affected the transaction activity and may imply illicit behaviour. Overall, the time locations of the estimated change points do not necessarily correspond to illicit activity, as they could also correspond to changes in the behaviour of (privacy-preserving) non-illicit activities, but they can be indications of illicit actions, particularly in specific contexts.
The proposed change point detection framework introduces the retrospective analysis of Bitcoin transactions when considering historic data. The offline analysis can be utilised as a tool to learn patterns and trends in transaction activity that may suggest illicit activities. However, the framework could also be implemented in real time using online change point analysis techniques in the extracted features. This will enable the online monitoring of the transaction activity of interest providing alerts when changes are identified in real time; these alerts will prompt further investigation that could potentially result in the exposure of the onset of possible illicit activities.

6. Conclusions

This work proposed a unified change point detection framework for the estimation of statistically significant changes in time series features extracted from Bitcoin transaction history that may be related to the occurrence of events that should be further investigated. The framework covers the whole pipeline from the extraction of the features of interest in a time series form and the selection of features among the extracted ones based on a clustering approach until the application of the change point analysis to the medoid time series of the constructed clusters aiming to detect the time locations of significant changes. The proposed framework was applied to two notable Bitcoin entities to showcase its appropriateness in detecting such structural breaks.
Overall, based on the application results, it can be concluded that the proposed framework could contribute to the revealing of potential links between time locations and occurrences of events in the crypto transaction history that may have caused the statistically significant changes in the evolution of transaction activity; this could serve as a digital forensics tool to further investigate the relevant event occurrences and identify possible trends and patterns that can be related to illicit actions.
Regarding future work, a possible direction in the feature extraction part is to enrich the list of extracted features aiming to capture an even more comprehensive picture of the overall transaction activity (e.g., include features that reflect the evolution of the standard deviation of the metrics of interest). Additionally, online change point techniques could also be exploited in time series containing features from crypto transactions, enabling real-time inference regarding the identification of potential illicit addresses/activities.

Author Contributions

Conceptualization, O.T., A.-M.K. and T.T.; methodology, O.T. and A.-M.K.; software, O.T. and A.-M.K.; validation, O.T. and A.-M.K.; writing—original draft preparation, O.T. and A.-M.K.; writing—review and editing, O.T., A.-M.K. and T.T.; supervision, T.T., S.V. and I.K.; funding acquisition, T.T., S.V. and I.K. All authors have read and agreed to the published version of the manuscript.

Funding

This research was supported by CTC [grant agreement No. 101036276] project, funded by the European Union’s Internal Security Fund—Police. The content of this reflects only the authors’ views and the European Commission does not accept any responsibility for use that may be made of the information it contains.

Data Availability Statement

The Pirate@40 wallet transactions dataset is available on https://www.walletexplorer.com/wallet/Btcst.com-pirateat40; accessed on 14 July 2022. The Mintpal wallet transactions dataset is available on https://www.walletexplorer.com/wallet/MintPal.com; accessed on 14 July 2022.

Conflicts of Interest

The authors declare no conflict of interest.

Abbreviations

The following abbreviations are used in this manuscript:
AICAkaike Information Criterion
ARIMAAutoregressive Integrated Moving Average
BICBayesian Information Criterion
BTCBitcoin
CPDChange Point Detection
DTWDynamic Time Warping
HYIPHigh-Yield Investment Programme
GARCHGeneralized Autoregressive Conditional Heteroskedasticity
PAMPartition Around Medoids
USDUnited States Dollar

Notes

1
2
3
4
5
6
https://www.walletexplorer.com (accessed on 14 July 2023).
7
8
9
10
11
12
13
14

References

  1. Abbasimehr, Hossein, and Mostafa Shabani. 2021. A new methodology for customer behavior analysis using time series clustering: A case study on a bank’s customers. Kybernetes 50: 221–42. [Google Scholar] [CrossRef]
  2. Arbelaitz, Olatz, Ibai Gurrutxaga, Javier Muguerza, Jesús M. Pérez, and Iñigo Perona. 2013. An extensive comparative study of cluster validity indices. Pattern Recognition 46: 243–56. [Google Scholar] [CrossRef]
  3. Azari, Amin. 2019. Bitcoin price prediction: An arima approach. arXiv arXiv:1904.05315. [Google Scholar]
  4. Chu, Jeffrey, Stephen Chan, Saralees Nadarajah, and Joerg Osterrieder. 2017. Garch modelling of cryptocurrencies. Journal of Risk and Financial Management 10: 17. [Google Scholar] [CrossRef]
  5. Davies, David L., and Donald W Bouldin. 1979. A cluster separation measure. IEEE Transactions on Pattern Analysis and Machine Intelligence PAMI-1: 224–27. [Google Scholar] [CrossRef]
  6. Dunn, Joseph C. 1973. A fuzzy relative of the isodata process and its use in detecting compact well-separated clusters. Journal of Cybernetics 3: 32–57. [Google Scholar] [CrossRef]
  7. Farrugia, Steven, Joshua Ellul, and George Azzopardi. 2020. Detection of illicit accounts over the Ethereum blockchain. Expert Systems with Applications 150: 113318. [Google Scholar] [CrossRef]
  8. Fleischer, Jacques Phillipe, Gregor von Laszewski, Carlos Theran, and Yohn Jairo Parra Bautista. 2022. Time series analysis of cryptocurrency prices using long short-term memory. Algorithms 15: 230. [Google Scholar] [CrossRef]
  9. Gerlach, Jan-Christian, Guilherme Demos, and Didier Sornette. 2019. Dissection of Bitcoin’s multiscale bubble history from january 2012 to february 2018. Royal Society Open Science 6: 180643. [Google Scholar] [CrossRef] [PubMed]
  10. He, Xi, Ketai He, Shenwen Lin, Jinglin Yang, and Hongliang Mao. 2022. Bitcoin address clustering method based on multiple heuristic conditions. IET Blockchain 2: 44–56. [Google Scholar] [CrossRef]
  11. Ibrahim, Ahmed, Rasha Kashef, and Liam Corrigan. 2021. Predicting market movement direction for Bitcoin: A comparison of time series modeling methods. Computers & Electrical Engineering 89: 106905. [Google Scholar]
  12. Kaufman, Leonard, and Peter J Rousseeuw. 2009. Finding Groups in Data: An Introduction to Cluster Analysis. Hoboken: John Wiley & Sons. [Google Scholar]
  13. Li, Yang, Yue Cai, Hao Tian, Gengsheng Xue, and Zibin Zheng. 2020. Identifying Illicit Addresses in Bitcoin Network. Communications in Computer and Information Science 1267: 99–111. [Google Scholar] [CrossRef]
  14. Lin, Yu Jing, Po Wei Wu, Cheng Han Hsu, I. Ping Tu, and Shih Wei Liao. 2019. An Evaluation of Bitcoin Address Classification based on Transaction History Summarization. Paper presented at ICBC 2019—IEEE International Conference on Blockchain and Cryptocurrency, Seoul, Republic of Korea, May 14–17; pp. 302–10. [Google Scholar] [CrossRef]
  15. Matteson, David S., and Nicholas A. James. 2014. A nonparametric approach for multiple change point analysis of multivariate data. Journal of the American Statistical Association 109: 334–45. [Google Scholar] [CrossRef]
  16. McNally, Sean, Jason Roche, and Simon Caton. 2018. Predicting the price of Bitcoin using machine learning. Paper presented at 2018 26th Euromicro International Conference on Parallel, Distributed and Network-Based Processing (PDP), Cambridge, UK, March 21–23; pp. 339–43. [Google Scholar]
  17. Müller, Meinard. 2007. Dynamic time warping. In Information Retrieval for Music and Motion. Berlin and Heidelberg: Springer, pp. 69–84. [Google Scholar]
  18. Oliveira, Catarina, João Torres, Maria Inês Silva, David Aparício, João Tiago Ascensão, and Pedro Bizarro. 2021. GuiltyWalker: Distance to illicit nodes in the Bitcoin network. arXiv arXiv:2102.05373. [Google Scholar]
  19. Puspita, Pratiwi Eka, and Zulkarnain. 2020. A Practical Evaluation of Dynamic Time Warping in Financial Time Series Clustering. Paper presented at 2020 International Conference on Advanced Computer Science and Information Systems (ICACSIS), Depok, Indonesia, October 17–18; pp. 61–68. [Google Scholar] [CrossRef]
  20. Ranshous, Stephen, Cliff A. Joslyn, Sean Kreyling, Kathleen Nowak, Nagiza F. Samatova, Curtis L. West, and Samuel Winters. 2017. Exchange pattern mining in the Bitcoin transaction directed hypergraph. In Financial Cryptography and Data Security: FC 2017 585 International Workshops, WAHC, BITCOIN, VOTING, WTSC, and TA, Sliema, Malta, April 7, 2017. Revised Selected Papers 21, 10323 LNCS. Cham: Springer, pp. 248–63. [Google Scholar]
  21. Rousseeuw, Peter J. 1987. Silhouettes: A graphical aid to the interpretation and validation of cluster analysis. Journal of Computational and Applied Mathematics 20: 53–65. [Google Scholar] [CrossRef]
  22. Sándor, Barnabás, and Dávid János Fehér. 2019. Examining the relationship between the Bitcoin and cybercrime. Paper presented at 2019 IEEE 13th International Symposium on Applied Computational Intelligence and Informatics (SACI), Timisoara, Romania, May 29–31; pp. 121–26. [Google Scholar]
  23. Tan, Xue, and Rasha Kashef. 2019. Predicting the closing price of cryptocurrencies: A comparative study. Paper presented at Second International Conference on Data Science, E-Learning and Information Systems, Dubai, United Arab Emirates, December 2–5; pp. 1–5. [Google Scholar]
  24. Theodosiadou, Ourania, Kyriaki Pantelidou, Nikolaos Bastas, Despoina Chatzakou, Theodora Tsikrika, Stefanos Vrochidis, and Ioannis Kompatsiaris. 2021. Change point detection in terrorism-related online content using deep learning derived indicators. Information 12: 274. [Google Scholar] [CrossRef]
  25. Toyoda, Kentaroh, P. Takis Mathiopoulos, and Tomoaki Ohtsuki. 2019. A Novel Methodology for HYIP Operators’ Bitcoin Addresses Identification. IEEE Access 7: 74835–48. [Google Scholar] [CrossRef]
  26. Toyoda, Kentaroh, Tomoaki Ohtsuki, and P. Takis Mathiopoulos. 2017. Identification of High Yielding Investment Programs in Bitcoin via Transactions Pattern Analysis. Paper presented at 2017 IEEE Global Communications Conference, GLOBECOM 2017—Proceedings, Singapore, December 4–8; pp. 1–6. [Google Scholar] [CrossRef]
  27. Toyoda, Kentaroh, Tomoaki Ohtsuki, and P. Takis Mathiopoulos. 2018a. Multi-Class Bitcoin-Enabled Service Identification Based on Transaction History Summarization. Paper presented at Proceedings—IEEE 2018 International Congress on Cybermatics: 2018 IEEE Conferences on Internet of Things, Green Computing and Communications, Cyber, Physical and Social Computing, Smart Data, Blockchain, Computer and Information Technology, iThings/Gree, Halifax, NS, Canada, July 30–August 3; pp. 1153–60. [Google Scholar] [CrossRef]
  28. Toyoda, Kentaroh, Tomoaki Ohtsuki, and P. Takis Mathiopoulos. 2018b. Time series analysis for Bitcoin transactions: The case of pirate@ 40’s hyip scheme. Paper presented at 2018 IEEE International Conference on Data Mining Workshops (ICDMW), Singapore, November 17–20; pp. 151–55. [Google Scholar]
  29. Weber, Mark, Giacomo Domeniconi, Jie Chen, Daniel Karl I. Weidele, Claudio Bellei, Tom Robinson, and Charles E. Leiserson. 2019. Anti-Money Laundering in Bitcoin: Experimenting with Graph Convolutional Networks for Financial Forensics. arXiv arXiv:1908.02591. [Google Scholar]
  30. Yang, Qingqing, Yuexin Xiang, Wenmao Liu, and Wei Ren. 2022. An Illicit Bitcoin Address Analysis Scheme Based on Subgraph Evolution. Paper presented at 2022 IEEE 24th Int Conf on High Performance Computing & Communications; 8th Int Conf on Data Science & Systems; 20th Int Conf on Smart City; 8th Int Conf on Dependability in Sensor, Cloud & Big Data Systems & Application (HPCC/DSS/SmartCity/DependSys), Hainan, China, December 18–20; pp. 679–86. [Google Scholar]
  31. Zhang, Yuhang, Jun Wang, and Jie Luo. 2020. Heuristic-based address clustering in Bitcoin. IEEE Access 8: 210582–91. [Google Scholar] [CrossRef]
Figure 1. Overview of the proposed framework.
Jrfm 16 00408 g001
Figure 2. Example Bitcoin transaction with payback.
Jrfm 16 00408 g002
Figure 3. Example Bitcoin transaction with co-spending.
Jrfm 16 00408 g003
Figure 4. Overview of the CPD algorithm where the time series is segmented into clusters of observations after the detection of statistically significant change points (CPs).
Jrfm 16 00408 g004
Figure 5. Example of owner-based transactions from the Wallet Explorer.
Jrfm 16 00408 g005
Figure 6. Medoid time series of the clusters related to the Pirate@40 case: (a) 1st cluster, (b) 2nd cluster; (c) 3rd cluster, (d) 4th cluster, and (e) 5th cluster.
Jrfm 16 00408 g006
Figure 7. Time locations (vertical lines) of the estimated change points in the five-dimensional time series.
Jrfm 16 00408 g007
Figure 8. Medoid time series of the clusters related to the MintPal case: (a) 1st cluster and (b) 2nd cluster.
Jrfm 16 00408 g008
Figure 9. Time locations (vertical lines) of the estimated change points in the two-dimensional time series.
Jrfm 16 00408 g009
Table 1. Features extracted from Bitcoin transactions per day.
NoFeature NameDescription
1 f T X The number of transactions per day
2 r r e c e i v e d Ratio of received transactions to all transactions
3 r s p e n t Ratio of spent transactions to all transactions
4 r c o i n b a s e Ratio of coinbase transactions to all transactions
5 r r e c e i v e d , s p e n t Ratio of received transactions to spent transactions
6 r r e c e i v e d a m o u n t Ratio of received amount over all transacted amount
7 r s p e n t a m o u n t Ratio of spent amount over all transacted amount
8 r c o i n b a s e a m o u n t Ratio of coinbase transactions amount over all transacted amount
9 r r e c e i v e d , s p e n t a m o u n t Ratio of received amount over the spent amount
10 m s p e n t _ U S D a m o u n t Mean amount of spent transactions in USD
11 m r e c e i v e d _ U S D a m o u n t Mean amount of received transactions in USD
12 m c o i n b a s e _ U S D a m o u n t Mean amount of coinbase transactions in USD
13 m b a l a n c e _ U S D Mean balance of the wallet in USD
14 m b a l a n c e Mean balance of the wallet in BTC
15–21 f i _ s p e n t _ U S D Frequency of spent transactions where the amount (in USD) is: 10 i 1 < U S D 10 i for i { 1 , 0 , 1 , 2 , 3 , 4 , 5 }
22–28 f i _ r e c e i v e d _ U S D Frequency of received transactions where the amount (in USD) is: 10 i 1 < U S D 10 i for i { 1 , 0 , 1 , 2 , 3 , 4 , 5 }
Table 2. Calculation of the Silhouette index for different number of clusters in the Pirate@40 case. In bold the number of clusters that corresponds to the maximum value of the index.
No. of ClustersSilhouette Index
20.1683
30.1429
40.1568
50.1820
60.1303
70.0401
80.0985
90.0411
100.0887
11−0.0525
120.0529
Table 3. Clusters and the relevant medoid time series in the Pirate@40 case.
ClusterFeatures in ClusterMedoid FeatureLabel of Medoid
1st4, 10, 11, 13, 14, 17, 21, 23, 27, 2811Mean amount of received transactions (USD)
2nd12, 1812Mean amount of coinbase transactions (USD)
3rd3, 6, 77Ratio of spent amount
4th2, 8, 9, 15, 16, 228Ratio of coinbase transactions amount
5th1, 5, 19, 20, 24, 25, 2624 f 1 _ r e c e i v e d _ U S D
Table 4. Estimated change points for the five-dimensional time series along with the corresponding significance values at 5% significance level.
#TimeDatep-Value
11065 November 20110.002
216130 December 20110.002
326512 April 20120.002
430219 May 20120.006
536521 July 20120.030
Table 5. Calculation of the Silhouette index for different number of clusters in the MintPal case. In bold the number of clusters that corresponds to the maximum value of the index.
No. of ClustersSilhouette Index
20.3056
30.1679
40.1987
50.1161
60.1125
70.1286
80.1082
90.0016
100.1100
110.0584
120.1120
Table 6. Clusters and the relevant medoid time series in the Mintpal case.
ClusterFeatures in ClusterMedoid FeatureLabel of Medoid
1st1, 3, 11, 13, 14, 15, 16, 18, 19,
20, 21, 22, 23, 24, 25, 26, 27, 28
24 f 1 _ r e c e i v e d _ U S D
2nd2, 4, 5, 6, 7, 8, 9, 10, 12, 1710Mean amount of spent transactions (USD)
Table 7. Estimated change points for the two-dimensional time series along with the corresponding significance values at 5% significance level.
#TimeDatep-Value
1359 March 20140.002
27013 April 20140.002
311124 May 20140.002
414123 June 20140.002
517123 July 20140.002
620930 August 20140.006
72422 October 20140.022
Disclaimer/Publisher’s Note: The statements, opinions and data contained in all publications are solely those of the individual author(s) and contributor(s) and not of MDPI and/or the editor(s). MDPI and/or the editor(s) disclaim responsibility for any injury to people or property resulting from any ideas, methods, instructions or products referred to in the content.

