Abstract
The travel industry was the first and most affected by the pandemic. Different countries took action to limit the spread of the coronavirus disease, including total or partial lockdowns and strict restrictions on gatherings of people in public. They closed public and private places, limited the free mobility of residents, and restricted the implementation of services. This study aims to identify and analyze tourists’ behavioral intentions due to COVID-19. It is very difficult to predict the behavior of tourism consumers after the crisis. Therefore, an empirical study was carried out to obtain information from tourists to identify potential changes in their tourism consumption due to COVID-19. This study proves that tourist destination image (TDI) through tourism risk perception (TRP) positively and significantly affects the intention to visit. Therefore, it is recommended that tourism destination managers pay attention to the risk factors perceived by potential tourists who were tested in this study. Future research is also advised to examine factors that cannot be controlled by tourism destination managers, namely government policies regarding the management of tourist destinations in the new normal era.
1. Introduction
COVID-19 has changed the world in every way and has had a significant impact on the tourism industry, one of the world’s largest industries, which is highly sensitive to significant shocks such as the COVID-19 pandemic (Chang et al. 2020). With COVID-19 cases increasing significantly every day worldwide, many travelers may be worried about their vacation plans. Some questions arose concerning whether a tourist destination is becoming unsafe, or vice versa, and whether it will change for the better in the next one or two months (Trip 101 2020). Travel restrictions are in place worldwide due to the COVID-19 outbreak, and the situation changes daily. This is probably the only reason that tourists might want to consider regarding postponing their travel plans because none of them can predict the situation in the near future.
The travel industry was the first and most affected by the pandemic (OECD 2020). Different countries have taken measures to limit the spread of the coronavirus disease, including total or partial lockdowns, strict restrictions on gatherings of people in public and closed public and private places, limited free mobility of residents, and restrictions on the implementation of services. A recent United Nations World Tourism Organization report shows that 96% of tourist destinations globally have imposed travel restrictions (UNWTO 2020). In addition, public mobility modes, namely airplanes, trains, buses, and ships, have been recognized as the main threat to the spread of this new disease, and, therefore, preventive measures must first be taken.
Tourist visits are a predictor of profitability and revenue increases in tourism organizations (Wu and Li 2017). Traveling is not only good for the soul but also good for health. As the COVID-19 situation evolves, many people worldwide continue to travel for: leisure, business, and important humanitarian reasons (World Travel and Tourism Council 2020). According to the World Travel and Tourism Council (2020), there are three ways to keep tourists safe when traveling to a destination. First, the best way to stay safe while traveling is to follow the latest World Health Organization guidelines as closely as possible. Second, tourists must wash their hands regularly and thoroughly, avoid shaking hands or touching their faces, and stay away from crowded places. Third, if possible, tourists must maintain a distance of at least one meter between themselves and other people. In order to understand whether tourists traveling to tourist destinations also pay attention to safety and security during the coronavirus disease outbreak, it is necessary to study their future intentions.
Moreover, the tourism sector was the sector that was hit the hardest by the government’s restrictions on crowds, thus, tourist destinations were practically closed during this period. According to estimates, international tourist arrivals in 2020 declined by 20% to 30% compared to 2019 (Bhati et al. 2016). This affected millions of tourism jobs and will take several years to recover from its fall.
For tourists, security is one of the important things. Risk perception is crucial in tourism decision-making (Sönmez and Graefe 1998; Floyd et al. 2004). Therefore, a tourist destination can only attract visitors if it provides a safe and comfortable environment where tourists feel protected from threats (Yousaf et al. 2018). When consumers make decisions, they will see the risks associated with their decisions.
COVID-19 poses a severe health threat, thus, tourists cancel their trips (Huang and Min 2002), travel by car (Fall and Massey 2005), prevent intense contact with people, and choose outdoor activities (Wen et al. 2005). Last-minute bookings are offered during promotions (Hystad and Keller 2008) and pay more attention to hygiene and ecotourism (Higgins-Desbiolles 2020).
Therefore, it is essential to predict the trajectory of changes in tourist behavior to help tourism managers identify the basis of resilient strategies to respond to the situation in an ideal way. This study aims to identify the behavioral intentions of tourists due to COVID-19. Hai (2006) stated that it is difficult to predict the behavior of tourism consumers after the crisis. However, it is important to carry out an empirical study to obtain information from tourists to identify the potential changes in their consumption in the tourism industry due to COVID-19. Based on this background, the formulation of the problems proposed in this study are:
- Does the tourist destination image (TDI) affect the tourism risk perception (TRP) of the coronavirus disease in the tourism industry in the new normal era in East Java?
- Does the tourist destination image (TDI) affect the intention to visit the tourism industry in the new normal era in East Java?
- Does the tourism risk perception (TRP) of the coronavirus disease affect the intention to visit the tourism industry in the new normal era in East Java?
- Does the tourist destination image (TDI) affect the intention to visit through the tourism risk perception (TRP) of COVID-19 in the tourism industry in the new normal era in East Java?
While the goal to be achieved in this study is to analyze the influence of:
- The tourist destination image (TDI) on the tourism risk perception (TRP) of the coronavirus disease in the tourism industry in the new normal era in East Java.
- The tourist destination image (TDI) on interest in visiting the tourism industry in the New Normal Era in East Java.
- The tourism risk perception (TRP) of the coronavirus disease on the intention to visit the tourism industry in the new normal era in East Java.
- The tourist destination image (TDI) on the intention to visit through the tourism risk perception (TRP) of COVID-19 in the tourism industry in the new normal era in East Java.
The expected benefits of this research are:
- Theoretical benefitsAn understanding of the causes and effects of image theory, risk perception, and intention to visit.
- Empirical benefitsThe findings of this study are expected to be useful in providing strategic input for tourism industry players in managing image, risk perception, and intention to visit.
2. Literature Review
2.1. Previous Research
The first research that became the reference for this research was conducted by Wang et al. (2020) in China. The study explores the mechanisms of risk perception of potential travelers in a severe COVID-19 epidemic, with antecedent effects of places depicted in anti-epidemic music videos and the impact of risk perceptions on place attachment and travel intentions of potential travelers, based on risk perception theory. This study also explored the moderating effect of visit history on the balance of risk perception, place attachment, and travel intention. The perception of tourism risk has been shown to have a significant effect on tourist decision-making behavior; however, the impact of the image of the place depicted in the cultural media of the destination needs to be studied further.
Duong et al. (2022) examined the factors that influence the demand and interest of domestic tourists to support the recovery of tourist destinations in the new normal era. Partial Least Square-Structural Equation Modeling is used to predict the structural model derived from a sample size of 695 valid questionnaires. The results of this study prove that there has been a significant increase in domestic tourists’ travel intentions and their willingness to support the revival of post-pandemic tourist destinations. It is interesting to note that a destination’s health risk image is no longer an important determinant of travelers’ itineraries; other factors, including attitude, financial condition, and social media, significantly influence their travel intentions and support for destination reopening in a country under normal conditions. Theoretically, the research yields important results that contribute to post-disaster crisis management and predicts the behavioral intentions of tourists that can influence the recovery of a tourist destination. Practically speaking, this study also provides some important implications for rebuilding the domestic tourism industry in a more resilient possible future pandemic.
The third reference research is that of Tanina et al. (2022). These studies show that the COVID-19 pandemic has increased the risks for realizing tourism and recreational potential, which must be considered when making management decisions. The authorities of cross-border regions can use the research results to adjust tourism policies under the current restrictions and the increased global risks. Applying mechanisms and methods of territorial planning and management will depend on tourism and recreational potential. For regions with high and above-average potential, the emphasis should be on the participation in federal projects, developing cluster initiatives, and applying a diversification strategy. Areas with medium and low potential should focus on domestic tourist flow, developing interregional cooperation, and the strategy of gaining a competitive advantage.
2.2. Tourist Destination Image (TDI)
According to Haider et al. (1994), the tourist destination image is “the sum of the beliefs, ideals, and impressions people have of a particular place.” Meanwhile, Kotler and Gertner (2002) define tourist destination image as the number of people’s beliefs and impressions about a place. The image represents a simplification of a large number of associations and pieces of information that are linked to a place. An image is a product of the mind trying to process and retrieve important information from many data points about a place.
This definition relates to individual behavior, while other definitions recognize that individual behaviors within a group can influence each other. From a marketing point of view, it is important to understand aspects of the image shared with other group members. This understanding enables market segmentation and facilitates the formulation of marketing strategies. For this reason, the definition of tourist destination image proposed by Lawson and Baud (1977) includes both the image from a personal point of view and the image shared by the group. They define the image as the expression of all objective knowledge, impressions, prejudices, imaginations, and emotional thoughts of a person or group in a given place.
Tourist destination image (TDI) affects tourists’ travel decision-making, their behavior towards a destination, and the level of satisfaction and memory about the experience. Therefore, the perceived image is the basis of the evaluation or selection process and thus provides the relationship between motivation and goal selection (O’Leary and Deegan 2003).
According to Agapito et al. (2013), the measurement of tourist destination image uses the cognitive-affective-conative model, namely:
- Cognitive image
- Affective image
- Conative image
2.3. Tourism Risk Perception (TRP)
Since the 1990s, the concept of tourism risk perception has emerged. The perception of tourism risk has received widespread attention from psychologists and consumer behaviorists (Sönmez and Graefe 1998). The academic background in tourism risk perception is currently studied in cognitive psychology, consumer behavior, and travel safety.
According to Cui et al. (2016), the concept of tourism risk perception can be divided into three views, namely: (1) Tourism risk perception (subjective) is the subjective feeling of tourists towards the negative consequences or negative impacts that may occur during a trip. (2) Tourism risk perception (objective) is an objective evaluation of tourists against negative consequences or impacts that may occur during the trip. (3) Tourism risk perception (cognitive) is a cognitive evaluation of tourists who exceed the threshold for the portion of negative consequences or impacts that may occur during the trip.
Two dimensions determine the factors that influence perceptions of tourism risk (Reisinger and Mavondo 2006; Kozak et al. 2007), namely:
- 14.
- Subjective factors that affect tourism risk perception.
These are divided into two categories: demographic variables and individual cognitive abilities. Individual demographic variables include age, gender, educational experience, academic background, social status, geography, education level, income, and social experience. Individual cognitive ability variables focus on temperament, personality, emotions, views, values, cognitive and meta-cognitive, etc. Subjective factors that influence perceptions of tourism risk are (Amir et al. 2015):
- Women’s sensitivity to travel risks are slightly higher than men’s.
- The similarity of culture and psychology and the spatial proximity of the geographical position determine the tourism risk perception.
- The higher a person’s level of education the more frequently one is in contact with the media, and the higher the class status the stronger the perceived risk level.
- When people trust informative sources and institutions, their risk perception will be stronger.
- Urban residents have a stronger perception of risk than rural residents.
- People’s concerns, anxieties, and other emotions about travel risks can affect an individuals’ awareness of risk perceptions, whereas understanding individual travel risks will also affect their emotional intensity.
The objective factors that affect tourists’ perceptions of tourism risks refer to the risks that may occur during a tour.
These factors can be summarized as the dimensions of tourism risk perception. The results of the studies on the objective factors of tourism risk perception are often grouped into five–seven dimensions, namely:
- Five-dimensional risk: psychological risk, financial risk, performance risk, health risks, and social risk.
- Six-dimensional risk: performance risk, physical risk, financial risk, psychological risk, social risk, and time risk.
- Seven-dimensional risk: physical risk, economic risk, equipment risk, social risk, psychological risk, time risk, and risk of missed opportunity.
Blesic et al. (2022) presented the objective travel risk through different factors, ranging from 2 (physical risk and equipment risk) to 10 (equipment risk, financial risk, health risk, physical risk, political risk, social risk, satisfaction risk, time risk, terrorism risk, and psychological risk.
2.4. Intention to Visit
Traditionally, destinations are well-defined geographic areas (Buhalis 2000; Hsu et al. 2009; Blasco et al. 2016). There are other understandings of destinations as products or brands (Hsu et al. 2009; Smallman and Moore 2010; Blasco et al. 2016). Others suggest that destinations are complex, unique products, or even a portfolio of products and services consisting of an area’s climate, infrastructure, superstructure, and natural and cultural attributes.
Jansen-Verbeke (1986) categorized the elements of a tourist destination as primary (activities, physical settings, and social/cultural attributes), secondary (catering and shopping), and additional (accessibility and tourist information). Meanwhile, Mill and Morrison (1992) stated that destinations include attractions, facilities, infrastructure, transportation, and hospitality. Meanwhile, Buhalis (2000) said there are six important components of a destination: attractions, accessibility, facilities, available packages, activities, and additional services. However, Holloway et al. (2009) stated that there are only three core elements in a destination’s success in attracting tourists: attractions, facilities, and accessibility. Meanwhile, according to Moutinho (1987), the elements in the success of a destination in attracting tourists are costs, attractions, facilities, travel opportunities, travel arrangements, and travel information. These elements and attributes influence tourists’ decisions in choosing tourist destinations in slightly different ways.
2.5. Research Model
Figure 1 illustrates that tourist destination image affects tourist risk perception and also influences intention to visit. In addition, tourist destination image influences the intention to visit through the tourist risk perception.
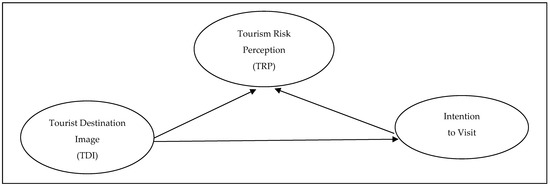
Figure 1.
Research Model.
2.6. Hypothesis
Wang et al. (2020) in their research proved that the perception of tourism risk had been shown to have a significant effect on tourist decision-making behavior; however, the impact of the image of the place depicted in the cultural media of the destination needs to be studied further. There is a positive and significant impact between the value of the destination (destination image) on the decision to visit, and there is a positive and significant effect on the perception of risk on the decision to visit tourism destinations.
H1.
Tourist destination image (TDI) significantly affects tourism risk perception (TRP) in the tourism industry in the new normal era in East Java.
Based on the research results of Shafiee et al. (2022), destination image has a significant and positive effect on the overall image, and the overall image has a significant and positive effect on satisfaction, intention to revisit the destination, and word of mouth. Furthermore, the results of the research conducted by Lestari et al. (2019) showed: (1) The destination image has no significant effect on the interest to return to visit; (2) The destination image and its perceived value have a significant and positive effect on the satisfaction of tourists; (3) Perceived value and the satisfaction of tourists have a significant and positive impact on the interest to return to visit on the attractions.
H2.
Tourist destination image (TDI) significantly affects the interest in visiting the tourism industry in the new normal era in East Java.
In their research, Abidin et al. (2022) proved that tourism knowledge and risk attitude are positively related to the visit intention; however, the perceived health risk is negatively related. The significant positive relationship between tourism knowledge and ecotourist visit intention is mediated by perceived health risk and risk attitude. However, Cahigas et al. (2022) in their research also prove that hedonic motivation had the highest direct effect on tourist traveling intention, attitude, and COVID-19 safety protocols. Meanwhile, social media influence, perceived behavioral control, and subjective norms were insignificant to tourists’ intention to travel during the COVID-19 pandemic.
H3.
Perceptions of tourism risk to COVID-19 significantly affect the intention to visit the tourism industry in the new normal era in East Java.
In their research, Duong et al. (2022) proved that there has been a significant increase in domestic tourists’ travel intentions and their willingness to support the revival of post-pandemic tourist destinations. It is interesting to note that the health risk image of a destination is no longer an important determinant of travelers’ itineraries, while other factors, including attitudes, financial conditions, and social media, significantly influence their travel intentions and support for the reopening of destinations in new countries under normal conditions.
H4.
Tourist destination image (TDI) has a significant effect on the intention to visit through the perception of the risk of COVID-19 in the tourism industry in the new normal era in East Java.
3. Research Methods
3.1. Research Design
The type of research used in this research is quantitative research. The quantitative research method is a type of research whose specifications are systematic, planned, and structured from the start to the creation of the research design.
3.2. Variable Operational Definition
- 15.
- Tourist destination image (TDI)
Tourist destination image (TDI) is an image of a tourist destination. Agapito et al. (2013) measured the image of a tourist destination using the cognitive–affective–conative model: cognitive, affective, and conative.
Tourism Risk Perception (TRP)
It is a perceived risk by tourists when visiting a tourist destination. This variable was measured by (Anderson and Mansi 2009; Fornell 2001): physical risk, financial risk, performance risk, psychological risk, and security risk.
- 16.
- Intention to visit
Someone intends to visit a tourist spot. This variable is measured by (Chin et al. 2015): self-congruity, attitude, destination image, and perceived quality.
3.3. Data Types and Sources
The data sources used by the researchers in this study were primary data sources obtained by distributing questionnaires directly to respondents, and also secondary data sources obtained through notes related to the research topic. The type of data used in this research consists of quantitative data types in the form of numbers and qualitative data types in the form of notes that are relevant to the research.
3.4. Data Measurement
Researchers in this study used a Likert measurement scale. With a Likert Scale, the variables to be measured are translated into variable measurements. Then, these measurements are used as a starting point for compiling instrument items, statements, or questions in the questionnaire. The answer to each instrument item uses a Likert Scale with a grade from very negative to very positive, with a score of 1–5.
3.5. Population and Research Sample
The research population consists of residents who live in the East Java Province, thus, the sampling for this study was 200 people. According to Hair et al. (2010, p. 137), the sampling technique used is random sampling, which takes a random sample of a determined population and suggests an appropriate sample size between 100–200 respondents in order to use interpretation estimation with the Structural Equation Model (SEM). The sampling technique uses simple random sampling, which is also called simple random sampling, which is a sampling technique that provides equal opportunities for each member of the population to become the research sample. The characteristics of the sample in this study were: residents in East Java, minimum age 21 years, understood COVID-19, and were interested in visiting a tourist destination.
3.6. Data Analysis Technique
Data processing was carried out after the distribution of the questionnaire met the requirements/sufficiency. The initial step was to recap all questionnaire data in Microsoft Excel. Then, from the data summary, the average of each indicator was searched. Then, the average results were processed again with SPSS software to look for the data’s normality, validity, and reliability. The next step was to test whether the results were normal or not. If they were not normal, data retrieval was carried out to correct abnormal data. The next step was to test the validity. If the result was invalid, then the invalid items were issued. The next step was the reliability test. If the results were not reliable, the unreliable items were excluded. If these three steps were appropriate, then it could proceed to SEM (Structural Equation Modeling) data processing.
4. Analysis and Discussion
4.1. Characteristics of Respondents
- 1.
- Residents of East Java
Based on the research results, it can be seen that the number of respondents who were residents in East Java was 200 (100%). This meant that all respondents in this study had met the criteria set by the researcher so that data analysis can be continued.
- 2.
- Minimum Age of 21 Years
The research results showed that the number of respondents who were at least 21 years old was 200, with a percentage of 100. This meant that all respondents in this study had met the criteria set by the researcher so that data analysis can be continued.
- 3.
- Understanding COVID-19
The results showed that the number of respondents who understood COVID-19 was 200 people (100%). This meant that all respondents lived in Surabaya. Thus, data analysis can be continued.
- 4.
- Have an Interest in Visiting a Tourist Destination
The results showed that the number of respondents who were interested in visiting a tourist destination was 200 (100%). This meant that all respondents had an interest in visiting a tourist destination. Thus, data analysis can be continued.
4.2. Descriptive Statistics of Research Variables
Descriptive statistics explained the average value of respondents for each indicator of the research variable. The average value of the answers was grouped into five categories, as shown in Table 1. The research category of the average value was used to assess the respondents’ answers to each research indicator. Furthermore, the respondents’ answers were evaluated for each variable by using the assessment criteria.

Table 1.
Average Interval of Research Variables.
4.3. Tourist Destination Image (TDI) Descriptive Statistics
Based on Table 2, the average value of the tourist destination image (TDI) variable was 3.86, with an average standard deviation of 1.819. The respondent’s answer to the tourist destination image (TDI) was “Agree”. The effective image indicator had the highest mean value of 3.91 compared to other indicators. Meanwhile, the conative image indicator had the lowest mean value of 3.76.
Table 2.
Tourist Destination Image (TDI) Descriptive Statistics.
4.4. Tourism Risk Perception (TRP) Descriptive Statistics
The tourism risk perception (TRP) variable was measured by five indicators based on research results (Table 3). The average value for tourism risk perception (TRP) was 3.92, with an average standard deviation of 1.261. The respondent’s answer to tourism risk perception (TRP) was “Agree.” The financial risk indicator ad the highest mean value compared to other indicators, which was 4.79. Meanwhile, the security risk indicator had the lowest mean value of 3.58.
Table 3.
Tourism Risk Perception (TRP) Descriptive Statistics.
4.5. Descriptive Statistics of Intention to Visit
Based on Table 4, the variable of intention to visit in this study was measured using four measurements. The average score of respondents’ answers to the variable of intention to visit was 4.08, with an average standard deviation of 1.108. This proves that the score of respondents’ answers to the intention to visit was “Agree.” Meanwhile, the destination image had the highest average score of 4.28 (agree) compared to other measurements. Meanwhile, the attitude measurement had the lowest score of 3.87. If the decimal was rounded up, it would become 4 (agree).
Table 4.
Descriptive Statistics of Intention to Visit.
5. Data Analysis
5.1. Validity Test
The validity test in this study (Table 5) was carried out on all indicators of the research variables, which amounted to 12 indicators. The research results show that all indicators had a t-value greater than 1.96, thus, it can be said that all indicators were valid and feasible to use.
Table 5.
Validity Test Results.
5.2. Reliability ()Test
Bagozzi and Yi (1988) stated that the cut-off level for saying that composite reliability was quite good was 0.6. The reliability test used information on loading indicators and error variance obtained in the completely standardized solutions section.
The results showed that all of the variables’ Construct Reliability (CR) was higher than 0.6 (Table 6). Thus, it can be concluded that all reliable variables were latent constructs, meaning they were worthy of further analysis.
Table 6.
Reliability Test Results.
5.3. Normality Test
The normality test in this study can be seen from the output of the skewness and kurtosis section, which is processed using the LISREL application.
The results of the multivariate distribution analysis showed that the data obtained in the study was normally distributed (Table 7).
Table 7.
Multivariate Normality Test Results.
Based on Table 8, it can be seen that the assumption of normality was not met because the p-value was less than the cut-off set at 0.05.
Table 8.
Univariate Normality Test Results.
5.4. Overall Model Fit Test
Based on the overall model test results in Table 9, NFI and RFI had a cut-off value of 0.9 (good fit). In contrast, RMSEA had a cut-off value of <0.08 (close fit). AGFI, IFI, and CFI were in the marginal fit category because they had a cut-off value of 0.9, and GFI had a cut-off value of 0.89, which was 0.8 GFI 0.9, thus, it was in the appropriate category.
Table 9.
Fit Model Test.
From the various tests of the overall suitability of the model, it can be concluded that the research model proposed in this study is acceptable. The research model can predict the effect of each independent variable on the dependent variable.
5.5. Structural Equation
Structural equations from the results of data processing are as follows:
Y1 = 0.84 × X, Errorvar. = 0.18, R2 = 0.92
(0.09) (0.03)
10.93 7.09
Y2 = 0.69 × Y1 + 0.73 × X, Errorvar. = 0.048, R2 = 0.89
(0.01) (0.06) (0.032)
5.16 6.41 4.75
Source: Data, processed.
Based on these structural equations, it can be explained as follows:
Y1 = 0.84 × X, Errorvar. = 0.18, R2 = 0.92
(0.09) (0.03)
10.93 7.09
(0.09) (0.03)
10.93 7.09
Y2 = 0.69 × Y1 + 0.73 × X, Errorvar. = 0.048, R2 = 0.89
(0.01) (0.06) (0.032)
5.16 6.41 4.75
(0.01) (0.06) (0.032)
5.16 6.41 4.75
This equation explains that the tourist destination image (TDI) had a positive effect on the intention to visit with an estimated value of 0.73, and the tourism risk perception (TRP) had a positive effect on the intention to visit with an estimated value of 0.69.
5.6. Research Hypothesis Testing
Table 10 shows the results of the hypothesis testing in the study, as follows:
Table 10.
Hypothesis Test Results.
- The loading factor value of variable X to Y1 was 0.87, while the t value was 4.83. Based on the provisions, the calculated t value was 1.96. These results indicate that the tourism destination image variable (TDI) had a positive and significant effect on the tourism risk perception variable (TRP).
- The loading factor value of the tourist destination image (TDI) variable to the intention to visit was 0.79, while the t-value was 10.19. Based on the provisions, the t-value of 1.96 shows that the tourist destination image (TDI) variable had a positive and significant effect on the intention to visit variable.
- The loading factor value of the tourism risk perception (TRP) variable to the intention to visit was 0.74, while the t-value was 5.23. Based on the provision that the t-value was 1.96, it can be stated that the tourism risk perception (TRP) variable had a positive and significant effect on the intention to visit.
- The loading factor value of the tourist destination image (TDI) variable to the intention to visit through tourism risk perception (TRP) was 0.58, while the t-value was 4.19. Based on the provision that the t-value was 1.96, it can be stated that the tourist destination image (TDI) variable had a positive and significant effect on the intention to visit through tourism risk perception (TRP).
6. Discussion
6.1. Tourist Destination Image (TDI) Affects Tourism Risk Perception (TRP) of COVID-19
The descriptive statistic of the tourist destination image (TDI) variable had an average mean of 3.86, which meant that most respondents agreed with these indicators for measuring the tourist destination image (TDI) variable. Meanwhile, the tourism risk perception (TRP) variable had an average mean of 4.28. Most respondents also agreed that the indicators measured the tourism risk perception (TRP) variable. The variable indicators of tourist destination image (TDI) were cognitive, affective, and conative images. In contrast, the tourism risk perception (TRP) variable measurements were physical risk, financial risk, performance risk, psychological risk, and security risk.
The results of the hypothesis testing prove that tourist destination image (TDI) had a positive effect on tourism risk perception (TRP), with a loading factor value of 0.87 and a t-value of 4.83 > 1.96. It can be interpreted that the higher the image of a tourist destination, the higher the risk perceived by potential tourists. The results of this study are interesting because COVID-19 is very closely related to the density of visitors in tourist destinations with a high image. Therefore, the density of visitors impacts the risks perceived by potential tourists.
The results of this study support the results of the previous research conducted by Wang et al. (2020), indicating that there is a positive and significant impact between the value of the destination (destination image), the perception of risk, and the decision to visit tourism destinations.
6.2. Tourist Destination Image (TDI) Affects Intention to Visit
The descriptive statistic of the tourist destination image (TDI) variable had an average mean of 3.86, which meant that most respondents agreed with the indicator for measuring the tourist destination image (TDI) variable. Meanwhile, the variable intention to visit had an average mean of 4.08, which meant that most respondents agreed with the indicators for measuring the variable intention to visit. The indicators for the variable tourist destination image (TDI) were: cognitive image, affective image, and conative image. The variables for intention to visit were: self-congruity, attitude, destination image, and perceived quality.
The results of the hypothesis testing prove that tourist destination image (TDI) had a positive and significant influence on the intention to visit with a loading factor value of 0.79 and a t-value of 10.19 > 1.96, meaning that the higher the tourist destination image (TDI) the greater the intention to visit. In other words, the interest of potential tourists visiting a destination will be higher if the image of the destination is also high.
The results of this study support the results of the previous research conducted by Shafiee et al. (2022). The research results showed that the destination image had a significant and positive effect on the intention to revisit a destination. However, this does not support the results of the previous research conducted by Lestari et al. (2019). The destination image had no significant effect on the interest in returning to visit.
6.3. Tourism Risk Perception (TRP) Affects Intention to Visit
Descriptive statistics of the tourism risk perception (TRP) variable had an average mean of 4.28, which meant that most respondents agreed with these indicators to measure the tourism risk perception (TRP) variable. In contrast, the descriptive statistics of the intention to visit variable had an average mean of 4.08, meaning that most of the respondents agreed with the indicator to measure the variable of intention to visit.
The hypothesis test results proved that the tourism risk perception (TRP) of COVID-19 had a positive and significant effect on the intention to visit with a loading factor value of 0.74 and a t-value of 5.23 > 1.96. The results of this study are interesting because they prove that if the perceived risk of potential tourists toward a destination is higher, the intention to visit the destination will also be higher. This is because the risks that may occur have been realized.
The results of this study do not support the results of the previous research conducted by Abidin et al. (2022), which proved that perceived health risk is negatively related to the visit intention. While supporting the results of the previous research conducted by Cahigas et al. (2022), perceived behavioral control is insignificant to tourists’ intention to travel during the COVID-19 pandemic.
6.4. Tourist Destination Image (TDI) Affects Intention to Visit through Tourism Risk Perception of COVID-19
Based on the results of the hypothesis testing in Table 10 it can be seen that tourist destination image (TDI) affects intention to visit through tourism risk perception (TRP) with a loading factor value of 0.58 and a t-value of 4.19 > 1.96. The results of this study prove that the perception of potential visitors to a tourist destination during COVID-19 is an intermediary between the influence of the image of a tourist destination and the interest of potential visitors to a tourist destination. This proves that the perception of potential visitors to the risk of COVID-19 is a variable worth considering.
The results of this study support the results of the previous research conducted by Duong et al. (2022). Their research proved that there had been a significant increase in domestic tourists’ travel intentions and their willingness to support the revival of post-pandemic tourist destinations.
7. Conclusions and Suggestions
7.1. Conclusions
Based on the results of the discussion, the conclusions of this study are: (1) Tourist destination image (TDI) significantly affects tourism risk perception (TRP) in the tourism industry in the new normal era in East Java. Thus, hypothesis 1 of this study is accepted. (2) Tourist destination image (TDI) significantly affects the intention to visit the tourism industry in the new normal era in East Java. Thus, hypothesis 2 of this study is accepted. (3) Tourism risk perception (TRP) of COVID-19 significantly affects the intention to visit the tourism industry in the new normal era in East Java. Thus, hypothesis 3 of this study is accepted. (4) Tourist destination image (TDI) significantly affects the intention to visit through tourism risk perception (TRP) of COVID-19 in the tourism industry in the new normal era in East Java. Thus, hypothesis 4 of this study is accepted. (5) Tourist experience at the destination has proven important in explaining behavior during and after the trip. The behavior of potential tourists is influenced by: economic, sociocultural, and environmental factors (Gao et al. 2021). If the manager of a tourist destination pays attention to ethical aspects, it will benefit the business itself because it will determine the ethical image and reputation of the destination. The image is an emotional representation of potential tourists toward tourist destinations, and a perceptive/cognitive evaluation of potential tourists, which refers to individual knowledge about tourist destinations. The perceived ethics of tourist destinations will assist potential tourists in forming cognitive evaluations and, therefore, will determine potential tourists’ behavior. These ethical considerations will affect the image and added value of tourism destinations. Tourist interactions with other people at the destination will determine emotional solidarity, satisfaction, and likelihood of revisiting.
7.2. Suggestion
7.2.1. Academic Advice
For academics and other researchers in the future, this research is expected to be used as reading/reference material if researching matters related to tourist destination image (TDI), tourism risk perception (TRP) of COVID-19, and intention to visit.
7.2.2. Practical Advice
Based on each of these research variables, practical suggestions for the managers of tourist destinations in East Java are: (1) Tourist destination image (TDI). In the new normal era, managers of tourist destinations must improve the image of tourist destinations that provide a sense of security and comfort for potential visitors because prospective visitors have a fairly good understanding of the risks they face from COVID-19. (2) Tourism risk perception (TRP). In the new normal era, managers of tourist destinations must be able to suppress the perception of potential visitors to the risks of COVID-19 that may be faced in crowds. This is performed so that potential visitors feel safe and comfortable when they are in a crowd. (3) Intention to visit. In the new normal era, the managers of tourist destinations must seek to increase the interest of potential visitors to tourist attractions by improving their image and fostering a positive perception of the risks of traveling in the new era of COVID-19.
8. Limitations and Future Research
The limitation of this study is that it did not conduct an in-depth test of the different attitudes of each person toward risk. Therefore, this kind of research is suggested to perform different tests on each person’s attitude toward risk as a moderator variable.
Author Contributions
Conceptualization, C.E.S.; methodology, B.S.; software, C.E.S.; validation, C.E.S., Y.B.H. and B.S.; formal analysis, C.E.S.; investigation, C.E.S.; resources, Y.B.H.; data curation, B.S.; writing—original draft preparation, C.E.S.; writing—review and editing, Y.B.H. and B.S.; visualization, C.E.S.; superviseon, Y.B.H. and B.S.; project administration, C.E.S.; funding acquisition, Y.B.H. All authors have read and agreed to the published version of the manuscript.
Funding
This research received no external funding.
Data Availability Statement
All data have been given in the manuscript.
Conflicts of Interest
The authors declare no conflict of interest.
References
- Abidin, Zainal, Wahyu Handayani, Emeraldo A. Zaky, and Achmad D. Faturrahman. 2022. Perceived risk and attitude’s mediating role between tourism knowledge and visit intention during the COVID-19 pandemic: Implementation for coastal-ecotourism management. Heliyon 8: 1–10. [Google Scholar] [CrossRef]
- Agapito, Dora, Patrícia Oom do Valle, and Júlio da Costa Mendes. 2012. Sensory Marketing and Tourist Experiences. Spatial and Organizational Dynamics Discussion Papers 10: 7–19. Available online: http://www.cieo.ualg.pt/discussionpapers/10/article1.pdf (accessed on 30 July 2012).
- Amir, Ahmad Fitri, Mohd Noor Ismawi Ismail, and Toh Poh See. 2015. Sustainable Tourist Environment: Perception Of International Women Travelers on Safety and Security in Kuala Lumpur. Procedia—Social and Behavioral Sciences 168: 123–33. [Google Scholar]
- Anderson, Eugene, and Sattar Mansi. 2009. Does customer satisfaction matter to investors? Findings from the bond market. Journal of Marketing Research 46: 703–14. [Google Scholar] [CrossRef]
- Bagozzi, Richard P., and Youjae Yi. 1988. On the Evaluation of Structural Equation Models. Journal of the Academy of Marketing Science 16: 74–94. [Google Scholar] [CrossRef]
- Bhati, Abhishek, Aditya Upadhayaya, and Amit Sharma. 2016. National Disaster Management in The Asean-5: An Analysis of Tourism Resilience. Tourism Review 71: 148–64. [Google Scholar] [CrossRef]
- Blasco, Dani, Jaume Guia, and Lluis And Prats. 2014. Tourism Destination Zoning in Mountain Regions: A Consumer-Based Approach. Tourism Geographie 16: 512–28. [Google Scholar] [CrossRef]
- Blešić, Ivana, Milan Ivkov, Jelena Tepavčević, Jovanka Popov Raljić, Marko D. Petrović, Tamara Gajić, Tatiana N. Tretiakova, Julia A. Syromiatnikova, Dunja Demirović Bajrami, Milica Aleksić, and et al. 2022. Risky Travel? Subjective vs. Objective Perceived Risks in Travel Behaviour—Influence of Hydro-Meteorological Hazards in South-Eastern Europe on Serbian Tourists. Atmosphere 13: 1671. [Google Scholar] [CrossRef]
- Buhalis, Dimitrios. 2000. Marketing the Competitive Destination of the Future. Tourism Management 21: 97–116. [Google Scholar] [CrossRef]
- Cahigas, Maela Madel L., Yogi Tri Prasetyo, James Alexander, Putu Lauterina Sutapa, Shannen Wiratama, Vincent Arvin, Reny Nadlifatin, and Satria Fadil Persada. 2022. Factors Affecting Visiting Behavior to Bali during the COVID-19 Pandemic: An Extended Theory of Planned Behavior Approach. Sustainability 14: 10424. [Google Scholar] [CrossRef]
- Chang, Chia-Lin, Michael McAleer, and Vicente Ramos. 2020. A Charter for Sustainable Tourism After COVID-19. Sustainability 12: 3671. [Google Scholar] [CrossRef]
- Chin, Thoo Ai, Huam Hon Tat, and Zuraidah Sulaiman. 2015. Green Supply Chain Management, Environmental Collaboration and Sustainability Performance. Procedia CIRP 26: 695–99. [Google Scholar] [CrossRef]
- Cui, Yihui, Ilya Prokin, Hao Xu, Bruno Delord, Stephane Genet, Laurent Venance, and Hugues Berry. 2016. Endocannabinoid Dynamics Gate Spike-Timing Dependent Depression and Potentiation. eLife 5: e13185. [Google Scholar] [CrossRef]
- Duong, Long Hai, Quyet Dinh Phan, Tung Thanh Nguyen, Da Van Huynh, Thong Tri Truong, and Khanh Quoc Duong. 2022. Understanding Tourists’ Behavioral Intention and Destination Support in Post-pandemic Recovery: The Case of the Vietnamese Domestic Market. Sustainability 14: 9969. [Google Scholar] [CrossRef]
- Fall, Lisa T., and Joseph Eric Massey. 2005. The Significance of Crisis Communication in The Aftermath of a National Investigation of How Tourism Managers Have Re-Tooled Their Promotional Campaigns. Journal of Travel & Tourism Marketing 19: 77–90. [Google Scholar] [CrossRef]
- Floyd, Myron. F., Heather Gibson, Lori Pennington-Gray, and Brijesh Thapa. 2004. The Effect of Risk Perceptions on Intentions to Travel in The Aftermath of September 11, 2001. Journal of Travel & Tourism Marketing 15: 19–38. [Google Scholar] [CrossRef]
- Fornell, Claes. 2001. The Score of Satisfaction. Harvard Business Review 79: 120–21. [Google Scholar]
- Gao, Yang, Yaofeng Ma, Kai Bai, Yuan Li, and Xinyan Liu. 2021. Which factors influence individual pro-environmental behavior in the tourism context: Rationality, affect, or morality? Asia Pacific Journal of Tourism Research 26: 516–38. [Google Scholar] [CrossRef]
- Hai, Vo Thanh. 2006. Time For Risks: A Marketing Approach for A Tourist Destination in The Face of The New Global Tourism Context. The Journal of Management Sciences 222: 35–45. [Google Scholar] [CrossRef]
- Haider, Donald, Philip Kotler, and Irving Rein. 1994. There’s No Place Like Our Place! Public Management 76: 15–18. [Google Scholar]
- Hair, Josepf F., William C. Black, Barry J. Babin, and Rolph E. Anderson. 2010. Multivariate Data Analysis, 7th ed. New York: Pearson. [Google Scholar]
- Higgins-Desbiolles, Freya. 2020. Socializing Tourism for Social and Ecological Justice after COVID-19. Tourism Geographies 22: 610–23. Available online: https://www.unwto.org/news/covid-19-response-travel-restrictions (accessed on 20 March 2021). [CrossRef]
- Holloway, Chris, Claire Humphreys, and Rob Davidson. 2009. The Business of Tourism, 8th ed. Essex: Pearson Education Limited. [Google Scholar]
- Hsu, Tzu-Kuang, Yi-Fan Tsai, and H. H. Wu. 2009. The Preference Analysis for Tourist Choice of Destination: A Case Study of Taiwan. Tourism Management 30: 288–97. [Google Scholar] [CrossRef]
- Huang, Jen-Hung, and Jennifer C. H. Min. 2002. Earthquake Devastation and Recovery in Tourism: The Taiwan Case. Tourism Management 23: 145–54. [Google Scholar] [CrossRef]
- Hystad, Perry W., and P. C. Keller. 2008. Towards A Destination Tourism Disaster Management Framework: Long-Term Lessons from A Forest Fire Disaster. Tourism Management 29: 151–62. [Google Scholar] [CrossRef]
- Jansen-Verbeke, Myriam. 1986. Inner-City Tourism: Resources, Tourists and Promoters. Annals of Tourism Research 13: 79–100. [Google Scholar] [CrossRef]
- Kozak, Metin, John C. Crotts, and Law Rob. 2007. The Impact of The Perception of Risk on International Travelers. International Journal of Tourism Research 9: 233–42. [Google Scholar] [CrossRef]
- Kotler, Philip, and David Gertner. 2002. Country as brand, product, and beyond: A place marketing and brand management perspective. Journal of Brand Management 9: 249–61. [Google Scholar] [CrossRef]
- Lawson, Fred, and Bond-Bovy Manuel Baud. 1977. Tourism and Recreational Development. London: Architectural Press. [Google Scholar]
- Lestari, Anggia Ayu, Yasri Yasri, and Abror Abror. 2019. Effect of Destination Image, Perceived Value, Tourism Satisfaction with Return To Visit. Advances in Economics. Business and Management Research 64: 546–52. [Google Scholar]
- Mill, Robert Christie, and Alastair M. Morrison. 1992. The Tourism System: An Introductory Text, Englewood Cliffs. New York: Prentice-Hall. [Google Scholar]
- Moutinho, Luiz. 1987. Consumer Behavior in Tourism. European Journal of Marketing 21: 3–44. [Google Scholar] [CrossRef]
- OECD. 2020. Tourism Policy Responses to the Coronavirus (COVID-19). OECD. Available online: https://read.oecd-ilibrary.org/view/?ref=124_124984-7uf8nm95se&title=Covid-19_Tourism_Policy_Responses (accessed on 17 July 2021).
- O’Leary, Sinéad, and Jim Deegan. 2003. People, Pace, Place: Qualitative and Quantitative Images of Ireland as A Tourism Destination in France. Journal of Vacation Marketing 9: 213–26. [Google Scholar]
- Reisinger, Yvette, and Felix Mavondo. 2006. Cultural Differences in Travel Risk Perception. Journal of Travel & Tourism Marketing 20: 13–31. [Google Scholar]
- Shafiee, Majid Mohammad, Reihaneh Alsadat Tabaeeian, and Hoda Tavakoli. 2016. The Effect of Destination Image on Tourist Satisfaction, Intention to Revisit and WOM: An Empirical Research in Foursquare Social Media. Paper presented at 2016 10th International Conference on e-Commerce in Developing Countries: With Focus on e-Tourism (ECDC), Isfahan, Iran, April 15–16. [Google Scholar]
- Smallman, Clive, and Kevin Moore. 2010. Process Studies of Tourists’ Decision-Making. Annals of Tourism Research 37: 397–422. [Google Scholar] [CrossRef]
- Sönmez, Sönmez, and Allan R. Graefe. 1998. Determining Future Travel Behavior from Past Travel Experience and Perceptions of Risk and Safety. Journal of Travel Research 37: 171–77. [Google Scholar] [CrossRef]
- Tanina, Anna, Larissa Tashenova, Yevgeni Konyshev, Dinara Mamrayeva, and Dmitriy Rodionov. 2022. The Tourist and Recreational Potential of Cross-Border Regions of Russia and Kazakhstan during the COVID-19 Pandemic: Estimation of the Current State and Possible Risks. Economies 10: 201. [Google Scholar] [CrossRef]
- Trip 101. 2020. Coronavirus (COVID-19) Travel Advice: Is It Safe to Travel Anywhere? Available online: https://trip101.com/article/coronavirus-travel-advice-is-it-safe-to-travel-anywhere (accessed on 11 July 2021).
- UNWTO. 2020. COVID-19 Response: Of Global Destinations Impose Travel Restrictions, UNWTO Reports. Madrid: UNWTO. [Google Scholar]
- Wang, Yenan, Yu Di, Junjie Ye, and Wenbin Wei. 2020. Study on the Public Psychological States and Its Related Factors During the Outbreak of Coronavirus Disease 2019 (COVID-19) in Some Regions of China. Psychology, Health & Medicine 30: 1–10. [Google Scholar] [CrossRef]
- Wen, Zhang, Gu Huimin, and Raphael R. Kavanaugh. 2005. The Impacts of SARS on the Consumer Behaviour of Chinese Domestic Tourists. Current Issues in Tourism 8: 22–38. [Google Scholar] [CrossRef]
- World Travel and Tourism Council. 2020. Traveller COVID-19 Hub. Available online: https://wttc.org/en-gb/COVID-19/Traveller-Hub (accessed on 11 July 2021).
- Wu, Hung Che, and Tao Li. 2017. A Study of Experiential Quality, Perceived Value, Heritage Image, Experiential Satisfaction, and Behavioral Intentions for Heritage Tourists. Journal of Hospitality & Tourism Research 41: 904–44. [Google Scholar]
- Yousaf, Anish, Insha Amin, and Jose Antonio C. Santos. 2018. Tourist’s Motivations to Travel: A Theoretical Perspective on The Existing Literture. Tourism and Hospitality Management 24: 1–15. [Google Scholar] [CrossRef]
Disclaimer/Publisher’s Note: The statements, opinions and data contained in all publications are solely those of the individual author(s) and contributor(s) and not of MDPI and/or the editor(s). MDPI and/or the editor(s) disclaim responsibility for any injury to people or property resulting from any ideas, methods, instructions or products referred to in the content. |
© 2023 by the authors. Licensee MDPI, Basel, Switzerland. This article is an open access article distributed under the terms and conditions of the Creative Commons Attribution (CC BY) license (https://creativecommons.org/licenses/by/4.0/).