Article

Environmental Performance and a Nation’s Growth: Does the Economic Status and Style of Governance of a Country Matter?

1
Symbiosis Institute of Business Management, Symbiosis International (Deemed University), Pune 412115, India
2
Management Development Institute Murshidabad, Murshidabad 742235, India
3
Symbiosis School of Banking and Finance, Symbiosis International (Deemed University), Pune 412115, India
4
Academics, Symbiosis International (Deemed University), Pune 412115, India
*
Author to whom correspondence should be addressed.
J. Risk Financial Manag. 2023, 16(10), 460; https://doi.org/10.3390/jrfm16100460
Submission received: 16 August 2023 / Revised: 13 October 2023 / Accepted: 19 October 2023 / Published: 22 October 2023
(This article belongs to the Special Issue Financial Markets, Financial Volatility and Beyond (Volume III))

Abstract

:
The literature abounds with studies on the impact of the growth of nations on the environment. However, studies on the financial materiality of environmental concerns are found less often. This study aims to determine the impact of environmental concerns on a nation’s GDP per capita (GDPC). In addition, the influence of developed nations and democracy is also explored. The data for 106 countries and ten years (2011–2020) are procured from World Bank’s official website. The countries with incomplete data for a balanced panel are not included. Panel data econometrics (quantile regression) is applied to analyze the data. Environmental concerns are measured with the help of environmental efficiency (EE) using data envelopment analysis (DEA). It is found that environmental efficiency (EE) negatively impacts the GDPC for low levels of GDPC. However, no association of EE with GDPC is witnessed in the case of high GDPC levels. In addition, developed nations positively moderate the EE’s impact on the GDPC when the GDPC levels are high. Moreover, democratic nations negatively moderate the EE’s impact on the GDPC when low GDPC levels exist. The main implication of the current study is that developed high GDPC countries could bear a significant chunk of the cost of EE. This way, the adverse impact of an increase in EE on the GDPC (by low GDPC counties) could be dodged, and by the efforts of developed high GDPC countries, EE could be increased significantly without adversely impacting their GDPC.

1. Introduction

A sustainable environment and a nation’s growth and development are strongly intertwined (Muller 2014; Ward et al. 2016). It is illogical even to try to decouple them. However, how a sustainable environment and economic development are defined is relevant while exploring their mutual association. Morelli (2011) postulates that a sustainable environment maintains natural capital, including social and economic sustainability. The definition of a sustainable environment also overlaps with the context of economic sustainability. This study adopts this definition of a sustainable environment. One of the most essential aspects of a sustainable environment is the financial materiality of environmental improvement. The financial materiality of environmental performance concerns the financial viability of environmental improvements. It means that the environmental improvements obviously have some cost associated with them; however, the cost of environmental improvements results in much better financial viability in the economy, like in terms of GDP, and is a matter of concern (Schiehll and Kolahgar 2021). If a country works on boosting environmental efficiency then it benefits the economy in terms of financial materiality (GDP) (Baumüller and Sopp 2022; Chiu 2022). Environmental efficiency is defined as the utilization of available resources to have minimum pollutant emissions. Hence, the resources infused to have a better environmental quality, should also be focused on cost cutting to financially benefit the economy (Zhang et al. 2021) rather than creating economic burden.
Feldman et al. (2016) quite explicitly present that economic development is expanding the capacities of societies through realising the full potential of individuals, firms, and communities. In the current study, the words growth and development are both used interchangeably, but they are used in the same context as defined by Feldman et al. (2016).
A country’s primary focus area is always good economic development. Such development incorporates the growth of various components of society. In recent decades, it has also raised the concern that such developments are not being gained at the cost of environmental degradation. Therefore, researchers have given due importance to determining the developmental effects on the environment. However, very little attention has been given to finding whether environmental improvements can benefit the economic development of a country. There is an expansive literature on their (the environment and growth of nations) mutual association (Dinda 2004; Azevedo et al. 2018). However, the direction of the studies is usually from the nation’s growth to environmental concerns. Studies, on topics ranging from environmental concerns to its impact on the growth of the nations, are pretty scarce. This situation becomes challenging when, in the literature, no association is found between the environment and the growth of the nations from either direction (Zilio and Recalde 2011).
There is an obvious question about environmental concerns’ financial viability. There is scarcity in the literature regarding the financial materiality of environmental concerns. Studies are either limited to reporting sustainability and financial materiality (Schiehll and Kolahgar 2021) or the discussion is limited to a firm level (Albrecht and Greenwald 2014). The sustainable development goals (SDGs) (Sachs et al. 2019) do not group the two. The SDGs are 17 goals and 169 targets given by the United Nations, mainly focusing on social and environmental targets (Hák et al. 2016). They also include inclusive growth. However, they are not insufficiently grouped with the growth and development of the nations. This situation is one of the rudimentary questions of whether sustainability is financially viable. Though in a nascent stage, the growing clamour for double materiality is testimony to the fact that both the growth of nations and environmental concerns should be seen in totality (Baumüller and Sopp 2022; Chiu 2022). Moreover, the impact of the environment on a nations’ growth also lacks pragmatism.
From the discussion above it is evident that there is a gap in the literature. Double-materiality-based studies do exist. However, they are inadequate in addressing such a large concept. Hence, the current study attempts to bridge the gap and provide a fresh perspective on the impact of environmental concerns on the growth and development of nations.
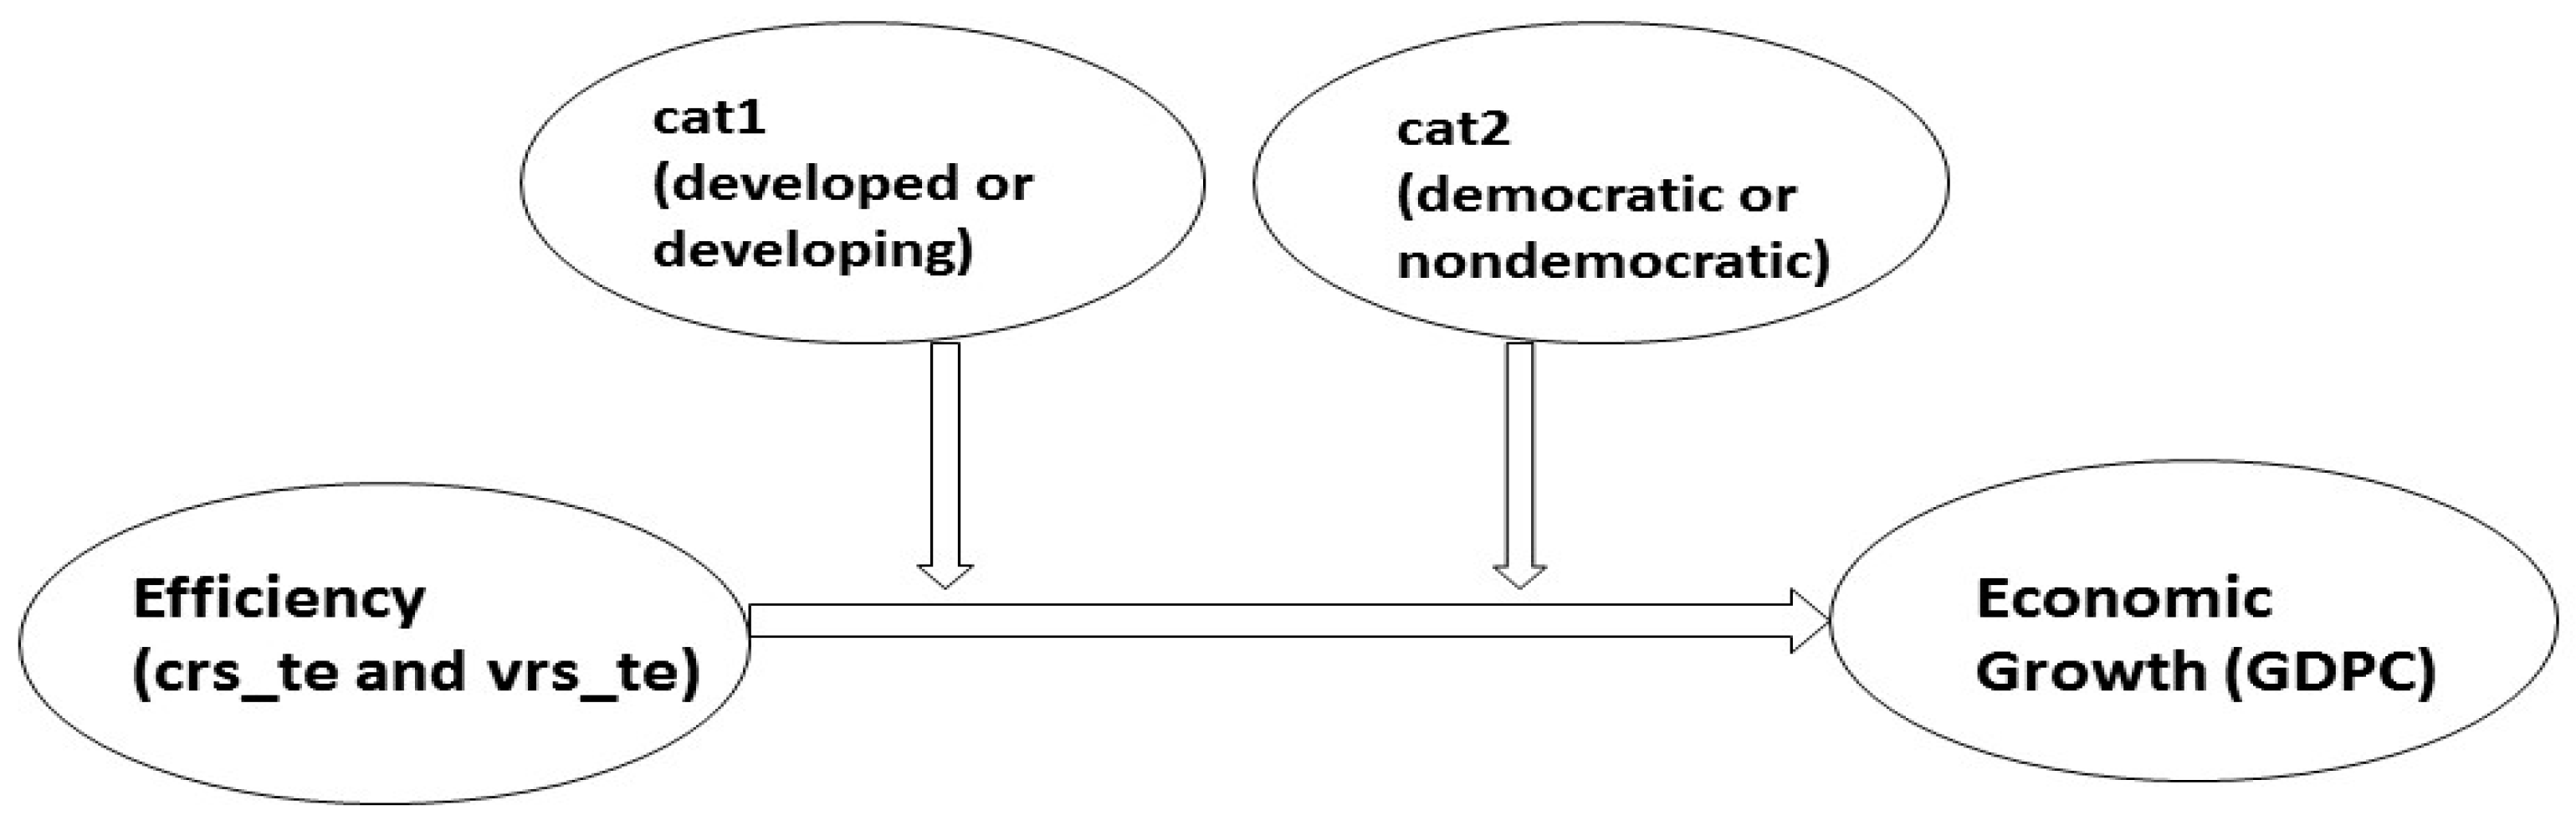
The identified problem can be studied in several ways, including using cross-sectional and time series data. However, due to their ability to capture more information and the richness of the outcome, we decided to use panel data to analyse the problem (Hsiao 1985; Hsiao 2005; Hsiao 2007). In addition, measuring the primary variables is also an issue of choice. We had several options to measure the environment and economic development of the nations. The use of different determinants of the environment is often seen in the literature (Del Río González 2009; Lee and Holden 1999). However, we decided to put a few determinants into estimating environmental efficiency using DEA, believing it to be a more effective (Song et al. 2012; Reinhard et al. 2000) measure of the variable (sustainable environment).
Similarly, growth and development are considered two things in the literature (Young et al. 2019). We decided to use GDP per capita (GDPC) as the proxy for the same, believing it to be a more effective and transparent measurement of the variable. Development is also considered more challenging to measure accurately than growth. Hence, we settle for growth (or GDPC).
Economic prosperity and the environment should complement, not compete with, each other. This lack of studies on the utility of environmental pursuits and economic prosperity is the current study’s primary motivation, believing the two are well connected. The current study provides a few startling contributions which the authors have not observed in the literature. Environmental efficiency negatively impacts the GDPC when the GDPC is low and moderate. In addition, environmental efficiency does not influence the GDPC when the GDPC is in the highest quantile. In addition, developed economies positively influence (only when GDPC is high), and democracy negatively influences (only when GDPC is low) the already negative impact of the environmental efficiency of nations on the GDPC. The findings of the current study have path-breaking implications for policymakers to consider environmental efficiency critically for a nation’s growth. Hence, they need to put in place some regulations to set it right.
The remaining paper is presented in six sections. The following section discusses a review of the relevant literature and the hypothesis formulation. The data and methodology are discussed in Section 3. The results are presented in Section 4. A discussion of the previous research on the topic, contribution, and its implications is presented in Section 5. The study is concluded in Section 6.

2. Literature Review

2.1. Theoretical Background

The utility of any endeavour must be probed if it can adversely affect a large section of fauna and flora. Environmental activism falls into that league. It is a pretty old phenomenon (Sguin et al. 1998). There is a never-ending debate on the utility of environmental pursuits and development (Dalton 2015). However, only recently has it been observed in the literature that environmental activism could be non-beneficial, digressed, and motivated by ulterior self-interests.
Moreover, such endeavours can cause more trouble than they can help the nations’ overall betterment (Garavan 2007). In addition, activism with honest intentions can take an extremist view, which may be far from reality and create more trouble than helping the environment. Such situations are the reason for a drift in research toward the financial materiality of environmental concerns. Such an approach cannot be ignored entirely and may rest on a more realistic platform (Harper Ho 2019).
Financial materiality does talk about the utility of environmental concerns but misses out on the larger picture. Hence, a double materiality concept became popular to balance business and the environment (Chiu 2022). However, it seems to be more compromise than free will to care for both. Moreover, meeting both goals, simultaneously but divergent from each other, became a real challenge, especially during financial stress. Therefore, the SDGs (sustainable development goals) seem more plausible and measurable (Mensah 2019). However, the financial materiality of the SDGs is not researched well.
The betterment of nations/people is usually the goal of debates on the pragmatic perspective of environmental concerns. The authors do not observe any theory on that. Also, few studies are even found on the topic. However, abundant and varied versions of the EKC (Environment Kuznets Curve) theory are found in the literature (Kaika and Zervas 2013a). The EKC theory is on the impact of economic development on the environment, which is diametrically opposed to the current study (Kaika and Zervas 2013b). Moreover, this theory (EKC theory) also has its share of criticism (Chowdhury and Moran 2012; Weber and Weber 2020). Hence, the financial materiality of sustainability remains an unanswered question which needs a fresh empirical perspective.

2.2. Literature and Hypothesis Development

2.2.1. Association between Environmental Concerns and GDP Growth Rate of Nations

As discussed in the previous section, existing studies between environmental concerns and GDPC usually analyse from GDP growth rate to its environmental impact, not vice versa. Awan and Azam (2022) find an N-shaped Kuznets curve to defend the positive aspect of the EKC theory. However, no discussion of the environmental impact on the GDP growth rate or GDPC is witnessed. Muller (2014) proposes a correcting factor, GED (gross external damage), to adjust the GDP growth to incorporate environmental concerns. Hoff et al. (2021) also present an approach to incorporate environmental concerns in estimating GDP and call the revised version of GDP the green GDP. However, neither addresses the causal impact of environmental concerns on the GDP growth rate or GDPC.
The authors do not observe studies that address the environment’s impact on the GDPC. However, a few studies are seen that address the concerns implicitly. Tran et al. (2022) explore the impact of energy consumption on the GDP growth rate of OECD countries using panel data cointegration and the Granger Cause Vector Error Correction model (VCM). They find the long- and short-run causality of energy consumption on the GDP growth rate provided GDP is below a threshold level. In addition, another study between energy consumption and GDP growth rate does not find any association between the two. They used data from 21 Latin and Caribbean countries from 1970 to 2007. They also use the Energy EKC theory and panel data cointegration to arrive at their findings of there being no association between them.
The above discussion demonstrates the lack of studies in the literature on the financial materiality of environmental concerns on the GDP growth rate of nations. In addition, whatever studies are present in the literature do not address the concerns fully. Hence, this situation needs further exploration using empirical analysis. Thus, the following hypothesis is framed in an alternative form to determine the causal impact of environmental concern on the GDPC:
H1. 
Environmental efficiency positively impacts the GDP per capita of nations.

2.2.2. Developing versus Emerging Economy Regarding the Environment’s Impact on the GDP Growth Rate

We do not find many studies on environmental concerns and GDP growth rates regarding developed and developing nations. Fakher and Abedi (2017) use data from developing economies from 1983 to 2013. They use an ARDL-based bounds cointegration test and find the significant and positive impact of the environmental performance index (EPI) on the growth of nations. However, a contrasting result is reported by Chowdhury and Islam (2017). They use data from BRICS (Brazil, Russia, China, India, and South Africa) for their analysis. They find an enormously significant but negative correlation between EPI and GDP growth rate. However, we do not observe any study comparing the developing versus developed economies regarding environmental concerns’ impact on the growth of nations.
In addition, the criticisms of the EKC theory (Chowdhury and Moran 2012; Tiba and Frikha 2020), an extension of the EKC theory (Awan and Azam 2022), our analysis of contrasting evidence, and the lack of studies on the topic prompt us to empirically determine the influence of developed and developing nations on the impact of environmental concerns on the GDPC of nations. Thus, the following hypothesis is framed in an alternate form:
H2. 
The impact of environmental efficiency on the GDP growth rate is positively moderated by the developed economies compared to the emerging economies.

2.2.3. Democracy versus Non-Democracy (Governance) Economy Regarding the Environment’s Impact on the GDP Growth Rate

The existing literature on democracy and the environment is quite extensive. The studies can be divided into two broad sets. The first set of studies shows that high democracy indicators support reducing environmental degradation (Li and Reuveny 2006). On the contrary, the second set of studies finds contradictory evidence (Acheampong et al. 2022). Acheampong et al. (2022) find that a high level of democracy increases pollution. Furthermore, it is also seen that a high level of democracy negatively moderates the nations’ growth rate to reduce pollution levels to curb environmental degradation.
The above discussion implies a contradiction in the literature. Furthermore, we do not find any study which determines the moderation of democracy on the impact of environmental concerns on the growth rate of nations. Hence, a fresh set of evidence is justified. Thus, the following hypothesis is framed in an alternate form to empirically determine the moderating impact of democracy on the environmental association on the growth rate of nations.
H3. 
The impact of environmental efficiency on the GDP growth rate is positively moderated by the democratic governance system compared to a non-democratic system.
As evident from the literature discussed above, the research gap regarding how environmental concerns impact a nation’s development exists. Hence, the current study is justified in attempting to fill the gap.

3. Data and Methodology

3.1. Data

This study has collected cross-country data from 106 countries for 2011–2020 (see Table A1 in Appendix A). In the beginning, there were 180 countries. However, the sample countries are reduced to 106. This is carried out after data filtration because authenticated data are unavailable for a balanced panel. A ten-year (2011–2020) sample period is considered, including the most recent data for providing fresh evidence with consistent outcomes. The sample period is also essential for investigation after the Global Financial Crisis of 2008. The quantitative data are sourced from the World Bank Economics and Environment database. The conceptual model of the study and the variables for which data are retrieved are discussed in Figure 1 and Table 1, respectively.

3.2. Methodology

The current paper uses panel data analysis (PDA) with countries as cross-sectional units and a ten-year time frame (2011–2020). The PDA models incorporate the features of both cross-section and time; hence, PDA gives unbiased results compared to typical cross-sectional or time-series analysis (Hsiao 2007; Baltagi 2008). Moreover, this study employs the Quantiles Regression Panel Data (QRPD) model (Powell 2010) because the dependent variable (GDPC) is not distributed normally (see Table 3). The QRPD model is also a better choice as it cannot significantly suffer from endogeneity issues (Kanoujiya et al. 2022; Wooldridge 2015). In the non-normal distribution of dependent variable data, QRPD models are a good fit model to find evidence at different quantiles as they give reliable results (Kanoujiya et al. 2022; Hettmansperger and McKean 2011; Asmare and Begashaw 2018). There are two base models (Models 1 and 2) developed to investigate the impact of environmental efficiency on economic development, each using eec (environmental efficiency at the constant return to scale [crs]) and eev (environmental efficiency at a variable return to scale [vrs]). Models 3 and 4 find the association between environmental efficiency and economic development under the interaction of developed and developing categories (cat 1). Moreover, Models 5 and 6 are developed to examine the environmental efficiency nexus with economic development under the interaction with democratic and non-democratic countries. The model specifications are given as follows:
GDPCit(τ) = ϴ1EVit + ϴ2Inflationit + ϴ3EIit + ϴ4NECit
GDPCit(τ) = ϴ1EVit + ϴ2cat1it + ϴ3INTR1it ϴ2Inflationit + ϴ3EIit + ϴ4NECit
GDPCit(τ) = ϴ1EVit + ϴ2cat2it + ϴ3INTR2it ϴ2Inflationit + ϴ3EIit + ϴ4NECit
Equation (1) corresponds to Models 1 and 2. Models 3 and 4 are based on Equations (2) and (3), which correspond to Models 5 and 6, where GDPC is the dependent variable. The main exogenous variable (EV) is environmental efficiency, which has two proxies, eec (efficiency at crs) and eev (efficiency at vrs). Two categorical variables (cat1 and cat2) are also introduced as moderators in interaction models. ‘cat1’ is taken in Models 3 and 4 to categorise countries in developed or developing nations. ‘cat2’ is taken in Models 5 and 6 to categorise democratic or non-democratic nations. The interaction terms (INTR1 i.e., i_eec_cat1 or i_eev_cat1, and INTR2 i.e., i_eec_cat2 or i_eev_cat2). i_eec_cat1 (=eec*cat1) and i_eev_cat1 (=eev*cat1) are interaction terms in Models 3 and 4, respectively. i_eec_cat2 (=eec*cat2) and i_eev_cat2 (=eev*cat2) are interaction terms in Models 5 and 6, respectively. In addition, three control variables, Inflation, EI (energy intensity), and NEC (non-renewable energy consumption), are included in the models. The control variables are deployed to have a good fit model to determine the effect of EV on GDPC. ‘it’ as subscript indicates PDA where ‘i’ for cross-section (country) and ‘t’ is time (year).

3.3. Adoption of Quantile Regression

On the whole, earlier works analysing the relationship between development and environmental prospects are performed using parametric techniques. However, when the outcome variable is non-normal, there is evidence in the literature that the effect size may fluctuate with quantiles. Hence, regression analysis in quantiles gives more reliable evidence than classical regression analysis (Kanoujiya et al. 2022). This study’s dependent variable of interest (i.e., GDPC) is non-normally distributed. Section 5.2 contains an explanation of testing non-normality.
GDPC data are non-normal, as presented in Section 5.2. We, therefore, employ a quantile regression model to investigate the connection between economic development and environmental efficiency. Quantile regression was partly developed because non-parametric techniques have produced superior outcomes in empirical scenario analysis, as described in Asmare and Begashaw (2018) and Hettmansperger and McKean (2011), another factor that inspired its use. Moreover, the setting of quantiles is based on standard quantiles available in other studies applying quantile regression (Kanoujiya et al. 2022; Asmare and Begashaw 2018; Hettmansperger and McKean 2011).

3.4. Variables

This study examines the relationship between environmental efficiency and economic development. The economic development of a nation is the dependent variable and is proxied by GDPC (Gross Domestic Product per Capita). The primary exogenous variable is environmental efficiency and is proxied by eec (at crs) and eev (at vrs). The environmental efficiency of a nation is measured using data envelope analysis (DEA). The following subsection discusses environmental efficiency assessment. ‘cat1’ and ‘cat2’ are two categorical variables used as a moderator in interaction models. ‘cat1’ differentiates the countries into developed or developing countries. ‘cat2’ categorises the countries into democratic or non-democracy. The control variables are also taken to obtain a good fit model to determine the sole effect of environmental efficiency on economic development. Inflation, EI, and NEC are control variables. Inflation is the price rise in goods and services in a country. The energy intensity is the consumption of energy in joules per USD. NEC is the share of non-renewable energy consumption out of the total energy. The control variables taken in the models are supposed to affect GDPC; hence, they are controlled.

3.5. Environmental Efficiency Assessment

This paper applies DEA analysis to measure the environmental efficiency of the sample countries. It is one of the most popular stochastic approaches to finding relative efficiency by analysing several inputs to obtain specific outputs (Thanassoulis 1993). DEA has several advantages of its application to find efficiency. As it is a non-parametric, it does not have the subjectivity of model specification. It automatically constructs the best-fit model; hence, no prior model specification is needed (Guo and Wu 2013; Li et al. 2013). Therefore, its implementation is relatively easy. A frontier efficiency is set to find relative efficiency (Bevilacqua and Braglia 2002). It should be noted that the DEA analysis required some criteria to be met before running the DEA program. Decision-Making Units [DMUs] (106 countries in this study) should be larger than five times the total number of inputs and outputs (3 × 5 = 15 in this study) (Bevilacqua and Braglia 2002). Following Guo and Wu (2013) and Li et al. (2013), we use the DEA approach for its consistent output compared to other techniques.
Two inputs (i.e., the non-renewable energy consumption and energy intensity) are used for DEA. These inputs are crucial for environmental issues in a country and play a significant role in the economy. Environmental measures are generally undesirable; for instance, CO2 emission should be less for better environmental quality. Hence, CO2 emission is an undesirable output. An undesirable output needs to decrease. CO2 is the major pollutant that causes environmental degradation. Therefore, we have solely taken this output variable. As per Kuo et al. (2014), Li et al. (2013), Wu et al. (2013), and Seiford and Zhu (2002), the inverse value of CO2 emission (i.e., f(CO2) = 1/CO2) is taken to deal with the undesirable output in DEA. EE is assessed by employing DEA analysis as discussed using non-renewable energy consumption and energy intensity as inputs and CO2 emissions as the undesirable output.
It should be noted that implementing the inverse value is a valid measure to resolve the issue of this undesirable output because the CO2 emission of a country cannot be zero. As suggested by Kuo et al. (2014) and Seiford and Zhu (2002), for running the DEA program, DMUs are five times more extensive than the total number of inputs and outputs (3 × 5 = 15 < 106). We have used two variants of DEA efficiency: (1) Constant return to Scale (CRS), assuming output changes with the same proportion as inputs change; and (2) Variable return to scale (VRS), assuming output does not change with the same proportion as inputs change (Kuo et al. 2014; Li et al. 2013).

4. Results

4.1. Descriptive Statistics

Table 2 demonstrates the descriptive statistics of the variables incorporated in the study. GDPC has a mean value of 1.336, which is closer to Max. It indicates that GDP per capita across the nations, on average, is at an adequate growth rate. The standard deviation (SD) is comparatively high, showing that the sample countries substantially vary in economic development. The environmental efficiency (eec) has a mean value of 0.502, which is about mid between Min and Max, showing an average level of environmental efficiency. However, the environmental efficiency (eev) has a mean value of 0.624 (slightly closer to Max). The average inflation is not alarming in the sample countries. However, the high SD of inflation implies variability. EI and NEC have mean values of 4.34 and 75.01, respectively. EI has its mean towards Min and NEC towards Max. Therefore, EI, on average, is low in the sample countries. However, its higher value of SD indicates high variations among the countries. However, the use of NEC is relatively high in the world. Its lower SD shows that countries have almost similar situations to NEC. The CO2 emission is also high with high SD, indicating that nations highly vary in terms of CO2 emissions

4.2. Normality and Multicollinearity

The Shapiro–Wilk test verifies the normality of data of the dependent variable (GDPC). Table 3 reports the results of the Shapiro–Wilk test. The significant p-value rejects the null of normalcy. Hence, the data of the GDPC are not normally distributed. Therefore, the QRPD model can be used between GDPC and environmental efficiency. The QRPD model is a suitable choice for analysis because it observes the relationship in different quantiles; hence, QRPD models can better deal with the non-normality of the dependent variable to obtain reliable results. Therefore, applying the QRPD is justifiable as the data meet all required conditions for its application.
Table 4 and Table 5 present the results of the correlation matrix and VIF (variance inflation factor), respectively. Table 4 also shows that no significant correlation coefficient in the correlation matrix has a value greater than 0.80. The highest significant correlation coefficient value is 0.620 in the opposite direction (negative). It is between eev and NEC. Therefore, the multicollinearity issue does not exist. Similarly, in Table 5, it is pretty evident that no VIF value is greater than 3. Hence, biasedness through multicollinearity does not exist (Shrestha 2020).

4.3. Quantile Regression Results

Six models were developed in this study to determine the connection between GDPC and countries’ environmental efficiency. The first two models (Models 1 and 2) estimate the relationship using base variables (eec and eev). The following two models (Models 3 and 4) determine the relationship under the influence of the developed or developing category (cat1) of countries. The last two models (Models 5 and 6) estimate the relationship between GDPC and efficiency under the influence of the democratic or non-democratic category (cat2) of countries. Table 6 reports the results of base models (Models 1 and 2). Table 7 presents the results of interaction models under cat1 (Models 3 and 4). The results of interaction models under cat2 (Models 5 and 6) are presented in Table 8.
In Table 6, the results of base models (Models 1 and 2) show that the coefficients of both proxies (eec and eev) of environmental efficiency are negative and significant at 5% significance. The ‘eec’ and ‘eev’ coefficients have values of −3.011 and −4.569, respectively, at the 25% quantile. It means that environmental efficiency has an inverse impact on a nation’s economic development. At the 50% quantile, only ‘eev’ is found to be negative and significant (with a value of −1.942) at a 5% significance. It, again, signifies that environmental efficiency is detrimental to economic growth. Environmental efficiency proxies (eec and eev) are insignificant at the 75% quantile. Hence, environmental efficiency does not significantly impact the nation’s economic growth at higher quantiles. Furthermore, at the 25% quantile, only EI and NEC as control variables are found to be negative and significant at 1%. At the 50% and 75% quantiles, only NEC is significant and negative in both models. However, EI is found to be significant at a 10% significance level at the 75% quantile.
Table 7 presents the results of the interaction models (Models 3 and 4) considering the moderating effect of cat1 (developed or developing country). The coefficients of both proxies (eec and eev) are significant and negative with values of −4.008 and −4.745, respectively, at the 25% quantile. cat1 is insignificant in both models. The interaction terms (i_eec_cat1 and i_eev_cat1) are insignificant in both models. It implies that countries’ developing or developed status does not significantly affect the connection between GDPC and environmental efficiency at the 25% quantile. The control variables EI and NEC are found to be significant and negative in both models (Models 3 and 4). At the 50% quantile, similar results are estimated at the 25% quantile for eec, eev, and the interaction terms. ‘eec’ and ‘eev’ are significant and negative. The interaction terms are insignificant in both models. ‘cat1’ is found to be significant and negative. Inflation and NEC as control variables are found to be significant and negative. At the 75% quantile, similar results are estimated in the 50% quantile for eec, eev, inflation, and NEC. However, the interaction terms in Models 3 and 4 are significant and positive. It indicates that when countries are developed, environmental efficiency improves a nation’s economic growth (GDPC).
Table 8 reports the results of interaction models (Models 5 and 6) considering cat2 (democratic or non-democratic) as the moderating variable. Unlike earlier models, both the proxies, i.e., eec and eev, are insignificant at the 25% quantile. ‘cat2’ is found to be significant and positive in both models (Models 5 and 6). It implies that democratic countries have better GDPC than non-democratic countries at the 25% quantile. ‘i_eec_cat2’ is insignificant in Model 5. However, ‘i_eev_cat2’ is found to be significant and negative with a coefficient value of −4.902. It indicates that environmental efficiency (eev) benefits GDPC in non-democratic countries. Both models have significant and negative EI and NEC (Models 5 and 6). Similar results are found at the 50% quantile as well. At the 75% quantile, only NEC is significant in Models 5 and 6. However, EI is significant and negative in Model 6. However, the rest of the variables in both models are insignificant.

4.4. Results’ Robustness

The results’ robustness is essential to confirm reliable outcomes (Kanoujiya et al. 2022; Rastogi and Kanoujiya 2022). According to Kanoujiya et al. (2022), the multi-model approach is followed in this study. The results in the base models are pretty similar. It confirms the robustness of the base relationship. In addition, the results of the interaction models are also similar; hence, the outcomes are robust. The results’ robustness confirms the outcomes’ reliability in the current paper (Kanoujiya et al. 2022; Rastogi and Kanoujiya 2022).

5. Discussion

5.1. Hypotheses Testing Outcomes

The first hypothesis, that environmental efficiency (EE) positively impacts the GDPC, is rejected. The evidence provided in Table 6 does not support Hypothesis 1. This result implies that EE’s impact on GDPC significantly differs and depends upon GDPC levels. The EE significantly (negatively) impacts the GDPC when the GDPC is low. Moreover, for moderate levels of GDPC, the impact of EE on the GDPC is partially significant. However, for high GDPC, the EE does not impact GDPC.
The second hypothesis, that developed nations positively moderate the impact of EE on the GDPC, cannot be rejected. The results discussed in Table 7 highlight that developed nations positively moderate the impact of EE on the GDPC. This positive moderation by developed nations is significant only for high GDPC. The moderating impact of developed nations on the impact of EE on the GDPC is not significant for moderate and low GDPC.
The third hypothesis, that democratic governance positively influences the impact of EE on the GDPC, is rejected (Table 8). The moderating influence of democratic governance is negatively significant instead of positive (as expected). However, the significantly negative moderation is only valid for low and moderate levels of GDPC. This result implies that democratic governance with low GDPC will negatively impact EE on their already low GDPC.

5.2. Comparison with Earlier Studies on the Topic

The extant literature on the financial materiality of sustainability or ESG usually focuses on corporate and reporting purposes (Albrecht and Greenwald 2014; Schiehll and Kolahgar 2021). This situation is consistent even for the European-Union-based discussion on double materiality (Baumüller and Sopp 2022; Chiu 2022). The overlapping area in the literature and our findings is significant financial materiality. However, the nature might not be the same or may be unclear in the literature. This situation may exist because of their orientation towards reporting rather than determining EE’s impact on GDPC.
Furthermore, our findings support the positive moderation by developed nations on the EE’s impact on the GDPC. We could not observe any study on this. However, Fakher and Abedi (2017) find evidence of EE’s positive impact on developing nations’ GDP growth rate. Chowdhury and Islam (2017) report a negative association between the two using BRICS nations. However, none of the studies explores the moderating influence of developed nations on the EE’s impact on the GDPC.
Similarly, we do not find any study where democracy moderates the EE’s impact on the GDPC. However, studies on democracy and the environment are there. Their findings are also mixed. Some studies find that democracy reduces pollution (Li and Reuveny 2006; Winslow 2005). A few also report the negative or uncertain status of the impact of democracy on pollution (Acheampong et al. 2022). The current study reports the negative impact of democracy on the EE’s impact on the GDPC (this is significant only for low or moderate GDPC nations), partially similar to Acheampong et al. (2022).

5.3. Contribution

The current study’s findings of the environmental concerns’ financial materiality are not so explicitly found in the literature. Environmental efficiency is rarely assessed in the existing literature and is considered an environmental factor. The current study has looked for this factor to examine its effect on economic development. The negative impact of environmental efficiency on the GDPC when the GDPC is low, and the insignificant impact when the GDPC is high, are novel and the main contributions of the current study. In addition, it is not found in any other study that developed nations reduce the negative association of EE on the GDPC when GDPC is high. Moreover, it is also not observed in the literature that democracy accentuates the negative impact of EE on the GDPC of nations when the GDPC is low. In toto, it is believed by the authors that all the findings are novel and significantly contribute to the extant knowledge on the topic.

5.4. Implications

The current study’s findings debunk a few long-cherished illusions, and therefore carry some path-breaking implications for all the stakeholders. Above all, nations’ long-term environmental policies need a revisit based on the current study’s findings. Firstly, it needs to be realised that environmental concerns hurt the GDPC under certain conditions. This negative impact of EE on GDPC is significant only for low GDPC nations. The same association is not significant for high GDPC nations. This situation implies that, if the policymakers want to protect the environment and simultaneously want the emerging nations to prosper unhindered, the nations with high GDPC should take the maximum burden of EE, not those with low GDPC.
Secondly, the positive moderation of developed nations on the EE’s impact on GDPC for high GDPC nations reinforces the implication discussed in the first point. A developed nation with high GDPC nations would reduce the negative association of EE’s on the GDPC. Thirdly, the negative moderation by democracy on EE’s impact on the GDPC is significant for low GDPC nations. This finding implies that a democratic nation with a low GDPC would further deteriorate the negative impact of EE on the GDPC of such nations. This situation demands a two-pronged explanation. First, this result reinforces the implication discussed in the first point. Second, compared to democracy, a non-democratic nation would not be hurt further by EE’s impact on the GDPC. This situation means a democratic nation with a low GDPC has much to worry about due to the negative implications of environmental concerns on the GDPC. The findings’ practical implication is the financial unviability of environmental efficiency, indicating it is not always beneficial for a nation’s growth. It might be due to the lower financial materiality of environmental quality. Hence, countries with higher GDPC (economic growth) should concentrate more on environmental performance than lower GDPC countries.

6. Conclusions

The current study is aimed at determining the impact of environmental efficiency (EE) on the gross domestic product per capita (GDPC). The study employs quantile regression to address the impact of EEs on GDPC regarding different levels of GDPC.
We find that an EE increase negatively impacts the GDPC for low GDPC nations. In addition, the negative impact of EE on the GDPC for low GDPC countries is further exacerbated if it is a democratic country. On the contrary, if the GDPC is high, EE has no negative impact on the GDPC. Moreover, for a highly GDPC-developed country, an increase in EE positively influences the GDPC of the country.
The current findings are significant as they address the disagreement between developed and emerging economies regarding environmental concerns. The differences between the two are regarding the issue of who will take the considerable burden to protect the environment. The findings are significant as their implications can change the course of action regarding the long-term policies on environmental protection for developed and developing nations.
One of the current study’s limitations is the absence of data from the other counties that were not part of the sample. Additionally, this circumstance will be the focus of further study on the subject. We use GDPC as a measure to assess the growth and development of the nations. Some other tools or proxies can also be employed, such as standard of living, health parameters, and education, to assess the impact of environmental concerns on the nations. Such limitations also provide scope for future research on the topic.
Based on the current study’s findings, the authors recommend rudimentary restructuring in the policy of environmental concerns so that the twin purpose of protecting the environment and the benefits for flora and fauna on the earth can also be ensured. Passing the buck to one another between nations will only attenuate all the excellent work carried out on the issue.

Author Contributions

Conceptualization, S.R. and J.K.; methodology, J.K.; software, P.T.; validation, S.R., J.K. and N.P.; formal analysis, J.K.; investigation, S.R.; resources, S.B.; data curation, A.D.; writing—original draft preparation, S.R.; writing—review and editing, J.K.; visualization, P.T.; supervision, S.R.; project administration, S.R.; funding acquisition, No funding. All authors have read and agreed to the published version of the manuscript.

Funding

This research received no external funding.

Data Availability Statement

Data is unavailable due to privacy or ethical restrictions.

Conflicts of Interest

The authors declare no conflict of interest.

Appendix A

Table A1. Sample countries.
Sr. No.Country
1Albania
2United Arab Emirates
3Argentina
4Armenia
5Australia
6Austria
7Azerbaijan
8Belgium
9Bangladesh
10Bulgaria
11Bahrain
12Belarus
13Bolivia
14Brazil
15Canada
16Switzerland
17Chile
18China
19Colombia
20Costa Rica
21Cuba
22Cyprus
23Czech Republic
24Germany
25Denmark
26Dominican Republic
27Algeria
28Ecuador
29Egypt, Arab Rep.
30Spain
31Estonia
32Finland
33Fiji
34France
35United Kingdom
36Georgia
37Greece
38Guatemala
39Hong Kong SAR, China
40Honduras
41Croatia
42Hungary
43Indonesia
44India
45Ireland
46Iran, Islamic Rep.
47Iceland
48Israel
49Italy
50Jordan
51Japan
52Kazakhstan
53Kyrgyz Republic
54Cambodia
55Korea, Rep.
56Lao PDR
57Sri Lanka
58Lithuania
59Luxembourg
60Latvia
61Macao SAR, China
62Morocco
63Moldova
64Mexico
65Malta
66Mauritius
67Nicaragua
68Netherlands
69Norway
70Nepal
71New Zealand
72Oman
73Panama
74Peru
75Philippines
76Poland
77Puerto Rico
78Portugal
79Paraguay
80Romania
81Russian Federation
82Saudi Arabia
83Singapore
84Sierra Leone
85El Salvador
86Slovak Republic
87Slovenia
88Sweden
89Eswatini
90Sint Maarten (Dutch part)
91Seychelles
92Chad
93Togo
94Thailand
95Tajikistan
96Tunisia
97Turkey
98Uganda
99Ukraine
100Uruguay
101United States
102Uzbekistan
103Venezuela, RB
104Vanuatu
105Samoa
106Zimbabwe
Source: Author’s selection and countries chosen from World Bank list.

References

  1. Acheampong, Alex O., Eric Evans Osei Opoku, and Janet Dzator. 2022. Does democracy really improve environmental quality? Empirical contribution to the environmental politics debate. Energy Economics 109: 105942. [Google Scholar] [CrossRef]
  2. Al Khajeh, Ebrahim Hasan. 2018. Impact of leadership styles on organisational performance. Journal of Human Resources Management Research 2018: 687849. [Google Scholar]
  3. Albrecht, Patrick, and Christopher Greenwald. 2014. Financial materiality of sustainability: The Japanese context. Journal of Corporate Citizenship 56: 31–52. [Google Scholar] [CrossRef]
  4. Aslam, Bilal, Jinsong Hu, Sadaf Shahab, Awais Ahmad, Mudassar Saleem, Syed Shoaib Ahmad Shah, Muhammad Sufyan Javed, Muhammad Kashif Aslam, Shahid Hussain, and Masood Hassan. 2021. The nexus of industrialisation, GDP per capita and CO2 emission in China. Environmental Technology & Innovation 23: 101674. [Google Scholar]
  5. Asmare, Erkie, and Andualem Begashaw. 2018. Review on parametric and non-parametric methods of efficiency analysis. Biostatistics and Bioinformatics 2: 1–7. [Google Scholar]
  6. Awan, Abdul Majid, and Muhammad Azam. 2022. Evaluating the impact of GDP per capita on environmental degradation for G-20 economies: Does N-shaped environmental Kuznets curve exist? Environment, Development and Sustainability 24: 11103–26. [Google Scholar] [CrossRef]
  7. Azevedo, Vitor G., Simone Sartori, and Lucila M. S. Campos. 2018. CO2 emissions: A quantitative analysis among the BRICS nations. Renewable and Sustainable Energy Reviews 81: 107–15. [Google Scholar] [CrossRef]
  8. Baltagi, Badi Hani. 2008. Econometric Analysis of Panel Data. Chichester: John Wiley & Sons, vol. 4. [Google Scholar]
  9. Baumüller, Josef, and Karina Sopp. 2022. Double materiality and the shift from non-financial to European sustainability reporting: Review, outlook and implications. Journal of Applied Accounting Research 23: 8–28. [Google Scholar] [CrossRef]
  10. Bevilacqua, Maurizio, and Marcello Braglia. 2002. Environmental efficiency analysis for ENI oil refineries. Journal of Cleaner Production 10: 85–92. [Google Scholar] [CrossRef]
  11. Chiu, Iris H. Y. 2022. The EU sustainable finance agenda: Developing governance for double materiality in sustainability metrics. European Business Organization Law Review 23: 87–123. [Google Scholar] [CrossRef]
  12. Chowdhury, Rinku Roy, and Emilio F. Moran. 2012. Turning the curve: A critical review of Kuznets approaches. Applied Geography 32: 3–11. [Google Scholar] [CrossRef]
  13. Chowdhury, Tonmoy, and Sadia Islam. 2017. Environmental Performance Index and GDP growth rate: Evidence from BRICS countries. Environmental Economics 8: 31–36. [Google Scholar] [CrossRef]
  14. Dalton, Russell J. 2015. Waxing or waning? The changing patterns of environmental activism. Environmental Politics 24: 530–52. [Google Scholar] [CrossRef]
  15. Del Río González, Pablo. 2009. The empirical analysis of the determinants for environmental technological change: A research agenda. Ecological Economics 68: 861–78. [Google Scholar] [CrossRef]
  16. Dinda, Soumyananda. 2004. Environmental Kuznets curve hypothesis: A survey. Ecological Economics 49: 431–55. [Google Scholar] [CrossRef]
  17. Dyczkowska, Joanna, and Tomasz Dyczkowski. 2018. Democratic or autocratic leadership style? Participative management and its links to rewarding strategies and job satisfaction in SMEs. Athens Journal of Business & Economics 4: 193–218. [Google Scholar]
  18. Fakher, Hossein-Ali, and Zahra Abedi. 2017. Relationship between environmental quality and economic growth in developing countries (based on environmental performance index). Environmental Energy and Economic Research 1: 299–310. [Google Scholar]
  19. Feldman, Maryann, Theodora Hadjimichael, Lauren Lanahan, and Tom Kemeny. 2016. The logic of economic development: A definition and model for investment. Environment and Planning C: Government and Policy 34: 5–21. [Google Scholar] [CrossRef]
  20. Garavan, Mark. 2007. Resisting the costs of ‘development’: Local environmental activism in Ireland. Environmental Politics 16: 844–63. [Google Scholar] [CrossRef]
  21. Goodhart, Charles Albert Eric, and Manoj Pradhan. 2020. The Great Demographic Reversal: Ageing Societies, Waning Inequality, and an Inflation Revival. London: Palgrave Macmillan. [Google Scholar]
  22. Guo, Dong, and Jie Wu. 2013. A complete ranking of DMUs with undesirable outputs using restrictions in DEA models. Mathematical and Computer Modelling 58: 1102–9. [Google Scholar] [CrossRef]
  23. Hák, Tomáš, Svatava Janoušková, and Bedřich Moldan. 2016. Sustainable Development Goals: A need for relevant indicators. Ecological Indicators 60: 565–73. [Google Scholar] [CrossRef]
  24. Harper Ho, Virginia. 2019. From Public Policy to Materiality: Non-Financial Reporting, Shareholder Engagement, and Rule 14a-8; s Ordinary Business Exception. Washington and Lee Law Review 76: 1231. [Google Scholar]
  25. Hettmansperger, Thomas P., and Joseph W. McKean. 2011. Robust non-parametric statistical methods. Monographs on Statistics and Applied Probability 119: 1–520. [Google Scholar]
  26. Hoff, Jens V., Martin M.B. Rasmussen, and Peter Birch Sørensen. 2021. Barriers and opportunities in developing and implementing a Green GDP. Ecological Economics 181: 106905. [Google Scholar] [CrossRef]
  27. Hsiao, Cheng. 1985. Benefits and limitations of panel data. Econometric Reviews 4: 121–74. [Google Scholar] [CrossRef]
  28. Hsiao, Cheng. 2005. Why panel data? The Singapore Economic Review 50: 143–54. [Google Scholar] [CrossRef]
  29. Hsiao, Cheng. 2007. Panel data analysis—Advantages and challenges. Test 16: 1–22. [Google Scholar] [CrossRef]
  30. Kaika, Dimitra, and Efthimios Zervas. 2013a. The Environmental Kuznets Curve (EKC) theory—Part A: Concept, causes and the CO2 emissions case. Energy Policy 62: 1392–402. [Google Scholar] [CrossRef]
  31. Kaika, Dimitra, and Efthimios Zervas. 2013b. The environmental Kuznets curve (EKC) theory. Part B: Critical issues. Energy Policy 62: 1403–11. [Google Scholar] [CrossRef]
  32. Kanoujiya, Jagjeevan, Kuldeep Singh, and Shailesh Rastogi. 2022. Does promoters’ ownership reduce the firm’s financial distress? Evidence from non-financial firms listed in India. Managerial Finance. ahead-of-print. [Google Scholar] [CrossRef]
  33. Kuo, Hsing-Fu, Hsiang-Leng Chen, and Ko-Wan Tsou. 2014. Analysis of farming environmental efficiency using a DEA model with undesirable outputs. Apcbee Procedia 10: 154–58. [Google Scholar] [CrossRef]
  34. Lee, Julie Anne, and Stephen J. S. Holden. 1999. Understanding the determinants of environmentally conscious behavior. Psychology & Marketing 16: 373–92. [Google Scholar]
  35. Li, Quan, and Rafael Reuveny. 2006. Democracy and environmental degradation. International Studies Quarterly 50: 935–56. [Google Scholar] [CrossRef]
  36. Li, Yongjun, Min Yang, Ya Chen, Qianzhi Dai, and Liang Liang. 2013. Allocating a fixed cost based on data envelopment analysis and satisfaction degree. Omega 41: 55–60. [Google Scholar] [CrossRef]
  37. Maddison, Angus. 1983. A comparison of levels of GDP per capita in developed and developing countries. 1700–980. The Journal of Economic History 43: 27–41. [Google Scholar] [CrossRef]
  38. Mensah, Justice. 2019. Sustainable development: Meaning, history, principles, pillars, and implications for human action: Literature review. Cogent Social Sciences 5: 1653531. [Google Scholar] [CrossRef]
  39. Morelli, John. 2011. Environmental sustainability: A definition for environmental professionals. Journal of Environmental Sustainability 1: 2–10. [Google Scholar] [CrossRef]
  40. Muller, Nicholas Z. 2014. Boosting GDP growth by accounting for the environment. Science 345: 873–74. [Google Scholar] [CrossRef] [PubMed]
  41. Namahoro, J. P., Q. Wu, N. Zhou, and S. Xue. 2021. Impact of energy intensity, renewable energy, and economic growth on CO2 emissions: Evidence from Africa across regions and income levels. Renewable and Sustainable Energy Reviews 147: 111233. [Google Scholar] [CrossRef]
  42. Powell, David. 2010. Unconditional quantile regression for panel data with exogenous or endogenous regressors. SSRN Electronic Journal. [CrossRef]
  43. Rastogi, Shailesh, and Jagjeevan Kanoujiya. 2022. Does transparency and disclosure (T&D) improve the performance of banks in India? International Journal of Productivity and Performance Management. ahead-of-print. Available online: https://www.emerald.com/insight/content/doi/10.1108/IJPPM-10-2021-0613/full/html (accessed on 16 June 2023).
  44. Reinhard, Stijn, C. A. Knox Lovell, and Geert J. Thijssen. 2000. Environmental efficiency with multiple environmentally detrimental variables; estimated with SFA and DEA. European Journal of Operational Research 121: 287–303. [Google Scholar] [CrossRef]
  45. Sachs, Jeffrey D., Guido Schmidt-Traub, Mariana Mazzucato, Dirk Messner, Nebojsa Nakicenovic, and Johan Rockström. 2019. Six Transformations to achieve the Sustainable Development Goals. Nature Sustainability 2: 805–14. [Google Scholar] [CrossRef]
  46. Schiehll, Eduardo, and Sam Kolahgar. 2021. Financial materiality in the informativeness of sustainability reporting. Business Strategy and the Environment 30: 840–55. [Google Scholar] [CrossRef]
  47. Seiford, Lawrence M., and Joe Zhu. 2002. Modeling undesirable factors in efficiency evaluation. European Journal of Operational Research 142: 16–20. [Google Scholar] [CrossRef]
  48. Sguin, Chantal, Luc G. Pelletier, and John Hunsley. 1998. Toward a Model of Environmental Activism. Environment and Behavior 30: 628–52. [Google Scholar] [CrossRef]
  49. Shakya, Shree Raj, Iswor Bajracharya, Ramesh Ananda Vaidya, Prakash Bhave, Anzoo Sharma, Maheswar Rupakheti, and Tri Ratna Bajracharya. 2022. Estimation of air pollutant emissions from captive diesel generators and its mitigation potential through microgrid and solar energy. Energy Reports 8: 3251–62. [Google Scholar] [CrossRef]
  50. Sharma, Eliza. 2019. A review of corporate social responsibility in developed and developing nations. Corporate Social Responsibility and Environmental Management 26: 712–20. [Google Scholar] [CrossRef]
  51. Shrestha, Noora. 2020. Detecting multicollinearity in regression analysis. American Journal of Applied Mathematics and Statistics 8: 39–42. [Google Scholar] [CrossRef]
  52. Song, Malin, Qianjiao Xie, and Zhiyang Shen. 2021. Impact of green credit on high-efficiency utilisation of energy in China considering environmental constraints. Energy Policy 153: 112267. [Google Scholar] [CrossRef]
  53. Song, Malin, Qingxian An, Wei Zhang, Zeya Wang, and Jie Wu. 2012. Environmental efficiency evaluation based on data envelopment analysis: A review. Renewable and Sustainable Energy Reviews 16: 4465–69. [Google Scholar] [CrossRef]
  54. Thanassoulis, Emmanuel. 1993. A comparison of regression analysis and data envelopment analysis as alternative methods for performance assessments. Journal of the Operational Research Society 44: 1129–44. [Google Scholar] [CrossRef]
  55. Tiba, Sofien, and Mohamed Frikha. 2020. EKC and macroeconomics aspects of well-being: A critical vision for a sustainable future. Journal of the Knowledge Economy 11: 1171–97. [Google Scholar] [CrossRef]
  56. Tran, Bao-Linh, Chi-Chung Chen, and Wei-Chun Tseng. 2022. Causality between energy consumption and economic growth in the presence of GDP threshold effect: Evidence from OECD countries. Energy 251: 123902. [Google Scholar] [CrossRef]
  57. Wafik, Doaa, and Assem Tharwat. 2022. The Impact of GDP, Unemployment And Inflation Rates on Measuring the Economic Efficiency For Megalopolises. Journal of Positive School Psychology 6: 4336–352. [Google Scholar]
  58. Ward, James D., Paul C. Sutton, Adrian D. Werner, Robert Costanza, Steve H. Mohr, and Craig T. Simmons. 2016. Is decoupling GDP growth from environmental impact possible? PLoS ONE 11: e0164733. [Google Scholar] [CrossRef]
  59. Weber, Heloise, and Martin Weber. 2020. When means of implementation meet Ecological Modernization Theory: A critical frame for thinking about the Sustainable Development Goals initiative. World Development 136: 105129. [Google Scholar] [CrossRef]
  60. Winslow, Margrethe. 2005. Is democracy good for the environment? Journal of Environmental Planning and Management 48: 771–83. [Google Scholar] [CrossRef]
  61. Wooldridge, Jeffery M. 2015. Introductory Econometrics: A Modern Approach. Independence: South Western Cengage Learning. [Google Scholar]
  62. Wu, Jie, Qingxian An, Shujahat Ali, and Liang Liang. 2013. DEA based resource allocation considering environmental factors. Mathematical and Computer Modelling 58: 1128–37. [Google Scholar] [CrossRef]
  63. Young, Nathan, Camilla Brattland, Celeste Digiovanni, Bjorn Hersoug, Jahn Petter Johnsen, Kine Mari Karlsen, Ingrid Kvalvik, Erik Olofsson, Knud Simonsen, ann-Magnhild Solås, and et al. 2019. Limitations to growth: Social-ecological challenges to aquaculture development in five wealthy nations. Marine Policy 104: 216–24. [Google Scholar] [CrossRef]
  64. Zhang, Jijian, Ataul Karim, Patwary, Huaping Sun, Muhammad Raza, Farhad Taghizadeh-Hesary, and Robina Iram. 2021. Measuring energy and environmental efficiency interactions towards CO2 emissions reduction without slowing economic growth in central and western Europe. Journal of Environmental Management 279: 111704. [Google Scholar] [CrossRef] [PubMed]
  65. Zilio, Mariana, and Marina Recalde. 2011. GDP and environment pressure: The role of energy in Latin America and the Caribbean. Energy Policy 39: 7941–49. [Google Scholar] [CrossRef]
Figure 1. Conceptual model. Note: Efficiency is an independent variable, the Gross domestic product of countries (GDPC) represents economic growth as the dependent variable, and cat1 and cat2 represent the developed or developing and democratic and nondemocratic countries, respectively, as moderators of the study. Source: Author contribution.
Jrfm 16 00460 g001
Table 1. Variables.
Table 1. Variables.
VariableMeasurementReferences
Economic Growth (GDPC)‘GDPC’ is defined as the annual percentage growth rate of the “gross domestic product per capita” of a country. This is described by the World Bank’s data account. It represents the extent of a nation’s economic growth. Its unit is USD/population.Aslam et al. (2021); Awan and Azam (2022)
Explanatory Variables
Environmental efficiency (eec)It is the environmental efficiency of a nation and is computed using Data Envelope Analysis (DEA) at a constant return to scale (CRS). Please see the detailed discussion in Section 4.4.Zhang et al. (2021); Song et al. (2021)
Environmental efficiency (eev)It is the environmental efficiency of a nation and is computed using Data Envelope Analysis (DEA) at a variable return to scale (VRS). Please see the detailed discussion in Section 4.4.Zhang et al. (2021); Song et al. (2021)
Moderating Variables
Category 1 (cat1)It categorises the countries into developed or developing nations. Categorisation is based on World Bank categorisation. ‘1’ for developed country and ‘0’.Maddison (1983); Sharma (2019)
Category 2 (cat2)It categorises the countries into democratic or non-democratic nations. Categorisation is based on World Bank categorisation. ‘1’ for developed country and ‘0’.Dyczkowska and Dyczkowski (2018); Al Khajeh (2018)
Control Variables
Inflation (Inflation)It is the rate of inflation in a country.Goodhart and Pradhan (2020); Wafik and Tharwat (2022)
Energy intensity (EI)It represents the energy intensity of a nation. It is defined as the consumption of energy in joules per USD.Namahoro et al. (2021); Shakya et al. (2022)
Non-renewable energy consumption (NEC)It is the share of non-renewable energy consumption out of total energy consumption in a country.Namahoro et al. (2021); Shakya et al. (2022)
CO2 emission ^It is a major cause of pollution. Therefore, it is taken as the undesirable output of DEA analysis to measure environmental efficiency. CO2 has a unit of measure of kilotonnes.Kuo et al. (2014); Wu et al. (2013)
Note: cat1 and cat2 represent Category 1 and 2; the categorial variable signifies that developed and democratic countries are 1 and developing and nondemocratic nations are 0. ^ represents the output variable for DEA analysis to compute environmental efficiency. Source: Author compilation.
Table 2. Summary statistics.
VariableObs.MeanStd. Dev.MinMax
DVs
GDPC10601.3324.326−54.64123.999
EVs
eec10600.5020.2120.1561.000
eev10600.6240.1860.2511.000
CVs
Inflation10605.29622.929−19.146558.56
EI10604.34922.7510.2215.56
NEC106075.0109.496.82100.00
CO2 emission ^1060380,864.61,258,96311010,707,220
Note: Min, Max, Obs., and Std. Dev. are minimum value, maximum value, number of observations, and standard deviation, respectively. DVs are dependent variables. EVs, MVs, and CVs are the explanatory, moderating, and control variables. EI is energy intensity. NEC is non-renewable energy consumption. Summary statistics are based on the data of whole sample period from 2011 to 2020 for 106 countries. ^ indicates output variable for DEA analysis. Source: Author compilation.
Table 3. Normalcy check.
VariableObsWp-ValueH0: Data Normally DistributedOutcome
GDPC10700.8820.000Rejection of H0Non-normal Data
Note: The Shapiro–Wilk W test was used to check the normality of data of the dependent variable. It has the null of normal distribution. Source: Author compilation.
Table 4. Correlation matrix.
(1)(2)(3)(4)(5)(6)(7)(8)
GDPC (1)1
eec (2)−0.0111
eev (3)−0.009−0.0511
cat1 (4)−0.001−0.178 *−0.120 *1
cat2 (5)0.062 *0.169 *0.184 *0.0511
Inflation (6)−0.078 *−0.006−0.009−0.128 *0.0321
EI (7)0.037−0.329 *−0.427 *−0.137 *−0.090 *0.169 *1
NEC (8)−0.103 *−0.619 *−0.620 *0.248 *−0.117 *−0.096 *−0.199 *1
Note: * signals p-value significance at 0.05. Source: Author compilation.
Table 5. Variance inflation factor.
Variable
(DV: GDPC)
eeccat1cat2EIInflationNECeec*cat1eec*cat2
VIF2.4811.0971.6491.6211.0332.3072.4531.217
Variable
(DV: GDPC)
eevcat1cat2EIInflationNECeev*cat1eev*cat2
VIF1.5431.0851.0372.1911.0442.8861.0401.150
Note: VIF is for the multicollinearity test. Values = or <3 indicates no issue of multicollinearity. Source: Author compilation.
Table 6. Results of quantile regressions (with base variable).
Model 1Model 2
Coef.Std. Err.pCoef.Std. Err.p
Quantile (25)eec/eev−3.011 **1.2210.013−4.569 **1.9660.020
Inflation−0.0170.0560.752−0.0170.0590.773
EI−0.217 *0.0810.008−0.343 *0.1180.003
NEC−0.036 *0.0090.000−0.046 *0.0120.000
Quantile (50)eec/eev−1.1090.6900.108−1.942 **0.9700.045
Inflation−0.0180.0150.236−0.0180.0190.364
EI−0.0760.0650.241−0.1130.0760.138
NEC−0.023 *0.0060.000−0.027 *0.0070.000
Quantile (75)eec/eev−1.2570.8390.134−1.8751.2230.125
Inflation−0.0050.0120.665−0.0030.0150.838
EI−0.1100.0710.124−0.164 ***0.0870.060
NEC−0.030 *0.0080.000−0.032 *0.0090.000
Note: *, **, and *** are for p-value is significant at 1%, 5%, and 10%. ‘eec’ and ‘eev’ are proxies for environmental efficiency at a constant return to scale (crs) and variable return to scale (vrs), respectively. ‘eec’ and ‘eev’ are the exogenous variables, respectively, in Model 1 and Model 2. Source: Author compilation.
Table 7. Results of quantile regressions (with interaction variable cat1).
Model 3Model 4
Coef.Std. Err.pCoef.Std. Err.p
Quantile (25)eec/eev−4.008 *1.4380.005−4.745 **1.9470.014
cat1−0.7121.1670.5410.4031.5020.788
i_eec_cat1/i_eev_cat10.1372.5750.957−1.5192.4200.530
Inflation−0.0170.0630.780−0.0170.0660.796
EI−0.283 *0.0890.001−0.390 *0.1070.000
NEC−0.041 *0.0110.000−0.049 *0.0120.000
Quantile (50)eec/eev−2.223 *0.8540.009−2.301 ***1.1980.055
cat1−1.731 *0.5330.001−1.526 **0.7640.046
i_eec_cat1/i_eev_cat11.4681.0470.1610.8051.2380.515
Inflation−0.018 *0.0030.000−0.018 *0.0030.000
EI−0.0900.0580.120−0.1140.0710.111
NEC−0.023 *0.0060.000−0.024 *0.0070.002
Quantile (75)eec/eev−2.680 *0.8190.001−3.647 *1.0750.000
cat1−3.332 *0.5930.000−3.148 *0.8810.000
i_eec_cat1/i_eev_cat13.881 *1.5210.0102.702 ***1.6210.095
Inflation−0.022 *0.0030.000−0.022 *0.0030.000
EI−0.0570.0660.381−0.0980.0830.234
NEC−0.023 *0.0070.001−0.029 *0.0080.000
Note: *, **, and *** are for p-value is significant at 1%, 5%, and 10%. ‘eec’ and ‘eev’ are proxies for environmental efficiency at a constant return to scale (crs) and variable return to scale (vrs), respectively. ‘eec’ and ‘eev’ are the exogenous variables, respectively, in Model 3 and Model 4. ‘i_eec_cat1’ and ‘i_eev_cat1’ are interaction terms in Model 3 and Model 4, respectively. Source: Author compilation.
Table 8. Results of quantile regressions (with interaction variable cat2).
Model 5Model 6
Coef.Std. Err.pCoef.Std. Err.p
Quantile (25)eec/eev0.1052.0220.9581.1412.5300.652
cat22.361 **0.9730.0153.818 *1.4200.007
i_eec_cat2/i_eev_cat2−2.7021.8240.138−4.902 **2.1020.019
Inflation−0.0170.0490.723−0.0170.0560.752
EI−0.178 **0.0690.011−0.190 ***0.1080.080
NEC−0.024 **0.0100.018−0.027 **0.0130.033
Quantile (50)eec/eev0.0211.4850.9880.5511.6230.734
cat21.427 **0.6730.0342.363 *0.8550.005
i_eec_cat2/i_eev_cat2−1.1251.3770.414−2.519 ***1.4050.073
Inflation−0.017 *0.0030.000−0.018 *0.0050.002
EI−0.0640.0630.307−0.0850.0720.237
NEC−0.016 *0.0060.009−0.020 *0.0060.002
Quantile (75)eec/eev−0.3532.0600.863−0.8012.4720.745
cat21.2400.8890.1631.7321.1840.143
i_eec_cat2/i_eev_cat2−0.8911.9110.640−1.6152.1000.441
Inflation−0.0010.0280.972−0.0010.0290.983
EI−0.0850.0720.234−0.148 ***0.0890.098
NEC−0.027 *0.0080.000−0.032 *0.0090.000
Note: *, **, and *** are for p-value is significant at 1%, 5%, and 10%. ‘eec’ and ‘eev’ are proxies for environmental efficiency at a constant return to scale (crs) and variable return to scale (vrs), respectively. ‘eec’ and ‘eev’ are the exogenous variables, respectively, in Model 3 and Model 4. ‘i_eec_cat1’ and ‘i_eev_cat1’ are interaction terms in Model 3 and Model 4, respectively. Source: Author compilation.
Disclaimer/Publisher’s Note: The statements, opinions and data contained in all publications are solely those of the individual author(s) and contributor(s) and not of MDPI and/or the editor(s). MDPI and/or the editor(s) disclaim responsibility for any injury to people or property resulting from any ideas, methods, instructions or products referred to in the content.

