Abstract
We investigated the stock return risk associated with the various types of dividend decisions announced by New Zealand firms during the COVID-19 pandemic in 2020. The sample includes a group of firms that initially announced cash dividends but a number of days later made announcements cancelling their payments. Using multinomial logistic regression analysis, we found that higher pre-pandemic payout policy significantly increased the likelihood of a cancellation, an omission or an increase decision. Higher growth and higher profitability reduced the probability of an omission and a reduction decision, respectively. Moreover, higher stock return volatility increased the likelihood of an omission, a reduction or an increase decision. Further event study analysis revealed that investors reacted more feverishly to the announcements of cancellation decisions than any other types of dividend decisions. Moreover, we report strong evidence of negative abnormal returns around the cancellation announcements followed by positive post-announcement price reversals, a pattern that is not observed for the omission announcements. This paper contributes to the literature by studying a cancellation sample and reveals, for the first time, significant shareholder risk associated with cancellation decisions, which was not observed for omission decisions. We alert managers to carefully weigh the costs and benefits of breaking a promise of dividend payout.
JEL Classification:
G14; G35
1. Introduction and Related Literature
Public firms tend to maintain stable dividends and follow through their announcements of dividend payouts during normal times. However, the COVID-19 outbreak caused dramatic changes to normal circumstances and many firms had to cut dividends to preserve liquidity (Krieger et al. 2020; Cejnek et al. 2021; Zheng 2021; Xu et al. 2021). In March 2020, the New Zealand government enforced strict lockdown rules, which put an abrupt brake on the economy. The GDP per capita contracted 11 percent in 2020Q21, the sharpest decline on record in three decades. The S&P/NZX All Index dropped by 30 percent from a peak in February to a trough on 23 March. The sudden and severe deteriorations of the business and financial environment triggered some public firms to make unusual decisions to cancel cash dividends they had already announced publicly (cancellation). More firms announced straightforwardly decisions to omit dividends (omission).
The phenomenon of multiple firms announcing dividend cancellations during a health crisis is rare, if not unprecedented. While dividend omission has been extensively studied in the existing literature, dividend cancellation has not been investigated in any existing literature to the best of our knowledge. This study aims at filling this gap. It is worth noting that a cancellation announcement is different from an omission announcement examined in the previous studies because the former involves dual announcements: an initial announcement of dividend payout and a second announcement of cancelling the payment. As an example, Briscoe Group initially announced on 16 March 2020 that it would “pay a cash dividend on 31 March to all shareholders registered on 23 March” (BGP 2020b). Then, suddenly, on 23 March, the firm announced that “in light of the uncertainty surrounding the potential impact of COVID-19 and the announcements made by the Prime Minister this afternoon, the final dividend of 12.5 cents per share has been cancelled” (BGP 2020a). Due to the first announcement, shareholders anticipated almost certainly that they would receive the promised dividend. The cancellation announcement created a surprising situation that is materially different from that of a conventional omission announcement. Even though both types of announcements represent negative outcomes falling short of investors’ expectations, investors could be more disappointed at a cancellation announcement than an omission announcement due to the difference in their prior expectations (Bell 1985; Gul 1991). Furthermore, the asset pricing literature has established that disappointment aversion is a discount factor in consumption-based asset pricing models (Delikouras 2017; Farago and Tédongap 2018). Therefore, it is not surprising that the corresponding stock market reactions to these two types of dividend announcements are different. Our study sheds some light on this issue. With the main objective of this study being investigating the firm characteristics and stock return performance associated with the dividend cancellation decisions, we also examine the effects of dividend omission, reduction, increase and no-change announcements for comparison purposes.
The NZX provides an interesting “laboratory” market for studying the abnormal dividend announcements during the COVID-19 pandemic, though small with a small sample available2, for two reasons. First, a cancellation sample became available due to the COVID-19 pandemic, allowing us to study the dual events of cancellation announcements to fill a gap in the literature. Second, the NZX provides the most attractive dividend investment opportunities among the developed markets. Based on the data from 1991 to 2019, we found that the MSCI NZX Index component stocks delivered higher average annual dividend yield (2.21%) than other developed markets (averaged at 1.22%). Furthermore, the dividend yields of the NZX stocks contributed to 61.5% of the total stock returns, compared to a 41.5% contribution for the stocks of other developed markets. Although Ellahie and Kaplan (2021) report that the dividends of the NZX firms have been stable over time while Kraiger and Anderson (2020) provide empirical evidence for the dividend omission and resumption decisions of the NZX firms, the existing literature does not offer sufficient understanding of the other types of dividend decisions in New Zealand. The current study contributes new evidence to the literature by investigating five different types of dividend decisions during the COVID-19 pandemic. More importantly, we offer new insights suggesting that dividend cancellation and omission decisions are different: they are driven by different firm characteristics and have different shareholder risk effects.
This study is related to the existing literature in three areas. First, it is related to the literature on the COVID-19 pandemic’s impact on corporate dividend decisions. Due to government extreme measures of lockdowns and restrictions on business activities, COVID-19 had much more serious negative effects on the stock market performance than any previous pandemics (Baker et al. 2020). Krieger et al. (2020) and Cejnek et al. (2021) report that many firms in the U.S. and other developed countries cut or omitted dividends during the pandemic, especially the less profitable and more indebted firms. Xu et al. (2021) also observe lower dividend payouts from Chinese firms during the pandemic, motivated by cash holding preservation. Furthermore, Ramelli and Wagner (2020) claim that cash holdings became significantly more valuable for firms during the pandemic, while Zheng (2021) show that the US firms without abundant cash reserves significantly reduced dividends during the pandemic, indicating that cash holdings played an important role in the firms’ dividend decisions during the COVID-19 pandemic.
Second, this study is related to the studies of important firm characteristics associated with the dividend decisions. Both theories and empirical evidence suggest that many factors can have influence on a firm’s dividend decision, including a firm’s size, profitability and growth prospects (Fama and French 2001); the clientele considerations (Pettit 1977); and investor preference for dividends over capital gains income (Lintner 1962). Fama and French (2001) show that larger size, higher profitability and less investments have positive effects on the payout ratios of US firms. Furthermore, Benartzi et al. (1997), Benito and Young (2003) and Krieger et al. (2020) show that size, cash flow and profitability significantly influence the dividend cut or omission decisions of the US and UK firms. Bhattacharya (1979), DeAngelo et al. (1992) and Denis et al. (1994) suggest that dividend decisions contain information about the firms’ future earnings or cash flows. The international survey study of Brav et al. (2005) reports that dividend decisions convey information about the managerial views on the stability of their firms’ earnings, and managers tend to maintain stable dividends and avoid cutting dividends in normal times. Furthermore, DeAngelo et al. (1992) claim that having negative earnings is a necessary condition for US firms with established earnings and dividend records to cut or omit dividends.
In the Australasian region, Kraiger and Anderson (2020) find that firm size and growth are important characteristics associated with the NZX firms’ dividend omission decisions. Dempsey et al. (2019) report that the firms having high dividend payout ratios tend to have low earnings growth in Australia. Furthermore, Anderson et al. (2020) report that profitability and stock return risk have positive and negative effects, respectively, on the payout ratios of NZX firms.
The third area of the relevant literature concerns the stock return effects of dividend announcements. Empirical evidence suggests that investors interpret the dividend increase or decrease decisions as signals for improving or deteriorating earnings, profitability, growth or cash flow (Denis et al. 1994; Bajaj and Vijh 1995; Amihud and Murgia 1997; Al-Yahyaee et al. 2011; Lie 2005). Benartzi et al. (1997) and Nissim and Ziv (2001) show that dividend reduction or omission decisions are associated with a firm’s declining profitability. Ghosh and Woolridge (1988) observe that the US stock market reacts negatively to the dividend cut and omission decisions, with larger scales of cuts receiving more negative reactions. Dielman and Oppenheimer (1984) observe significant negative abnormal returns of 7.5 (8.5) percent associated with large dividend cut (omission) announcements. Furthermore, Aharony and Swary (1980) and Bajaj and Vijh (1990) report significant cumulative abnormal returns of −2 to −3 percent triggered by the dividend cut announcements of US firms, while Christie (1994) reveals a −6.94 percent cumulative abnormal return associated with the omission announcements over a two- to three-day window. The evidence from New Zealand is similar. Kraiger and Anderson (2020) report significant negative abnormal returns of −1.53% on the announcement day of dividend omissions and −1.62% on the following day, while significant negative cumulative abnormal returns over −5% were observed in the post-announcement period.
To summarize, previous studies show that dividend cuts and omissions are generally announced by the firms with poor earnings, while stock markets tend to react negatively to these announcements. However, the existing literature provides little understanding for the dividend decisions of the firms in the Australasian region during the COVID-19 crisis. Moreover, the rare events of cancellation announcements have never been investigated in any existing studies, possibly because previously firms responded to a crisis generally by reducing or omitting dividends rather than cancelling the announced dividends. This study endeavors to fill these voids.
The current study is more closely related to four recent publications: Krieger et al. (2020); Xu et al. (2021); Zheng (2021) and Cejnek et al. (2021). These studies, however, do not investigate the impact of different dividend policy responses to the pandemic and their corresponding stock market reactions as the current study does. By studying both the characteristics of firms that adjusted dividend policies in response to the pandemic and the corresponding stock return performances, this approach enables us to exploit the firm-level dividend policy channel through which the detrimental effects of the health crisis are transmitted to stock markets.
We have two main findings. First, the firm characteristics important for the various types of dividend decisions during the pandemic are different from those reported in previous studies for “normal” periods. Second, the cancellation announcements are associated with economically and statistically significant negative pre-announcement abnormal returns and positive post-announcement price reversals, a pattern that is not observed for the omission announcements, suggesting that investors reacted more feverishly to the cancellation than the omission decisions.
2. Data
We constructed samples of firms that cancelled (cancellation) or omitted (omission) dividends and samples of firms that reduced (reduction), increased (increase) or maintained the same level (normal) of cash dividends per share in 2020 as compared to that distributed over the same reporting period in 2019. A cancellation sample requires the firm to have dual announcements involving a preceding announcement of a cash distribution, then a second announcement of cancelling the payment. A firm in the omission or another sample only made one announcement.
Since the cancellation announcements were rare and only issued in a concentrated period in early 2020 after the WHO declared the COVID-19 epidemic as a global emergency, our main sample covers the period 30 January to the end of 2020. This sample includes 150 announcements comprising of 10 cancellation, 34 omission, 18 reduction, 34 increase, and 54 normal announcements. Several announcements were excluded including: one of a firm that did not have sufficient observations on share prices, one of a firm that had a contagious takeover event occurring during the event period, and several announcements of banks due to their unsurprising nature following the Reserve Bank’s ban on bank dividends announced earlier. A list of the 10 cancellation announcements is presented in Table A1 in Appendix A. These announcements concern both interim (7) and final (3) dividend decisions, none of which promise to make up the cancelled dividend in a later period.
Note all the Cancellation announcements were issued in 2020Q1 while the other types of announcements were issued throughout the year. To ensure fair comparisons of the different types of announcements, we compile a sub-sample comprising of the announcements issued over a common observation period in 2020Q1 for robustness checks. The sub-sample contains 51 announcements including 10 cancellation, 7 omission, 15 increase, 19 normal, but no reduction announcements.
For each firm, we retrieved the data for annual cash dividend per share and earnings per share from the NZX Company Research database, observed for the financial year reported in 2019. We downloaded other accounting data from Datastream for the year-end 2019 including: total assets, long term debt, earnings before interest, tax and depreciation, book value per share, unadjusted share price, cash and short-term investments, number of shares and date of incorporation. We also downloaded from Datastream the daily total return index data for the shares of sample firms and the S&P/NZX All Index over the period 1 January, 2019 to 30 April, 2021. We constructed measures for the following firm characteristics that are widely used in the dividend studies. Taken as a proxy for a firm’s pre-COVID dividend policy, payout ratio is the ratio of dividends per share to earnings per share for the last full financial year reported in 2019. Following Divecha and Morse (1983), if a firm paid out dividends despite of having a net income, its payout ratio data were dropped from the sample. Size is defined as the natural logarithm of total assets. Debt ratio is the ratio of long-term debts to total assets. Profitability is measured by earnings before interest, tax and depreciation, scaled by total assets. Growth is measured by the market-to-book ratio of total assets. Cash holding is the ratio of cash and short-term investments to total assets. Age is measured by the logarithm of the number of years since a firm’s incorporation. Volatility is calculated as the annualized standard deviation of the daily stock returns in 2019.
Table 1 presents the summary statistics for the firm characteristics for the main sample. Table 2 reports the equality test results for each firm characteristic of a dividend-change group versus the normal group. The summary statistics for the 2020Q1 sub-sample are reported in Table A2 in Appendix A for comparison.

Table 1.
Statistics for firm characteristics by announcement type: full-year 2020 sample.
Table 2.
Statistics for the equality tests between groups: full-year 2020 sample.
The statistics in Table 1 and Table 2 show that the cancellation firms are on average significantly older (exp(3.61) = 37.0 years), and have higher stock price volatility (23.95%), than the normal firms (exp(3.03) = 20.7 years and 18.56%). The omission, reduction and increase firms also have higher average stock price volatilities (28.44%, 22.78% and 22.58%) than the normal firms. Compared to the normal firms, the omission firms are smaller (exp(20.61) = NZ$893 million vs. exp(20.11) = NZ$542 million), the reduction firms are less profitable (11.85% vs. 7.11%) and the increase firms had higher payout ratios (68.63% vs. 114.75%) before the COVID. These differences are statistically significant at the conventional levels. The average pre-pandemic payout ratios of the cancellation, the omission and the reduction firms (78.85%, 76.76% and 75.91%) are also higher than those of the normal firms, albeit without statistical significance.
Although previous studies claim that dividend omissions are associated with poor or negative earnings (DeAngelo et al. 1992; Benartzi et al. 1997; Nissim and Ziv 2001), our data suggest that this is not the case for our sample. Instead, both the mean and the median values of profitability of the cancellation firms (13.34% and 11.89%) are higher than those of the normal firms (11.85% and 9.26%); it is the same with the median value of profitability of the omission firms, albeit without statistical significance. The contrast between our sample and those of the previous studies indicates the powerful impact of COVID-19 on changing the dividend-decision behavior of firms during the pandemic.
3. Methodology
To investigate whether firm characteristics affect the various types of the dividend decisions, we performed multinomial logistic regression analysis specified in Equation (1):
where Y is a categorical variable denoting the type of a dividend decision; Yi = k denotes the probability of a firm i announcing a decision to maintain the normal dividend level (k = 1, the reference category), or to increase (k = 2), reduce (k = 3), omit (k = 4) or cancel (k = 5) the dividend; F indicates a multinomial linear function; X is a vector of firm characteristic variables including the pre-COVID payout ratio, firm size in logarithm, long-term debt ratio, profitability, growth, cash holding, firm age in logarithm, volatility of stock returns, and industry sector controls. These firm characteristics are widely used in the previous dividend studies (Fama and French 2001; Benito and Young 2003; Kraiger and Anderson 2020).
Cejnek et al. (2021) show that financial firms exhibited more pronounced dividend smoothing behavior during the COVID-19 pandemic year 2020. Moreover, the firms in cyclical services (transportation, recreation and hotel chains) were hurt harder, while the utility firms were less affected than other firms. Considering these sector effects, we included three dummy variables to identify the firms in the cyclical services, utilities and financial/real estate sectors. Following Krieger et al. (2020), industrial firms were treated as the default sector.
To study the stock performance effects of the different types of dividend announcements, we conducted event study analysis in three steps based on the single-factor market model described in Equation (2).
where Ri,t is the daily stock return of firm i; Rm,t is the daily return of the S&P/NZX All index; ϵi,t is the error term.
First, we estimated the coefficients αi and βi for each stock i using the data observed over a 220-day estimation window. To abate the contamination effects of the previous dividend announcements on the subsequent announcements 3, the estimation period was (−279, −60) with the announcement day set as day zero. Next, we estimated the daily abnormal returns (ARi,t) and the event window cumulative abnormal returns (CARi,T1−T2) for each firm i over a 26-day event window (−5, 20), based on Equations (3) and (4).
where αi and βi are the coefficient estimates obtained in the first step.
In step three, we estimated the average ARs and the average CARs for each announcement group and tested the statistical significance of each AARt and each ACART1−T2 using the standardized cross-sectional test corrected for serial correlation (CSect test) (Boehmer et al. 1991) and generalized sign test (Cowan 1992). For brevity, we only present and discuss the results of the cross-sectional tests, although the results of generalized sign tests are available from the authors upon request.
In addition, we performed a dual-event study for the cancellation sample by estimating the cumulative abnormal returns over the dual-event window starting from the dividend announcement day to the day of the cancellation announcement. The length of dual-event windows varied between 6 to 26 trading days, averaged at 13 trading days.
4. Empirical Results
This section discusses the empirical results, focusing on the main sample while commenting on the supplemental findings for the 2020Q1 sub-sample briefly.
4.1. Multinomial Logistic Regression Results
The results of econometric analysis on which firm characteristics affect the sample firms’ choices of different dividend decisions are reported in Table 3 for the main sample. The results show that higher pre-pandemic payout ratio statistically significantly increases the likelihood of a cancellation, an omission or an increase dividend decision during the pandemic. Higher profitability and higher growth reduce the probability of a reduction decision and an omission decision, respectively. Furthermore, higher stock return volatility increases the likelihood of an omission, a reduction and an increase decision, while the financial and real estate firms were less likely to announce an omission decision during the pandemic year 2020.
Table 3.
Multinomial logistic regression results: full-year 2020 sample.
To save space, the abnormal return estimates for the sub-sample are presented in Table A3 in Appendix A. These results provide consistent evidence for the positive influence of the stock return volatility on the probability of an omission or an increase dividend decision in 2020Q1. However, payout ratio, profitability and growth become unimportant factors for the various types of dividend decisions in 2020Q1. Nevertheless, the key finding remains consistent for the main and the sub- samples: the cancellation and omission decisions are influenced by different firm characteristics.
It is worth noting that all the coefficient estimates of size, cash holding and age are statistically insignificant while the coefficient estimates of profitability for the cancellation and the omission samples are statistically insignificant, contrary to the findings of previous studies. Previously, Benartzi et al. (1997), Benito and Young (2003) and Krieger et al. (2020) show that size, cash flow and profitability significantly influence the dividend cut or omission decisions of the US and UK firms. Anderson et al. (2020) and Kraiger and Anderson (2020) also report that size plays an important role in the NZX firms’ dividend decisions. Instead, we find no such significant evidence for the NXZ firms in our sample. In hindsight, we found that six out of the ten cancellation firms in our sample ended up being more profitable in 2020 than in 2019.
Notice that, for his definition of pseudo-R2, McFadden (1979) recommended that any values within the range of 0.2 to 0.4 indicate good model fit while a value above 0.4 indicates an excellent model fit. Therefore, the McFadden Pseudo-R2 statistics reported for the main sample (0.233) and the sub-sample (0.610) in Table 3 and Table A3 indicate good and excellent fit of the multinomial logistic regression model for our samples.
In summary, we found empirical evidence suggesting that pre-pandemic payout policy and stock return volatility played important roles in the dividend decisions of the NZX firms in our samples. However, some firm characteristics that were previously shown to be important factors affecting dividend decisions were unimportant for the NZX firms in our samples. In addition, the cancellation and the omission decisions of the NZX firms were influenced by different firm characteristics during the COVID-19 pandemic.
4.2. Event Study Results
This section discusses the stock return performance associated with the various types of dividend announcements, focusing on the main sample while briefly discussing the sub-sample for comparison. Figure 1 and Table 4 present the average daily abnormal return (AAR) results, while Figure 2 and Table 5 report the average cumulative abnormal return (ACAR) estimates for the main sample. Note: The event windows used for the tables are largely different from the windows used for the figures, except for the first seven windows from (−5, −1) to (0, +1) being in common. These seven common windows were chosen based on the event windows that have often been used in the literature to report the results (See, e.g., Lie 2005; Al-Yahyaee et al. 2011; Bajaj and Vijh 1990). The remaining different windows used in the tables were chosen to provide more informative results complementing those depicted in the figures with space constraints.
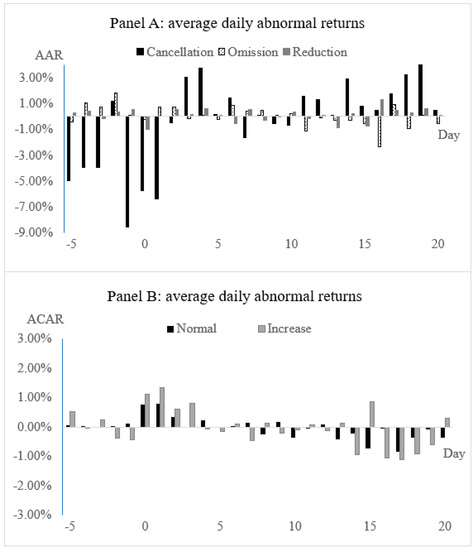
Figure 1.
Average daily abnormal return estimates: full-year 2020 sample. Notes: The average daily abnormal returns are the estimates of the market model based on an estimation window of −279 days through to −60 days before the announcement day.
Table 4.
Average daily abnormal return estimates: full-year 2020 sample.
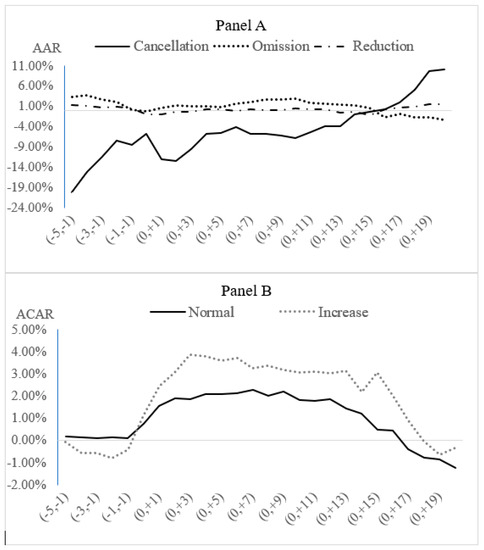
Figure 2.
Average cumulative abnormal return estimates: full-year 2020 sample. Notes: The average cumulative abnormal returns were calculated for (−T, −1) pre-announcement windows or (0, −T) post-announcement windows. The daily abnormal returns are the estimates of the market model based on an estimation window of −279 days through to −60 days before the announcement day.
Table 5.
Average cumulative abnormal return estimates: full-year 2020 sample.
Referring to Panel A of Figure 1, substantial negative AARs were observed for the cancellation events from the pre-announcement period until two days after the announcement day. A consistent trend of positive price reversal dominates the post-announcement period. From Column 2 of Table 4, a statistically significant negative AAR of −4.98% is observed on day −5 before the cancellation announcement. More statistically significant negative AARs are observed over a three-day window (−1, 1), ranging between −8.52% and −5.74% per day. In comparison, the AARs associated with the omission and the reduction announcements illustrated in Panel A of Figure 1 display different patterns. First, the pre-announcement AARs for the omission and the reduction decisions are generally positive, which are in striking contrast with the observation for the cancellation decision. From columns 3 and 4 of Table 4, statistically significant positive AARs are observed for the omission announcements on day −2 (1.85%) and for the reduction announcements on day −1 (0.52%). Most other AAR estimates are statistically insignificant for these two events surround the announcement day. These results indicate that investors may have speculations for the cancellation decisions but have no anticipations of the omission or the reduction decisions. Furthermore, investors did not react as feverishly to the omission or the reduction announcements as they did to the cancellation announcements.
Inspecting Panel B of Figure 1, both positive and negative AARs are observed for the increase and the normal dividend announcements over the event period, albeit small. Referring to the last two columns in Table 4, the increase announcements are associated with statistically significant negative AARs of −0.37% on day −2 and −0.43% on day −1, followed by positive AARs of 1.12% on the announcement day, 1.34% on day +1 and 0.80% on day +3. These results indicate that investors did not anticipate the good news of increasing dividends and reacted to the good news slowly after the release of the announcements. For the normal dividend announcements, we observe only one statistically significant AAR, which is positive at 0.08% on day +1, suggesting that the normal dividend announcements caused little disturbance to the market.
In Figure 2, Panel A illustrates the ACARs for the cancellation, the omission and the reduction events. Two distinct features of the ACARs associated with the cancellation announcements emerge: substantial cumulative losses in all the event windows before that of (0, +14), and a consistent trend of positive post-announcement price reversals associated with the cancellation announcements. These observations do not apply to the omission nor the reduction announcements. Inspecting Panel B of Figure 2, the normal and the increase dividend decisions show a common pattern of small positive ACARs surround the announcement day, which were fully reversed after three weeks.
Referring to Table 5 for the detailed estimates of the ACARs associated with the five announcement types. From column 2, the cancellation sample has statistically significant negative ACARs between −11.32% and −20.23% in three pre-announcement windows (−5, −1), through to (−3, −1). Further statistically significant negative ACARs are observed for the (−1, +1) window (−20.62%) and the (−5, +1) window (−32.33%). The magnitudes of these ACARs were not seen before in the literature of dividend omission effects.
On the other hand, the statistics reported for the omission sample in column 3 of Table 5 exhibit economically and statistically significant positive ACARs in the pre-announcement period, ranging from 1.98% for the (−2, −1) window to 3.77% for the (−4, −1) window. Both negative and positive ACARs show in the post-announcement period, which do not possess statistical significance. These results are contradictory to the findings reported in the literature. For example, Lie (2005) reports negative ACARs associated with the dividend omissions of the US firms as large as −5.7% for the (−1, +1) window and −1.68% for the (−4, −1) window. In contrast, our omissions sample of the NZX firms shows a statistically insignificant positive ACAR of 0.65% for the (−1, +1) window and a statistically significantly positive ACAR of 3.77% for the (−4, −1) window.
Turning to the reduction sample results presented in column 4 of Table 5, there is no statistically significant ACAR in the post-announcement period. However, we find some statistically significant positive ACARs for several pre-announcement windows ranging from 0.52% for the (−1, −1) window to 1.39% for the (−5, −1) window. These results are different from the empirical evidence reported in previous studies. For example, Lie (2005) documents significant negative ACARs of −3.0% and −0.82% in the (−1, +1) and the (−4, −1) pre-announcement windows associated with the dividend reduction announcements of the US firms. In contrast, we report an insignificant ACAR of −0.44% for the (−1, +1) window and a statistically significant ACAR of 1.12% for the (−4, −1) window, indicating that the market reactions to the reduction announcements were less negative during the pandemic in New Zealand than they were during the normal time in the US.
Referring to the ACARs for the increase and the normal dividend samples reported in the last two columns of Table 5, statistically significant positive ACARs show in several windows surround the announcement day. The increase dividend announcements are associated with statistically significant positive ACARs of 2.46% in the (0, +1) window, 2.03% in the (−1, +1) window, and 2.38% in the (−5, +1) window. For the normal dividend announcements, statistically significant positive ACARs show in the (0, +1) window (1.55%) and the (−5, +1) window (1.66%). Furthermore, the increase sample had small but statistically significant negative ACARs in four pre-announcement windows ranging between -0.43% to −0.58%, suggesting that investors did not anticipate the good news until the announcement day.
Next, we briefly discuss the abnormal return estimates for the 2020Q1 sub-sample presented in Table A4 and Table A5 in Appendix A. Note that there was no reduction announcement in Q1. Referring to Table A4, statistically significant negative AARs are observed for the omission sample on day +3 (−1.06%), the increase sample on day −1 (−0.72%), and the normal sample on day −4 (−0.36%), day −3 (−0.71%) and day 0 (−0.98%). From column 4 in Table A5, we observe a statistically significant ACAR of −4.94% for the omission announcements in the (−1, +1) window. Surprisingly, many of the ACARs for the increase and the normal dividend samples reported in the last two columns are statistically significantly negative, including a −9.26% and a −11.90% ACAR in the (+2, +20) window for the increase and the normal sample, respectively. These results indicate that investors did not perceive these dividend decisions as good news at the onset of COVID-19 in 2020Q1. The magnitudes of these abnormal returns, however, are substantially smaller than those observed for the cancellation sample, indicating that investors reacted more feverishly to the announcements of the cancellation decisions than they did to any other types of dividend decisions. This evidence is consistent with the results reported for the main sample discussed earlier.
Could the significant negative pre-announcement AARs observed uniquely for the cancellation sample be the reversals of any positive market reactions to the prior payout announcements issued before the cancellation announcements? To address this concern, Table 6 presents the results of a dual-event analysis of the cancellation sample, estimated over the event window starting from the payout announcement day to the cancellation announcement day. The results show that 90 percent of the cancellation sample had negative AARs over the dual-event window, with statistically significant negative AAR of −1.78% and ACAR of −25.97% reported for that window. In the absence of positive market reactions to the preceding dividend payout announcements, the significant negative pre-announcement abnormal returns observed for the cancellation sample reflect the investors’ negative sentiment about the cancellation decisions.
Table 6.
Dual-event study results for the cancellation sample.
In summary, we report economically and statistically significant negative abnormal returns associated with cancellation announcements starting five days before until one day after the announcements, followed by positive price reversals in the post-announcement period. These distinct patterns of abnormal returns were not observed for the omission announcements, indicating that cancellation events are indeed different from the omission events that have been widely examined in previous studies. Furthermore, we found significant positive anormal returns associated with the increase and the normal dividend announcements in the post-announcement period for the main sample of 2020 observations. Contrary to the findings of previous studies (Aharony and Swary 1980; Ghosh and Woolridge 1988; Al-Yahyaee et al. 2011; Dielman and Oppenheimer 1984), we did not observe any statistically significant negative abnormal returns for the dividend reduction sample. Overall, the empirical evidence suggests that the cancellation announcements received stronger negative market reactions than the omission and other types of dividend announcements issued by the NZX firms in 2020.
5. Conclusions
We studied a sample of the NZX firms and report new evidence for the dividend announcements made during the COVID-19 pandemic in 2020. A multinomial logistic regression analysis shows that higher pre-pandemic payout policy increases the likelihood of cancellation, omission and increase decisions. Moreover, higher profitability and higher growth reduce the probability of a dividend reduction and an omission decision, respectively. Furthermore, higher stock return volatility increases the likelihood of cancellation, omission and increase decisions. In contrast to the evidence previously reported in the literature (Benartzi et al. 1997; Benito and Young 2003; Krieger et al. 2020; Anderson et al. 2020; Kraiger and Anderson 2020), size, financial leverage or cash holding are unimportant factors for the firms’ dividend reduction or omission decisions in our sample.
We provide strong evidence of negative abnormal returns surrounding the cancellation announcements followed by persistent positive price reversals in the post-announcement period. This unique pattern is not observed for the omission or the reduction announcements. Furthermore, we observe small but statistically significant positive abnormal returns prior to the omission and the reduction announcements that contradict the findings of previous studies. We conclude that investors did not react as feverishly to the omission or the reduction announcements as they did to the cancellation announcements. These results also indicate that investors may have anticipated the cancellation decisions but not the Omission or any other types of dividend decisions issued by the NZX firms during the pandemic year 2020.
This study complements the existing studies in two areas. First, our sample incorporates the cancellation announcements that have not been studied before in the existing literature. We present evidence showing that the cancellation and the omission decisions are different in both the determinant firm characteristics and the associated stock return performances. Importantly, the cancellation decisions significantly increase the stock return risk while the omission decisions do not. Second, we show that the determinant firm characteristics and the market reactions associated with the different types of dividend decisions of the NZX firms during COVID-19 are different from the evidence presented in previous studies for other markets (Ghosh and Woolridge 1988; Lie 2005; Al-Yahyaee et al. 2011; Krieger et al. 2020). These results indicate that COVID-19 brought such a tremendous shock to the business and financial environment that the conventional wisdoms regarding the firms’ dividend decisions may have broken down during the pandemic. Therefore, it is timely and important to revisit the dividend announcement studies to gain additional insights when new data over the pandemic period become available.
There are several limitations of our study. First, there is a small sample problem with the potential contamination effects of other concurrent but immaterial announcements. This problem may contribute to our findings of rather weak firm characteristic influences on the cancellation decisions. Second, our analysis of stock return risk follows the convention of event studies, which focus on risk-adjusted stock returns. However, there are risk measures such as volatility (Floros et al. 2020; Tsagkanos et al. 2021), down-to-up volatility and negative coefficient of skewness (Chen et al. 2001; Kim et al. 2011). Further studies using other risk measures would enrich our understanding of the stock return implications of abnormal dividend announcements.
Nevertheless, the study of the cancellation announcements is the first in the literature that provides interesting, albeit preliminary, insights into this unusual type of dividend decision and the associated stock return reactions during a public health crisis. The observation of strong negative abnormal returns followed by strong positive reversals for the cancellation sample indicates significant stock return risk associated with the dividend cancellation announcements. It has a practical implication, suggesting that investors should not sell their shares after these announcements are issued. This empirical evidence alerts financial managers to carefully weigh the costs and benefits of cancelling promised dividend payments. It is also a wake-up call for policy makers to provide clear guidance for the regulation and procedure of dividend cancellation announcements to improve investor protection. In summary, although New Zealand is a small open economy, our findings for the NZX firms may still provide a revelation to other markets that have scales or institutional, regulatory, culture and economic environments similar to New Zealand’s.
Author Contributions
Conceptualization, M.Q. and X.-M.L.; methodology, M.Q.; software, M.Q.; validation, M.Q. and X.-M.L.; formal analysis, M.Q. and X.-M.L.; investigation, M.Q. and X.-M.L.; resources, M.Q.; data Curation, M.Q.; writing—original draft preparation, M.Q.; writing—review and editing, M.Q. and X.-M.L.; visualization, M.Q. All authors have read and agreed to the published version of the manuscript.
Funding
This research received no external funding.
Data Availability Statement
All data used in this article are either publicly available or obtained through subscriptions to Datastream and the NZX Company Research database.
Conflicts of Interest
The authors declare no conflict of interest.
Appendix A
Table A1.
List of the cancellation events.
Table A1.
List of the cancellation events.
| Firm | Dividend Announcement | Cancellation Announcement |
|---|---|---|
| Auckland International Airport Limited | 13 March 2020 | 17 March 2020 |
| Seeka Limited | 26 February 2020 | 19 March 2020 |
| Vista Group International Limited | 17 March 2020 | 19 March 2020 |
| Air New Zealand Limited | 16 March 2020 | 20 March 2020 |
| Tourism Holdings Limited | 28 February 2020 | 20 March 2020 |
| Steel & Tube Holdings Limited | 24 February 2020 | 20 March 2020 |
| Briscoe Group Limited | 16 March 2020 | 23 March 2020 |
| The Colonial Motor Company Limited | 19 February 2020 | 25 March 2020 |
| Fletcher Building Limited | 19 February 2020 | 25 March 2020 |
| The Warehouse Group Limited | 17 March 2020 | 26 March 2020 |
Table A2.
Statistics for firm characteristics by announcement type: 2020Q1 sample.
Table A2.
Statistics for firm characteristics by announcement type: 2020Q1 sample.
| Variable | Sample Type (Obs.) | Mean | Median | Minimum | Maximum | Std. Dev. |
|---|---|---|---|---|---|---|
| Payout ratio | Cancellation (10) | 78.85% | 71.61% | 47.14% | 119.79% | 24.53% |
| Omission (6) | 57.62% | 77.65% | 0 | 96.53% | 46.04% | |
| Increase (15) | 119.44% | 78.27% | 13.59% | 477.27% | 119.92% | |
| Normal (18) | 77.76% | 68.95% | 24.03% | 198.80% | 47.68% | |
| Size | Cancellation (10) | 20.74 | 20.00 | 19.28 | 22.89 | 1.47 |
| Omission (7) | 19.91 | 20.30 | 18.44 | 21.05 | 0.94 | |
| Increase (15) | 20.79 | 21.79 | 15.85 | 22.99 | 2.14 | |
| Normal (19) | 20.51 | 20.73 | 17.85 | 22.99 | 1.46 | |
| Debt ratio | Cancellation (10) | 43.47% | 45.13% | 21.34% | 73.07% | 16.54% |
| Omission (7) | 55.76% | 54.42% | 26.15% | 80.54% | 19.31% | |
| Increase (15) | 51.62% | 53.57% | 15.85% | 86.26% | 19.58% | |
| Normal (19) | 34.57% | 34.58% | 0.67% | 69.93% | 19.01% | |
| Profit-ability | Cancellation (10) | 13.34% | 11.89% | 7.50% | 25.81% | 5.72% |
| Omission (7) | 7.84% | 14.47% | −56.92% | 47.15% | 31.50% | |
| Increase (15) | 10.08% | 7.90% | 2.99% | 27.86% | 6.86% | |
| Normal (19) | 11.72% | 9.89% | 0.91% | 31.43% | 6.84% | |
| Growth | Cancellation (10) | 148.32% | 126.99% | 6.48% | 292.52% | 73.44% |
| Omission (7) | 175.83% | 126.69% | 87.69% | 380.75% | 111.11% | |
| Increase (15) | 150.23% | 126.36% | 60.65% | 354.22% | 70.94% | |
| Normal (19) | 165.39% | 139.86% | 57.30% | 342.50% | 81.24% | |
| Cash holding | Cancellation (10) | 7.64% | 4.24% | 0.43% | 22.54% | 7.96% |
| Omission (7) | 6.08% | 3.62% | 0.70% | 17.76% | 6.50% | |
| Increase (15) | 5.74% | 2.04% | 0.01% | 38.00% | 9.82% | |
| Normal (19) | 9.51% | 1.64% | 0.11% | 99.71% | 23.03% | |
| Age | Cancellation (10) | 3.61 | 3.47 | 2.79 | 4.61 | 0.60 |
| Omission (7) | 3.07 | 2.99 | 1.34 | 4.43 | 1.01 | |
| Increase (15) | 2.89 | 2.89 | 0.35 | 4.79 | 1.07 | |
| Normal (19) | 3.01 | 3.20 | 1.43 | 3.57 | 0.56 | |
| Volatility | Cancellation (10) | 23.95% | 22.40% | 14.25% | 40.64% | 9.07% |
| Omission (7) | 28.43% | 24.32% | 180.2% | 42.48% | 9.92% | |
| Increase (15) | 24.46% | 20.72% | 12.56% | 66.16% | 12.94% | |
| Normal (19) | 19.41% | 17.56% | 13.43% | 37.63% | 6.37% |
Notes: The values of firm characteristic variables are taken from 2019. Note there was no reduction announcement in 2020Q1.
Table A3.
Multinomial logistic regression results: 2020Q1 sample.
Table A3.
Multinomial logistic regression results: 2020Q1 sample.
| Reference: | Cancellation (n = 10) | Omission (n = 7) | Increase (n = 15) | Log-Likelihood | |||
|---|---|---|---|---|---|---|---|
| Normal | β | Exp(β) | β | Exp(β) | β | Exp(β) | Model Fitting |
| Payout ratio | 0.554 (2.145) | 1.741 [0.796] | −144.109 (11575) | 0 [0.9990] | 0.929 (0.841) | 2.532 [0.269] | 74.764 *** (23.663) |
| Size | 0.263 (0.537) | 1.301 [0.624] | −10.414 (5563) | 0 [0.999] | −0.101 (0.428) | 0.904 [0.813] | 51.733 (0.632) |
| Debt ratio | 2.731 (4.497) | 15.342 [0.544] | 299.010 (38659) | 7.2 × 10129 [0.994] | 12.557 *** (4.663) | 2.8 × 10⁵ *** [0.007] | 78.447 *** (27.347) |
| Profit- ability | 14.541 (13.525) | 2.1 × 10⁶ [0.282] | 1391.754 (174011) | [0.994] | 2.635 (12.513) | 13.937 [0.833] | 76.996 *** (25.896) |
| Growth | −2.027 (1.268) | 0.132 [0.110] | −116.502 (11136) | 0 [0.992] | −0.754 (1.004) | 0.470 [0.452] | 72.207 *** (21.106) |
| Cash holding | 3.429 (7.810) | 30.833 [0.661] | 317.804 (20919) | 1.1 × 10138 [0.988] | 1.658 (3.456) | 5.247 [0.631] | 51.401 (0.300) |
| Age | 0.968 (1.022) | 2.632 [0.344] | −14.669 (4879) | 4.3 × 10⁻⁷ [0.998] | 0.667 (0.899) | 1.948 [0.458] | 52.104 (1.003) |
| Volatility | 4.971 (7.160) | 144.160 [0.488] | 7.089 * (18912) | 1198 * [1.000] | 13.746 * (7.904) | 9.3 × 105 * [0.082] | 55.097 (3.996) |
| Services | −3.195 (1.852) | 0.049 [0.110] | −37.667 (0.000) | 4.4 × 10⁻¹⁷ [.] | −23.456 (0.000) | 6.8 × 10⁻¹¹ [1.000] | 59.037 * (7.937) |
| Financial/real estate | −22.773 * (5146.66) | 1.3 × 10−10 * [0.085] | −75.915 (25058) | 1.1 × 10⁻³³ [0.998] | 0.692 (1.775) | 1.997 [0.697] | 57.418 * (6.317) |
| Utility | −22.466 (0.000) | 1.8 × 10⁻¹⁰ [.] | −90.874 (12415) | 3.4 × 10−40 [0.994] | −1.872 (2.125) | 0.154 [0.379] | 58.505 * (7.404) |
| Intercept | −8.805 (11.544) | [0.446] | 140.961 (156202) | [0.999] | −7.809 (9.754) | [0.423] | 51.923 (0.823) |
| Model | Log-likelihood | 51.100 *** | [<0.001] | ||||
| fitting | McFadden Pseudo-R2 | 0.610 | Obs. | 51 | |||
Notes: No reduction was announced in 2020Q1. Figures reported are the maximum likelihood estimates of the coefficients (β) and the odd ratios (Exp(β)) estimated using the multinomial logistic regression model described in Equation (1). The normal dividends group (n = 19) was set as the reference group. Figures in parentheses and brackets are the estimates of the standard errors and the statistical significance values, respectively. Figure in the last column are the log-likelihood ratio test statistics following by the chi-square statistics in parentheses. Firm size and age are measured in logarithm while volatility is estimated from the daily stock returns in 2019. Controls for sector effects are dummy variables that take the value of 1 for non-industrial firms in the cyclical services, financial services and real estate or utility sector. Symbols * and *** denote statistical significance at the 10%, 5% and 1% level, respectively. The symbol “.” indicates missing value of an estimate due to floating point overflow in computation.
Table A4.
Average daily abnormal return estimates: 2020Q1 sample.
Table A4.
Average daily abnormal return estimates: 2020Q1 sample.
| Day | Cancellation | Omission | Increase | Normal |
|---|---|---|---|---|
| −5 | −4.98% *** (−3.359) | −2.66% (−0.959) | 0.87% (0.837) | −0.22% (−0.938) |
| −4 | −3.94% (−1.161) | 2.31% (0.898) | 0.12% (0.355) | −0.36% ** (−2.103) |
| −3 | −3.95% (−1.164) | 2.66% (0.861) | −0.33% (−1.221) | −0.71% ** (−2.247) |
| −2 | 1.15% (0.305) | 1.89% (0.726) | 0.02% (0.106) | −0.34% (−1.152) |
| −1 | −8.52% ** (−2.379) | −1.15% (−1.917) | −0.72% ** (−2.550) | −0.04% (−0.106) |
| 0 | −5.74% * (−1.676) | −2.70% (−1.550) | 0.13% (0.183) | −0.98% ** (−2.811) |
| 1 | −6.36% * (−1.920) | −1.09% (−0.816) | 0.83% (1.526) | −0.19% (−0.374) |
| 2 | −0.47% (−0.381) | 1.43% (0.919) | −0.46% (−0.789) | 0.00% (0.000) |
| 3 | 3.02% (0.703) | −1.06% ** (−3.092) | 0.11% (0.439) | −0.51% (−1.052) |
| 4 | 3.77% (1.197) | −1.65% (−1.687) | −0.70% * (−2.009) | −0.27% (−0.555) |
| 5 | 0.17% (0.471) | 0.54% (0.761) | −0.30% (−0.658) | −0.55% (−1.177) |
| 6 | 1.46% (1.399) | 2.11% (0.897) | 0.53% (1.320) | 0.22% (0.399) |
| 7 | −1.62% (−1.105) | −0.15% (−0.066) | −0.81% (−1.755) | 0.03% (0.094) |
| 8 | 0.08% (0.763) | 2.36% (0.698) | −0.16% (0.188) | −1.01% * (−1.849) |
| 9 | −0.54% (−0.525) | −0.22% (−0.470) | −0.41% (−0.725) | 0.17% (0.097) |
| 10 | −0.65% (−1.247) | −1.33% (−0.815) | −0.43% (−0.860) | −0.79% (−1.711) |
| No. obs. | 10 | 7 | 15 | 19 |
Notes: Figures are the AARs followed by the cross-section test statistics in parentheses for the dividend announcements issued in 2020Q1. No reduction was announced in 2020Q1. Symbols *, ** and *** denote statistical significance at the 10%, the 5% and 1% level, respectively.
Table A5.
Average cumulative abnormal return estimates: 2020Q1 sample.
Table A5.
Average cumulative abnormal return estimates: 2020Q1 sample.
| Window | Cancellation | Omission | Increase | Normal |
|---|---|---|---|---|
| (−5,−1) | −20.23% *** (−3.088) | 0.35% (0.057) | 0.09% (−0.071) | −2.66% *** (−3.453) |
| (−4,−1) | −15.26% ** (−2.092) | 3.01% (0.419) | −0.78% (−1.131) | −2.44% *** (−3.149) |
| (−3,−1) | −11.32% ** (−2.053) | 0.70% (0.131) | −0.90% (−1.499) | −2.08% ** (−2.771) |
| (−2,−1) | −7.37% (−1.030) | −1.96% (−0.548) | −0.57% (−0.879) | −1.37%** (−2.469) |
| (−1,−1) | −8.52% ** (−2.379) | −1.15% (−1.917) | −0.72% ** (−2.550) | −0.04% (−0.106) |
| (0,0) | −5.74% * (−1.676) | −2.70% (−1.550) | 0.13% (0.183) | −0.98% ** (−2.811) |
| (0,+1) | −12.10% ** (−2.301) | −3.79% (−1.850) | 0.96% (1.007) | 1.55% ** (2.050) |
| (−1,+1) | −20.62% *** (−3.810) | −4.94% * (−2.088) | 0.23% (0.277) | −1.22% (1.731) |
| (−5,+1) | −32.33% *** (−4.983) | −0.74% (−0.122) | 0.92% (0.764) | −2.85% *** (−3.077) |
| (+2,+7) | 6.34% (0.532) | 1.23% (0.228) | −1.64% (−1.401) | −1.07% (−1.479) |
| (+2,+12) | 8.11% (1.016) | 1.21% (0.951) | −3.11% * (−1.846) | −3.05% * (−1.850) |
| (+2,+17) | 14.04% ** (2.005) | −15.54% (−1.306) | −6.52% * (−1.866) | −9.41% ** (−2.775) |
| (+2,+20) | 22.25% *** (3.262) | −19.89% (−1.43) | −9.26% * (−2.121) | −11.90% *** (−3.364) |
| No. obs. | 10 | 7 | 15 | 19 |
Notes: Figures are the event-window ACARs followed by the cross-section test statistics in parentheses for the dividend announcements issued in 2020Q1. No reduction was announced in 2020Q1. Symbols *, ** and *** denote statistical significance at the 10%, the 5% and 1% level, respectively.
Notes
| 1 | The GDP data were sourced from the website of Statistics New Zealand at https://www.stats.govt.nz/indicators/gross-domestic-product-gdp, accessed on 1 July 2021. |
| 2 | Event studies on small samples are typical. For instance, the Meznar et al. (1998) study uses samples of 7, 10, 19, 20 and 22 firms. Nevertheless, Brown and Warner (1985) examine the properties of event studies based on samples as small as five securities and conclude that the test statistics and the goodness of fit test results remain valid for the small samples. |
| 3 | For the cancellation sample, the number of days between an early dividend announcement date and the subsequent announcement date of cancelling the dividend could be as long as 26 days. |
References
- Aharony, Joseph, and Itzhak Swary. 1980. Quarterly dividend and earnings announcements and stockholders’ returns: An empirical analysis. The Journal of Finance 35: 1–12. [Google Scholar] [CrossRef]
- Al-Yahyaee, Khamis H., Toan M. Pham, and Terry S. Walter. 2011. The information content of cash dividend announcements in a unique environment. Journal of Banking and Finance 35: 606–12. [Google Scholar] [CrossRef]
- Amihud, Yakov, and Maurizio Murgia. 1997. Dividends, taxes, and signaling: Evidence from Germany. Journal of Finance 52: 397–408. [Google Scholar] [CrossRef]
- Anderson, Warwick, Nalinaksha Bhattacharyya, Cameron Morrill, and Helen Roberts. 2020. Dividend payout and executive compensation: Theory and evidence from New Zealand. Accounting and Finance 60: 1007–22. [Google Scholar] [CrossRef]
- Bajaj, Mukesh, and Anand M. Vijh. 1990. Dividend clienteles and the information content of dividend changes. Journal of Financial Economics 26: 193–219. [Google Scholar] [CrossRef]
- Bajaj, Mukesh, and Anand M. Vijh. 1995. Trading behavior and the unbiasedness of the market reaction to dividend announcements. Journal of Finance 50: 255–79. [Google Scholar] [CrossRef]
- Baker, Scott R., Nicholas Bloom, Steven J. Davis, Kyle Kost, Marco Sammon, and Tasaneeya Viratyosin. 2020. The unprecedented stock market reaction to Covid-19. Review of Asset Pricing Studies 10: 742–58. [Google Scholar] [CrossRef]
- Bell, David E. 1985. Disappointment in decision making under uncertainty. Operations Research 33: 1–27. [Google Scholar] [CrossRef]
- Benartzi, Shlomo, Roni Michaely, and Richard Thaler. 1997. Do changes in dividends signal the future or the past? Journal of Finance 52: 1007–34. [Google Scholar] [CrossRef]
- Benito, Andrew, and Garry Young. 2003. Hard times or great expectations? Dividend omissions and dividend cuts by UK firms. Oxford Bulletin of Economics and Statistics 65: 531–55. [Google Scholar] [CrossRef]
- BGP Ltd. 2020a. BGP—Final Dividend Cancellation. Available online: https://www.nzx.com/announcements/350472 (accessed on 30 October 2022).
- BGP Ltd. 2020b. BGP—Full Year Results to 26 January 2020. Available online: https://www.nzx.com/announcements/350004 (accessed on 30 October 2022).
- Bhattacharya, Sudipto. 1979. Imperfect information, dividend policy, and the ‘bird in the hand’ fallacy. Bell Journal of Economics and Management Science 10: 259–70. [Google Scholar] [CrossRef]
- Boehmer, Ekkehart, Jim Musumeci, and Annette B. Poulsen. 1991. Event-study methodology under conditions of event-induced variance. Journal of Financial Economics 30: 253–72. [Google Scholar] [CrossRef]
- Brav, Alon, John R. Graham, Campbell R. Harvey, and Roni Michaely. 2005. Payout policy in the 21st century. Journal of Financial Economics 77: 483–527. [Google Scholar] [CrossRef]
- Brown, Stephen J., and Jerold B. Warner. 1985. Using daily stock returns: The case of event studies. Journal of Financial Economics 14: 3–32. [Google Scholar] [CrossRef]
- Cejnek, George, Otto Randl, and Josef Zechner. 2021. The COVID-19 pandemic and corporate dividend policy. Journal of Financial and Quantitative Analysis 56: 2389–410. [Google Scholar] [CrossRef]
- Chen, Joseph, Harrison Hong, and Jeremy C. Stein. 2001. Forecasting crashes: Trading volume, past returns, and conditional skewness in stock prices. Journal of Financial Economics 61: 345–81. [Google Scholar] [CrossRef]
- Christie, William G. 1994. Are dividend omissions truly the cruelest cut of all? Journal of Financial and Quantitative Analysis 29: 459–80. [Google Scholar] [CrossRef]
- Cowan, Arnold Richard. 1992. Nonparametric event study tests. Review of Quantitative Finance and Accounting 2: 343–58. [Google Scholar] [CrossRef]
- DeAngelo, Harry, Linda DeAngelo, and Douglas J. Skinner. 1992. Dividends and losses. Journal of Finance 47: 1837–63. [Google Scholar] [CrossRef]
- Delikouras, Stefanos. 2017. Where the kink? Disappointment events in consumption growth and equilibrium asset prices. Review of Financial Studies 30: 2851–89. [Google Scholar] [CrossRef]
- Dempsey, Michael, Abeyratna Gunasekarage, and Thanh Tan Truong. 2019. The association between dividend payout and firm growth: Australian evidence. Accounting and Finance 59: 2345–76. [Google Scholar] [CrossRef]
- Denis, David J., Diane K. Denis, and Sarin Atulya. 1994. The information content of dividend changes: Cash flow signaling, overinvestment, and dividend clientele. Journal of Financial and Quantitative Analysis 29: 567–87. [Google Scholar] [CrossRef]
- Dielman, Terry E., and Henry R. Oppenheimer. 1984. An examination of investor behavior during periods of large dividend changes. Journal of Financial and Quantitative Analysis 19: 197–216. [Google Scholar] [CrossRef]
- Divecha, Arjun, and Dale Morse. 1983. Market responses to dividend increases and changes in payout ratios. The Journal of Financial and Quantitative Analysis 18: 163–73. [Google Scholar] [CrossRef]
- Ellahie, Atif, and Zachary Kaplan. 2021. Show me the money! Dividend policy in countries with weak institutions. Journal of Accounting Research 59: 613–55. [Google Scholar] [CrossRef]
- Fama, Eugene F., and Kenneth R. French. 2001. Disappearing dividends: Changing firm characteristics or lower propensity to pay? Journal of Financial Economics 60: 3–43. [Google Scholar] [CrossRef]
- Farago, Adam, and Roméo Tédongap. 2018. Downside risks and the cross-section of asset returns. Journal of Financial Economics 129: 69–86. [Google Scholar] [CrossRef]
- Floros, Christos, Konstantinos Gkillas, Christoforos Konstantatos, and Athanasios Tsagkanos. 2020. Realized measures to explain volatility changes over time. Journal of Risk Financial Management 13: 125–44. [Google Scholar] [CrossRef]
- Ghosh, Chinmoy, and J. Randall Woolridge. 1988. An analysis of shareholder reaction to dividend cuts and omissions. Journal of Financial Research 11: 281–94. [Google Scholar] [CrossRef]
- Gul, Faruk. 1991. Theory of disappointment aversion. Econometrica 59: 667–86. [Google Scholar] [CrossRef]
- Kim, Jeong-Bon, Yinghua Li, and Liangdong Zhang. 2011. CFOs versus CEOs: Equity incentives and crashes. Journal of Financial Economics 101: 713–30. [Google Scholar] [CrossRef]
- Kraiger, Nicholas, and Warwick Anderson. 2020. Characteristics of New Zealand dividend omissions and resumptions. Managerial Finance 46: 40–55. [Google Scholar] [CrossRef]
- Krieger, Kevin, Nathan Mauck, and Stephen W. Pruitt. 2020. The impact of the COVID-19 pandemic on dividends. Finance Research Letters 42: 101910. [Google Scholar] [CrossRef]
- Lie, Erik. 2005. Operating performance following dividend decreases and omissions. Journal of Corporate Finance 12: 27–53. [Google Scholar] [CrossRef]
- Lintner, John. 1962. Dividends, earnings, leverage, stock prices and the supply of capital to corporations. Review of Economics and Statistics 44: 243–69. [Google Scholar] [CrossRef]
- McFadden, Daniel. 1979. Quantitative methods for analysing travel behaviour of individuals: Some recent developments. In Behavioural Travel Modelling. Edited by D. A. Hensher and P. R. Stopher. London: Croom Helm, pp. 279–318. [Google Scholar]
- Meznar, Martin B., Douglas Nigh, and Chuck C. Y. Kwok. 1998. Announcements of withdrawal from South Africa revisited: Making sense of contradictory event study findings. Academy of Management Journal 41: 715–30. [Google Scholar] [CrossRef]
- Nissim, Doron, and Amir Ziv. 2001. Dividend changes and future profitability. Journal of Finance 56: 2111–33. [Google Scholar] [CrossRef]
- Pettit, R. Rchardson. 1977. Taxes, transactions costs and the clientele effect of dividends. Journal of Financial Economics 5: 419–36. [Google Scholar] [CrossRef]
- Ramelli, Stefano, and Alexander F. Wagner. 2020. Feverish stock price reactions to COVID-19. Review of Corporate Finance Studies 9: 622–55. [Google Scholar] [CrossRef]
- Tsagkanos, Athanasios, Konstantinos Gkillas, Christoforos Konstantatos, and Christos Floros. 2021. Does volume drive systemic banks’ stock return volatility? Lessons from the Greek banking system. International Journal of Financial Studies 24: 1–13. [Google Scholar] [CrossRef]
- Xu, Xixiong, Cuiliang Lin, and Youliang Yan. 2021. Covid-19 crisis and corporate cash dividend policies: Evidence from Chinese listed companies. Applied Economics Letters 28: 1–7. [Google Scholar] [CrossRef]
- Zheng, Michael. 2021. Is cash the panacea of the COVID-19 pandemic: Evidence from corporate performance. Finance Research Letters 45: 102151. [Google Scholar] [CrossRef]
Disclaimer/Publisher’s Note: The statements, opinions and data contained in all publications are solely those of the individual author(s) and contributor(s) and not of MDPI and/or the editor(s). MDPI and/or the editor(s) disclaim responsibility for any injury to people or property resulting from any ideas, methods, instructions or products referred to in the content. |
© 2023 by the authors. Licensee MDPI, Basel, Switzerland. This article is an open access article distributed under the terms and conditions of the Creative Commons Attribution (CC BY) license (https://creativecommons.org/licenses/by/4.0/).