Article

The Impact of Non-Interest Income on the Performance of Commercial Banks in the ASEAN Region

1
Faculty of Finance and Accountancy, Ho Chi Minh University of Food Industry, No. 140 Le Trong Tan Street, Tay Thanh Ward, Tan Binh District, Ho Chi Minh City 700000, Vietnam
2
Faculty of Finance and Banking, Van Lang University, 69/68 Dang Thuy Tram Street, Ward 13, Binh Thanh District, Ho Chi Minh City 700000, Vietnam
3
Institute for Research Science and Banking Technology, Ho Chi Minh University of Banking, No. 36 Ton That Dam Street, Nguyen Thai Binh Ward, District 1, Ho Chi Minh City 700000, Vietnam
4
Faculty of Economy and Law, Tien Giang University, No. 119 Ap Bac Street, Ward 5, My Tho City 860000, Vietnam
*
Author to whom correspondence should be addressed.
J. Risk Financial Manag. 2023, 16(1), 18; https://doi.org/10.3390/jrfm16010018
Submission received: 23 November 2022 / Revised: 18 December 2022 / Accepted: 21 December 2022 / Published: 28 December 2022
(This article belongs to the Special Issue Interdisciplinary Empirical Research in Financial Econometrics)

Abstract

:
This study investigates how non-interest income affects the performance of commercial banks in the ASEAN region. Using data from 36 commercial banks in ASEAN countries from 2008 to 2020 and Bayesian analysis techniques, the results of this study indicate that non-interest income negatively affects commercial banks’ performance in the ASEAN region. In addition, the quantile regression results demonstrated that non-interest income negatively affects commercial banks’ performance in the ASEAN region at all three percentiles (25th, 50th, and 75th). Additionally, we identified a non-interest income threshold of 59.3 percent of total income for commercial banks in the ASEAN region. In light of banking competition and the necessity for commercial banks to diversify their income streams, we offer a variety of policy implications to increase the performance of commercial banks.

1. Introduction

In recent years, the global banking business has experienced substantial shifts in technology, the competitive landscape, client demands, and governmental fiscal policies. These are the causes for the continual evolution of nontraditional goods and services. Since then, in addition to income from traditional activities such as loan activities, non-traditional businesses such as service fees, commissions, and trading securities have provided commercial banks with non-interest income. Numerous studies have examined the relationship between non-interest revenue and the performance of commercial banks to determine whether this type of income diversification aids in the growth of commercial banks.
Numerous studies have examined how non-interest income affects the profitability of commercial banks. The association between non-interest revenue and the performance of banks has not, however, been established with consistency in prior studies. Theoretically, raising the non-interest income ratio through income diversification can produce more consistent operational income for banks, hence enhancing their performance (Chiorazzo et al. 2008; Nguyen et al. 2018). Both Meslier et al. (2014) and Pennathur et al. (2012) imply that increasing non-interest income results in improved bank performance, particularly for large banks. Recent empirical studies, however, do not fully support this viewpoint, such as Jaffar et al. (2014), Lee et al. (2014), Maudos (2017), Senyo et al. (2015), Sun et al. (2017), and Williams (2016), who all contend that non-interest income increases commercial banks’ exposure to risk. In addition, these studies demonstrate that non-interest activities make it challenging for banks to raise their revenues.
Thus, it is evident that the effect of non-interest income on the performance of banks might vary based on national conditions and the evolution of the financial system. This is the first research gap that needs to be filled. Specifically, results from developed nations may not be applicable to emerging nations. Therefore, this study was done to provide more in-depth evidence regarding the effect of non-interest income on the performance of banks in the ASEAN countries, an area with emerging economies. This research will result in the correct results for ASEAN nations. This will aid policymakers and bank managers in developing the appropriate plans to enhance the banks’ performance.
The second research gap comes from the method of inferring the results of previous studies. Specifically, the p-value of the coefficient in the model is frequently employed in prior studies to draw conclusions regarding the research hypotheses. Utilizing p-values to test a hypothesis has been criticized for decades (Wasserstein and Lazar 2016). This argument is based on the fact that the p-value is a conditional probability that reflects the likelihood that the data will occur if the null hypothesis is found to be true. In other words, the p-value does not provide any information on the probability that the hypothesis would occur. In this study, we endeavor to provide a hypothetical inference approach based on Bayesian analysis. Bayesian analysis is superior to the p-value since it demonstrates the probability that the null hypothesis will be true.
Although there have been numerous studies on the impact of non-interest income on banks’ performance, these studies do not indicate a non-interest income threshold. Therefore, in this study, we employed a threshold regression model for panel data which is suggested by Hansen (1999), to identify the thresholds and determine how non-interest income influences the performance of banks in the ASEAN region based on these thresholds.
Following the introduction, the theory and research hypotheses are presented in Section 2. In Section 3, the data and research techniques are provided. In Section 4, the experimental results are provided. Section 5 concludes the study with conclusions and policy implications.

2. Literature Review and Hypothesis Development

The effect of non-interest income on the performance of banks has been the subject of numerous previous studies. Pennathur et al. (2012) found in a study of 203 Indian banks conducted between 2000 and 2009 that the growth in non-interest income decreased the profit volatility of Indian banks. This result suggests that the performance of Indian banks has improved due to the increase in non-interest income. In accordance with the findings of Pennathur et al. (2012), Meslier et al. (2014) found that a growth in non-interest income boosted the profitability of banks.
According to another study, non-interest income has a negligible effect on the profitability of commercial banks and is even inversely connected with operational efficiency. In particular, the studies by Smith et al. (2003), Lee et al. (2014), Antao and Karnik (2022), and Kim et al. (2020) indicate that non-interest revenue cannot improve the performance of commercial banks. According to research on the U.S. banking system, the shift to non-interest income has not increased risk-adjusted returns. As U.S. banks transition from single to mixed industries, the shift also becomes more pronounced, depriving banks of the margins that result from income diversification, according to Hirtle and Stiroh (2007). In addition, a number of studies (Mercieca et al. 2007; Sun et al. 2017) indicate that variations in non-interest income might have a negative impact on the profitability of commercial banks.
Regarding the importance of non-interest income in influencing the performance of banks in Asia, Lee et al. (2014) claim that non-interest operations lower profitability and raise the risk for savings banks but may have the reverse effect for investment banks and other types of banks. Moreover, according to Salike and Ao (2017), the profitability of banks is controlled by internal and external factors, as well as by income diversification (which depends on non-interest income). In a study of commercial banks in China, Sun et al. (2017) found that commercial banks’ non-interest income has increased in recent years due to intense competition in the banking industry. According to the findings of Sun et al. (2017), there is an adverse relationship between non-interest income and performance of commercial banks in China.
In addition to the findings of Sun et al. (2017), the detrimental effect of non-interest income on the performance of commercial banks is also described in earlier studies. The portfolio theory provides some explanations for the impact of non-interest income on the performance of commercial banks; larger reliance on non-interest income is associated with greater return volatility. Stiroh and Rumble (2006), Calmès and Liu (2009), Jaffar et al. (2014), and Senyo et al. (2015) have reached comparable outcomes. A larger reliance on non-interest income by banks is related to increased systemic risk. Non-interest income swings more than interest income, both from the standpoint of the banking system as a whole and of individual banks, as shown by these studies. DeYoung and Roland (2001) presented three explanations for the volatility of bank profits induced by non-interest income. First, the cost of switching to non-interest banking services is significantly less than the cost of interest-bearing traditional banking services. Consequently, the volatility of non-interest income is substantial and has a detrimental effect on the profitability of commercial banks. To provide non-interest banking services, banks must invest in greater fixed assets than those utilized for interest-based banking services. Therefore, the bank’s initial cost of non-interest services is rather substantial. All of these variables result in variations in commercial banks’ non-interest income, which raises their exposure to risk.
Based on the aforementioned arguments and the Asian studies of Lee et al. (2014) and Sun et al. (2017), we propose that the impact of non-interest income on the performance of commercial banks will vary depending on the development conditions and management capacity of the banking sector in each region.
Specifically, the effects of this impact in Asia differ from those observed in Western nations. Therefore, the purpose of this study is to reexamine the impact of non-interest revenue on the performance of non-interest income for commercial banks in the ASEAN region. We anticipate obtaining results similar to those of Lee et al. (2014) and Sun et al. (2017). The following is the proposed research hypothesis:
Hypothesis 1 (H1).
Increasing non-interest income will negatively affect banks’ performance.
Despite finding evidence of a detrimental effect of non-interest revenue on the performance of commercial banks, Sun et al. (2017) also identified various non-interest income levels. In particular, Sun et al. (2017) state that the effect of non-interest income on the performance of commercial banks will vary based on the ratio of non-interest income to total income. Therefore, in this study, we intend to establish a threshold for non-interest income.
Hypothesis 2 (H2).
There exists a threshold at which the influence of non-interest income on the performance of commercial banks changes.

3. Methodology

3.1. Empirical Model

To investigate the impact of non-interest income on the performance of commercial banks, we developed an empirical model based on research hypotheses and related studies by Lee et al. (2014), Sun et al. (2017), Jaffar et al. (2014), and Senyo et al. (2015). The specific model is as follows:
P B i t = α + β N I I i t + γ C O N T R O L i t + ε i t
In which P B i t is the dependent variable with representative variables ROA, ROE, SD_ROA, and SD_ROE of bank i in year t; N I I i t is the independent variable of non-interest income on total income of bank i in year t; C O N T R O L i t is the control variable for the collection of internal factors of the bank such as the capital structure of the bank, the size of the bank, the ratio of non-performing loans affecting the performance of bank i in year t; α is the intercept coefficient; β and γ are estimated parameters; ε is the random error. The details of these variables are described in Table 1.
To determine the threshold effect in the model of the impact of non-interest income on the performance of commercial banks, we build the model in the form of the non-interest income threshold as follows:
P B i t = { β 0 + β 1 N I I i t + β 2 C O N T R O L i t + ε i t ,   if   N I I i t < ρ β 0 + β 1 N I I i t + β 2 C O N T R O L i t + ε i t ,   if     N I I i t ρ
where ρ is defined as the non-interest income threshold.
The determination of the ASEAN region’s commercial banks’ non-interest income threshold is required to assess the impact of non-interest income on the performance of the region’s commercial banks before and after the threshold.

3.2. Estimation Method

First, model (1) is estimated by us using the fixed effects method. Fixed effects include both cross-sectional and time. We then use the results of the regression coefficients and their corresponding standard errors to construct prior distributions for these regression coefficients in Bayesian analysis. Bayesian analysis is inferred from the posterior distributions of coefficients in the model. From the posterior distributions of coefficients in the model, Bayesian analysis reveals the probability of a hypothetical occurrence. A posterior distribution is generated by combining a likelihood function with a prior distribution.
p o s t e r i o r   d i s t r i b u t i o n a   l i k e l i h o o d   f u n c t i o n × a   p r i o r   d i s t r i b u t i o n
Posterior distributions are generated from Markov chains (Markov chain Monte Carlo, or MCMC) with well-known sampling methods such as Metropolis–Hastings and Gibbs. In this study, we used the Metropolis–Hastings sampling technique with an MCMC sample size of 12,500. However, one problem with Bayesian analysis is that the prior distributions of the coefficients in the model must be reasonably defined. Additionally, MCMC must achieve convergence. For the first problem, we use the fixed effects method to find information about the prior distributions for the coefficients of the model. In particular, the prior distribution that will be used is the normal distribution with parameters received from the fixed effects method. For the second problem, we use Trace plots, Autocorrelation plots, Histograms, and Density plots to draw conclusions about the convergence of MCMCs.
To estimate model (2) to identify non-interest income thresholds and assess the impact of non-interest income on the performance of commercial banks in the ASEAN region in proportion to these thresholds, we use the threshold regression proposed by Hansen (1999).

3.3. Data

The study used both bank-level and national-level microdata for the ASEAN region for the period 2008–2020. The study was conducted with data on 36 commercial banks in ASEAN countries, including Indonesia, Malaysia, the Philippines, Singapore, Thailand, and Vietnam. The data collected from the Thomson Reuters database includes both bank-level and national-level microdata for the ASEAN region for the period 2008–2020. We chose to carry out the study in these six countries on the basis of the similarity in the size of the economies, as well as the stance of monetary policy, and the structure of the commercial banking system. This selection eliminates outliers and other biases from the data. The commercial banks and the study period were selected on the basis of data availability.
The statistical results describing the variables in the models are presented in Table 2 below. The return-on-equity (ROE) is between 0.3% and 35.9%, with an average of 12.3%. The return-on-assets (ROA) varies between 0.2% and 21.6%, with an average of 2.2%. The NII ranged from 0.6% to 97.2%, with a mean of 64.5% and a standard deviation of 22.9%. Table 2 also reports the descriptive statistics of the control variables for bank characteristics. Specifically, the non-performing loan to outstanding balance (NPL) ratio ranges from 0% to 12.5%, with a mean of 2.5% and a standard deviation of 4.1%. The equity-to-assets (ETA) ratio varies from 4% to 25.8%, with a mean of 10.7% and a standard deviation of 3.9%. The bank size (SIZE) varies from 13.38 to 28.05, with a mean of 22.47 and a standard deviation of 3.79.

4. Empirical Result and Discussion

4.1. Correlation Matrix

Table 3 reports the results of the correlation coefficient analysis among the variables in the model. The results show that the independent variables have a low correlation with each other. This implies that the model does not have multicollinearity among the independent variables. Additionally, NII is negatively correlated with ROA and ROE. This result implies that non-interest income has a negative impact on the performance of commercial banks in the ASEAN.

4.2. Results of Model Estimation by Fixed Effects Method

Table 4 reports the results of the impact of non-interest income on the performance of commercial banks in the ASEAN region using the fixed effects method. While the first two columns in Table 4 are the results of parameter estimation and standard error in the model with the dependent variable ROE, the following two columns are the results of parameter estimation and standard error in the model with the dependent variable risk-adjusted ROE (SD_ROE). Columns (5) and (6) are, respectively, the results of parameter estimation and standard error in the model with the dependent variable ROA; columns (7) and (8) are the results of parameter estimation and standard error in the model with the dependent variable risk-adjusted ROA (SD_ROA).
The results in Table 4 show that the coefficient corresponding to the NII has a value of −0.008 and is statistically significant at 1%. As such, NII has a negative impact on ROE. This implies that non-interest income has a negative impact on the performance of the ASEAN commercial banks. This study’s results are consistent with those conducted by Lee et al. (2014), Sun et al. (2017), Jaffar et al. (2014), and Senyo et al. (2015). Similarly for the dependent variable SD_ROE, the coefficient corresponding to NII has a value of −0.217 and is statistically significant at 1%. As such, NII has a negative impact on risk-adjusted ROE (SD_ROE). The results of the model estimation with the dependent variable ROA show that the regression coefficient corresponding to NII is not statistically significant. Thus, NII has no impact on ROA. However, for the dependent variable SD_ROA, the regression coefficient corresponding to the NII variable has a value of −0.130 and is statistically significant at the 1% level. This implies that non-interest income has a negative impact on the performance of the ASEAN commercial banks. The results of this study are also consistent with those carried out by Lee et al. (2014), Sun et al. (2017), Jaffar et al. (2014), and Senyo et al. (2015).

4.3. Results of Model Estimation by Bayesian Method

  • Determination of the prior distribution
Based on the model estimates in Table 4, we identified prior distributions of the coefficients in the models assessing the impact of non-interest income on the performance of commercial banks in the ASEAN region as determined by the normal distribution as follows:
The model with the dependent variable ROE will have the following prior distributions of the coefficients: β L . R O E ~ N o r m a l ( 0.477 ,   0.042 × 0.042 ) , β N I I ~ N o r m a l ( 0.008 ,   0.002 × 0.002 ) , β N P L ~ N o r m a l ( 0.013 ,   0.047 × 0.047 ) , β E T A ~ N o r m a l ( 0.441 ,   0.114 × 0.114 ) , β S I Z E ~ N o r m a l ( 0.017 ,   0.004 × 0.004 ) , and β C O N S ~ N o r m a l ( 0.502 ,   0.100 × 0.100 ) .
The model with the dependent variable SD_ROE will have the following prior distributions of the coefficients: β L . S D _ R O E ~ N o r m a l ( 0.408 ,   0.044 × 0.044 ) , β N I I ~ N o r m a l ( 0.217 ,   0.054 × 0.054 ) , β N P L ~ N o r m a l ( 0.344 ,   1.023 × 1.023 ) , β E T A ~ N o r m a l ( 10.421 ,   2.487 × 2.487 ) , β S I Z E ~ N o r m a l ( 0.432 ,   0.097 × 0.097 ) , and β C O N S ~ N o r m a l ( 13.137 ,   2.172 × 2.172 ) .
The model with the dependent variable ROA will have the following prior distributions of the coefficients: β L . R O A ~ N o r m a l ( 0.551 ,   0.038 × 0.038 ) , β N I I ~ N o r m a l ( 0.001 ,   0.001 × 0.001 ) , β N P L ~ N o r m a l ( 0.002 ,   0.015 × 0.015 ) , β E T A ~ N o r m a l ( 0.009 ,   0.035 × 0.035 ) , β S I Z E ~ N o r m a l ( 0.002 ,   0.001 × 0.001 ) , and β C O N S ~ N o r m a l ( 0.062 ,   0.032 × 0.032 ) .
The model with the dependent variable SD_ROA will have the following prior distributions of the coefficients: β L . S D _ R O A ~ N o r m a l ( 0.380 ,   0.049 × 0.049 ) , β N I I ~ N o r m a l ( 0.130 ,   0.059 × 0.059 ) , β N P L ~ N o r m a l ( 1.005 ,   1.144 × 1.144 ) , β E T A ~ N o r m a l ( 7.476 ,   2.713 × 2.713 ) , β S I Z E ~ N o r m a l ( 0.069 ,   0.111 × 0.111 ) , and β C O N S ~ N o r m a l ( 3.821 ,   2.430 × 2.430 ) .
  • Bayesian model estimation results with ROE-dependent variable
The results of estimating the impact of non-interest income on the performance of commercial banks in the ASEAN region with dependent variables ROE and SD_ROE are presented in Table 5.
In this study, we created posterior distributions using the Metropolis–Hastings sampling technique. Our preferred MCMC size is 12,500, with a burn-in stage of 2500. In the model with the ROE-dependent variable, Table 5 shows the posterior mean of the coefficients corresponding to L.ROE, NII, NPL, ETA, and SIZE of 0.533, −0.009, −0.017, −0.338, and −0.001, respectively. Unlike frequency analysis using the 95% confidence interval, Bayesian analysis uses the 95% credible interval. Table 5 shows that the 95% credible interval of the coefficients corresponding to NII and ETA has an upper bound of less than 0, so NII and ETA have a negative impact on ROE. Meanwhile, the 95% credible interval of the coefficient corresponding to L.ROE has a lower bound greater than 0, so L.ROE has a positive effect on ROE. In addition, the 95% credible interval of the coefficients corresponding to NPL and SIZE vary from the negative domain to the positive domain, so NPL and SIZE have an unclear impact on ROE.
In the model with SD_ROE as a dependent variable, Table 5 shows the posterior mean of the coefficients corresponding to L.SD_ROE, NII, NPL, ETA, and SIZE are 0.555, −0.222, −0.342, −6.796, and −0.122, respectively. Table 5 also shows that the 95% credible interval of the coefficients corresponding to NII has an upper bound of less than 0, so NII has a negative impact on SD_ROE. We also found the negative impact of ETA and SIZE on SD_ROE. Additionally, L.SD_ROE has a positive effect on SD_ROE. Finally, NPL has an unclear impact on SD_ROE.
To better determine the likelihood of a positive or negative impact of variables on ROE and SD_ROE, we calculated the probability of each coefficient. The results are presented in Table 6.
In the model with ROE as the dependent variable, the results in Table 6 show that the probability that the coefficient corresponding to NII has a negative value is 100%, so non-interest income has a negative impact on banks’ performance. This means that the probability of hypothesis H1 occurring is 100%.
Furthermore, the result shows that the probability that the coefficient corresponding to L.ROE has a positive value is 100%, so the previous profitability has a positive impact on the current profitability. With a 100% probability of occurrence, equity-to-assets has a negative impact on the current profitability. Non-performing loan ratios and bank size both have a negative impact on the current profitability, with 63% and 62.5% probabilities, respectively. These results are in line with the results obtained by Lee et al. (2014), Sun et al. (2017), Jaffar et al. (2014), and Senyo et al. (2015). The results in Table 6 also show that the probability that the coefficient corresponding to NII has a negative value is 100% in the model with the dependent variable SD_ROE, indicating that non-interest income has a negative impact on commercial bank performance as reflected in SD_ROE. This also implies that the H1 hypothesis has a 100% chance of being correct. This result is also the same as a result from the model with ROE as the dependent variable. Thus, the results show that when banks depend more on non-interest income, the performance of these banks decreases. This result is consistent with the actual operation of banks in the region. Specifically, banks in the ASEAN region often have relatively high lending rates and a high proportion of interest income in total income. Therefore, the conversion of operations to non-interest income will reduce income and create higher costs for banks in this area.
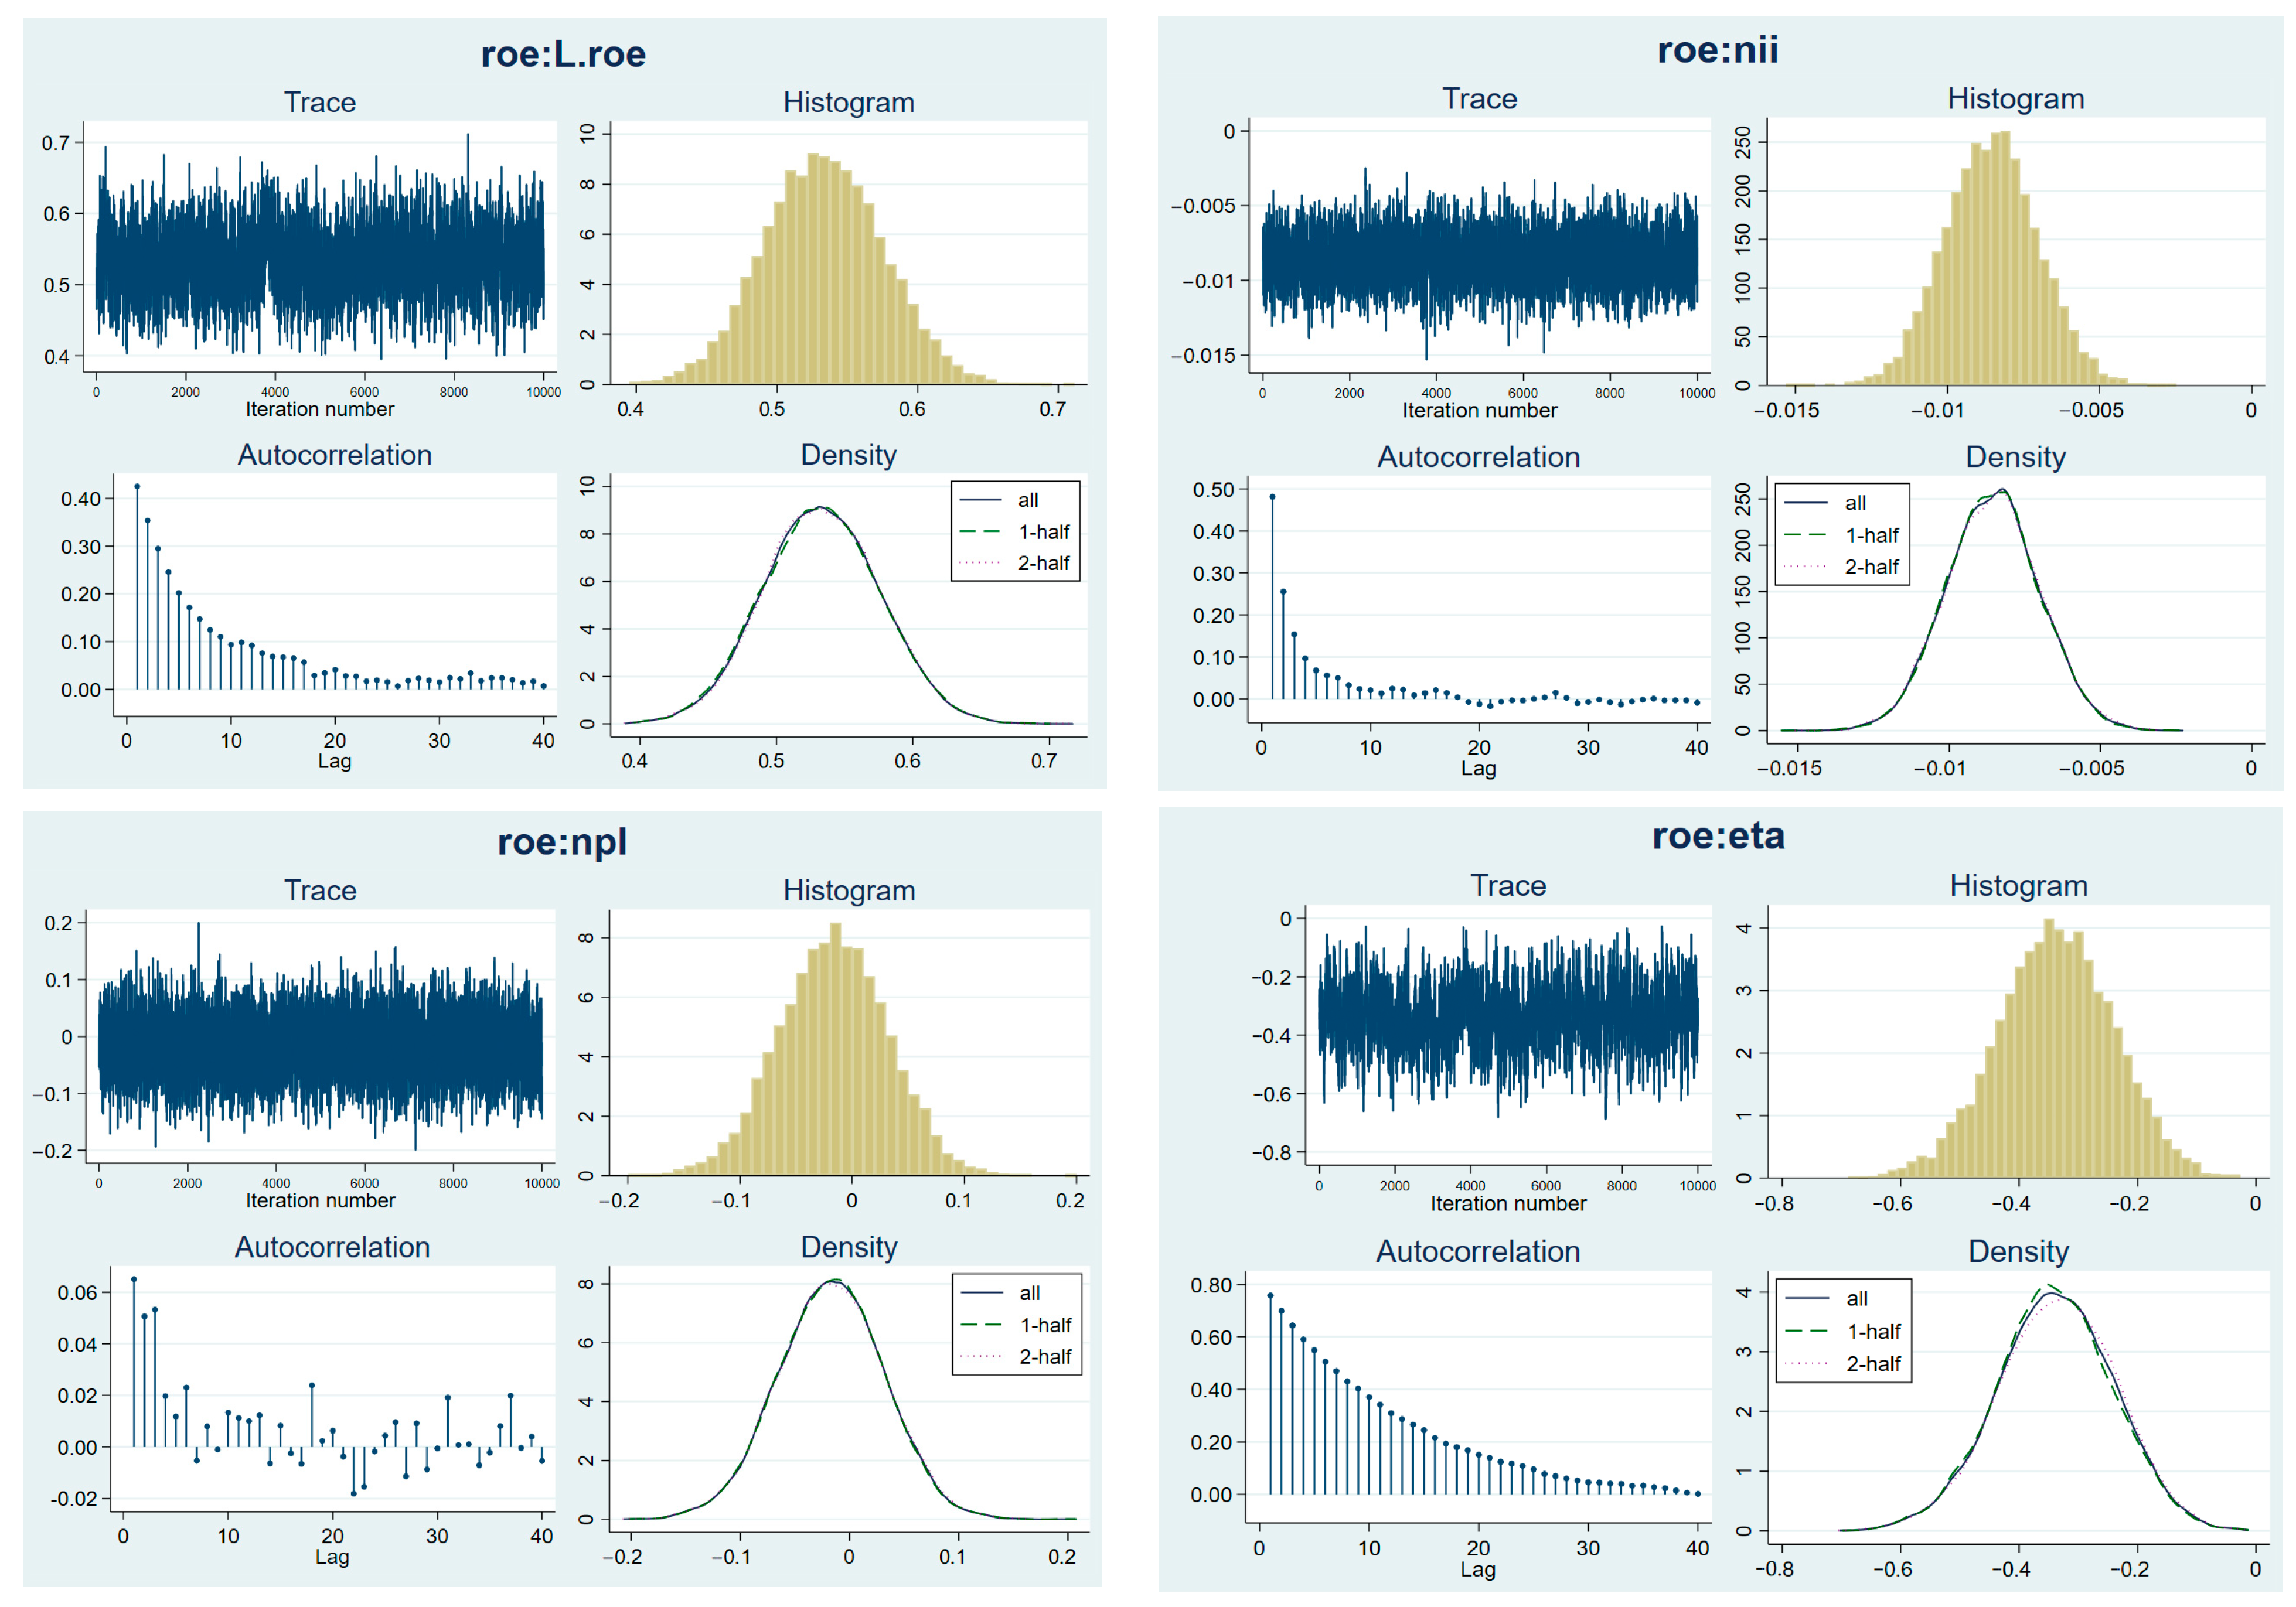
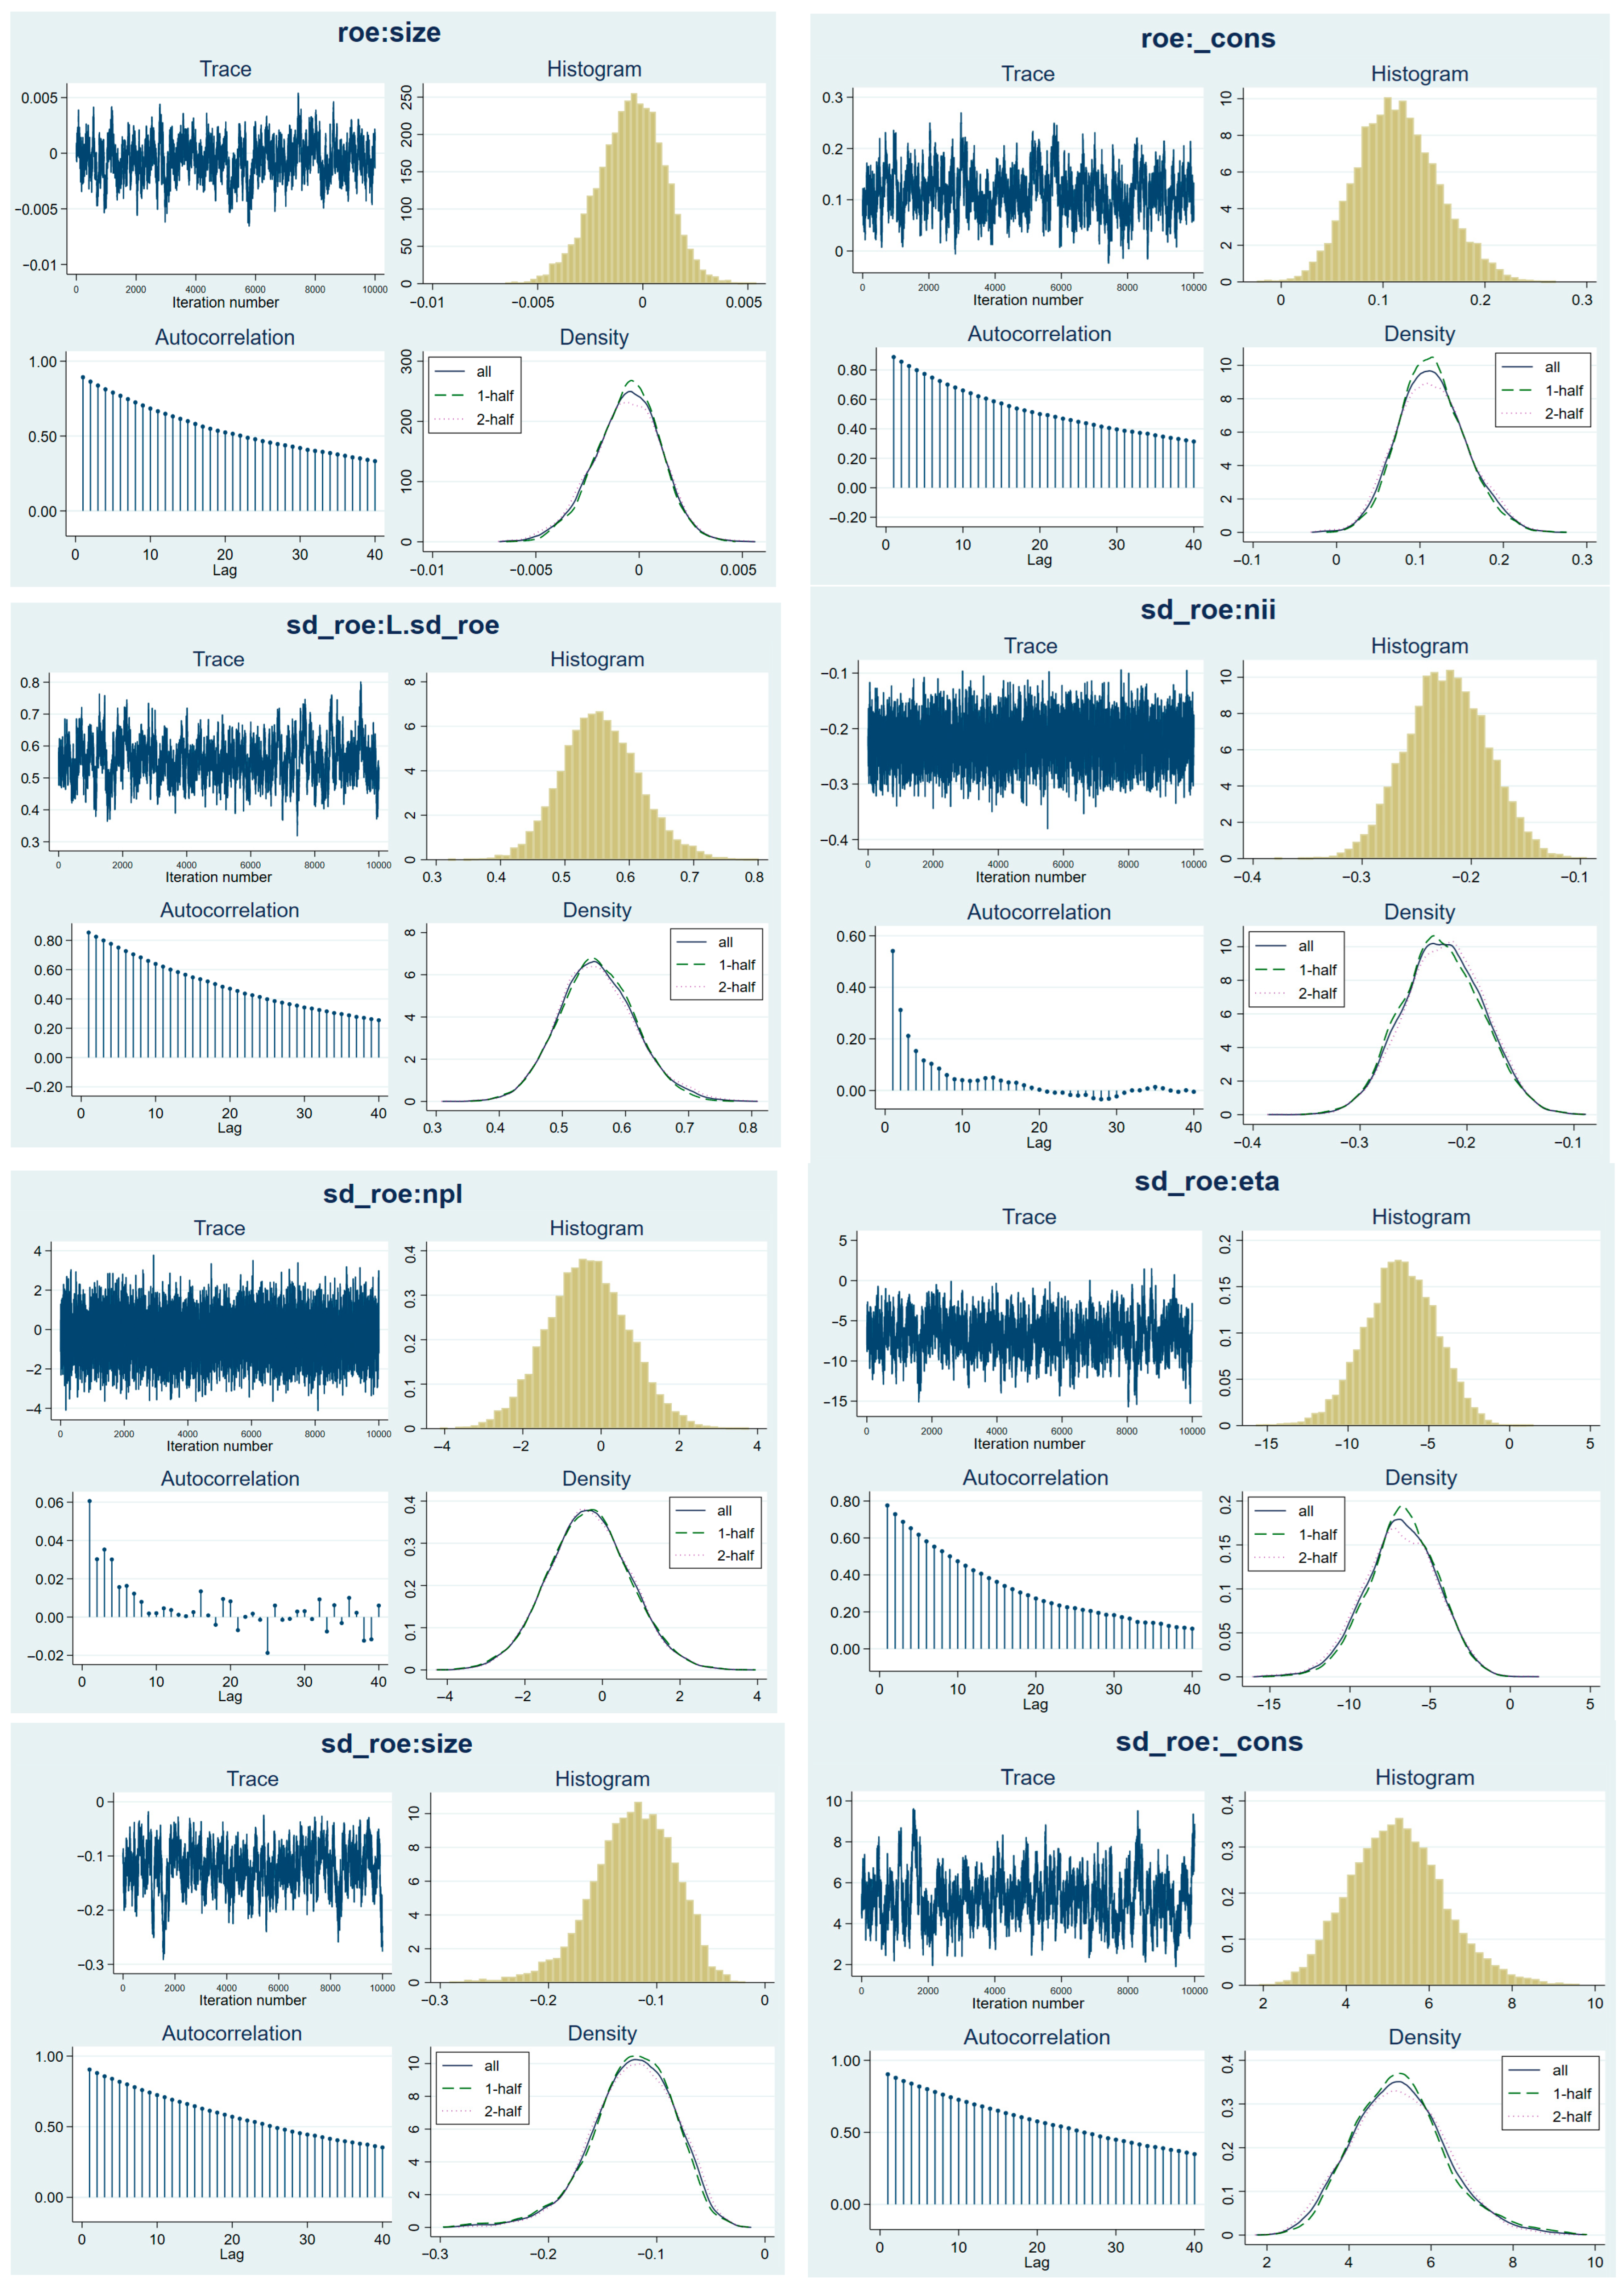
The results of the convergence test of MCMCs are performed for each coefficient in the model. Figure 1 shows that the MCMCs corresponding to the coefficients in the model all show convergence. Specifically, the Trace plots demonstrate that the MCMC is not trending, with estimates of the values thickly distributed into a horizontal line oscillating around the mean of the regression coefficients. The Autocorrelation plots illustrate that the correlation is approaching zero. The Histograms of MCMCs follow the normal distribution. The Density plots of 1 half, 2 halves, and all MCMC are the same shape.
  • Model estimation results using the Bayesian method with SD_ROA-dependent variable
The results of estimating the impact of non-interest income on the performance of commercial banks in the ASEAN region with dependent variable SD_ROA are presented in Table 7.
Table 7 shows the posterior mean of the coefficients corresponding to L.SD_ROA, NII, NPL, ETA, and SIZE, which are 0.932, −0.124, −0.067, −0.439, and 0.000, respectively. Table 7 also shows that the 95% credible interval of the coefficient corresponding to NII has an upper bound of less than 0, so NII negatively impacts SD_ROA. Additionally, L.SD_ROA has a positive impact on SD_ROA. NPL, ETA, and SIZE all have an unclear impact on SD_ROA.
The probability that the coefficient corresponding to the variables in the model is positive or negative is presented in the table below.
The results in Table 8 also show that the probability of the coefficient corresponding to NII has a negative value is 100%, so that non-interest income negatively impacts commercial banks’ performance is reflected in SD_ROA. This also implies that the probability of the H1 hypothesis occurring is 100%. This result also converges with the results obtained from models with dependent variables ROE and SD_ROE.
The results of the convergence test of MCMCs are performed for each coefficient in the model with SD_ROA as a dependent variable. Figure 2 shows that the MCMCs corresponding to the coefficients in the model all show convergence. Specifically, the Trace plots demonstrate that the MCMC is not trending, with estimates of the values thickly distributed into a horizontal line oscillating around the mean of the regression coefficients. The Autocorrelation plots illustrate that the correlation is approaching zero. The Histograms of MCMCs follow the normal distribution. The Density plots of 1 half, 2 halves, and all MCMC are the same shape.
To ensure the study results are convergent, we continue to use the quantile regression to assess the impact of non-interest income on the performance of commercial banks according to the 25th, 50th, and 75th percentiles. We perform the quantile regression with models whose dependent variables are ROE and SD_ROE. The results are presented in the table below.
Table 9 shows that in the model with the dependent variable ROE, at all 25th, 50th, and 75th percentiles, the coefficients corresponding to NII are valued negatively and statistically significant at 1%. Thus, NII has a negative impact on ROE. Similarly, in the model with the dependent variable SD_ROE, at all 25th, 50th, and 75th percentiles, the coefficients corresponding to NII have negative values and are statistically significant at 1%. Thus, NII has a negative impact on SD_ROE. In summary, the quantile regression result is convergent with the results obtained earlier.
4.4. Results of Determining the Threshold of Non-Interest Income

To test the existence of the threshold effect, the bootstrapping method was performed 700 times to give the p-value of the threshold effect test of 0.000, which is less than 1% significance. Therefore, there exists a threshold effect of non-interest income.
We also use the bootstrap method with 300 sampling times for each test with two thresholds or three thresholds. Table 10 shows that the p-value of the test corresponding to the model with two thresholds of 0.2467 is greater than the 10% significance level. Additionally, the p-value corresponding to the model with three thresholds of 0.83 is greater than the 10% significance level. Thus, there exists only one threshold of non-interest income, and this threshold value is 0.593, which is the non-interest income threshold at 59.3% of the total income of commercial banks (see Figure 3).
The results of estimating the impact of non-interest income on the performance of commercial banks show that non-interest income has a negative impact on banks’ performance as expressed through ROA, ROE, and SD_ROA. However, according to the estimates in Table 11, if non-interest income is maintained below the threshold of 59.3% of total income, non-interest income will positively impact commercial banks’ performance in the ASEAN region. If this threshold is crossed, non-interest income has a negative impact on the performance of commercial banks in the ASEAN region.

5. Conclusions and Policy Recommendations

Our study demonstrates using the fixed effects method, the Bayesian method, that non-interest income has a detrimental effect on the performance of commercial banks in the ASEAN region. In addition, the results of the quantile regression demonstrated that non-interest income has a negative effect on the performance of commercial banks in the ASEAN region at all three percentiles (25th, 50th, and 75th). Moreover, we identified a non-interest income requirement of 59.3 percent of the total income of commercial banks in the ASEAN region. Non-interest income will have a positive impact on the performance of commercial banks in the ASEAN region if it is maintained below the threshold of 59.3% of total income. If this level is exceeded, the impact of non-interest income on the performance of commercial banks in the ASEAN region is negative.
Based on the findings, we propose a number of policy implications for enhancing the performance of commercial banks. Financial institutions and banks must diversify their revenue sources.
First, study results in developing nations are distinct from those in developed nations. In particular, non-interest income has a detrimental effect on the performance of commercial banks in the ASEAN region. However, diversification is unavoidable in the current banking competition environment. Therefore, commercial banks in the region must immediately grasp the new needs of the market in order to provide products and services in line with the current trends and avoid offering an excessive number of utility products so as not to cause major fluctuations in non-interest income. To do this, commercial banks should establish a distinct market research department, conduct frequent efficiency checks and evaluations, enhance service quality, and eliminate obsolete products and services. Modern technology must be combined with new products to expedite customer access to information and increase utility, thereby reducing the bank’s operating expenses. In addition, commercial banks in the region must diversify products in depth, capitalize on the added value of their goods, enhance their capacity to link and integrate products and services to maximize client benefits, and differentiate themselves from the competition.
The study’s results also indicate that maintaining non-interest income below 59.3 percent of total income will assist commercial banks in enhancing their performance. Therefore, banks should have specific strategies for income diversification. Too much income diversity will not yield beneficial consequences for banking operations. To reverse a negative trend caused by traditional operations, banks must increase the proportion of non-interest income to overall income. Banks should also have a suitable proportion of each type of non-interest income, such as income from services, foreign exchange trading, securities trading, etc., in order to take appropriate action.
Finally, although the research objective was achieved, we realize that this study still has some limitations. Specifically, the research model can theoretically integrate additional control variables. In addition, a larger sample size will produce more convincing research results. Therefore, further studies can add more control variables to the model. At the same time, the increase in sample size will also make further studies more valuable.

Author Contributions

T.T.H.P. conceived the idea and wrote the Introduction. H.A.L. wrote Methodology. A.H.T.P. wrote Literature review and hypothesis development, Empirical result and discussion, Conclusion and policy recommendations. T.B.N.L. revised the manuscript. All authors have read and agreed to the published version of the manuscript.

Funding

The study was supported by The Youth Incubator for Science and Technology Programme, managed by Youth Development Science and Technology Center—Ho Chi Minh Communist Youth Union and Department of Science and Technology of Ho Chi Minh City, the contract number is “12/2021/HĐ-KHCNT-VƯ” signed on 8 December 2021.

Data Availability Statement

Not applicable.

Conflicts of Interest

The authors declare no conflict of interest.

References

  1. Antao, Sherika, and Ajit Karnik. 2022. Bank Performance and Noninterest Income: Evidence from Countries in the Asian Region. Asia-Pacific Financial Markets 29: 477–505. [Google Scholar] [CrossRef]
  2. Calmès, Christian, and Ying Liu. 2009. Financial structure change and banking income: A Canada–U.S. comparison. Journal of International Financial Markets, Institutions and Money 19: 128–39. [Google Scholar] [CrossRef]
  3. Chiorazzo, Vincenzo, Carlo Milani, and Francesca Salvini. 2008. Income Diversification and Bank Performance: Evidence from Italian Banks. Journal of Financial Services Research 33: 181–203. [Google Scholar] [CrossRef]
  4. DeYoung, Robert, and Karin P. Roland. 2001. Product Mix and Earnings Volatility at Commercial Banks: Evidence from a Degree of Total Leverage Model. Journal of Financial Intermediation 10: 54–84. [Google Scholar] [CrossRef]
  5. Hansen, Bruce E. 1999. Threshold effects in non-dynamic panels: Estimation, testing, and inference. Journal of Econometrics 93: 345–68. [Google Scholar] [CrossRef] [Green Version]
  6. Hirtle, Beverly J., and Kevin J. Stiroh. 2007. The return to retail and the performance of US banks. Journal of Banking & Finance 31: 1101–33. [Google Scholar] [CrossRef] [Green Version]
  7. Jaffar, Kalsoom, Kumbirai Mabwe, and Robert Webb. 2014. Changing bank income structure: Evidence from large UK banks? Asian Journal of Finance & Accounting 6: 195–215. [Google Scholar] [CrossRef] [Green Version]
  8. Kim, Hakkon, Jonathan A. Batten, and Doojin Ryu. 2020. Financial crisis, bank diversification, and financial stability: OECD countries. International Review of Economics & Finance 65: 94–104. [Google Scholar] [CrossRef]
  9. Lee, Chien-Chiang, Shih-Jui Yang, and Chi-Hung Chang. 2014. Non-interest income, profitability, and risk in banking industry: A cross-country analysis. The North American Journal of Economics and Finance 27: 48–67. [Google Scholar] [CrossRef]
  10. Maudos, Joaquín. 2017. Income structure, profitability and risk in the European banking sector: The impact of the crisis. Research in International Business and Finance 39: 85–101. [Google Scholar] [CrossRef]
  11. Mercieca, Steve, Klaus Schaeck, and Simon Wolfe. 2007. Small European banks: Benefits from diversification? Journal of Banking & Finance 31: 1975–98. [Google Scholar] [CrossRef]
  12. Meslier, Céline, Ruth Tacneng, and Amine Tarazi. 2014. Is bank income diversification beneficial? Evidence from an emerging economy. Journal of International Financial Markets, Institutions and Money 31: 97–126. [Google Scholar] [CrossRef] [Green Version]
  13. Nguyen, Tuyen L., Anh H. Le, and Dao M. Tran. 2018. Bank Competition and Financial Stability: Empirical Evidence in Vietnam. In Econometrics for Financial Applications. Edited by Ly Hoang Anh, Le Sy Dong, Vladik Kreinovich and Nguyen Ngoc Thach. Berlin/Heidelberg: Springer International Publishing, pp. 584–96. [Google Scholar] [CrossRef]
  14. Pennathur, Anita K., Vijaya Subrahmanyam, and Sharmila Vishwasrao. 2012. Income diversification and risk: Does ownership matter? An empirical examination of Indian banks. Journal of Banking & Finance 36: 2203–15. [Google Scholar] [CrossRef]
  15. Salike, Nimesh, and Biao Ao. 2017. Determinants of bank’s profitability: Role of poor asset quality in Asia. China Finance Review International 8: 216–31. [Google Scholar] [CrossRef]
  16. Senyo, Damankah Basil, Anku-Tsede Olivia, Abubakar Musah, and Eliasu Nuhu. 2015. Income Diversification and Financial Stability of Banks in Ghana. International Journal of Business and Social Science 6: 177–84. [Google Scholar]
  17. Smith, Rosie, Christos Staikouras, and Geoffrey Wood. 2003. Non-interest income and total income stability. In Bank of England Working Papers. No. 198; Bank of England Working Papers. London: Bank of England. Available online: https://ideas.repec.org/p/boe/boeewp/198.html (accessed on 23 October 2022).
  18. Stiroh, Kevin J., and Adrienne Rumble. 2006. The dark side of diversification: The case of US financial holding companies. Journal of Banking & Finance 30: 2131–61. [Google Scholar] [CrossRef]
  19. Sun, Limei, Siqin Wu, Zili Zhu, and Alec Stephenson. 2017. Noninterest Income and Performance of Commercial Banking in China. Scientific Programming 2017: e4803840. [Google Scholar] [CrossRef]
  20. Wasserstein, Ronald L., and Nicole A. Lazar. 2016. The ASA Statement on p-Values: Context, Process, and Purpose. The American Statistician 70: 129–33. [Google Scholar] [CrossRef] [Green Version]
  21. Williams, Barry. 2016. The impact of non-interest income on bank risk in Australia. Journal of Banking & Finance 73: 16–37. [Google Scholar] [CrossRef]
Figure 1. Results of testing the convergence of MCMCs in the model with ROE, SD_ROE as dependent variables.
Jrfm 16 00018 g001aJrfm 16 00018 g001b
Figure 2. Results of testing the convergence of MCMCs in the model with SD_ROA as dependent variable.
Jrfm 16 00018 g002
Figure 3. Non-interest income threshold value.
Jrfm 16 00018 g003
Table 1. Definition of variables.
VariablesMeasurePredicted SignScientific Basis
Variable dependencies
ROEreturn-on-equity Lee et al. (2014), Sun et al. (2017), Jaffar et al. (2014), and Senyo et al. (2015)
ROAreturn-on-assets Lee et al. (2014), Sun et al. (2017), Jaffar et al. (2014), and Senyo et al. (2015)
SD_ROA R O A σ ( R O A ) Risk-adjusted ROA, σ ( R O A ) , which is the standard deviation of ROA for 3 years
SD_ROE R O E σ ( R O E ) Risk-adjusted ROE, σ ( R O E ) , which is the standard deviation of ROE for 3 years
Independent variable
NIINon-interest income/gross income-Lee et al. (2014), Sun et al. (2017), Jaffar et al. (2014), and Senyo et al. (2015)
Control variables
ETAequity-to-assets-Lee et al. (2014), Sun et al. (2017), Jaffar et al. (2014), and Senyo et al. (2015)
SIZEThe natural logarithm of total assets-Lee et al. (2014), Sun et al. (2017), Jaffar et al. (2014), and Senyo et al. (2015)
NPLThe ratio of non-performing loans to total outstanding loans-Lee et al. (2014), Sun et al. (2017), Jaffar et al. (2014), and Senyo et al. (2015)
Table 2. Summary statistics.
VariableObsMeanStd. Dev.MinMax25%50%75%
ROE4550.1230.0620.0030.3590.0880.1160.149
ROA4550.0220.0460.0020.2160.0110.0140.018
NII4550.6450.2290.0060.9720.4810.6830.832
NPL4550.0250.0410.0000.1250.0110.0210.032
ETA4550.1070.0390.0400.2580.0830.1000.123
SIZE45522.4713.79013.37928.04819.28621.60726.090
Table 3. Correlation matrix.
ROEROANIINPLETASIZE
ROE1
ROA0.2511
NII−0.226−0.14991
NPL−0.1528−0.08450.05721
ETA−0.14750.2484−0.10050.19331
SIZE0.27610.1496−0.1039−0.1814−0.21681
Table 4. Impact of non-interest income on banks’ performance.
ROESD_ROEROASD_ROA
Variable(1)(2)(3)(4)(5)(6)(7)(8)
L.ROE0.477 ***0.042
L.SD_ROE 0.408 ***0.044
L.ROA 0.551 ***0.038
L.SD_ROA 0.380 ***0.049
NII−0.008 ***0.002−0.217 ***0.054−0.0010.001−0.130 **0.059
NPL−0.0130.047−0.3441.023−0.0020.015−1.0051.144
ETA−0.441 ***0.114−10.421 ***2.4870.0090.0357.476 ***2.713
SIZE−0.017 ***0.004−0.432 ***0.097−0.0020.001−0.0690.111
_CONS0.502 ***0.10013.137 ***2.1720.062 **0.0323.8212.430
This table reports the results of the impact of non-interest income on the performance of commercial banks in the ASEAN region estimated with the fixed effects method. The dependent variables are ROE, ROA, SD_ROE, and SD_ROA. Columns (1), (3), (5), and (7) are the results of the estimation of the parameters in the models. Columns (2), (4), (6), and (8) are the standard error results in the models. *** is statistically significant at the 1% level. ** is statistically significant at the 5% level.
Table 5. Model estimation results using the Bayesian method with ROE, SD_ROE.
VariableROESD_ROE
MeanEqual-Tailed [95% Cred. Interval]MeanEqual-Tailed [95% Cred. Interval]
L.ROE0.5330.4500.617
L.SD_ROE 0.5550.4420.684
NII−0.009−0.012−0.006−0.222−0.295−0.149
NPL−0.017−0.1130.077−0.342−2.4061.754
ETA−0.338−0.536−0.149−6.796−11.285−2.605
SIZE−0.001−0.0040.002−0.122−0.207−0.057
_CONS0.1150.0390.1995.2403.1647.710
The “Mean” column indicates the mean of the posterior distribution corresponding to the coefficients in the model. The equal-tailed column [95% cred. interval] indicates a 95% credible interval for the coefficients in the model.
Table 6. Probability of regression coefficients.
HypothesisMeanStd. Dev.MCSE
prob1: {ROE:L.ROE} > 0100%0.0000.000
prob2: {ROE:NII} < 0100%0.0000.000
prob3: {ROE:NPL} < 063%0.4830.005
prob4: {ROE:ETA} < 0100%0.0000.000
prob5: {ROE:SIZE} < 062.5%0.4840.030
prob6: {SD_ROE:L.SD_ROE} > 0100%0.0000.000
prob7: {SD_ROE:NII} < 0100%0.0000.000
prob8: {SD_ROE:NPL} < 063.13%0.4820.005
prob9: {SD_ROE:ETA} < 0100%0.0220.000
prob10: {SD_ROE:SIZE} < 0100%0.0000.000
The “Mean” column shows the probability of a positive or negative coefficient. The coefficients {ROE:L.ROE}, {ROE:NII}, {ROE:NPL}, {ROE:ETA}, and {ROE:SIZE} correspond to the variables L.ROE, NII, NPL, ETA, and SIZE in the model with ROE as the dependent variable. {SD_ROE:L.SD_ROE}, {SD_ROE:NII}, {SD_ROE:NPL}, {SD_ROE:ETA}, and {SD_ROE:SIZE} are the coefficients corresponding to L.SD_ROE, NII, NPL, ETA, and SIZE in the model with SD_ROE as the dependent variable.
Table 7. Model estimation results using the Bayesian method with dependent variable SD_ROA.
MeanStd. Dev.MedianEqual-Tailed [95% Cred. Interval]
L.SD_ROA0.9320.0170.9330.8980.965
NII−0.1240.041−0.124−0.203−0.044
NPL−0.0671.248−0.073−2.5502.342
ETA−0.4391.441−0.446−3.2362.409
SIZE0.0000.0150.000−0.0290.029
_CONS0.5290.4110.526−0.2701.340
The “Mean”, “Std. dev.”, and “Median” columns show the mean, standard deviation, and median of the posterior distribution corresponding to the model’s coefficients. The equal-tailed [95% cred. interval] column indicates a 95% credible interval for the coefficients in the model.
Table 8. Probability of regression coefficients.
HypothesisMeanStd. Dev.MCSE
prob1: {SD_ROA:L.SD_ROA} > 0100%0.0000.000
prob2: {SD_ROA:NII} < 0100%0.0360.000
prob3: {SD_ROA:NPL} < 052.33%0.4990.005
prob4: {SD_ROA:ETA} < 061.90%0.4860.006
prob5: {SD_ROA:SIZE} < 050.40%0.5000.006
The “Mean” column shows the probability of a positive or negative coefficient. The coefficients {SD_ROA:L.SD_ROA}, {SD_ROA:NII}, {SD_ROA:NPL}, {SD_ROA:ETA}, and {SD_ROA:SIZE} correspond to the variables L. SD_ROA, NII, NPL, ETA, and SIZE in the model with SD_ROA as the dependent variable.
Table 9. Quantile regression results model the impact of non-interest income on the performance of commercial banks.
VariableROESD_ROE
25th Quantile50th Quantile75th Quantile25th Quantile50th Quantile75th Quantile
L.ROE0.521 ***0.601 ***0.756 ***
L.SD_ROE 0.801 ***0.925 ***0.910 ***
NII−0.012 ***−0.007 ***−0.006 ***−0.210 ***−0.136 ***−0.108 ***
NPL0.130 ***0.034 **0.008 *0.636 ***0.5960.790 ***
ETA−0.274 ***−0.323 ***−0.086 ***−5.662 ***−4.415 ***−3.098 ***
SIZE0.0001−0.0010.001 ***0.014 ***−0.093 ***−0.024 ***
*** statistically significant at 1%, ** statistically significant at 5%, * statistically significant at 10%.
Table 10. Results of testing for the existence of the threshold effect.
ThresholdRSSMSEFstatProbCrit10Crit5Crit1
Single0.49840.001222.680.0007.03338.824711.2852
Double0.48870.00128.020.246711.367614.234623.977
Triple0.48210.00125.60.8317.536719.043923.9048
modelThresholdLowerUpper
Th-10.5930.55860.596
Th-210.5930.51440.596
Th-221.04020.88771.0501
Th-30.2870.28440.2915
Table 11. The impact of non-interest income on the performance of commercial banks corresponds to the threshold of non-interest income
ROECoefficientStd. Err.tP > t[95% Conf. Interval]
L.ROE0.4620.04111.1400.0000.3800.543
NPL0.0010.0460.0200.983−0.0890.091
ETA−0.4790.112−4.2900.000−0.698−0.259
SIZE−0.0150.004−3.3600.001−0.023−0.006
NII (<59.3%)0.0250.0083.3200.0010.0100.040
NII (>59.3%)−0.0110.003−4.3000.000−0.016−0.006
_CONS0.4570.0984.6700.0000.2640.649
Disclaimer/Publisher’s Note: The statements, opinions and data contained in all publications are solely those of the individual author(s) and contributor(s) and not of MDPI and/or the editor(s). MDPI and/or the editor(s) disclaim responsibility for any injury to people or property resulting from any ideas, methods, instructions or products referred to in the content.