
Emissions Reduction Policies and Their Effects on Economy


Abstract
:1. Introduction
2. Literature Review
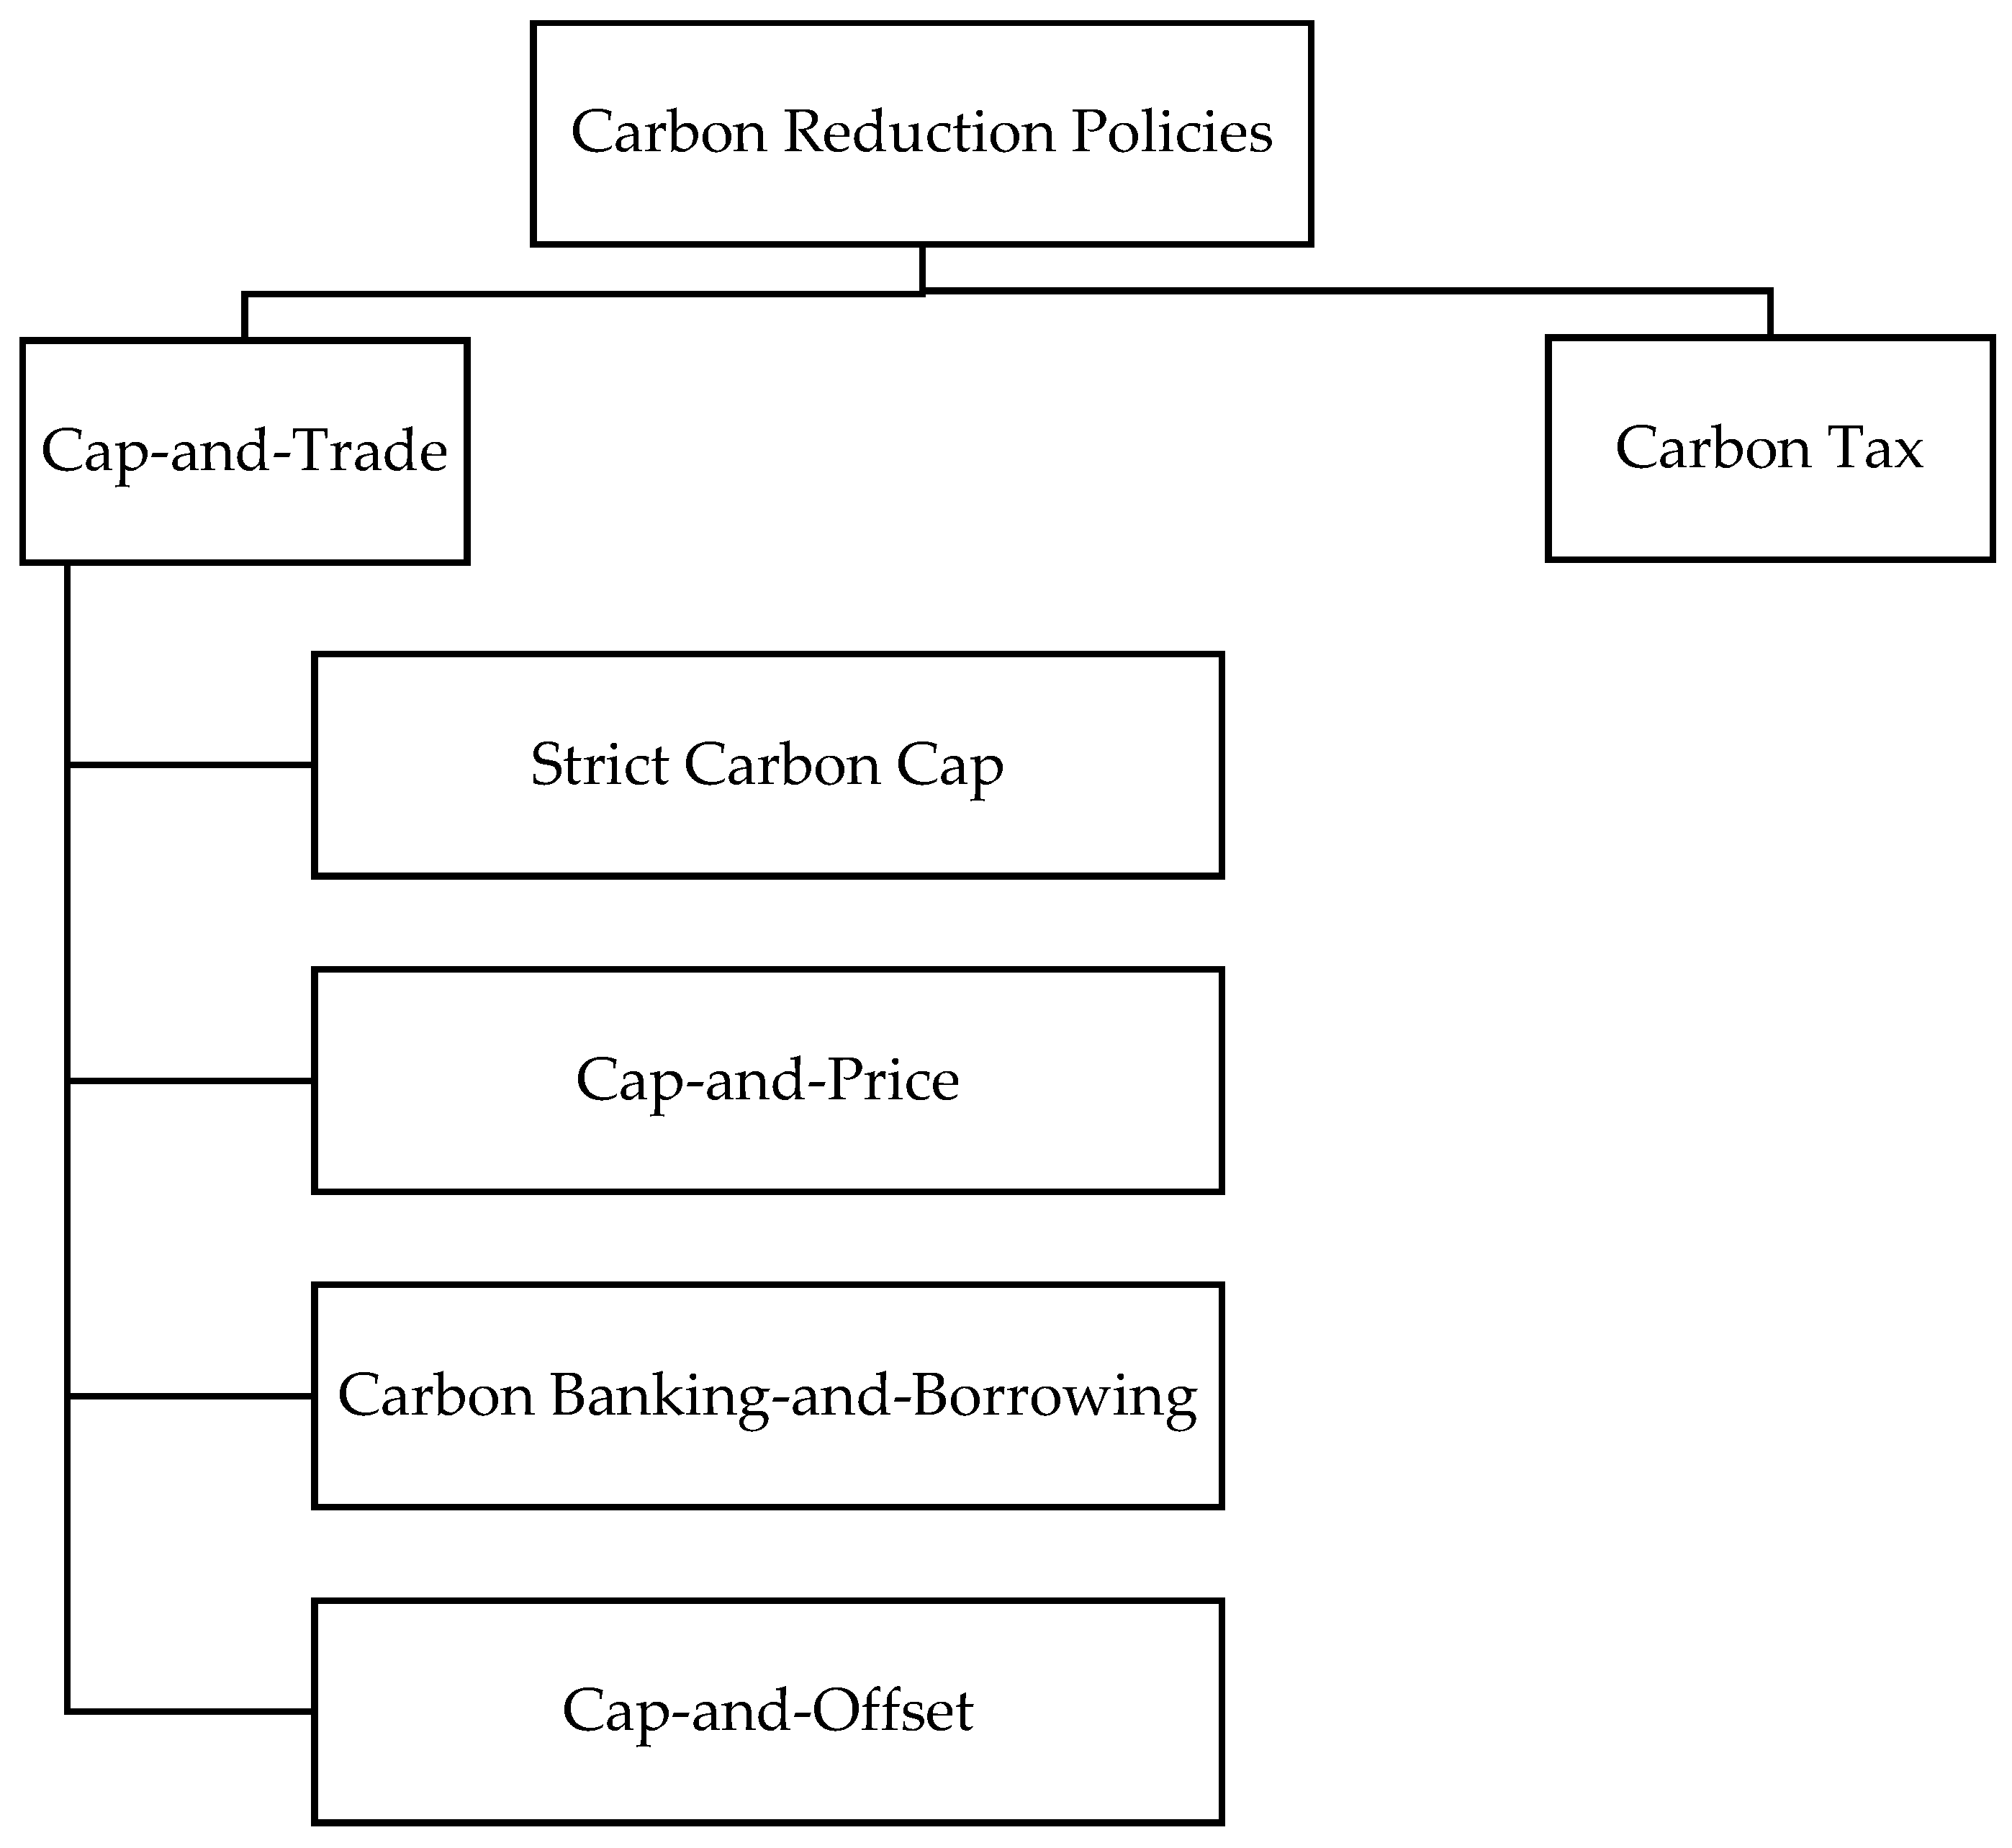
2.1. Cap-and-Trade
2.1.1. Strict Carbon Cap
2.1.2. Cap-and-Offset
2.1.3. Cap-and-Price
2.1.4. Carbon Banking-and-Borrowing
2.2. Carbon Tax
3. Data and Methodology
- Dependent Variable
- Natural log of GDP [Ln(GDP)] at constant prices is considered to measure the economic performance of the countries, which is a part of the analysis. GDP is considered the most widely used parameter for measuring the economic performance of countries.
- Independent Variables
- Natural log of CO2 emissions [Ln(CO2)]; higher emissions reflect more industrial activities contributing to higher GDP.
- Carbon tax (CT) rate is captured as a binary variable where 1 is the countries that have implemented the same and 0 otherwise.
- Control Variables
- Natural log of the population [Ln(P)]; the larger the population, the higher the GDP as more people will be contributing to economic activities keeping other factors stationary.
- R&D intensity (RDI): R&D Intensity is captured using a ratio of R&D as a percentage of GDP. We have assumed that countries spending more on R&D must spend some amount on cleaner technologies in production. Hence, it will have an impact on GDP and emissions. However, it may not capture the direct impact.
- Interaction Variable
- Interactions of CO2 emissions and a carbon tax (Interact CO2 × CT) explain the impact of a carbon tax on emissions. Interact CO2 is a binary variable for a carbon tax to understand the impact of a carbon tax on GDP.
4. Results and Analysis: Relationship between Carbon Reduction Policies, CO2 Emissions, and GDP
5. Conclusions and Policy Implications
Author Contributions
Funding
Institutional Review Board Statement
Informed Consent Statement
Data Availability Statement
Conflicts of Interest
Appendix A

| Country | Year Adopted | Tax Rate |
|---|---|---|
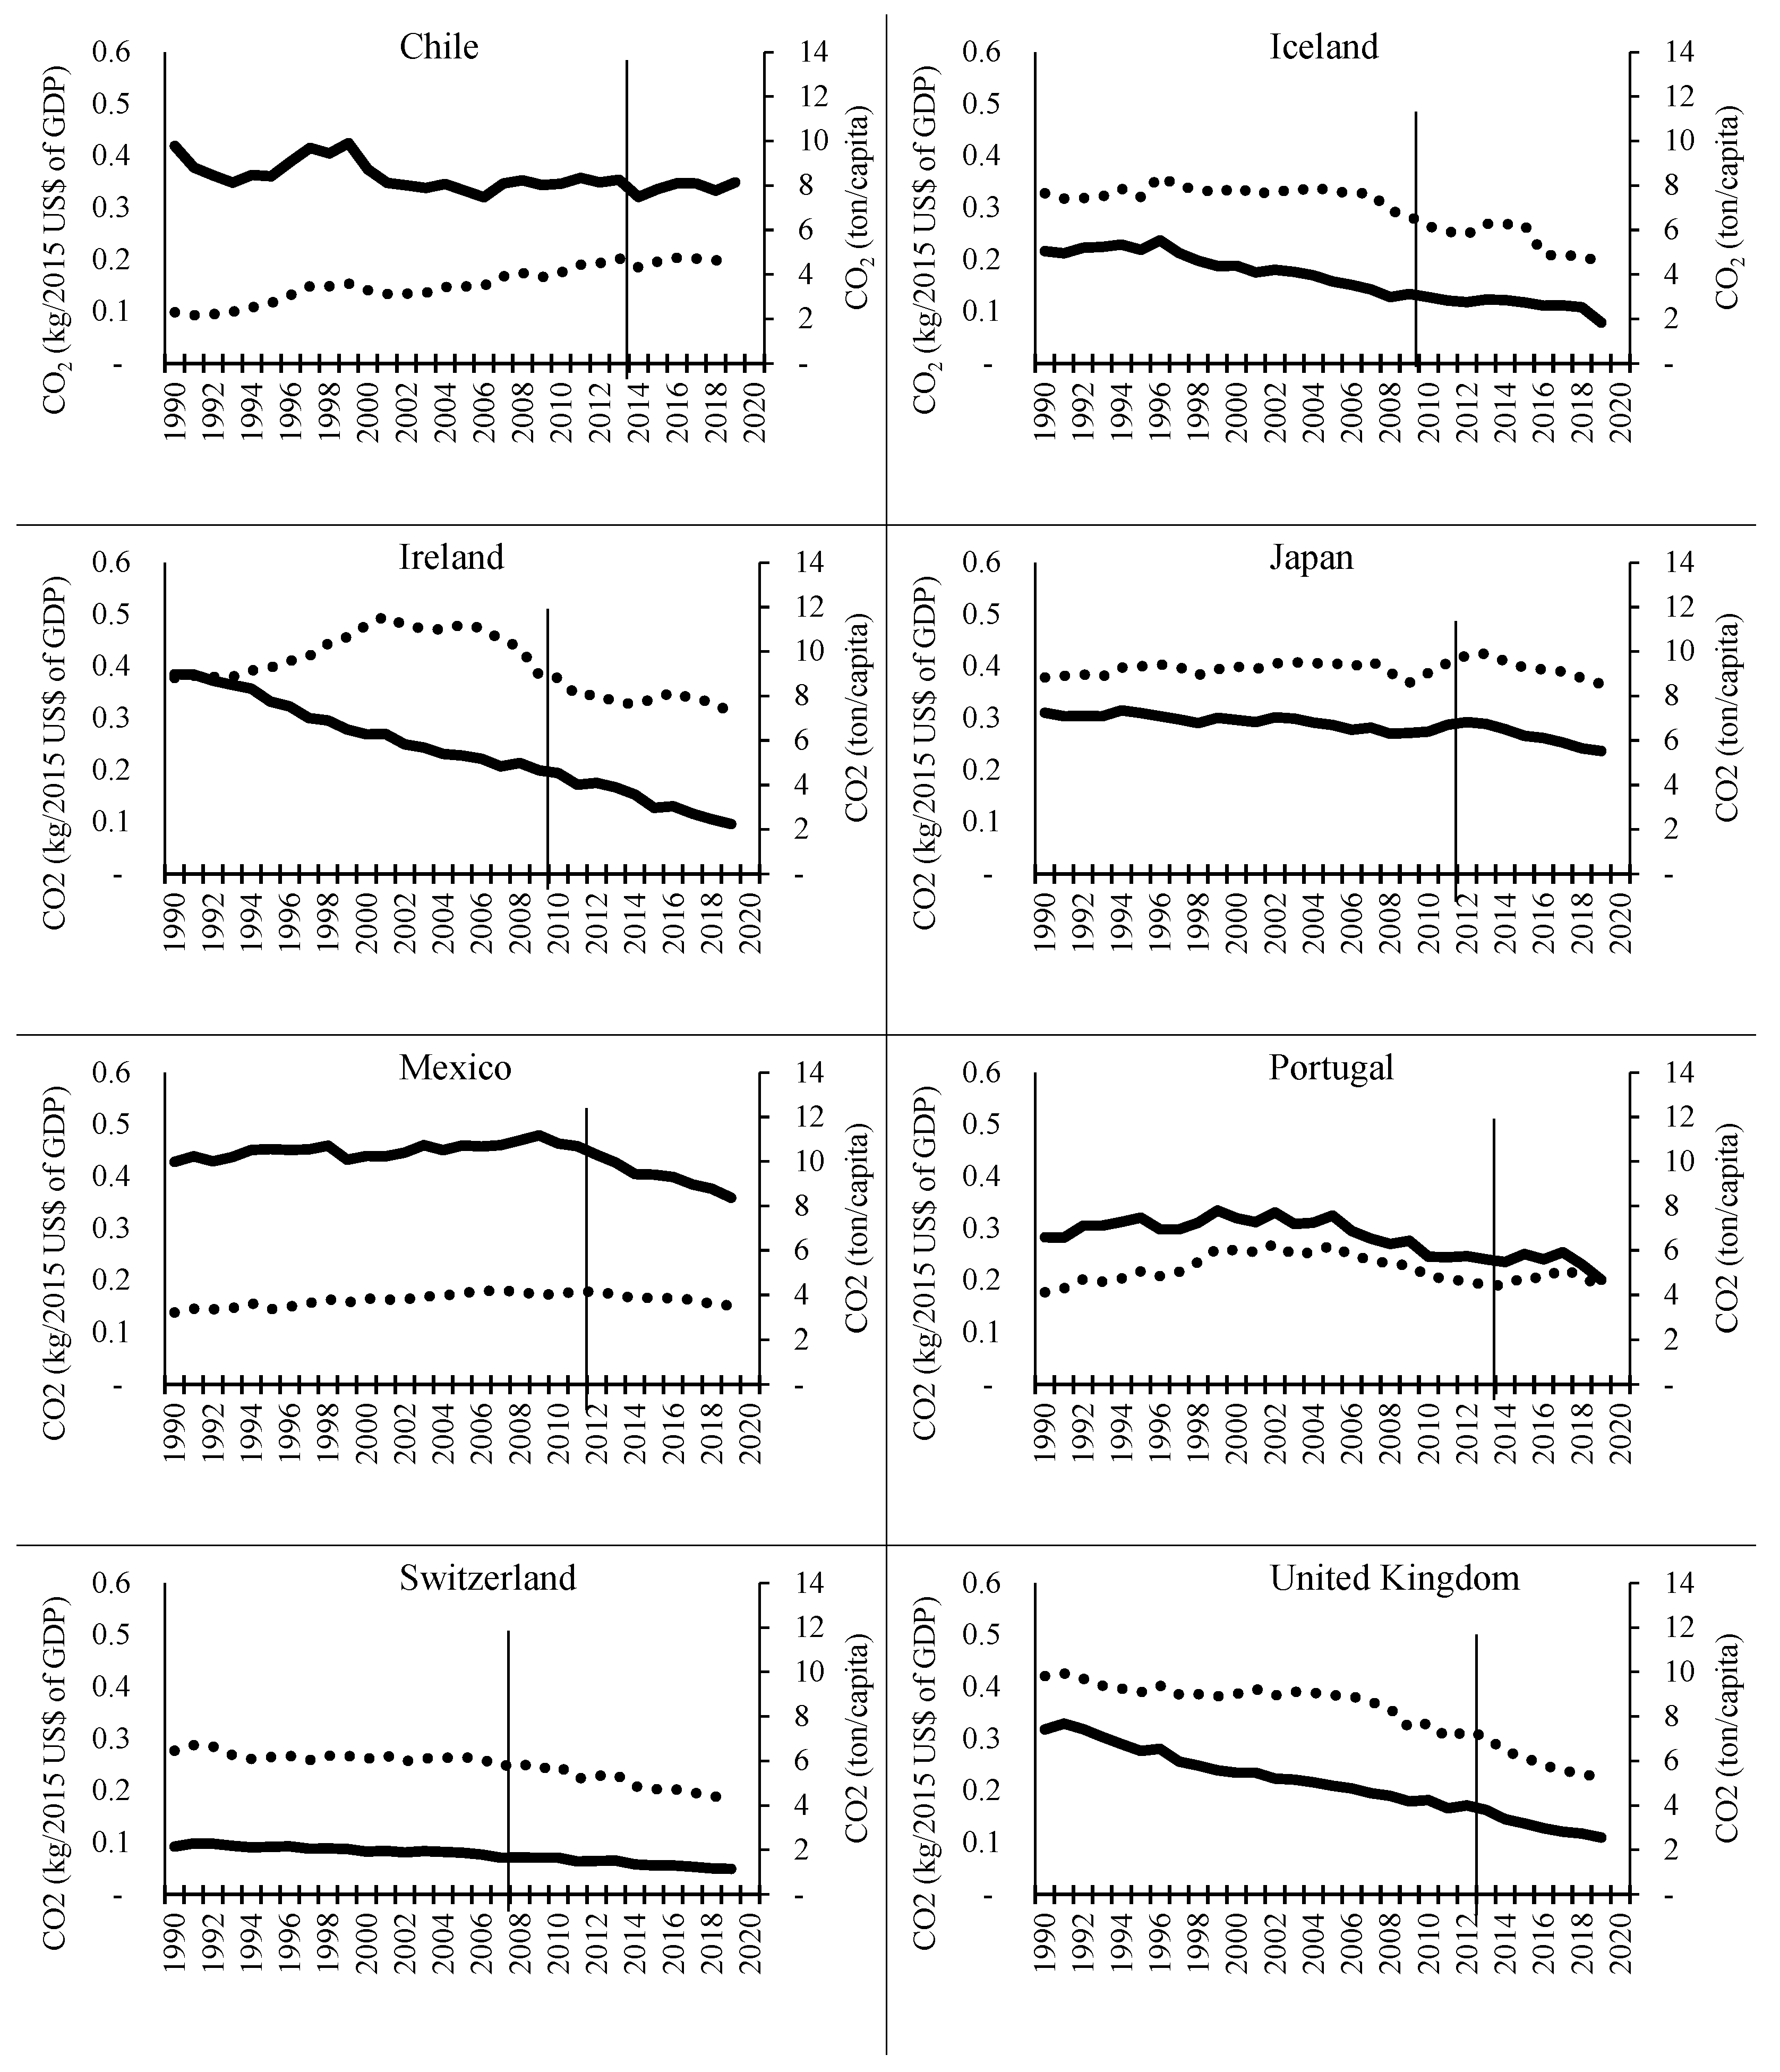
| Chile | 2014 | USD 5 per tCO2e (2018) |
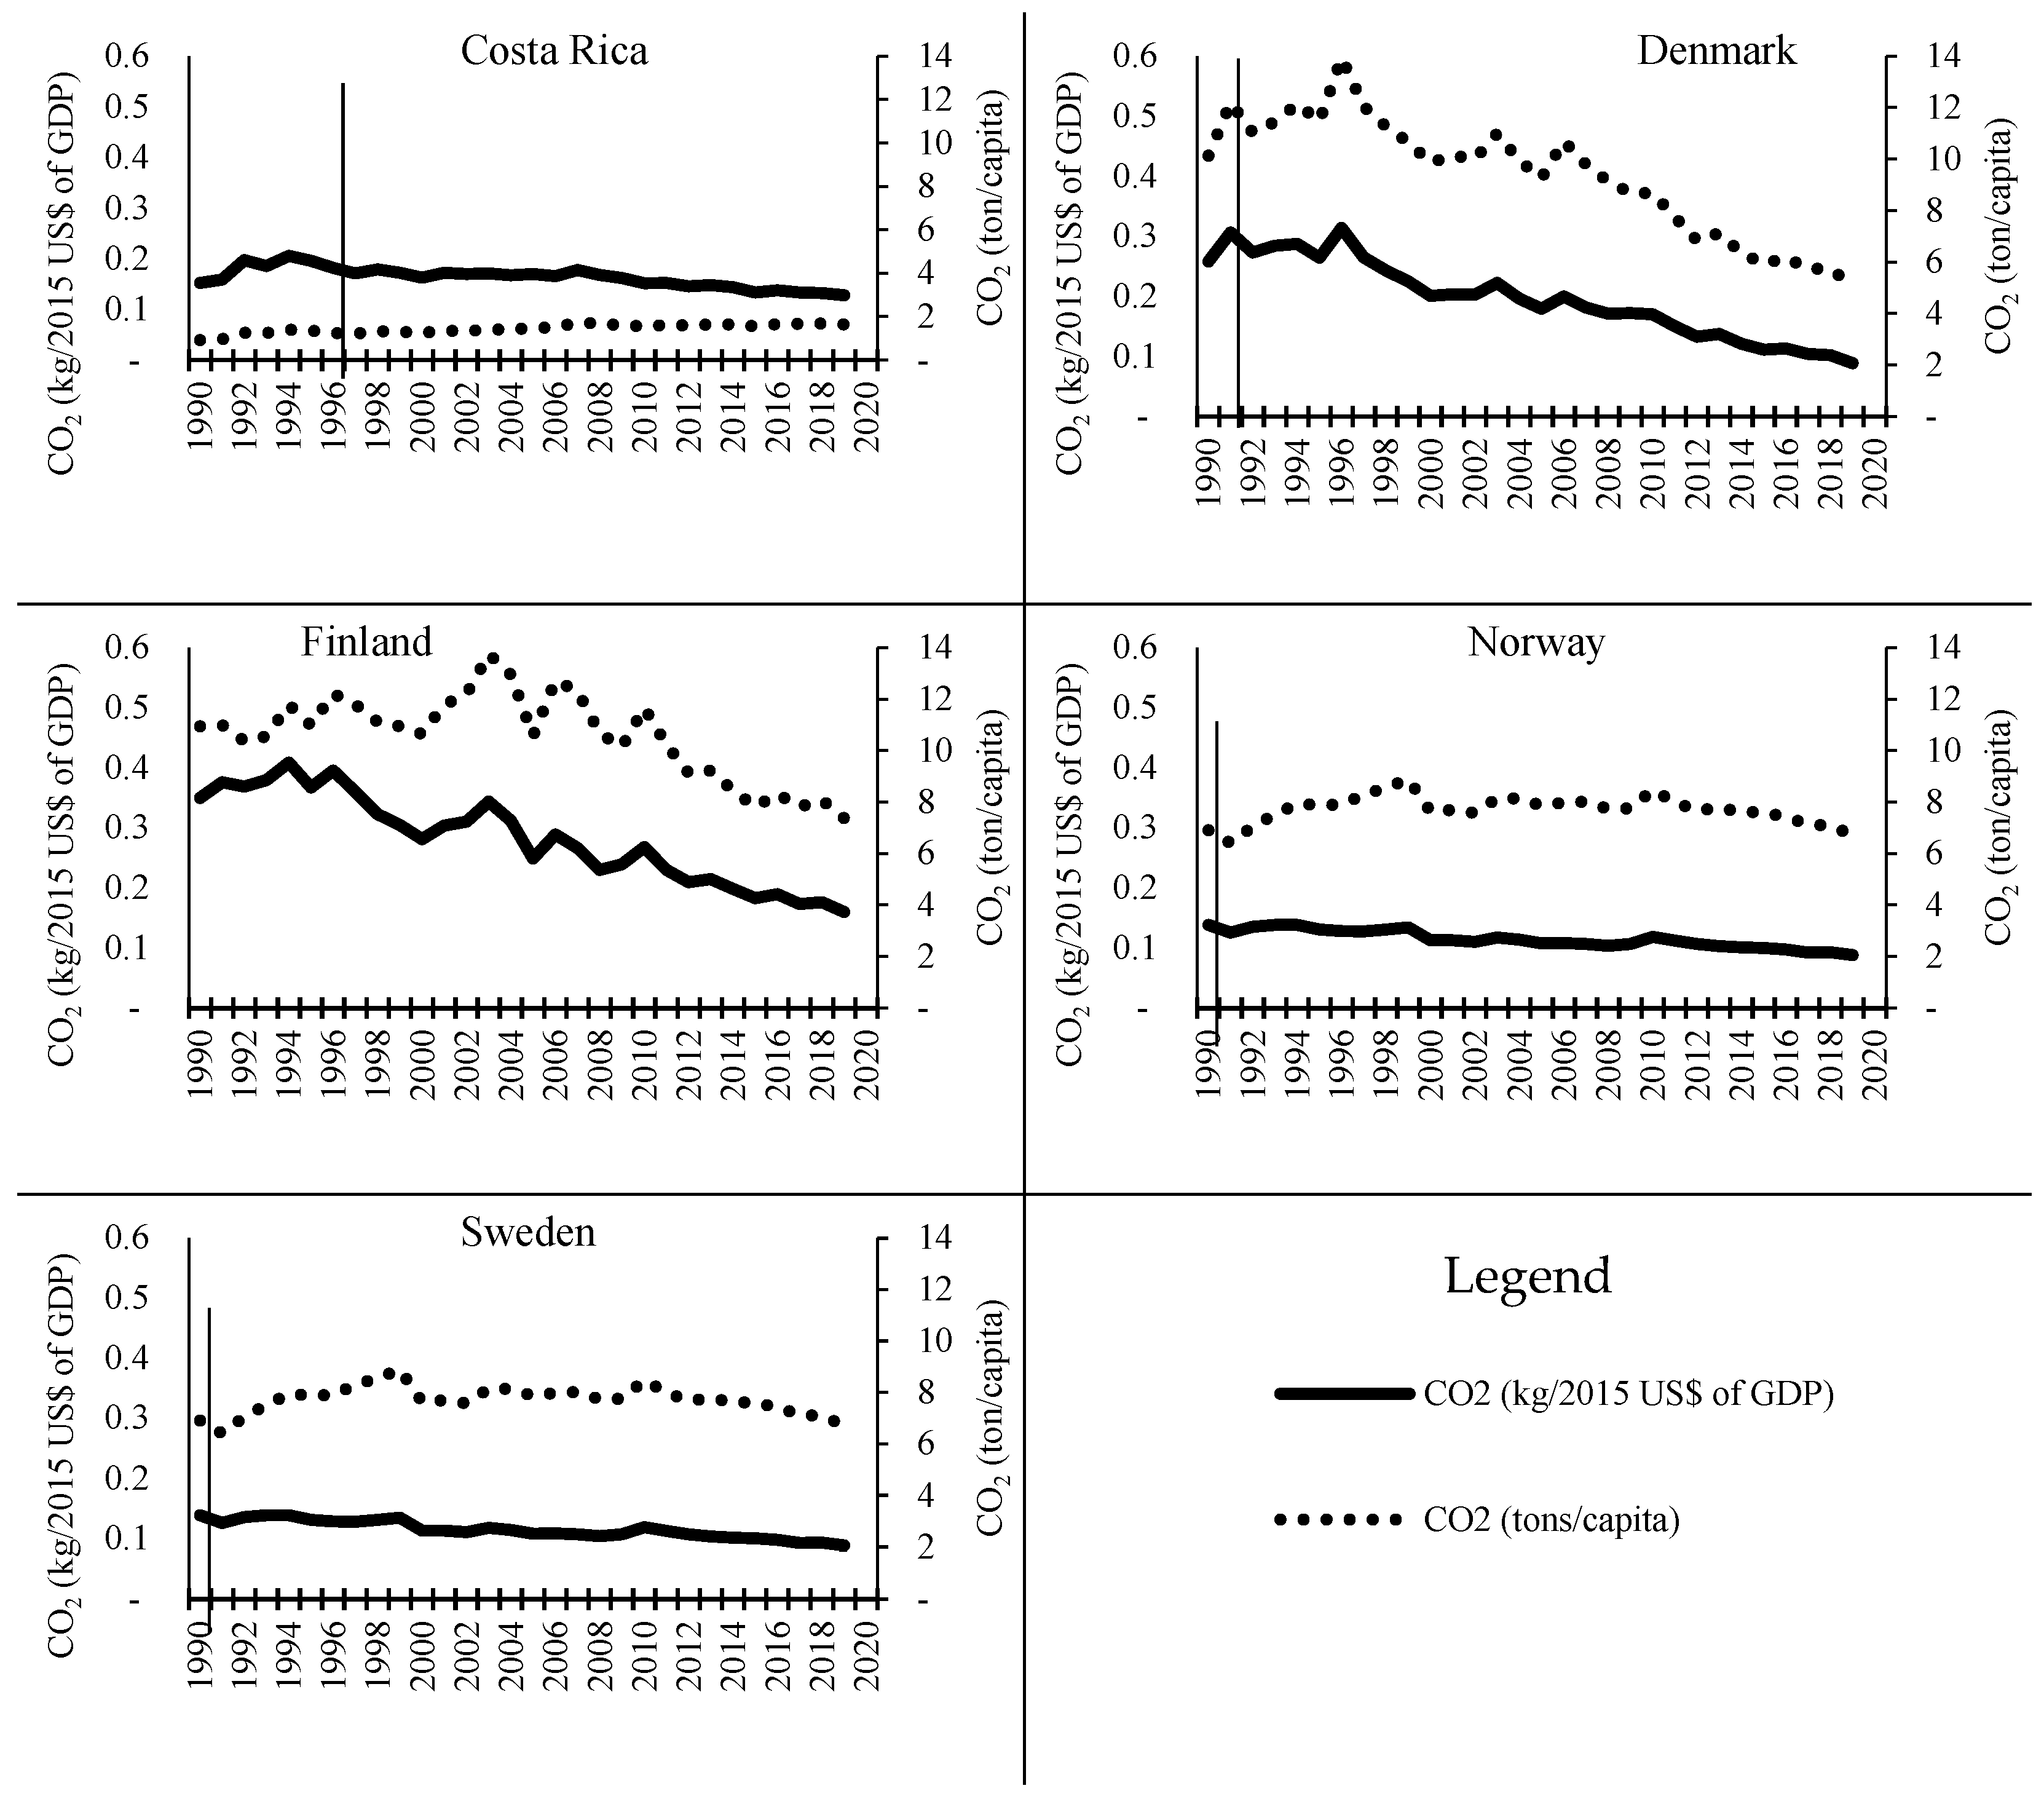
| Costa Rica | 1997 | 3.5% tax on hydrocarbon fossil fuels |
| Denmark | 1992 | USD 31 per tCO2e (2014) |
| Finland | 1990 | EUR 35 per tCO2e (2013) |
| France | 2014 | EUR 7 per tCO2e (2014) |
| Iceland | 2010 | USD 10 per tCO2e (2014) |
| Ireland | 2010 | EUR 20 per tCO2e (2013) |
| Japan | 2012 | USD 2 per tCO2e |
| Mexico | 2012 | MXN 10–50 per tCO2e (2014) * |
| Norway | 1991 | USD 4–69 per tCO2e (2014) ** |
| Portugal | 2014 | EUR 5 per tCO2e (2015) |
| South Africa | 2016 | ZAR 120/tCO2 (Proposed tax rate for 2016) *** |
| Sweden | 1991 | USD 168 per tCO2e (2014) |
| Switzerland | 2008 | USD 68 per tCO2e (2014) |
| United Kingdom | 2013 | USD 15.75 per tCO2e (2014) |
Appendix B
| Country | Null Hypothesis | Chi-Square Statistics | Prob. | Decision |
|---|---|---|---|---|
| Argentina | CO2 Emissions do not Granger cause GDP | 8.2106 | 0.016 | Reject |
| Argentina | GDP does not cause CO2 emissions | 6.3478 | 0.042 | Reject |
| Argentina | Population does not cause GDP | 3.6333 | 0.163 | Accept |
| Argentina | GDP does not cause Population | 2.2166 | 0.33 | Accept |
| Argentina | A Carbon Tax does not cause GDP | 0.93152 | 0.628 | Accept |
| Argentina | GDP does not cause a Carbon Tax | 4.1118 | 0.128 | Accept |
| Argentina | CO2 emissions do not cause a Carbon Tax | 648.65 | 0 | Reject |
| Argentina | A Carbon Tax does not cause CO2 emissions | 10.538 | 0.005 | Reject |
| Canada | CO2 Emissions do not Granger cause GDP | 0.13589 | 0.934 | Accept |
| Canada | GDP does not cause CO2 emissions | 0.96564 | 0.617 | Accept |
| Canada | Population does not cause GDP | 0.43633 | 0.804 | Accept |
| Canada | GDP does not cause Population | 2.2182 | 0.33 | Accept |
| Canada | A Carbon Tax does not cause GDP | NA | NA | NA |
| Canada | GDP does not cause a Carbon Tax | NA | NA | NA |
| Canada | CO2 emissions do not cause a Carbon Tax | NA | NA | NA |
| Canada | A Carbon Tax does not cause CO2 emissions | NA | NA | NA |
| Chile | CO2 Emissions do not Granger cause GDP | 12.058 | 0.002 | Reject |
| Chile | GDP does not cause CO2 emissions | 9.1148 | 0.01 | Reject |
| Chile | Population does not cause GDP | 3.363 | 0.186 | Accept |
| Chile | GDP does not cause Population | 6.6681 | 0.036 | Reject |
| Chile | A Carbon Tax does not cause GDP | 4.7232 | 0.094 | Reject |
| Chile | GDP does not cause a Carbon Tax | - | - | - |
| Chile | CO2 emissions do not cause a Carbon Tax | 9.7734 | 0.008 | Reject |
| Chile | A Carbon Tax does not cause CO2 emissions | 390.5 | 0 | Reject |
| Colombia | CO2 Emissions do not Granger cause GDP | 33.318 | 0 | Reject |
| Colombia | GDP does not cause CO2 emissions | 5.2206 | 0.074 | Reject |
| Colombia | Population does not cause GDP | 5.9142 | 0.052 | Reject |
| Colombia | GDP does not cause Population | 0.19033 | 0.909 | Accept |
| Colombia | A Carbon Tax does not cause GDP | 5.4695 | 0.065 | NA |
| Colombia | GDP does not cause a Carbon Tax | - | - | - |
| Colombia | CO2 emissions do not cause a Carbon Tax | 3.2868 | 0.193 | Accept |
| Colombia | A Carbon Tax does not cause CO2 emissions | 421.08 | 0 | Reject |
| Costa Rica | CO2 Emissions do not Granger cause GDP | 8.2106 | 0.016 | Reject |
| Costa Rica | GDP does not cause CO2 emissions | 6.3478 | 0.042 | Reject |
| Costa Rica | Population does not cause GDP | 3.6333 | 0.163 | Accept |
| Costa Rica | GDP does not cause Population | 2.2166 | 0.33 | Accept |
| Costa Rica | A Carbon Tax does not cause GDP | 0.93152 | 0.628 | Accept |
| Costa Rica | GDP does not cause a Carbon Tax | 4.1118 | 0.128 | Accept |
| Costa Rica | CO2 emissions do not cause a Carbon Tax | 648.65 | 0 | Reject |
| Costa Rica | A Carbon Tax does not cause CO2 emissions | 10.538 | 0.005 | Reject |
| Denmark | CO2 Emissions do not Granger cause GDP | 6.1507 | 0.046 | Reject |
| Denmark | GDP does not cause CO2 emissions | 1.4929 | 0.474 | Accept |
| Denmark | Population does not cause GDP | 1.3908 | 0.499 | Accept |
| Denmark | GDP does not cause Population | 3.2439 | 0.198 | Accept |
| Denmark | A Carbon Tax does not cause GDP | 0.22421 | 0.894 | Accept |
| Denmark | GDP does not cause a Carbon Tax | 2.4844 | 0.647 | Accept |
| Denmark | CO2 emissions do not cause a Carbon Tax | 1.6834 | 0.431 | Accept |
| Denmark | A Carbon Tax does not cause CO2 emissions | 3.0526 | 0.217 | Accept |
| Finland | CO2 Emissions do not Granger cause GDP | 12.477 | 0.002 | Reject |
| Finland | GDP does not cause CO2 emissions | 0.6814 | 0.711 | Reject |
| Finland | Population does not cause GDP | 2.6028 | 0.272 | Accept |
| Finland | GDP does not cause Population | 0.98397 | 0.611 | Accept |
| Finland | A Carbon Tax does not cause GDP | 6.0124 | 0.049 | Reject |
| Finland | GDP does not cause a Carbon Tax | 5.0905 | 0.278 | Accept |
| Finland | CO2 emissions do not cause A Carbon Tax | 1.9885 | 0.37 | Accept |
| Finland | A Carbon Tax does not cause CO2 emissions | 8.534 | 0.014 | Reject |
| France | CO2 Emissions do not Granger cause GDP | 84.445 | 0 | Reject |
| France | GDP does not cause CO2 emissions | 0.32609 | 0.85 | Accept |
| France | Population does not cause GDP | 3.423 | 0.181 | Accept |
| France | GDP does not cause Population | 0.51664 | 0.772 | Accept |
| France | A Carbon Tax does not cause GDP | 1.6658 | 0.435 | Accept |
| France | GDP does not cause a Carbon Tax | 2.3012 | 0.681 | Accept |
| France | CO2 emissions do not cause A Carbon Tax | 0.13981 | 0.932 | Accept |
| France | A Carbon Tax does not cause CO2 emissions | 4.9053 | 0.086 | Reject |
| Iceland | CO2 Emissions do not Granger cause GDP | 1.6598 | 0.436 | Accept |
| Iceland | GDP does not cause CO2 emissions | 0.29303 | 0.864 | Accept |
| Iceland | Population does not cause GDP | 0.61628 | 0.735 | Accept |
| Iceland | GDP does not cause Population | 0.02472 | 0.988 | Accept |
| Iceland | A Carbon Tax does not cause GDP | NA | NA | NA |
| Iceland | GDP does not cause a Carbon Tax | NA | NA | NA |
| Iceland | CO2 emissions do not cause A Carbon Tax | NA | NA | NA |
| Iceland | A Carbon Tax does not cause CO2 emissions | NA | NA | NA |
| Ireland | CO2 Emissions do not Granger cause GDP | 0.82113 | 0.663 | Accept |
| Ireland | GDP does not cause CO2 emissions | 2.4029 | 0.301 | Accept |
| Ireland | Population does not cause GDP | 2.6568 | 0.265 | Accept |
| Ireland | GDP does not cause Population | 1.4608 | 0.482 | Accept |
| Ireland | A Carbon Tax does not cause GDP | 4.6515 | 0.098 | Reject |
| Ireland | GDP does not cause a Carbon Tax | 18.341 | 0.72 | Accept |
| Ireland | CO2 emissions do not cause A Carbon Tax | 0.65586 | 0.72 | Accept |
| Ireland | A Carbon Tax does not cause CO2 emissions | 0.46979 | 0.791 | Accept |
| Japan | CO2 Emissions do not Granger cause GDP | 15.454 | 0 | Reject |
| Japan | GDP does not cause CO2 emissions | 0.8175 | 0.664 | Accept |
| Japan | Population does not cause GDP | 2.5384 | 0.281 | Accept |
| Japan | GDP does not cause Population | 10.856 | 0.004 | Reject |
| Japan | A Carbon Tax does not cause GDP | 2.2478 | 0.325 | Accept |
| Japan | GDP does not cause a Carbon Tax | 0.59025 | 0.744 | Accept |
| Japan | CO2 emissions do not cause A Carbon Tax | 0.96169 | 0.618 | Accept |
| Japan | A Carbon Tax does not cause CO2 emissions | 1.1893 | 0.552 | Accept |
| Mexico | CO2 Emissions do not Granger cause GDP | 19.007 | 0 | Reject |
| Mexico | GDP does not cause CO2 emissions | 0.68407 | 0.71 | Accept |
| Mexico | Population does not cause GDP | 0.67885 | 0.712 | Accept |
| Mexico | GDP does not cause Population | 0.68407 | 0.71 | Accept |
| Mexico | A Carbon Tax does not cause GDP | 0.66916 | 0.716 | Accept |
| Mexico | GDP does not cause a Carbon Tax | 6.2272 | 0.183 | Accept |
| Mexico | CO2 emissions do not cause A Carbon Tax | 4.2193 | 0.121 | Accept |
| Mexico | A Carbon Tax does not cause CO2 emissions | 4.9897 | 0.083 | Reject |
| Norway | CO2 Emissions do not Granger cause GDP | 14.284 | 0.001 | Reject |
| Norway | GDP does not cause CO2 emissions | 0.86477 | 0.649 | Accept |
| Norway | Population does not cause GDP | 11.625 | 0.003 | Reject |
| Norway | GDP does not cause Population | 0.1561 | 0.925 | Accept |
| Norway | A Carbon Tax does not cause GDP | 3.0999 | 0.212 | Accept |
| Norway | GDP does not cause a Carbon Tax | 8.2498 | 0.128 | Accept |
| Norway | CO2 emissions do not cause A Carbon Tax | 1.9002 | 0.387 | Accept |
| Norway | A Carbon Tax does not cause CO2 emissions | 1.7274 | 0.422 | Accept |
| Poland | CO2 Emissions do not Granger cause GDP | 66.478 | 0 | Reject |
| Poland | GDP does not cause CO2 emissions | 3.9667 | 0.138 | Accept |
| Poland | Population does not cause GDP | 3.9543 | 0.138 | Accept |
| Poland | GDP does not cause Population | 2.465 | 0.292 | Accept |
| Poland | A Carbon Tax does not cause GDP | 2.3717 | 0.305 | Accept |
| Poland | GDP does not cause a Carbon Tax | 1.457 | 0.834 | Accept |
| Poland | CO2 emissions do not cause A Carbon Tax | 0.95056 | 0.622 | Accept |
| Poland | A Carbon Tax does not cause CO2 emissions | 0.51505 | 0.773 | Accept |
| Portugal | CO2 Emissions do not Granger cause GDP | 60.574 | 0 | Reject |
| Portugal | GDP does not cause CO2 emissions | 0.47996 | 0.787 | Accept |
| Portugal | Population does not cause GDP | 1.1788 | 0.555 | Accept |
| Portugal | GDP does not cause Population | 3.833 | 0.147 | Accept |
| Portugal | A Carbon Tax does not cause GDP | 1.8702 | 0.393 | Accept |
| Portugal | GDP does not cause a Carbon Tax | 3.0723 | 0.215 | Accept |
| Portugal | CO2 emissions do not cause A Carbon Tax | 0.40092 | 0.818 | Accept |
| Portugal | A Carbon Tax does not cause CO2 emissions | 3.9024 | 0.142 | Accept |
| South Africa | CO2 Emissions do not Granger cause GDP | 120.03 | 0 | Reject |
| South Africa | GDP does not cause CO2 emissions | 4.4186 | 0.352 | Accept |
| South Africa | Population does not cause GDP | 17.271 | 0.002 | Reject |
| South Africa | GDP does not cause Population | 10.962 | 0.027 | Reject |
| South Africa | A Carbon Tax does not cause GDP | NA | NA | NA |
| South Africa | GDP does not cause a Carbon Tax | NA | NA | NA |
| South Africa | CO2 emissions do not cause a Carbon Tax | NA | NA | NA |
| South Africa | A Carbon Tax does not cause CO2 emissions | NA | NA | NA |
| Spain | CO2 Emissions do not Granger cause GDP | 69.869 | 0 | Reject |
| Spain | GDP does not cause CO2 emissions | 3.6909 | 0.158 | Accept |
| Spain | Population does not cause GDP | 1.7574 | 0.415 | Accept |
| Spain | GDP does not cause Population | 4.0514 | 0.132 | Accept |
| Spain | A Carbon Tax does not cause GDP | 3.2777 | 0.194 | Accept |
| Spain | GDP does not cause a Carbon Tax | 3.3761 | 0.497 | Accept |
| Spain | CO2 emissions do not cause A Carbon Tax | 2.5027 | 0.286 | Accept |
| Spain | A Carbon Tax does not cause CO2 emissions | 11.537 | 0.003 | Reject |
| Sweden | CO2 Emissions do not Granger cause GDP | 5.8116 | 0.055 | Reject |
| Sweden | GDP does not cause CO2 emissions | 2.8163 | 0.245 | Accept |
| Sweden | Population does not cause GDP | 2.5932 | 0.273 | Accept |
| Sweden | GDP does not cause Population | 1.7684 | 0.413 | Accept |
| Sweden | A Carbon Tax does not cause GDP | 3.9837 | 0.136 | Accept |
| Sweden | GDP does not cause a Carbon Tax | 0.59677 | 0.963 | Accept |
| Sweden | CO2 emissions do not cause A Carbon Tax | 0.23204 | 0.89 | Accept |
| Sweden | A Carbon Tax does not cause CO2 emissions | 1.5131 | 0.469 | Accept |
| Switzerland | CO2 Emissions do not Granger cause GDP | 30.602 | 0 | Reject |
| Switzerland | GDP does not cause CO2 emissions | 4.8329 | 0.089 | Reject |
| Switzerland | Population does not cause GDP | 1.8377 | 0.399 | Accept |
| Switzerland | GDP does not cause Population | 14.594 | 0.001 | Reject |
| Switzerland | A Carbon Tax does not cause GDP | 12.344 | 0.002 | Reject |
| Switzerland | GDP does not cause a Carbon Tax | 5.7673 | 0.217 | Accept |
| Switzerland | CO2 emissions do not cause A Carbon Tax | 0.992 | 0.609 | Accept |
| Switzerland | A Carbon Tax does not cause CO2 emissions | 1.7385 | 0.419 | Accept |
| Ukraine | CO2 Emissions do not Granger cause GDP | 1.2373 | 0.539 | Accept |
| Ukraine | GDP does not cause CO2 emissions | 2.1411 | 0.343 | Accept |
| Ukraine | Population does not cause GDP | 12.194 | 0.002 | Reject |
| Ukraine | GDP does not cause Population | 0.24094 | 0.887 | Accept |
| Ukraine | A Carbon Tax does not cause GDP | 1.9846 | 0.371 | Accept |
| Ukraine | GDP does not cause a Carbon Tax | 4.0877 | 0.394 | Accept |
| Ukraine | CO2 emissions do not cause A Carbon Tax | 0.23849 | 0.888 | Accept |
| Ukraine | A Carbon Tax does not cause CO2 emissions | 0.39178 | 0.822 | Accept |
| UK | CO2 Emissions do not Granger cause GDP | 89.732 | 0 | Reject |
| UK | GDP does not cause CO2 emissions | 0.30143 | 0.86 | Accept |
| UK | Population does not cause GDP | 1.4386 | 0.487 | Accept |
| UK | GDP does not cause Population | 0.36131 | 0.835 | Accept |
| UK | A Carbon Tax does not cause GDP | NA | NA | NA |
| UK | GDP does not cause a Carbon Tax | NA | NA | NA |
| UK | CO2 emissions do not cause A Carbon Tax | NA | NA | NA |
| UK | A Carbon Tax does not cause CO2 emissions | NA | NA | NA |
References
- Alper, Ali Eren. 2017. Analysis of Carbon Tax on Selected European Countries: Does Carbon Tax Reduce Emissions? Applied Economics and Finance 5: 29–36. [Google Scholar] [CrossRef]
- Andrew, Brian. 2008. Market failure, government failure and externalities in climate change mitigation: The case for a carbon tax. Public Administration and Development 28: 393–401. [Google Scholar] [CrossRef]
- Arslan, M. Can, and Metin Turkay. 2013. EOQ Revisited with Sustainability Considerations. Foundations of Computing and Decision Sciences 38: 223–49. [Google Scholar] [CrossRef]
- Bernard, Jean-Thomas, and Maral Kichian. 2021. The Impact of a Revenue-Neutral Carbon Tax on GDP Dynamics: The Case of British Columbia. The Energy Journal 42: 205–24. [Google Scholar] [CrossRef]
- Beuermann, Christiane, and Tilman Santarius. 2006. Ecological tax reform in Germany: Handling two hot potatoes at the same time. Energy Policy 34: 917–29. [Google Scholar] [CrossRef]
- BP. 2021. BP Statistical Reviews 2019. Available online: https://www.bp.com/content/dam/bp/business-sites/en/global/corporate/pdfs/energy-economics/statistical-review/bp-stats-review-2019-full-report.pdf (accessed on 25 May 2021).
- Chen, Xi, Saif Benjaafar, and Adel Elomri. 2013. The carbon-constrained EOQ. Operations Research Letters 41: 172–79. [Google Scholar] [CrossRef]
- Cowan, Wendy N., Tsangyao Chang, Roula Inglesi-Lotz, and Rangan Gupta. 2014. The nexus of electricity consumption, economic growth and CO2 emissions in the BRICS countries. Energy Policy 66: 359–68. [Google Scholar] [CrossRef]
- European Commission. 2018. EU Emissions Trading System (ETS). Available online: https://ec.europa.eu/clima/policies/ets_en (accessed on 27 May 2019).
- Fuss, Sabine, Christian Flachsland, Nicolas Koch, Ulrike Kornek, Brigitte Knopf, and Ottmar Edenhofer. 2018. A Framework for Assessing the Performance of Cap-and-Trade Systems: Insights from the European Union Emissions Trading System. Review of Environmental Economics and Policy 12: 220–41. [Google Scholar] [CrossRef]
- Gaspar, Vitor, Paolo Mauro, Ian Parry, and Catherine Pattillo. 2019. Fiscal Policies to Curb Climate Change. Available online: https://blogs.imf.org/2019/10/10/fiscal-policies-to-curb-climate-change/ (accessed on 13 January 2021).
- Ghosh, Arindam, Jitendra Kumar Jha, and S. P. Sarmah. 2017. Optimal lot-sizing under strict carbon cap policy considering stochastic demand. Applied Mathematical Modelling 44: 688–704. [Google Scholar] [CrossRef]
- Gurtu, Amulya, and Anandajit Goswami. 2020. Emissions in different stages of economic development in nations. Smart and Sustainable Built Environment. [Google Scholar] [CrossRef]
- Gurtu, Amulya, Cory Searcy, and Mohamad Y. Jaber. 2016a. A Framework for Reducing Global Manufacturing Emissions. The Journal of Environment & Development 25: 159–90. [Google Scholar] [CrossRef]
- Gurtu, Amulya, Cory Searcy, and Mohamad Y. Jaber. 2016b. Effects of offshore outsourcing on a nation. Sustainable Production and Consumption 7: 94–105. [Google Scholar] [CrossRef]
- Gurtu, Amulya, Cory Searcy, and Mohamad Y. Jaber. 2017. Emissions from international transport in global supply chains. Management Research Review 40: 53–74. [Google Scholar] [CrossRef]
- Gurtu, Amulya, Ramesh Saxena, and Nilesh Sah. 2019. Offshoring Decisions: A Comprehensive and Conceptual Framework. Operations and Supply Chain Management: An International Journal 12: 118–28. [Google Scholar] [CrossRef]
- Hepburn, Cameron. 2007. Carbon Trading: A Review of the Kyoto Mechanisms. Annual Review of Environment and Resources 32: 375–93. [Google Scholar] [CrossRef]
- Hoeller, Peter, and Markku Wallin. 1991. Energy Prices, Taxes and Carbon Dioxide Emissions. Paris: OECD. [Google Scholar]
- Huisingh, Donald, Zhihua Zhang, John C. Moore, Qi Qiao, and Qi Li. 2015. Recent advances in carbon emissions reduction: Policies, technologies, monitoring, assessment and modeling. Journal of Cleaner Production 103: 1–12. [Google Scholar] [CrossRef]
- Hwang, In Chang, Frédéric Reynès, and Richard S. J. Tol. 2017. The effect of learning on climate policy under fat-tailed risk. Resource and Energy Economics 48: 1–18. [Google Scholar] [CrossRef]
- ISA. 2015. International Solar Alliance. Available online: http://isolaralliance.org/ (accessed on 10 June 2019).
- Kamieniecki, Sheldon, and Michael Kraft. 2012. The Oxford Handbook of U.S. Environmental Policy. New York: Oxford University Press. [Google Scholar]
- Kim, Yong-Gun, and Jong-Soo Lim. 2014. An emissions trading scheme design for power industries facing price regulation. Energy Policy 75: 84–90. [Google Scholar] [CrossRef]
- Komanoff, Charles. 2013. Australia: What Has Been the Effect of the Carbon Price on the Electricity Market? Available online: https://www.carbontax.org/blog/2013/04/30/australia-what-has-been-the-effect-of-the-carbon-price-on-the-electricity-market/ (accessed on 6 June 2019).
- Kosnik, Lea-Rachel. 2018. Cap-and-trade versus carbon taxes: Which market mechanism gets the most attention? Climatic Change 151: 605–18. [Google Scholar] [CrossRef]
- Labatt, Sonia, and Rodney R. White. 2007. Carbon Finance: The Financial Implications of Climate Change. Hoboken: Wiley Finance. [Google Scholar]
- Li, Shoude, and Mengdi Gu. 2012. The effect of emission permit trading with banking on firm’s production–inventory strategies. International Journal of Production Economics 137: 304–8. [Google Scholar] [CrossRef]
- Massetti, Emanuele. 2011. Carbon tax scenarios for China and India: Exploring politically feasible mitigation goals. International Environmental Agreements: Politics, Law and Economics 11: 209–27. [Google Scholar] [CrossRef]
- Milt, Austin W., and Paul R. Armsworth. 2017. Performance of a cap and trade system for managing environmental impacts of shale gas surface infrastructure. Ecological Economics 131: 399–406. [Google Scholar] [CrossRef]
- Morehouse, Erica. 2012. EU’s Cap-and-Trade Lessons Are to California’s Advantage. Available online: http://blogs.edf.org/californiadream/2012/10/17/eus-cap-and-trade-lessons-are-to-californias-advantage/ (accessed on 13 June 2019).
- Nazarko, Łukasz, Eigirdas Žemaitis, Łukasz Krzysztof Wróblewski, Karel Šuhajda, and Magdalena Zajączkowska. 2022. The Impact of Energy Development of the European Union Euro Area Countries on CO2 Emissions Level. Energies 15: 1425. [Google Scholar] [CrossRef]
- Nong, Duy, Paul Simshauser, and Duong Binh Nguyen. 2021. Greenhouse gas emissions vs CO2 emissions: Comparative analysis of a global carbon tax. Applied Energy 298: 117223. [Google Scholar] [CrossRef]
- Panait, Mirela. 2019. Approaches Regarding Environmental Kuznets Curve in the European Union from the Perspective of Sustainable Development. Applied Ecology and Environmental Research 17: 6801–20. [Google Scholar] [CrossRef]
- Perino, Grischa. 2018. New EU ETS Phase 4 rules temporarily puncture waterbed. Nature Climate Change 8: 262–64. [Google Scholar] [CrossRef]
- Porter, Michael E., and Claas van der Linde. 1995. Toward a New Conception of the Environment-Competitiveness Relationship. Journal of Economic Perspectives 9: 97–118. [Google Scholar] [CrossRef]
- Pradhan, Basanta K., Joydeep Ghosh, Yun-Fei Yao, and Qiao-Mei Liang. 2017. Carbon pricing and terms of trade effects for China and India: A general equilibrium analysis. Economic Modelling 63: 60–74. [Google Scholar] [CrossRef]
- Schmalensee, Richard, and Robert N. Stavins. 2017. Lessons Learned from Three Decades of Experience with Cap and Trade. Review of Environmental Economics and Policy 11: 59–79. [Google Scholar] [CrossRef]
- Timperley, Jocelyn. 2019. The Carbon Brief Profile: India. Available online: https://www.carbonbrief.org/the-carbon-brief-profile-india (accessed on 13 June 2019).
- Tong, Yun, Rui Zhang, and Biao He. 2022. The Carbon Emission Reduction Effect of Tourism Economy and Its Formation Mechanism: An Empirical Study of China’s 92 Tourism-Dependent Cities. International Journal of Environmental Research and Public Health 19: 1824. [Google Scholar] [CrossRef]
- Tsao, Yu-Chung, Pei-Ling Lee, Chia-Hung Chen, and Zong-Wei Liao. 2017. Sustainable newsvendor models under trade credit. Journal of Cleaner Production 141: 1478–91. [Google Scholar] [CrossRef]
- Tvinnereim, Endre, and Michael Mehling. 2018. Carbon pricing and deep decarbonisation. Energy Policy 121: 185–89. [Google Scholar] [CrossRef]
- UK Gov. 2021. Participating in the UK ETS. Available online: https://www.gov.uk/government/publications/participating-in-the-uk-ets/participating-in-the-uk-ets (accessed on 26 May 2021).
- US EPA. 2022. Overview of Greenhouse Gases. Available online: https://www.epa.gov/ghgemissions/overview-greenhouse-gases (accessed on 26 May 2021).
- Vo, Anh The, Duc Hong Vo, and Quan Thai-Thuong Le. 2019. CO2 Emissions, Energy Consumption, and Economic Growth: New Evidence in the ASEAN Countries. Journal of Risk and Financial Management 12: 145. [Google Scholar] [CrossRef]
- Weber, Juliane, Heidi Ursula Heinrichs, Bastian Gillessen, Diana Schumann, Jonas Hörsch, Tom Brown, and Dirk Witthaut. 2019. Counter-intuitive behaviour of energy system models under CO2 caps and prices. Energy 170: 22–30. [Google Scholar] [CrossRef]
- Wittneben, Bettina B. F. 2009. Exxon is right: Let us re-examine our choice for a cap-and-trade system over a carbon tax. Energy Policy 37: 2462–64. [Google Scholar] [CrossRef]
- World Bank. 2021a. DataBank-The World Bank. Available online: https://databank.worldbank.org/home.aspx (accessed on 21 May 2021).
- World Bank. 2021b. Putting a Price on Carbon with a Tax. Available online: https://www.worldbank.org/content/dam/Worldbank/document/SDN/background-note_carbon-tax.pdf (accessed on 2 January 2021).
| Accept | Reject | Grand Total | |
|---|---|---|---|
| Carbon Tax does not Granger cause CO2 emissions | 9 | 8 | 17 |
| Carbon Tax does not Granger cause GDP | 12 | 4 | 16 |
| CO2 emissions do not Granger cause GDP | 4 | 17 | 21 |
| CO2 emissions do not Granger cause Carbon tax | 14 | 3 | 17 |
| GDP does not Granger causes carbon tax | 15 | 15 | |
| GDP does not Granger cause CO2 emissions | 15 | 6 | 21 |
| GDP does not Granger cause Population | 17 | 4 | 21 |
| Population does not Granger cause GDP | 17 | 4 | 21 |
| Variables | Pooled OLS | Static Panel Data Estimation | |
|---|---|---|---|
| Fixed Effects | Random Effects | ||
| Ln(CO2) | 0.676 (3.32) *** | 0.582 (4.54) *** | 0.589 (5.12) *** |
| CT | 4.851 (7.62) *** | 1.477 (3.41) *** | 1.495 (3.49) *** |
| (Interact CO2) × (CT) | −0.415 (−7.30) *** | −0.106 (−3.12) ** | −0.108 (−3.91) *** |
| Ln(P) | 0.162 (5.27) *** | 0.193 (4.58) *** | 0.193 (4.52) *** |
| RDI | 0.252 (9.92) *** | 0.108 (5.39) *** | 0.109 (5.41) *** |
| Constant | 15.762 (13.35) *** | 16.445 (12.71) *** | 16.377 (14.94) *** |
| No. of observations | 626 | 626 | 626 |
| F Statistics/Wald Χ2 | 931.699 *** | 41.88 *** | 245.92 *** |
| R2 | 0.788 | 0.762 | 0.762 |
| Hausman Test | Χ2 = 3.14, Prob > chi square = 0.542 (RE chosen over FE) | ||
| B-P LM test for random effects | Χ2 (01) = 0.01 Pr > χ2: 0.461 (Pool OLS have chosen over RE) | ||
Publisher’s Note: MDPI stays neutral with regard to jurisdictional claims in published maps and institutional affiliations. |
© 2022 by the authors. Licensee MDPI, Basel, Switzerland. This article is an open access article distributed under the terms and conditions of the Creative Commons Attribution (CC BY) license (https://creativecommons.org/licenses/by/4.0/).
Share and Cite
Gurtu, A.; Vyas, V.; Gurtu, A. Emissions Reduction Policies and Their Effects on Economy. J. Risk Financial Manag. 2022, 15, 404. https://doi.org/10.3390/jrfm15090404
Gurtu A, Vyas V, Gurtu A. Emissions Reduction Policies and Their Effects on Economy. Journal of Risk and Financial Management. 2022; 15(9):404. https://doi.org/10.3390/jrfm15090404
Chicago/Turabian StyleGurtu, Apoorva, Vidhisha Vyas, and Amulya Gurtu. 2022. "Emissions Reduction Policies and Their Effects on Economy" Journal of Risk and Financial Management 15, no. 9: 404. https://doi.org/10.3390/jrfm15090404
APA StyleGurtu, A., Vyas, V., & Gurtu, A. (2022). Emissions Reduction Policies and Their Effects on Economy. Journal of Risk and Financial Management, 15(9), 404. https://doi.org/10.3390/jrfm15090404